Article

On the Morphological Evolution with Cycling of a Ball-Milled Si Slag-Based Electrode for Li-Ion Batteries

1
Institut National de la Recherche Scientifique (INRS)—Centre Énergie, Matériaux, Télécommunications (EMT), Varennes, QC J3X 1P7, Canada
2
UMR 5819 UGA-CNRS-CEA-Grenoble INP, 38054 Grenoble CEDEX 9, France
3
INSA Lyon, MATEIS, CNRS UMR 5510, 69621 Villeurbanne, France
4
ESRF—The European Synchrotron, ID 31 Beamline, 38043 Grenoble, France
*
Author to whom correspondence should be addressed.
These authors contributed equally to this work.
Batteries 2025, 11(4), 151; https://doi.org/10.3390/batteries11040151
Submission received: 6 March 2025 / Revised: 3 April 2025 / Accepted: 6 April 2025 / Published: 11 April 2025

Abstract

:
A Si/SiC/SiO2 (53/44/3 wt.%) composite is evaluated as an anode material for Li-ion batteries. This material, a result of the high-energy ball-milling of a by-product of the carbothermal reduction of silica (Si slag), is predominantly made up of micrometric particles of amorphous or short-range order Si in which submicrometric SiC inclusions are dispersed. Its capacity is 860 mAh g−1 (1.7 mAh cm−2) after 200 cycles in half-cell configuration and 1.6 mAh cm−2 after 70 cycles in full-cell. The SiC component is not electroactive for lithiation but plays a key role in the electrode stability by preventing the formation of the c-Li15Si4 phase, known to accelerate electrode degradation. It is shown that capacity decay with cycling mainly originates from solid electrolyte interphase (SEI) growth rather than particle disconnections. Complementary wide angle X-ray scattering (WAXS) analyses confirm the SEI grows alongside cycling and allows for the highlighting of its major components, namely, Li2CO3 and LiF. The morphological evolution of the electrode upon cycling is studied by electrochemical dilatometry, operando optical microscopy, and focused ion beam (FIB) and broad ion beam (BIB) scanning electron microscopy (SEM). No particle cracking is observed. However, reconstructed 3D imaging of the electrodes before and after 10 and 200 cycles clearly shows that the particles progressively evolve a dendritic structure. The SEI grows on and within the particles and induces a significant decrease in the electrode’s porosity and an increase in its thickness.

Graphical Abstract

1. Introduction

Due to its unique properties and versatility, silicon is considered a critical raw material for various modern technologies such as semiconductors, photovoltaic cells, and optical components. Silicon is also becoming increasingly important in battery technology as it can store up to ten times more lithium ions by weight than graphite, which is traditionally used in Li-ion battery anodes [1]. The development of economical, sustainable, and eco-friendly methods for producing silicon is crucial to market acceptance.
Silicon is mainly produced via a reduction of silica in the presence of carbon in an arc furnace around 2000 °C, resulting in metallurgical-grade silicon (98–99% purity). To obtain higher-purity silicon such as solar-grade silicon (6–7N), complex and costly chemical and/or metallurgical refining processes are required. It is, however, possible to reduce silica to silicon and remove impurities in a single step by using a vacuum arc furnace to rapidly vaporize impurities [2]. This process also generates a by-product (Si slag) consisting of a mixture of Si, SiC, and C. Due to the high energy consumption of the silicon production process, this by-product represents a considerable loss of energy and material.
In our previous study [3], it was demonstrated that after an appropriate high-energy ball-milling treatment, this waste can be valorized as high-capacity LiB anode material with a specific capacity 3–4 times greater than that of a conventional graphite-based anode. It was suggested that the presence of SiC inclusions in this material would prevent the deleterious formation of c-Li15Si4 phase and limit the morphological degradation of the electrode upon cycling. To clarify this point, an in-depth analysis of this anode material is performed hereafter. For that purpose, its morphological and structural evolution with cycling is characterized from the electrode to the particle/SEI scale using complementary analytical tools, including electrochemical dilatometry, operando optical microscopy, and WAXS and SEM image-based 2D and reconstructed 3D observations. This study is also in line with the interest and research efforts focused on Si/SiC-based anodes. An overview of the literature on Si-SiC composites as anode materials for Li-ion batteries is given in the Supporting Information. In summary, work has regularly been published on Si/SiC or Si/SiC/C composite anodes produced by various techniques (mechanical milling, vapor deposition, heat treatments, etc.). The SiC is in the form of nanoinclusions incorporated in a Si matrix [4,5,6,7,8] or conversely a SiC matrix incorporating Si nanoinclusions [7], or as outer [9,10] or inner layers [11,12,13,14,15,16,17] within various Si-based objects (nanowires [18], nanotubes [19], nanofibers [20], nanoparticles and nanoporous particles [14], thin films [20], etc.). SiC is mainly seen as a mechanical reinforcement and/or structuring matrix that buffers the volume expansion of Si and limits its fracturing [6,7,9,12,13,18,20] as a bonding agent between Si and an outer carbon layer [6,11,12,14,15,16,21] or as a protective layer limiting the growth of the SEI [5,11,13,18,21]. In the present study, it will be shown that the presence of SiC in a ball-milled Si slag electrode effectively prevents particle cracking upon cycling. However, a progressive roughening/porosification of the particles is observed during prolonged cycling. This exacerbates SEI growth on and within the particles and affects the electrochemical and mechanical stability of the electrode.

2. Materials and Methods

2.1. Materials

Si slag powder, by-product of the carbothermic reduction process of quartz in high purity silicon using a vacuum electric arc furnace [2], was provided by HPQ Silicon Resources (Montréal, QC, Canada). As described in ref. [3], the Si slag was ball-milled under argon atmosphere for 20 h using a SPEX 8000 (Metuchen, NJ, USA) vibratory mixer before being used as anode material. The composition of the ball-milled Si slag was 53 wt.% Si, 44 wt.% SiC, and 3 wt.% SiO2. Graphene nanoplatelets (GnP) (M15 grade from XGSciences, Lansing, MI, USA) were used as the conductive additive. Carboxymethyl cellulose (CMC) (DS = 0.7, Mw = 90,000 g mol−1, Sigma-Aldrich, Oakville, ON, Canada) was used as the binder. Citric acid (99.5+%, Alfa Aesar, Ward Hill, MA, USA) and KOH salts (85+%, Alfa Aesar, Ward Hill, MA, USA) were used to prepare a pH 3 buffer solution (0.17 M citric acid + 0.07 M KOH) that served as the slurry dispersion medium. The use of a pH 3 buffer solution instead of neutral water as the slurry medium increases the efficiency of the CMC binder [22]. The electrolyte was 1 M LiPF6 in ethylene carbonate and dimethyl carbonate (1/1, v/v) with 10 wt.% fluoroethylene carbonate (Solvionic, Toulouse, France).

2.2. Electrode Preparation, Cell Assembling and Cycling

A slurry was prepared by mixing 160 mg of ball-milled Si slag (80 wt.%), 24 mg of GnP (12 wt.%), and 16 mg of CMC (8 wt.%) in 0.5 mL of pH 3 buffer solution. Slurry homogenization was performed using a Fritsch Pulverisette 7 planetary mixer (Fritsch, Idar-Oberstein, Germany) at 500 rpm for 1 h with three silicon nitride balls (9.5 mm diam.). The slurry was tape-cast on copper foil (25 µm thick, MTI) with a doctor blade. The blade gap was fixed to obtain electrodes with an areal mass loading around 2 mg of Si slag per cm2. The coating was dried at room temperature for 12 h. Electrodes were then punched (1 cm diam.) and dried 2 h at 100 °C under vacuum (p ≈ 10 mbar). Citric acid and KOH salts were not eliminated by this vacuum treatment and thus contributed to the mass of the dried electrodes. The electrode composition was therefore 73 wt.% Si slag (i.e., 39 wt.% Si, 32 wt.% SiC, 2 wt.% SiO2), 11 wt.% GnP, 7 wt.% CMC, 8 wt.% citric acid, and 1 wt.% KOH.
The electrodes were mounted in two-electrode Swagelok® cells in an argon filled glove box. For half-cell cycling, the Si slag electrode was placed opposite a lithium metal electrode (1 mm thick, MTI) acting as a counter and reference electrode. For full-cell cycling, the counter electrode was an NCA (LiNi0.8Co0.15Al0.05O2) electrode (3.5 mAh cm−2) from Custom Cells. The negative-to-positive (n/p) capacity ratio was 1.1. The electrodes were separated with a borosilicate glass-fiber (Whatman GF/D) membrane soaked with 350 μL of electrolyte.
The electrodes were cycled using a Neware BTS4000 cycler (Neware, Shenzhen, China) at room temperature in galvanostatic mode. In half-cell, the electrode was cycled between 1 V and 5 mV vs. Li/Li+ at a current density of 180 mA g−1 of Si slag (0.36 mA cm−2) for the first 5 cycles and at 400 mA g−1 (0.80 mA cm−2) for the subsequent cycles. Full-cell cycling was performed between 2.7 and 4.2 V at a current density of 0.185 mA cm−2 for the first 5 cycles and 0.413 mA cm−2 for subsequent cycles. A minimum of 3 cells were tested to ensure the reproducibility of the cycling measurements.

2.3. Electrochemical Dilatometry

The thickness variation of the electrode upon cycling was measured using an electrochemical dilatometer (ECD-2 model from EL-CELL) as described in ref. [22]. The working electrode (1 cm diam.) is separated from the counter electrode (Li foil) by a stiff glass frit, which is fixed in position. The reference electrode is a Li wire placed near the working electrode. The working electrode is sealed by a thin metal membrane, which transmits any electrochemically-induced height change to the sensor/load unit on the top. A high-resolution displacement transducer detects dimensional changes ranging from ~50 nm up to 500 μm. The electrochemical cell was controlled by a VMP3 potentiostat/galvanostat (Bio-Logic, Pariset, France). The electrode was cycled between 1 V and 5 mV vs. Li/Li+ at a current density of 90 mA g−1 of Si slag for the first cycle, 180 mA g−1 for the next 5 cycles, and 360 mA g−1 for the last 4 cycles. The thickness variation of the working electrode was monitored continuously during cycling and is expressed in percent change of the initial thickness (excluding the Cu substrate) of the electrode measured (±1 μm) before cell assembly by using a digital micrometer (Mitutoyo, Kawasaki-shi, Japan).

2.4. Operando Optical Microscopy

The surface of the electrode was observed by operando optical microscopy using an ECC-Opto-Std optical test cell (EL-CELL, Hamburg, Germany) and a Reichert MEF4 M microscope (Reichert, Depew, NY, USA) with ×20 magnification, to which a Leica DFC320 camera (Leica, Wetzlar, Germany) was connected. Images were acquired using Image-Pro Plus 5.1 software. The electrode was observed for the first two cycles performed between 1 V and 5 mV vs. Li/Li+ at a current density of 360 mA g−1 of Si slag.

2.5. X-Ray Diffraction (XRD) and Wide-Angle X-Ray Scattering (WAXS)

XRD analyses were performed using a Bruker D8 Advance diffractometer (Bruker, Billerica, MA, USA) (Cu Kα radiation λ = 0.15418 nm).
Synchrotron WAXS measurements were performed at the ID31 beamline at ESRF in Grenoble, France. Powder samples scratched off their copper current collectors and gently ground were placed and sealed into 1 mm ID quartz capillaries in an Ar-filled glovebox. The as-prepared samples were further illuminated with a pencil beam (0.5 mm × 0.1 mm) with an energy of 75 keV (λ = 0.166 Å) at 0.1% of the bandwidth, and a photon flux of 7 × 10¹¹ ph s−1 in a Debye-Scherrer geometry. Data were collected over a 5 s exposure time on a Pilatus 2M CdTe detector (Dectris, Baden-Daettwil, Switzerland) placed at 1.2 m from the sample. The raw detector images are azimuthally integrated using the pyFAI package, and the data analysis is performed using GSAS-II software.

2.6. Scanning Electron Microscopy (SEM)

2.6.1. Two-Dimensional BIB-SEM Analyses

Cross-section polishing of the electrodes at the pristine state and after 1, 10, and 200 cycles was realized through Broad Ion Beam (BIB) milling of precut samples using a BIB Ilion 2 (697) from Gatan Inc. (Pleasanton, CA, USA). To minimize sample damage, curtaining effect as well as eventual amorphization, a three-step procedure has been applied with a first step of 4 h of polishing with a 5 kV Ar-ions beam energy, followed by two gentler steps of 1 h at 2 then 0.5 kV. Scanning electron microscopy (SEM) acquisitions have been performed in Back Scattered Electron (BSE) mode to enhance the contrast between the different observed material phases thanks to a Supra 55VP microscope from Zeiss Microscopy GmbH (Oberkochen, Germany) equipped with a 80 mm2 EDX detector from Oxford Instrument (Oxfordshire, UK). Samples were transferred from the Ion Polisher to the microscope thanks to a transfer chamber developed in-house.
Electron backscatter diffraction (EBSD) mapping was performed on the pristine electrode with an Oxford/Symmetry EBSD system at an accelerating voltage of 7 kV, a probe current of 3 nA, with a step of 40 nm, and an acquisition speed of 18.8 Hz.

2.6.2. Three-Dimensional FIB-SEM Analyses

Complementary 3D reconstructed images were obtained through focused ion beam (FIB) and SEM imaging for the pristine and end of the 10th and 200th cycle electrodes thanks to an FIB-SEM NVision 40 (Zeiss) station composed of a Gemini I (for electron) and a SIINT Zeta Ga+ (for ions) column. For all samples, the final reconstructed volume size was of 5.7 × 4 × 3 µm3 with an isotropic voxel size of 5 × 5 × 5 nm3. A carbon-coating protective layer was deposited on top of the electrode to minimize curtaining artifacts and sample damage using a gas injection system (GIS) from Seiko Instruments Inc. NanoTechnology (Chiba, Japan), along with three W lines that were further used for image registration and 3D stack alignment. Subsequently, a 20 µm deep cavity was obtained with a high ion current of 27 nA (30 kV), followed by high precision sectioning at a reduced current (700 pA, 30 kV) for 5 nm incremental steps. Images were acquired in BSE mode with a 1.5 kV acceleration voltage at a 5 mm working distance. The total acquisition time was 20 h per sample.
The 3D image post-processing and quantitative analyses were performed using the ImageJ software version 1.54p [23]. The so-obtained stacks were first corrected for lateral drift during the acquisition by registering the images thanks to the W reference lines. The Enhanced Local Contrast algorithm (CLAHE) was used for correcting the shadowing artifacts due to the sample geometry and abrasion process. Draping effects were corrected in Fiji using the Variational model for Stationary Noise Removal (VSNR) plugin [24]. Image segmentation was carried out using the open-source software Ilsatik, version 1.4.0 [25] based on the random forest machine learning method [26]. Subsequently, quantification analyses allowed us to retrieve the different volume fractions of the pore, Si, SiC, binder, and SEI phases, as well as their local thickness distributions.

2.7. Transmission Electron Microscopy (TEM)

A thin lamella sample (~200 nm) was extracted from a large secondary particle of the pristine electrode using the FIB-SEM apparatus. High-resolution images were acquired on a JEOL JEM-2010 FEG transmission microscope (Tokyo, Japan) operated at 200 kV and equipped with a HAADF detector. The ring simulation and attribution was carried out based on Klinger et al.’s work [27].

3. Results and Discussion

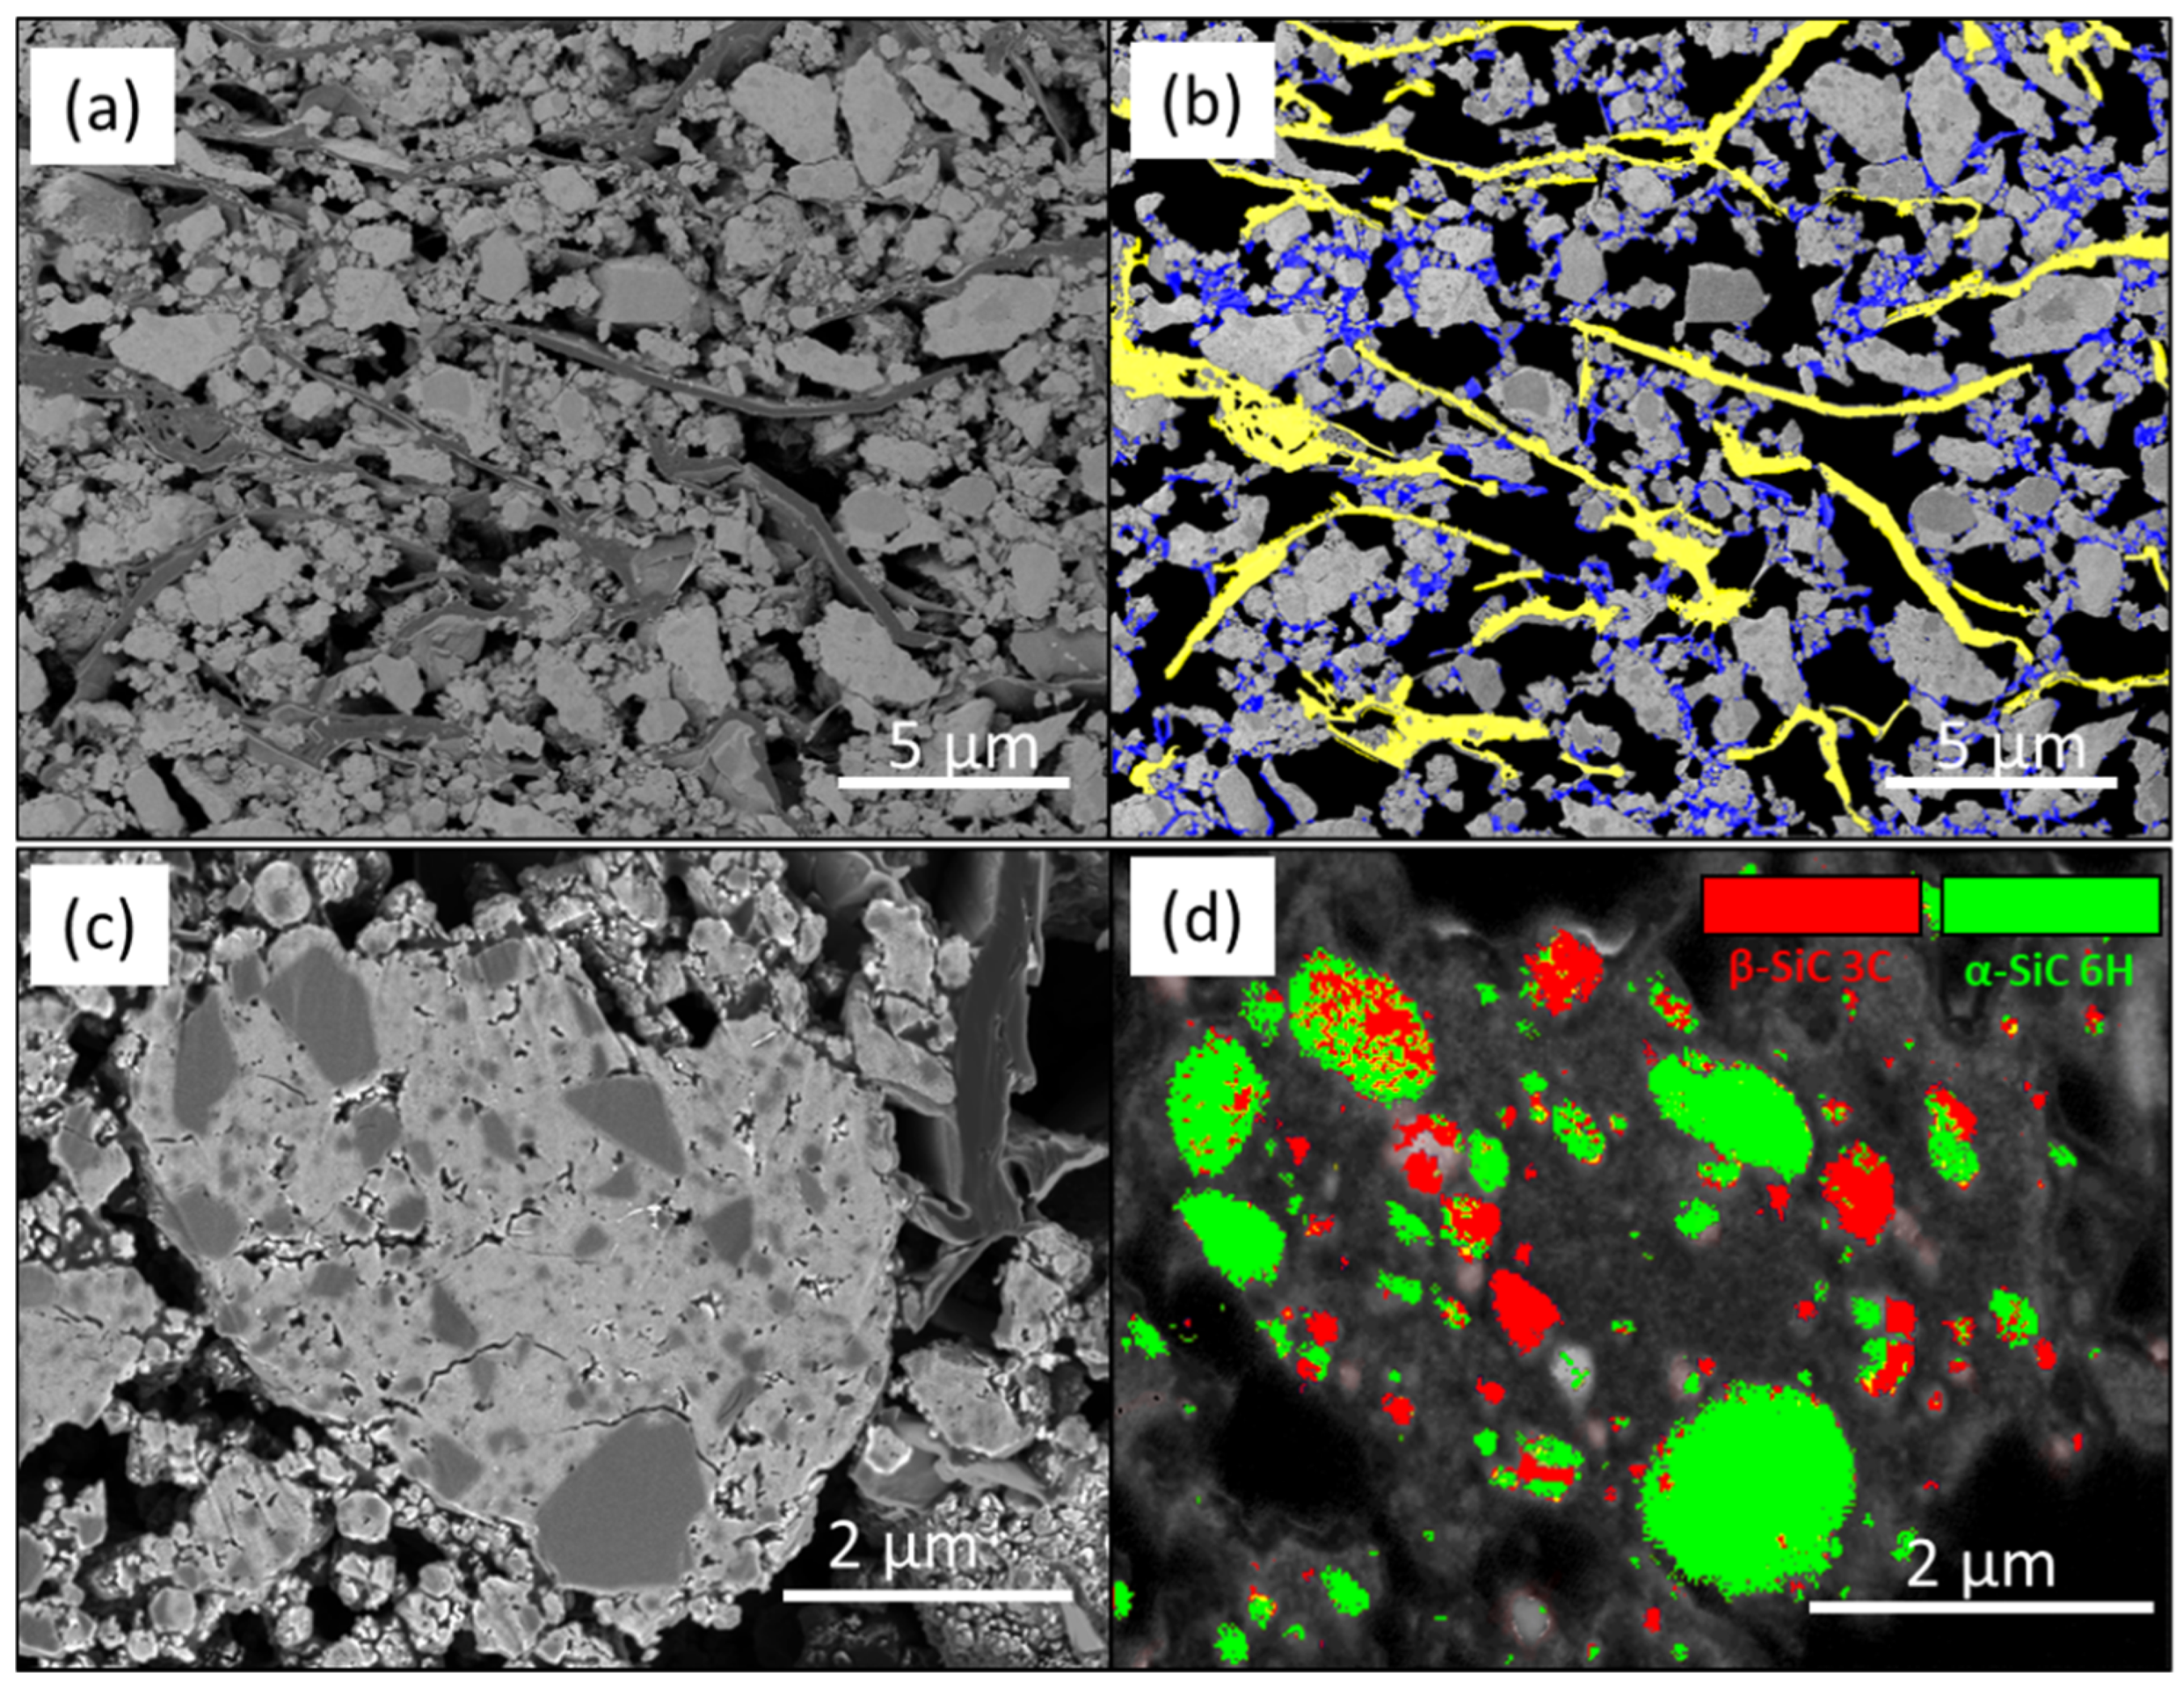
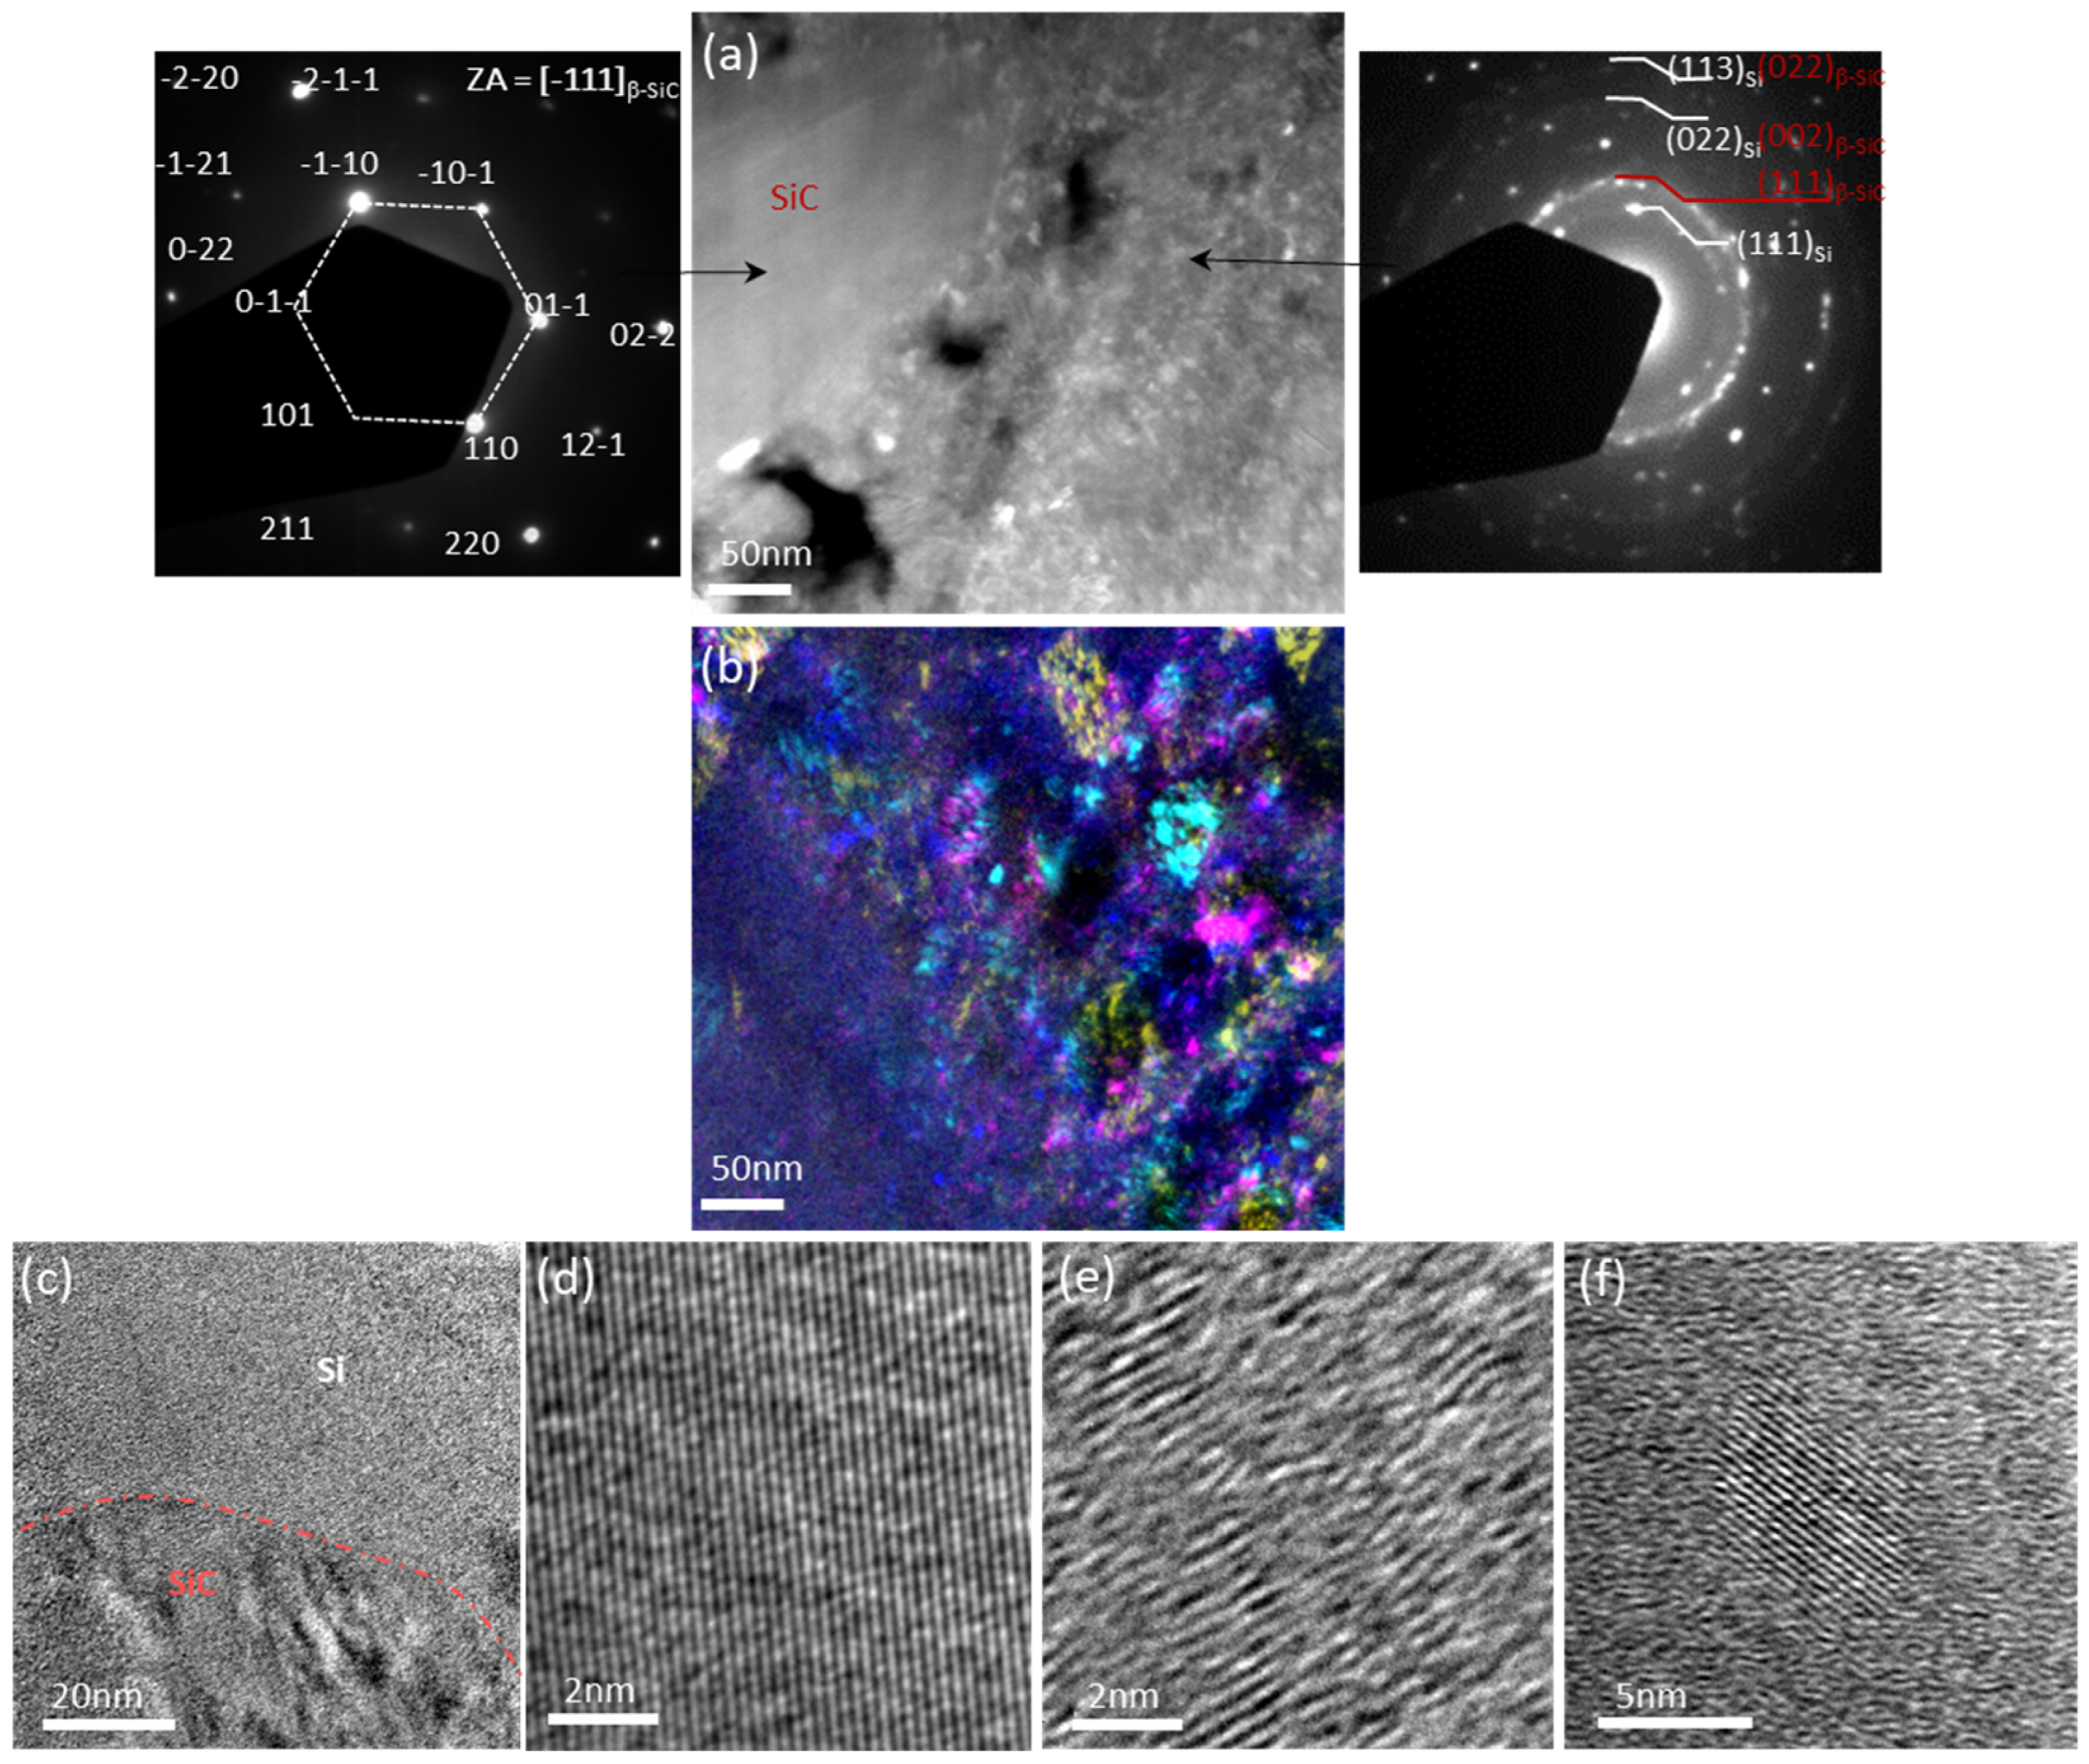
3.1. Microstructure of the Pristine Electrode

Figure 1a shows an SEM image in BSE mode of the BIB-polished cross-section of the pristine electrode. Ion polishing enables the elements present in the electrode to be observed with excellent resolution. The image can then be segmented as shown in Figure 1b. The conductive additive consisting of stacks of graphene sheets (~5–10 μm long and ~0.1–1 μm thick) is highlighted in yellow, while the CMC binder making the connection between the Si slag particles is highlighted in blue. Both are homogeneously dispersed in the electrode. The silicon slag particles made up of Si (light gray) and SiC (darker gray) are irregular in shape and typically range in size from about 0.2 to 5 μm. Figure 1c focuses on a Si slag particle where SiC inclusions of various sizes (~0.1–1 μm) are clearly visible. The electron backscatter diffraction (EBSD) mapping of this same particle (Figure 1d) reveals that both α-SiC (in green) and β-SiC (in red) are present and can coexist in one SiC inclusion. Note that complementary energy dispersive X-ray spectroscopy (EDS) mapping images of the Si slag material are shown in [3]. A few cracks are also observed in the Si slag particle, resulting from the partial cold welding of the particles during high-energy ball-milling.
To further analyze its microstructure, TEM observations were carried out on Si slag particles as shown in Figure 2a–f. The TEM image (Figure 2a) with the associated diffraction patterns of a SiC zone (on left) and a Si-rich zone (on right) indicate that crystallized phases exist in both zones. Figure 2b shows a color TEM image, which is the result of merging four dark-field images of the same area using a selection of different diffracted waves. The presence of bright zones throughout the image highlights the presence of randomly distributed diffracting zones of varying size. This confirms that crystallized nanodomains of Si and SiC exist in the Si slag powder. Figure 2c shows a Si-rich zone at the top and a SiC-rich zone at the bottom of the image. The interface between the two domains is not perfectly defined, but sufficiently so that both domains are discernible. This shows that SiC and Si domains coexist in the same particle, but that the interface between these domains is not always well defined. Figure 2d focuses on the SiC zone. Its crystal structure is perfectly defined, the orientation of the atomic planes along the (111) direction is clearly visible, and the interplanar distance d111 can be determined as close to 2.52 Å, in agreement with the theoretical value of 2.516 Å calculated from the lattice constant of β-SiC (a = 4.358 Å, JCPDS 01-0787). Figure 2e shows a Si zone where some atomic planes are also visible but appear to be distorted. Figure 2f shows an ordered Si crystallite with an interplanar distance d111 = 3.14 Å in agreement with the theoretical value of 3.136 Å calculated from the lattice constant of cubic Si (JCPDS 00-027-1402). This Si crystallite of around 5 nm in size is embedded in a disordered Si matrix that may be assimilated to amorphous Si.
In accordance with previous studies on ball-milled Si powders [28,29], the relative amorphization degree of the Si phase was estimated by fitting the Si (111) peak situated at 2θ ≈ 28.5° from the XRD pattern of the Si slag powder, as shown in Figure 3. The peaks in the 33–40° zone are related to the α and β SiC phases. The Si (111) peak was fit using Gaussian peak function for both the crystalline phase (c-Si, blue curve) and the amorphous one (a-Si, green curve). By calculating the integral intensity of c-Si and a-Si curves, the amorphization degree of the Si phase is estimated at 74%. Note that a similar result was obtained by also integrating the Si (220) peak at 47° and the Si (311) peak at 56°. By applying the Scherrer equation to the c-Si (111) peak, the size of the Si crystallite is estimated at 13 nm.

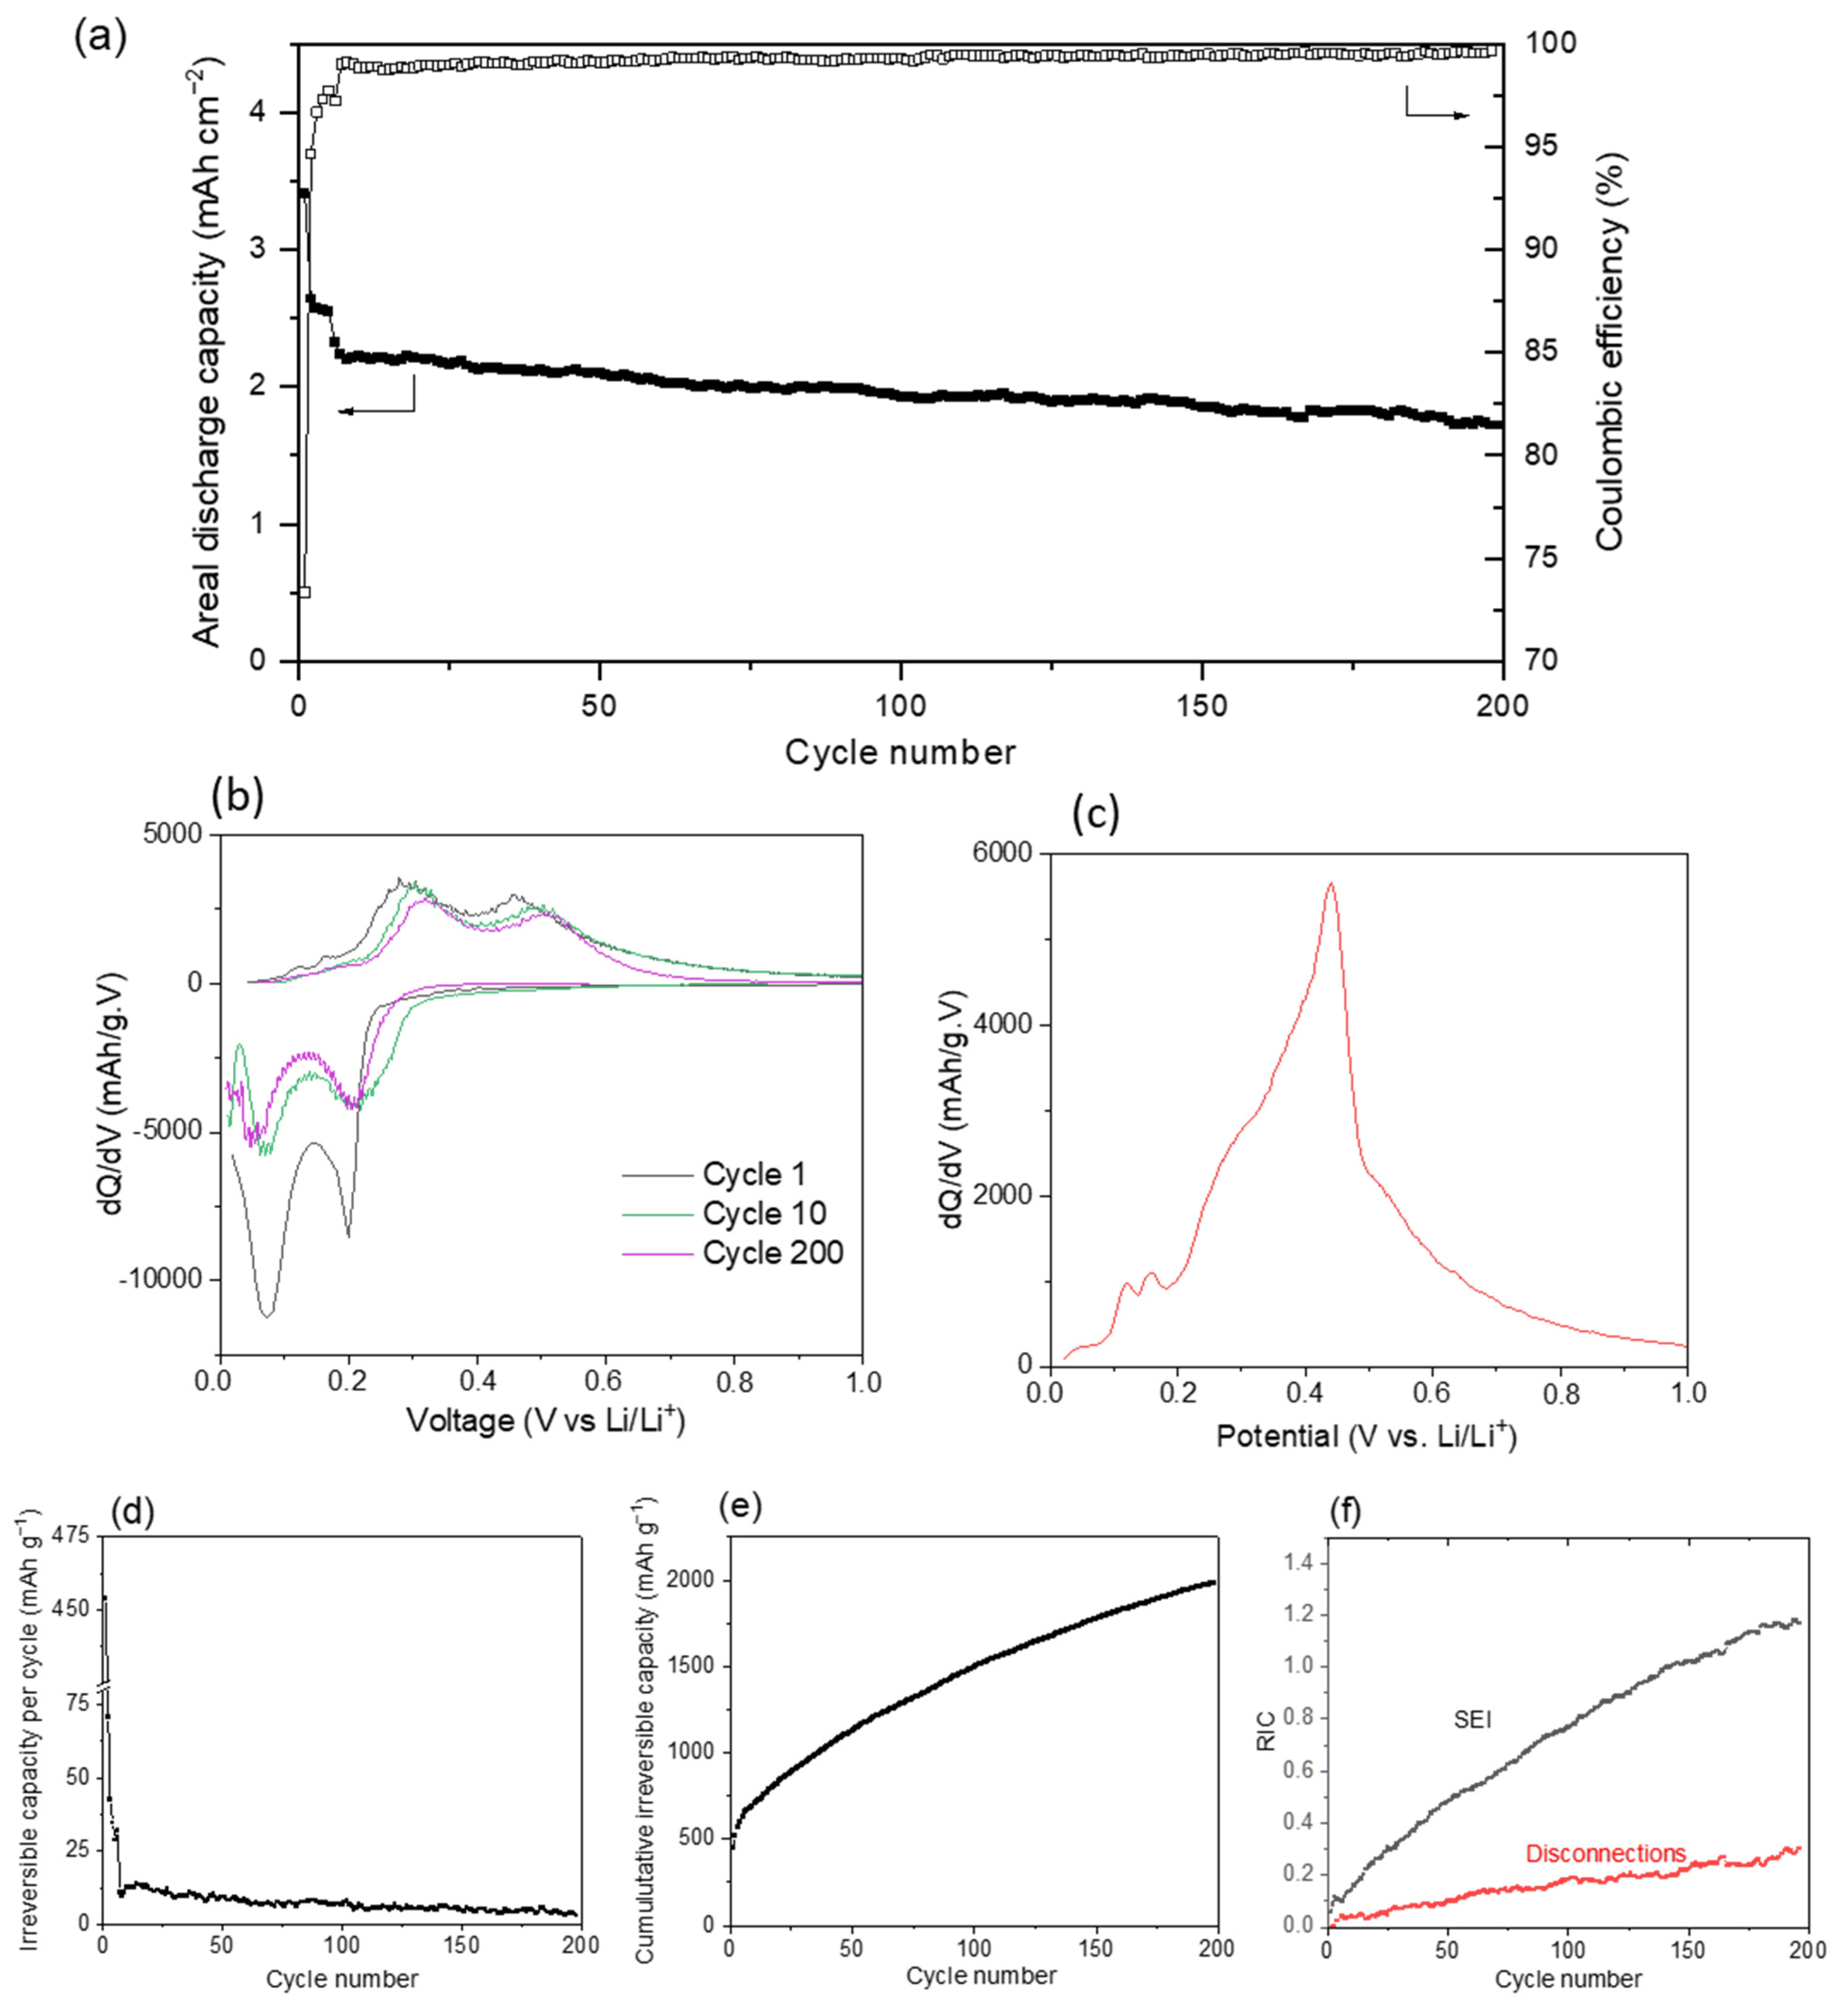
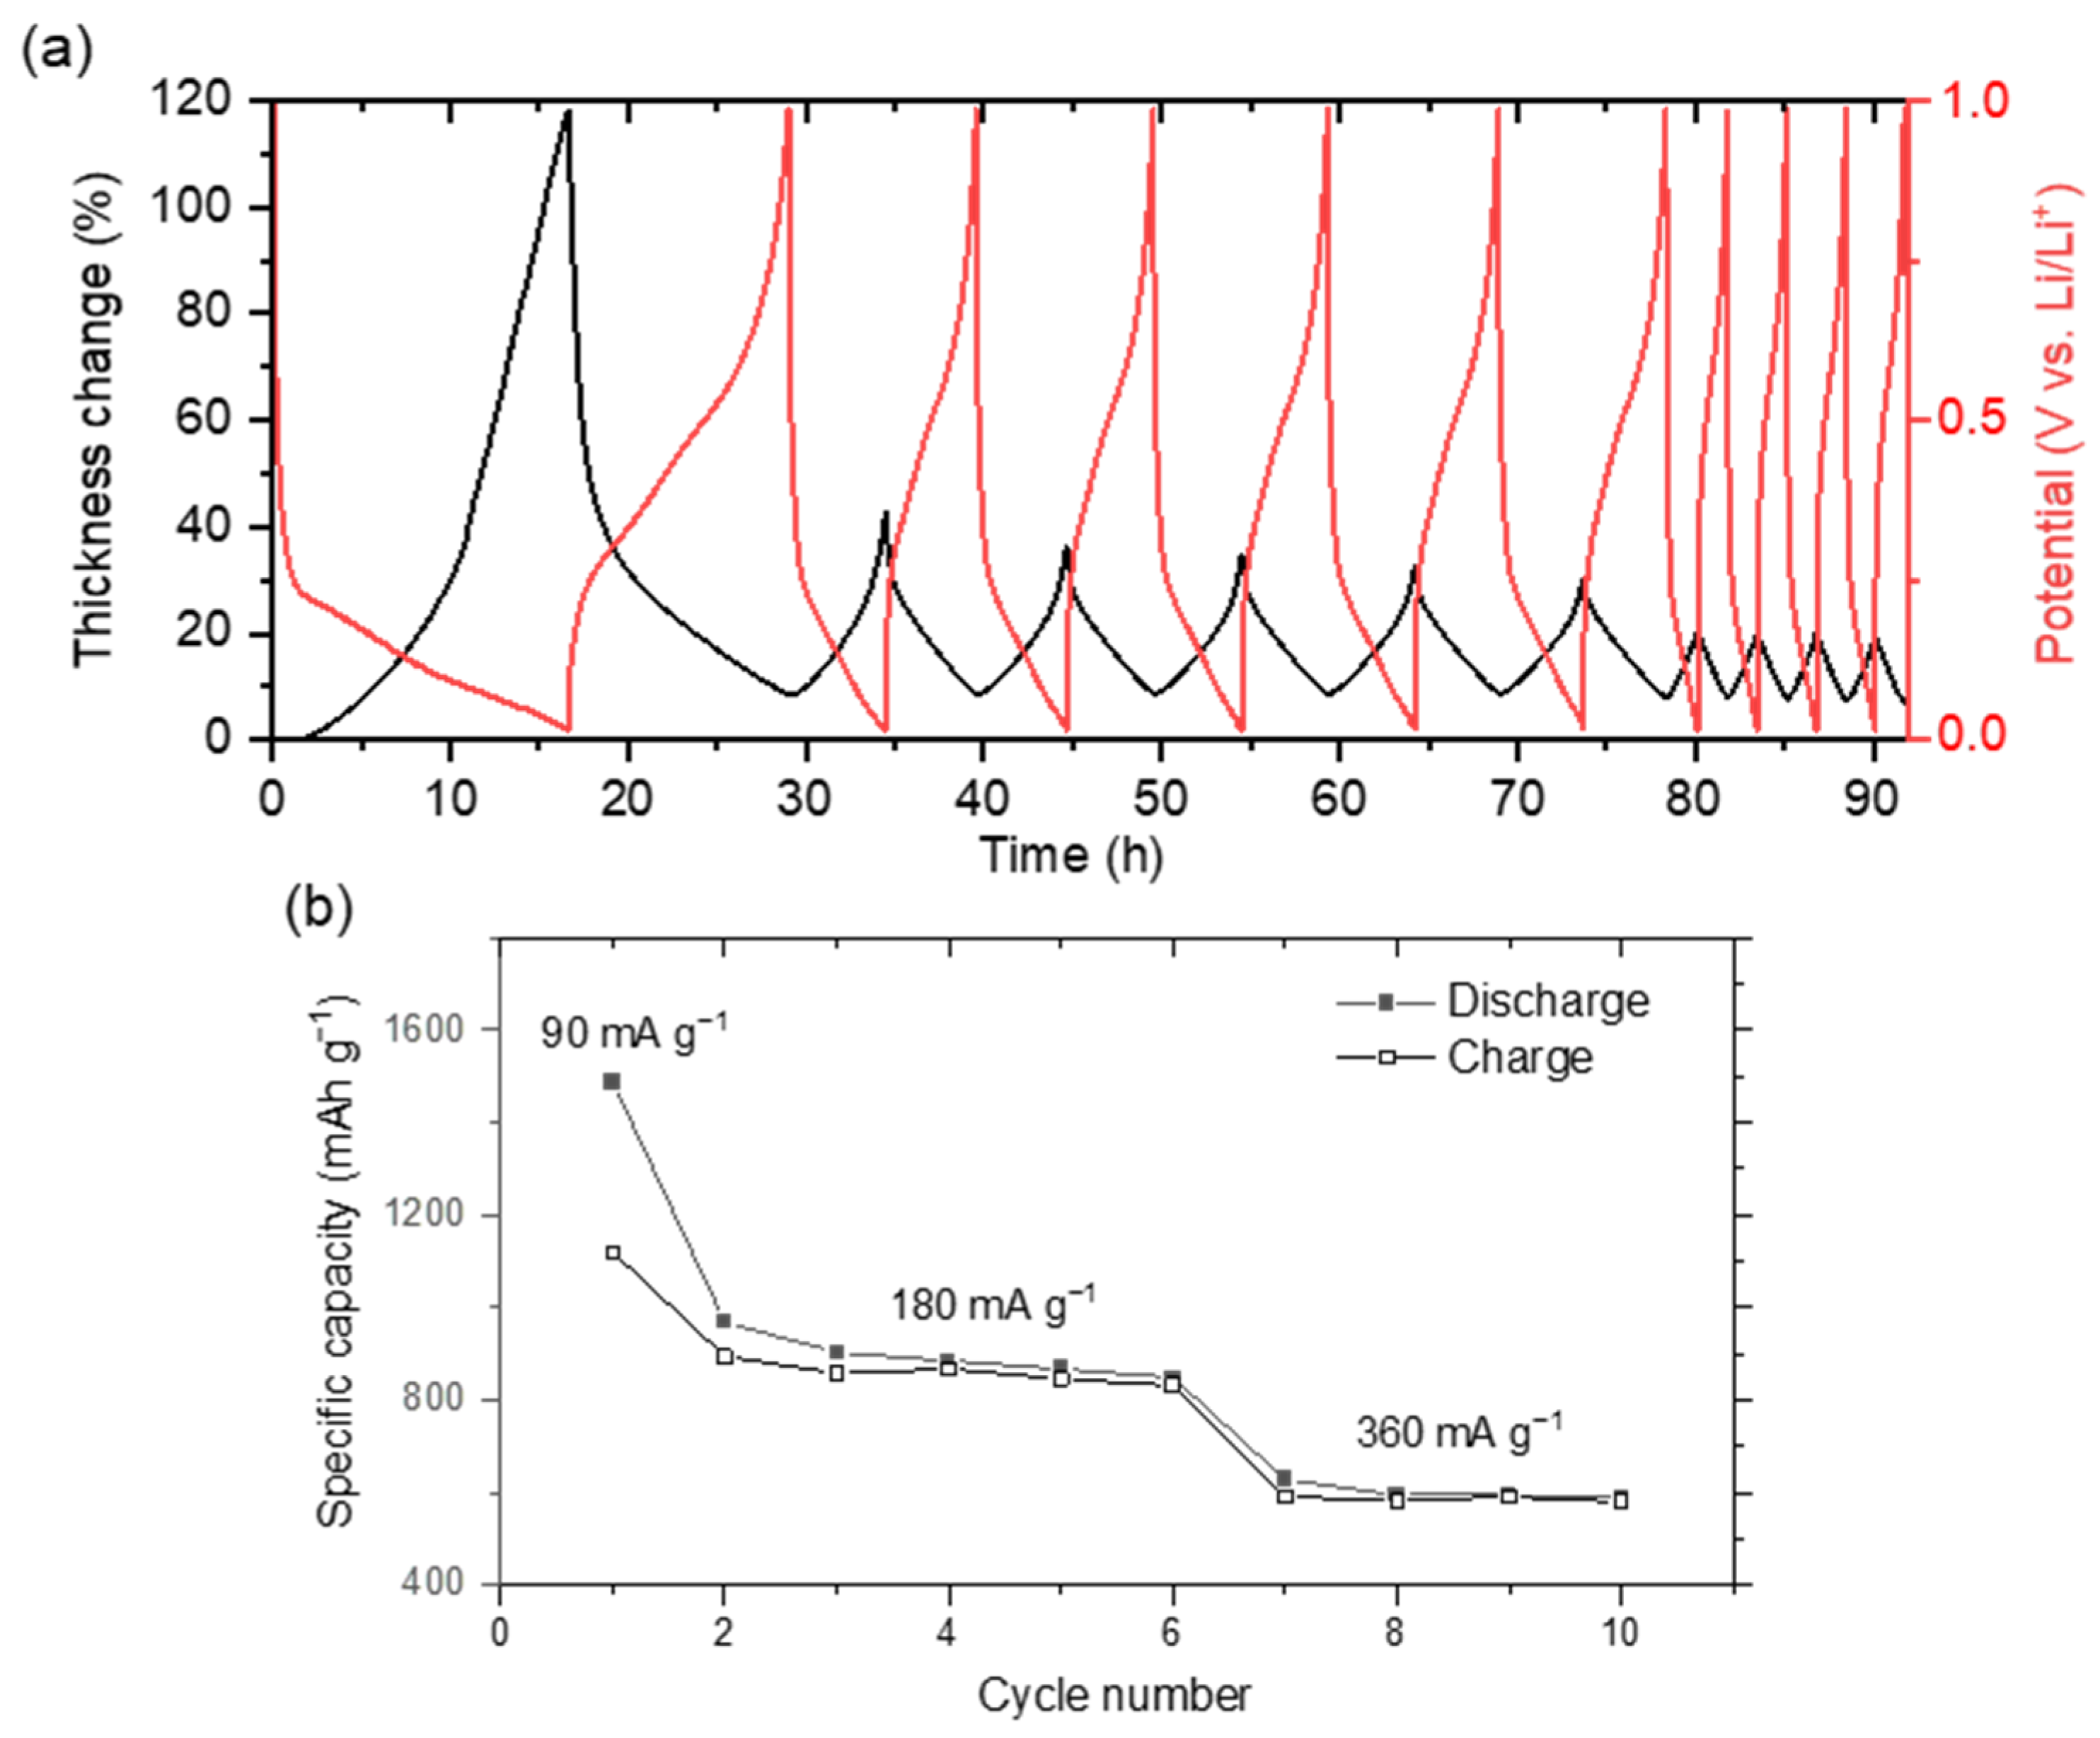
3.2. Electrochemical Performance

Figure 4a shows the cycling performance of the Si slag electrode (2 mg Si slag cm−2). Its initial discharge capacity is 3.4 mAh cm−2 (1700 mAh g−1 Si slag). Considering that the Si content in the Si slag is 53 wt.% and that SiC is not electroactive for lithiation [30], the capacity originating from the Si phase lithiation can be estimated to be about 3200 mAh g−1 of Si, which is not very far from its theoretical capacity (3579 mAh g−1). This means that most of the Si component in the electrode is electrochemically accessible/active. However, the initial coulombic efficiency is low (73.2%). SEI formation and electrical disconnections may explain this irreversibility, as explained below. After the first cycle, capacity loss is much lower, with a discharge capacity decreasing from 2.64 mAh cm−2 (1320 mAh g−1) at the 2nd cycle to 1.72 mAh cm−2 (860 mAh g−1) at the 200th cycle while the coulombic efficiency rises from 94.6 to 99.7%. Note that the drop in capacity observed at the 6th cycle is due to the change in cycling rate (from 180 mA g−1 of Si slag for the first 5 cycles to 400 mA g−1 for subsequent cycles). Previous cycling experiments with incremental changes in current density have shown almost complete capacity recovery when switching from high current density (7.2 A g−1) back to low current density (0.4 A g−1) [3]. For comparison, the cycling test was also performed with a commercial Si powder (median diameter = 230 nm, produced by inductively coupled plasma, Tekna Inc., Kalamazoo, MI, USA) and using the same electrode preparation, cell assembling, and cycling procedures as for the Si slag electrode [3]. The commercial Si-based electrode displayed a much lower capacity retention than the Si slag electrode. Its areal discharge capacity after 100 cycles was only 0.6 mAh cm−2 compared to 2.1 mAh cm−2 for the Si slag electrode, corresponding to a capacity retention between the 6th and 100th cycle of 23% and 81%, respectively. This confirms the better structural resilience of the Si slag electrode.
Figure 4b shows the dQ/dV differential curves at cycles 1, 10, 50, and 200. These curves are characteristic of silicon lithiation/delithiation, with the presence of two cathodic peaks on discharge (lithiation) and two anodic peaks on charge (delithiation). However, unlike what is usually observed with Si-based electrodes [31], there is no intense/narrow anodic peak at ~0.45 V vs. Li/Li+, characteristic of delithiation of the c-Li15Si4 phase, suggesting that its formation is prevented here. This may be beneficial for the electrode’s cycling performance as the formation of the c-Li15Si4 phase is known to have a detrimental effect by accentuating particle fracturing because of the high mechanical stresses associated with the abrupt a-LixSi/c-Li15Si4 phase transition [32]. The formation of the c-Li15Si4 phase may be prevented by the presence of non-conductive SiC that increases the electrode polarization. As a result, the formation of the c-Li15Si4 phase, which usually takes place at around 50 mV vs. Li/Li, could be shifted a potential lower than the discharge cut-off potential (5 mV). In fact, the end-of-discharge potential of 5 mV must be maintained for 24 h to start seeing the c-Li15Si4 phase delithiation peak (see Figure 4c).
Figure 4d and Figure 4e show, respectively, the irreversible capacity per cycle and cumulated irreversible capacity as a function of the number of cycles. The irreversible capacity corresponds to the difference between discharge and charge capacity. The 1st cycle irreversible capacity is 454 mAh g−1. In subsequent cycles, the irreversible capacity per cycle is much lower and decreases progressively with the number of cycles (from 70 mAh g−1 at the 2nd cycle to 3 mAh g−1 at the 200th cycle), reaching a cumulative value of 1983 mAh g−1 after 200 cycles. The large initial irreversible capacity can mainly be explained by the initial SEI formation on the fresh surface of Si slag particles. Particle disconnection can also contribute to irreversible capacity. To more precisely evaluate the effect of these two components (i.e., SEI growth and particle disconnections) on the irreversible capacity, we used the same formulas as in the work of M. Gauthier et al. [33]. This calculation assumes that the SEI is formed/reformed mainly during discharge (lithiation) and that disconnections take place mainly during volume contraction of particles, i.e., during charge (delithiation) [34]. Based on these two postulates, the relative irreversible capacity (RIC) associated with the SEI and disconnections can be calculated according to the formulas:
R I C S E I = C D n + 1 C C n C C n + 1
R I C D I S C O N . = C C n C C n + 1 C C n + 1
with CCn representing the charge capacity at cycle n, CCn+1 representing the charge capacity at cycle n + 1, and CDn+1 representing the discharge capacity at cycle n + 1. Figure 4f shows the cumulative evolution of these two RIC components as a function of the number of cycles. From the 1st cycle to the 200th cycle, the RICSEI component is mainly responsible for irreversibility. Thus, after 200 cycles, 80% of irreversibility is associated with SEI formation and 20% with disconnections. The same calculation performed with a Si electrode shows an opposite trend, with irreversibility predominantly associated with disconnections [33]. This suggests that silicon carbide has a beneficial effect on the mechanical strength (particle cracking resistance) of the electrode.
The Si slag electrode was also evaluated in a full-cell configuration consisting of a Si slag negative electrode and an NCA positive electrode with an n/p ratio of 1.1. The n/p ratio was determined from their respective areal capacities measured at cycle 2 in half-cell, i.e., 3.67 mAh cm−2 (1505 mAh g−1 of Si slag) for the negative electrode and 3.50 mAh cm−2 (165 mAh g−1 of NCA) for the positive electrode (see Figure 5a and Figure 5b, respectively). As shown in Figure 5c,d, the initial charge and discharge capacities of the full-cell are 3.8 and 2.4 mAh cm−2, respectively, giving an initial coulombic efficiency of only 63%. This low coulombic efficiency is mainly due to the SEI formation on the negative electrode, whose initial coulombic efficiency measured in half-cell (Figure 5a) is 76.4%, inducing a loss of 1.1 mAh cm−2 (550 mAh g−1 Si slag), versus 85.4%, corresponding to a loss of 0.6 mAh cm−2 (27 mAh g−1 of NCA), for the positive electrode (Figure 5b). After 70 cycles, the full cell’s areal capacity is 1.6 mAh cm−2, its coulombic efficiency is ~99.5% and its capacity loss stabilizes at around 0.4% per cycle. These performances are promising but remain insufficient for commercial application. It should be noted that the n/p ratio [35], the potential window [36], the cathode composition [37], and the anode pre-lithiation [38] can also have a significant impact on cell performance and need to be optimized.

3.3. Microstructural and Morphological Evolution of the Electrode During Cycling

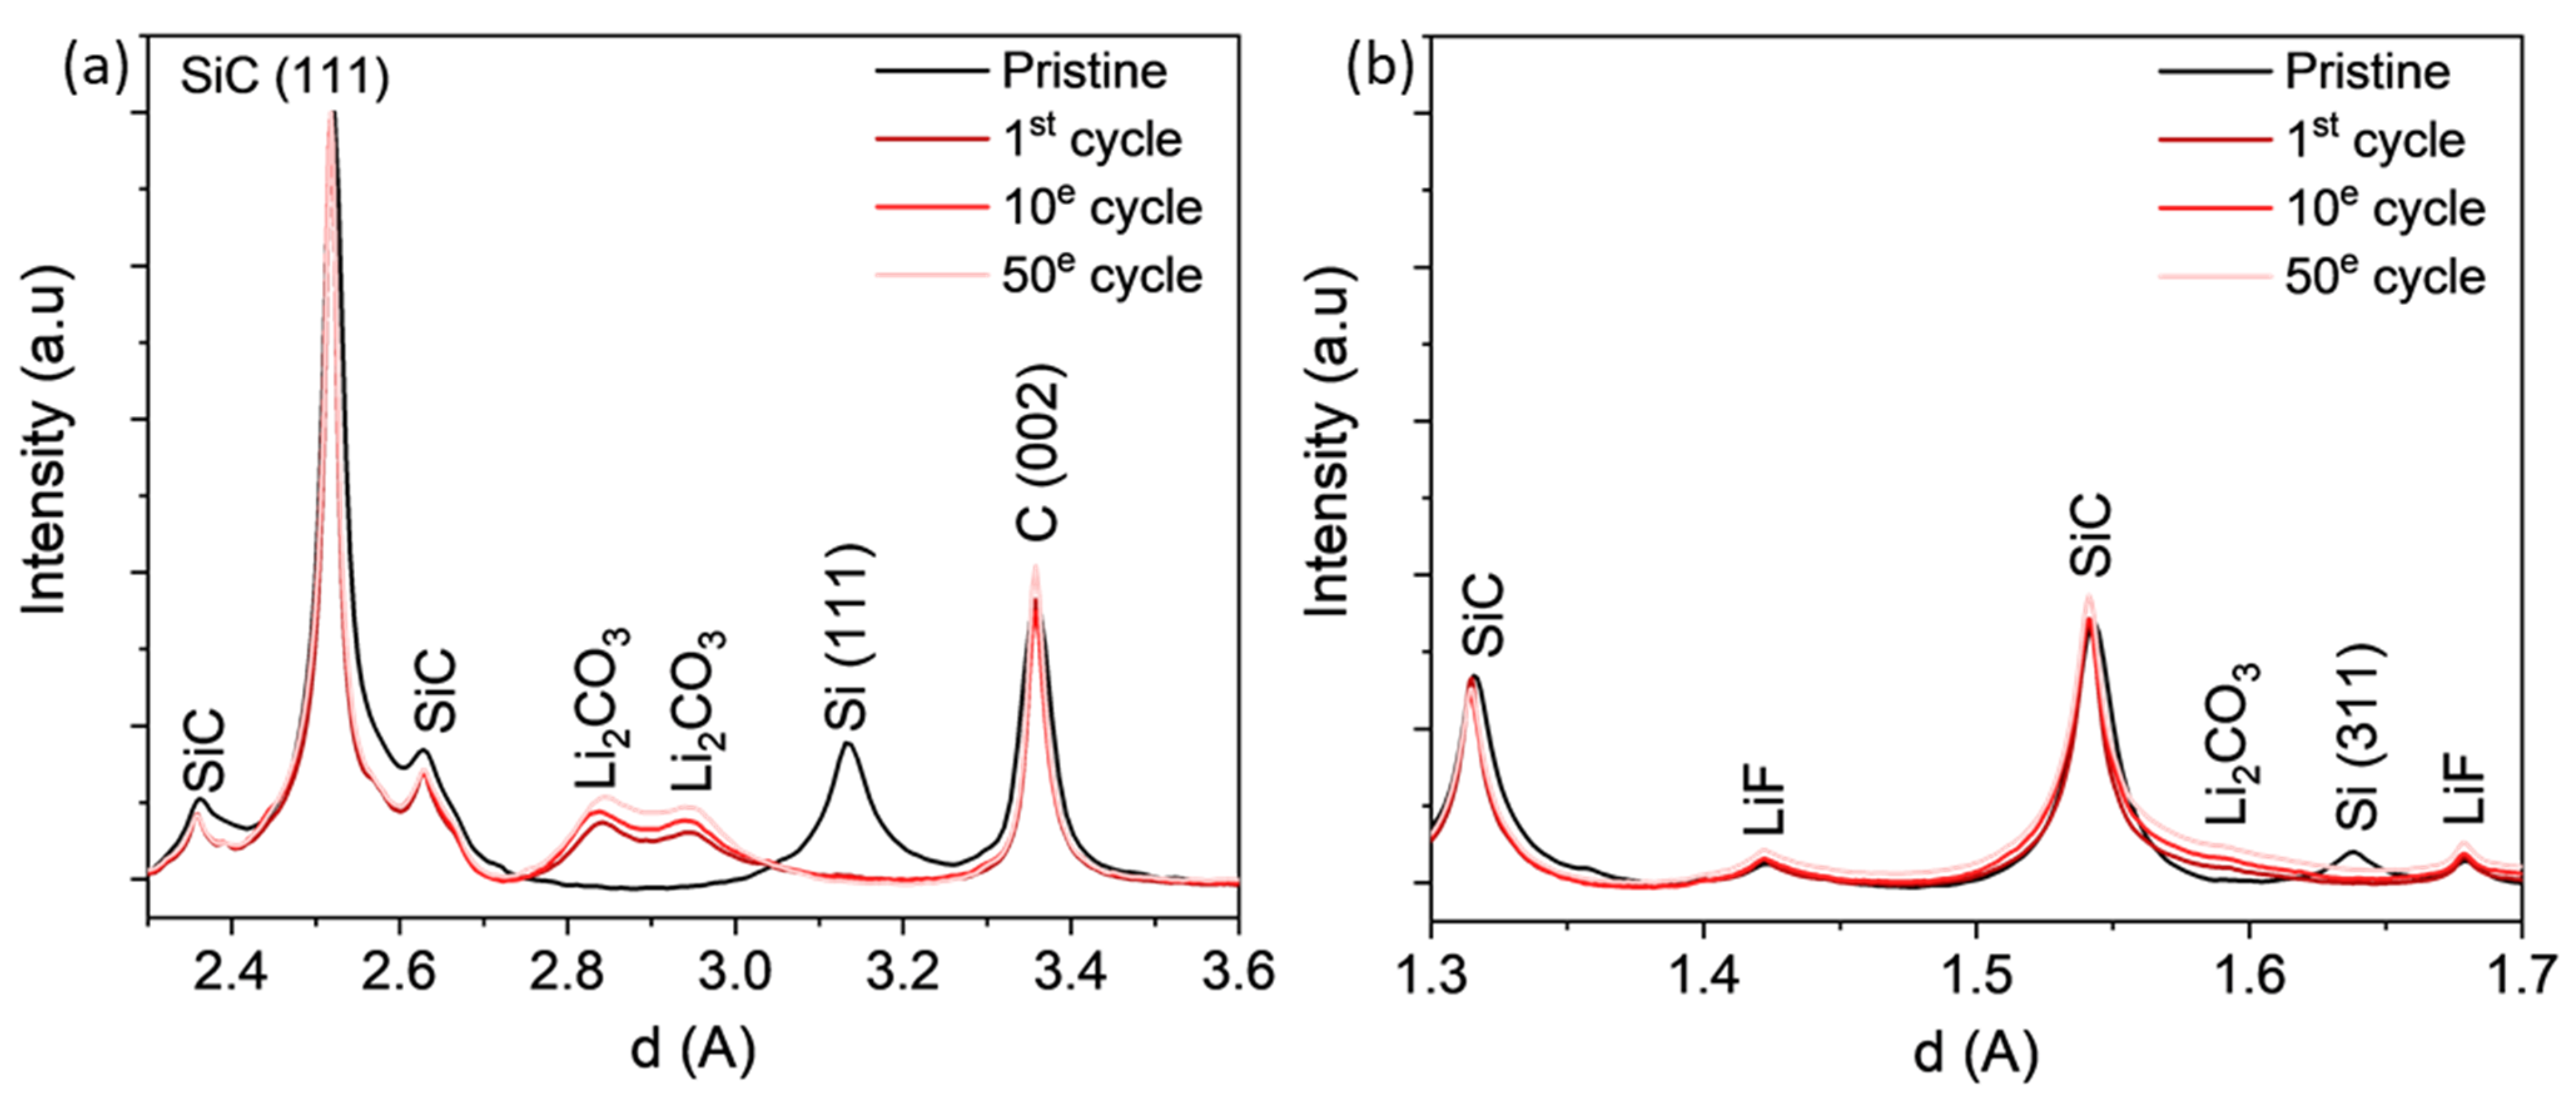
3.3.1. WAXS Analysis

WAXS measurements were carried out on the Si slag electrode before cycling and after 1, 10, and 50 cycles (Figure 6a,b). Before cycling, the peaks associated with the crystalline Si and SiC phases are clearly visible at a d-spacing of 3.13 Å and around 2.35–2.65 Å, respectively. The C (002) peak related to the GnP conductive additive can also be observed at 3.36 Å. After the 1st cycle, the Si (111) peak has completely disappeared, confirming its full amorphization during lithiation. No significant changes are observed in the SiC peaks, meaning that it retains its initial structure throughout the cycling. SEI products can be identified as early as the first cycle, mainly as Li2CO3 (main peaks at 2.84 and 2.94 Å, in accordance with JCPDS 00-022-1141). LiF peaks are also identified in smaller quantities, as highlighted at 1.42 Å (Figure 6b) in accordance with JCPDS 00-001-1269. Note that for both SEI components, their peak shapes are quite broad, suggesting low crystallinity and significant disordering. Their intensities also increase with the number of cycles due to the growth of the SEI layer.

3.3.2. Operando Dilatometry

Figure 7a shows the variation in thickness (black curve) and potential (red curve) of the Si slag electrode for 10 cycles at a current density of 90 mA g−1 for cycle 1, 180 mA g−1 for cycles 2 to 6, and 360 mA g−1 for cycles 7 to 10. The corresponding specific discharge and charge capacities are shown in Figure 7b. During the first lithiation, a large non-linear expansion of the electrode thickness is observed. It does not increase during the first ~1.5 h of discharge (135 mAh g−1), the period when the SEI is formed, and therefore, no silicon lithiation (expansion) takes place. Thereafter, there is a gradual increase in electrode thickness that accelerates notably from ~11 h of discharge (990 mAh g−1) to reach a maximum of 118% at the end of the first discharge (1487 mAh g−1). The faster expansion beyond 990 mAh g−1 of discharge may be due to the fact that Si expansion is no longer hampered by electrode porosity. It may also reflect a loss of cohesion/adhesion of the electrode associated with a breakdown of binder bonds and particle fracturing. Deformation (bending) of the current collector, which is subject to compressive forces during lithiation, cannot be ruled out either and could also influence the electrode’s dilatometric response. During the first delithiation, electrode contraction is very rapid during the first hour and becomes slower for the remainder of the delithiation. At the end of the first delithiation (1120 mAh g−1), an irreversible expansion of 8% is observed. This reflects an irreversible change in electrode architecture, such as crack formation. It may also be due to incomplete delithiation of the electrode as a result of disruption of the electronic network. Its maximum expansion (118%) and irreversible expansion (8%) at 1st cycle are, however, well below those observed with a ball-milled Si-based electrode, whose maximum and irreversible expansions are, respectively, 400 and 170% when cycled at full capacity (3700 mAh g−1) [39] and 224 and 36% when capacity is limited to 1200 mAh g−1 [40], i.e., an areal capacity similar to our Si slag electrode (~2–3 mAh cm−2). This confirms the better mechanical strength of the Si slag-based electrode. In subsequent cycles, a lower reversible and linear expansion/contraction is observed, confirming that electrode morphological change occurs mainly during the first cycle. At the 5th and 10th cycles, the reversible expansion/contraction of the electrode is 25 and 13% for a reversible capacity of 860 and 580 mAh g−1, respectively. These experimental values are close to the theoretical values of 26 and 18% calculated according to the equation
V el = f v S i V S i   max Q m a x   Q e l
where ΔVel is the electrode volume variation (%); f v S i is the Si volume fraction in the initial electrode (0.39 excluding porosity), ΔVSi max is the maximum Si volume variation (280% for Li15Si4) [41], Qmax is the theoretical maximum Si capacity (3579 mAh g−1 for Li15Si4), and Qel is the experimental electrode capacity (860 and 580 mAh g−1 at the 5th and 10th cycle). This calculation assumes that the volume expansion of silicon is not hampered by electrode porosity. Furthermore, it should be noted that electrode capacity decay is larger in the dilatometric cell than in the Swagelok cell. The ~10 times higher pressure applied to the electrode in Swagelok cells (~200 kPa vs. ~20 kPa in the dilatometric cell) could limit its deformation, particle disconnection, and thus, its capacity decay with cycling.

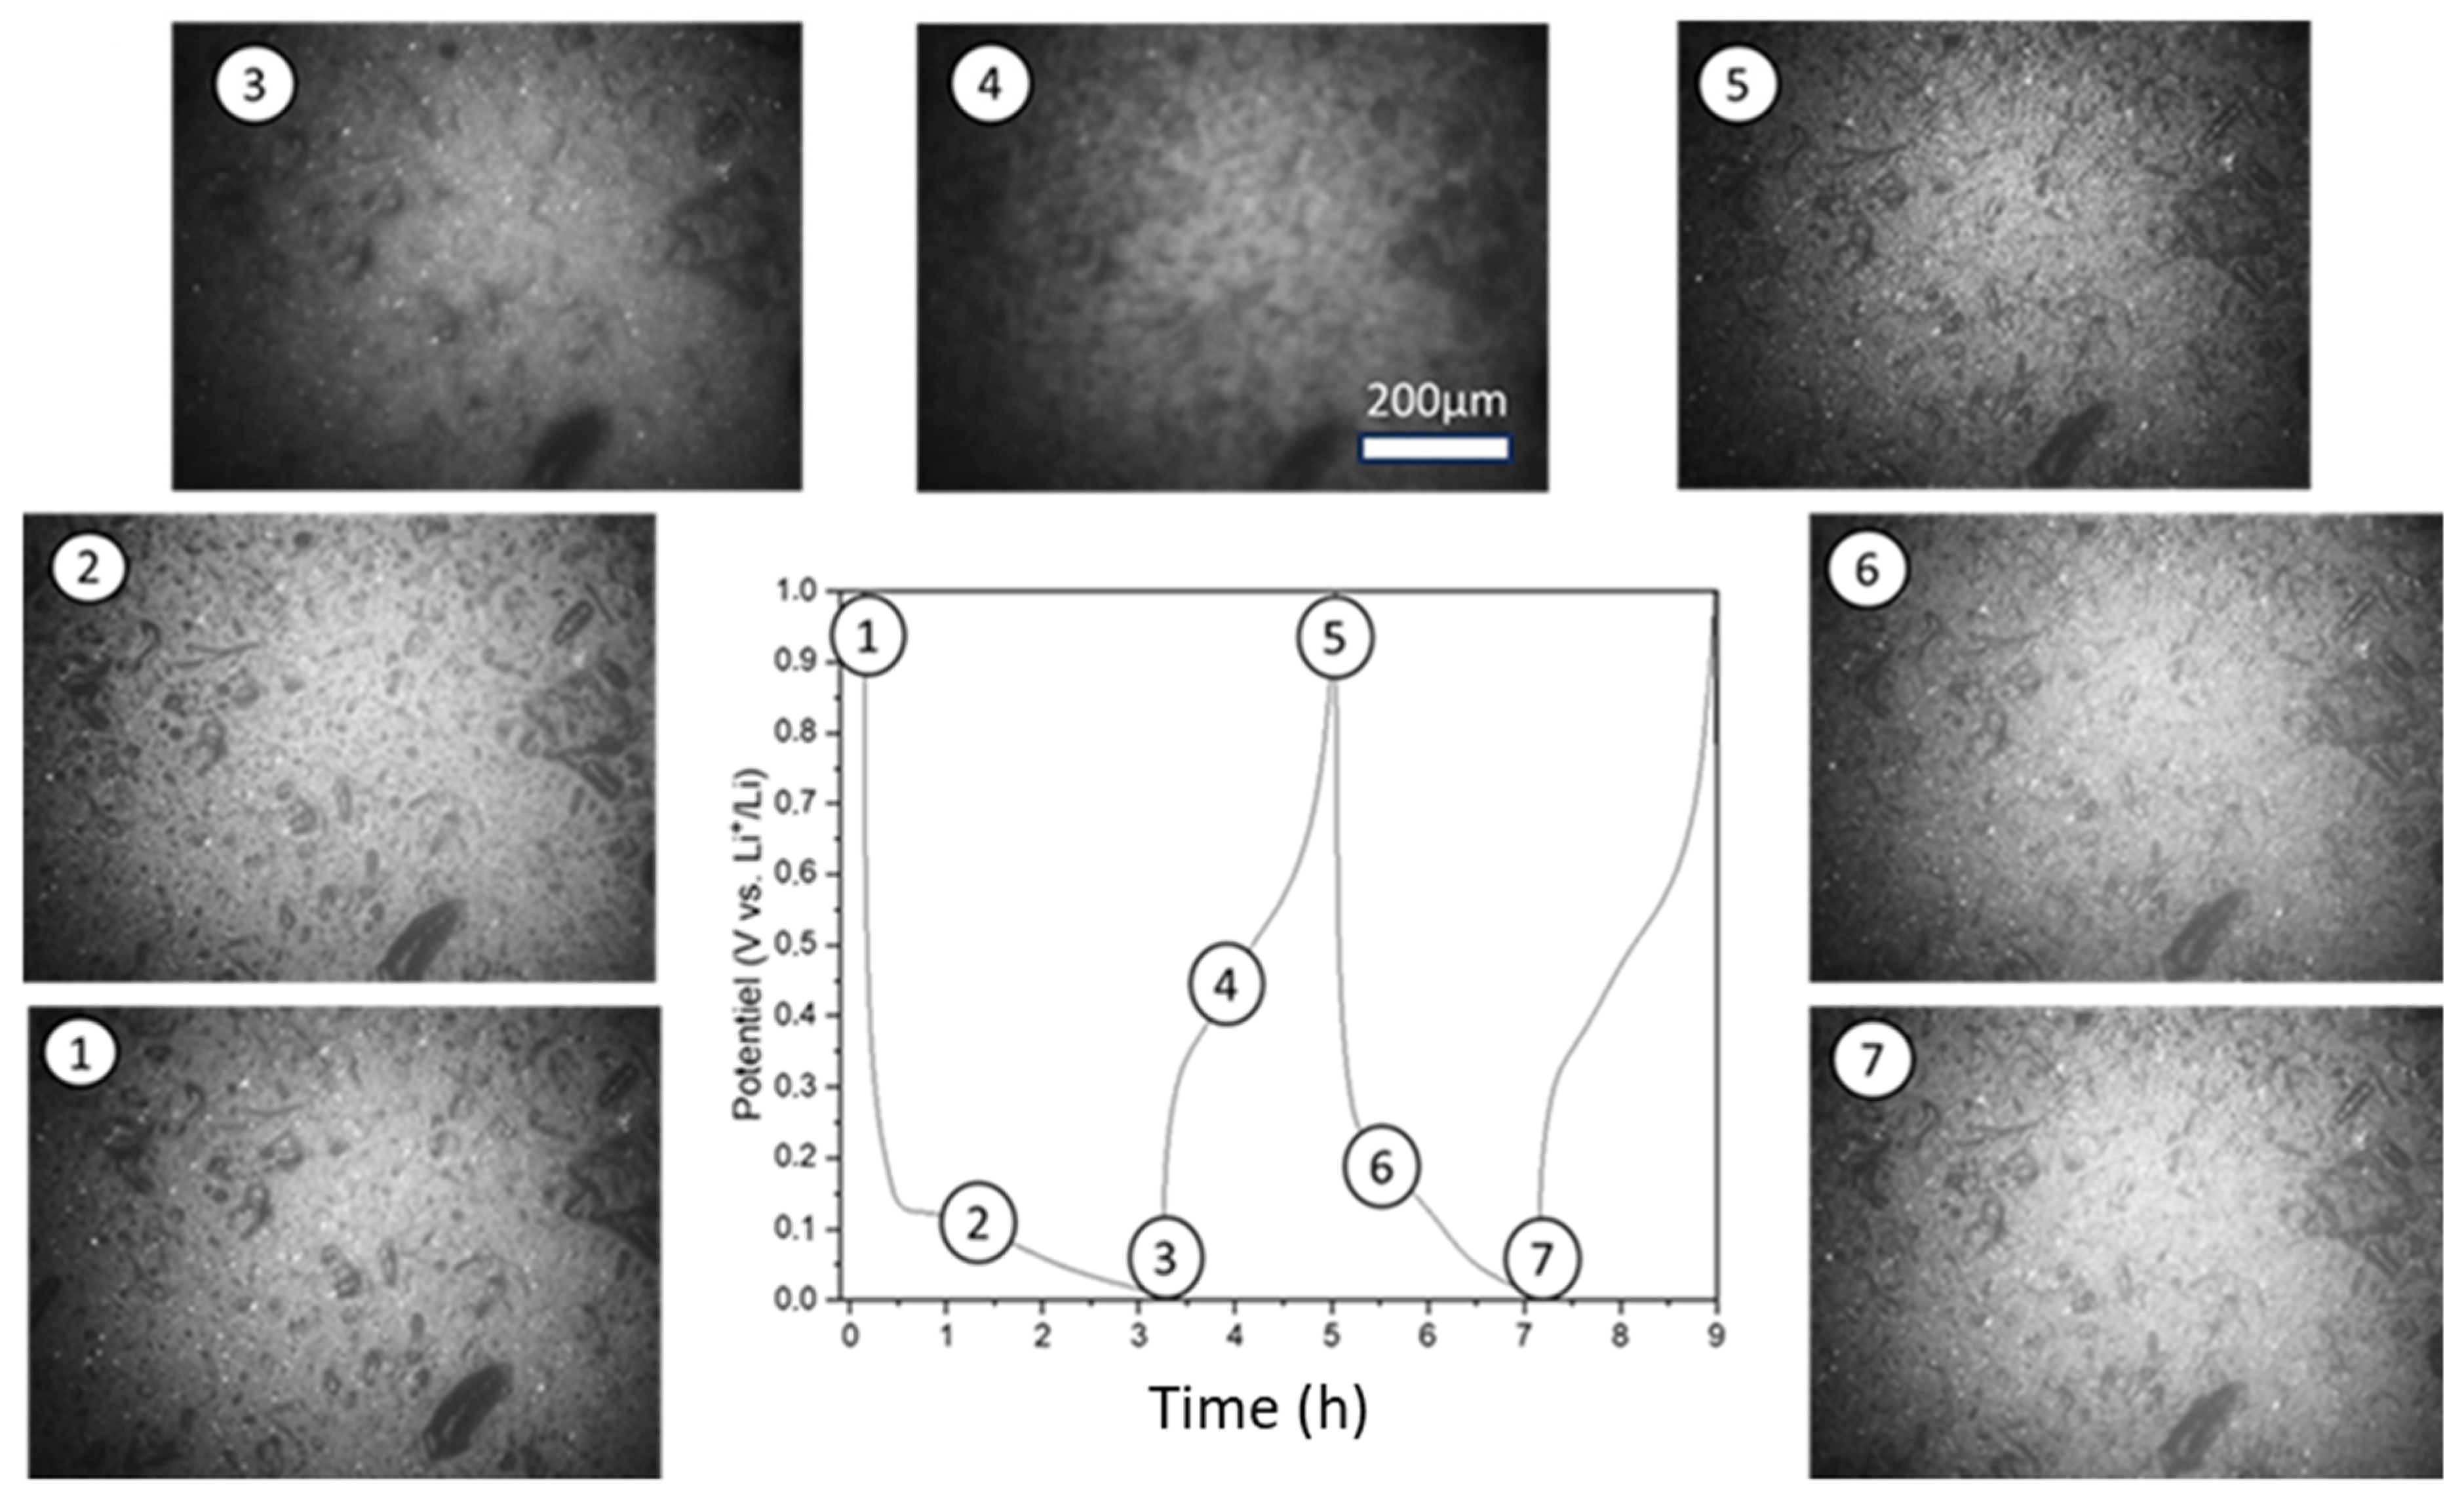
3.3.3. Operando Optical Microscopy

The surface of a Si slag electrode was recorded during the first two cycles by operando optical microscopy (see Video S1 in Supporting Information). Images extracted at different stages of cycling are shown in Figure 8, where shiny dots and intermediate gray color correspond to Si/SiC particles mixed with binder, whereas large black features correspond to graphene conductive additive. As seen in Video S1, a change in image sharpness is observed during cycling due to the variation in electrode thickness, causing a loss of microscope focus and requiring periodic readjustments by the experimenter. More importantly, no macrocracking and/or delamination of the electrode was observed during cycling. This differs markedly from operando optical microscopy observations of a ball-milled Si-based electrode [42] where its cracking was clearly observable during its first delithiation followed by its delamination during the subsequent lithiation (see Figure 6a in ref. [42]). This means that mechanical degradation is significantly minimized with the Si slag-based electrode.

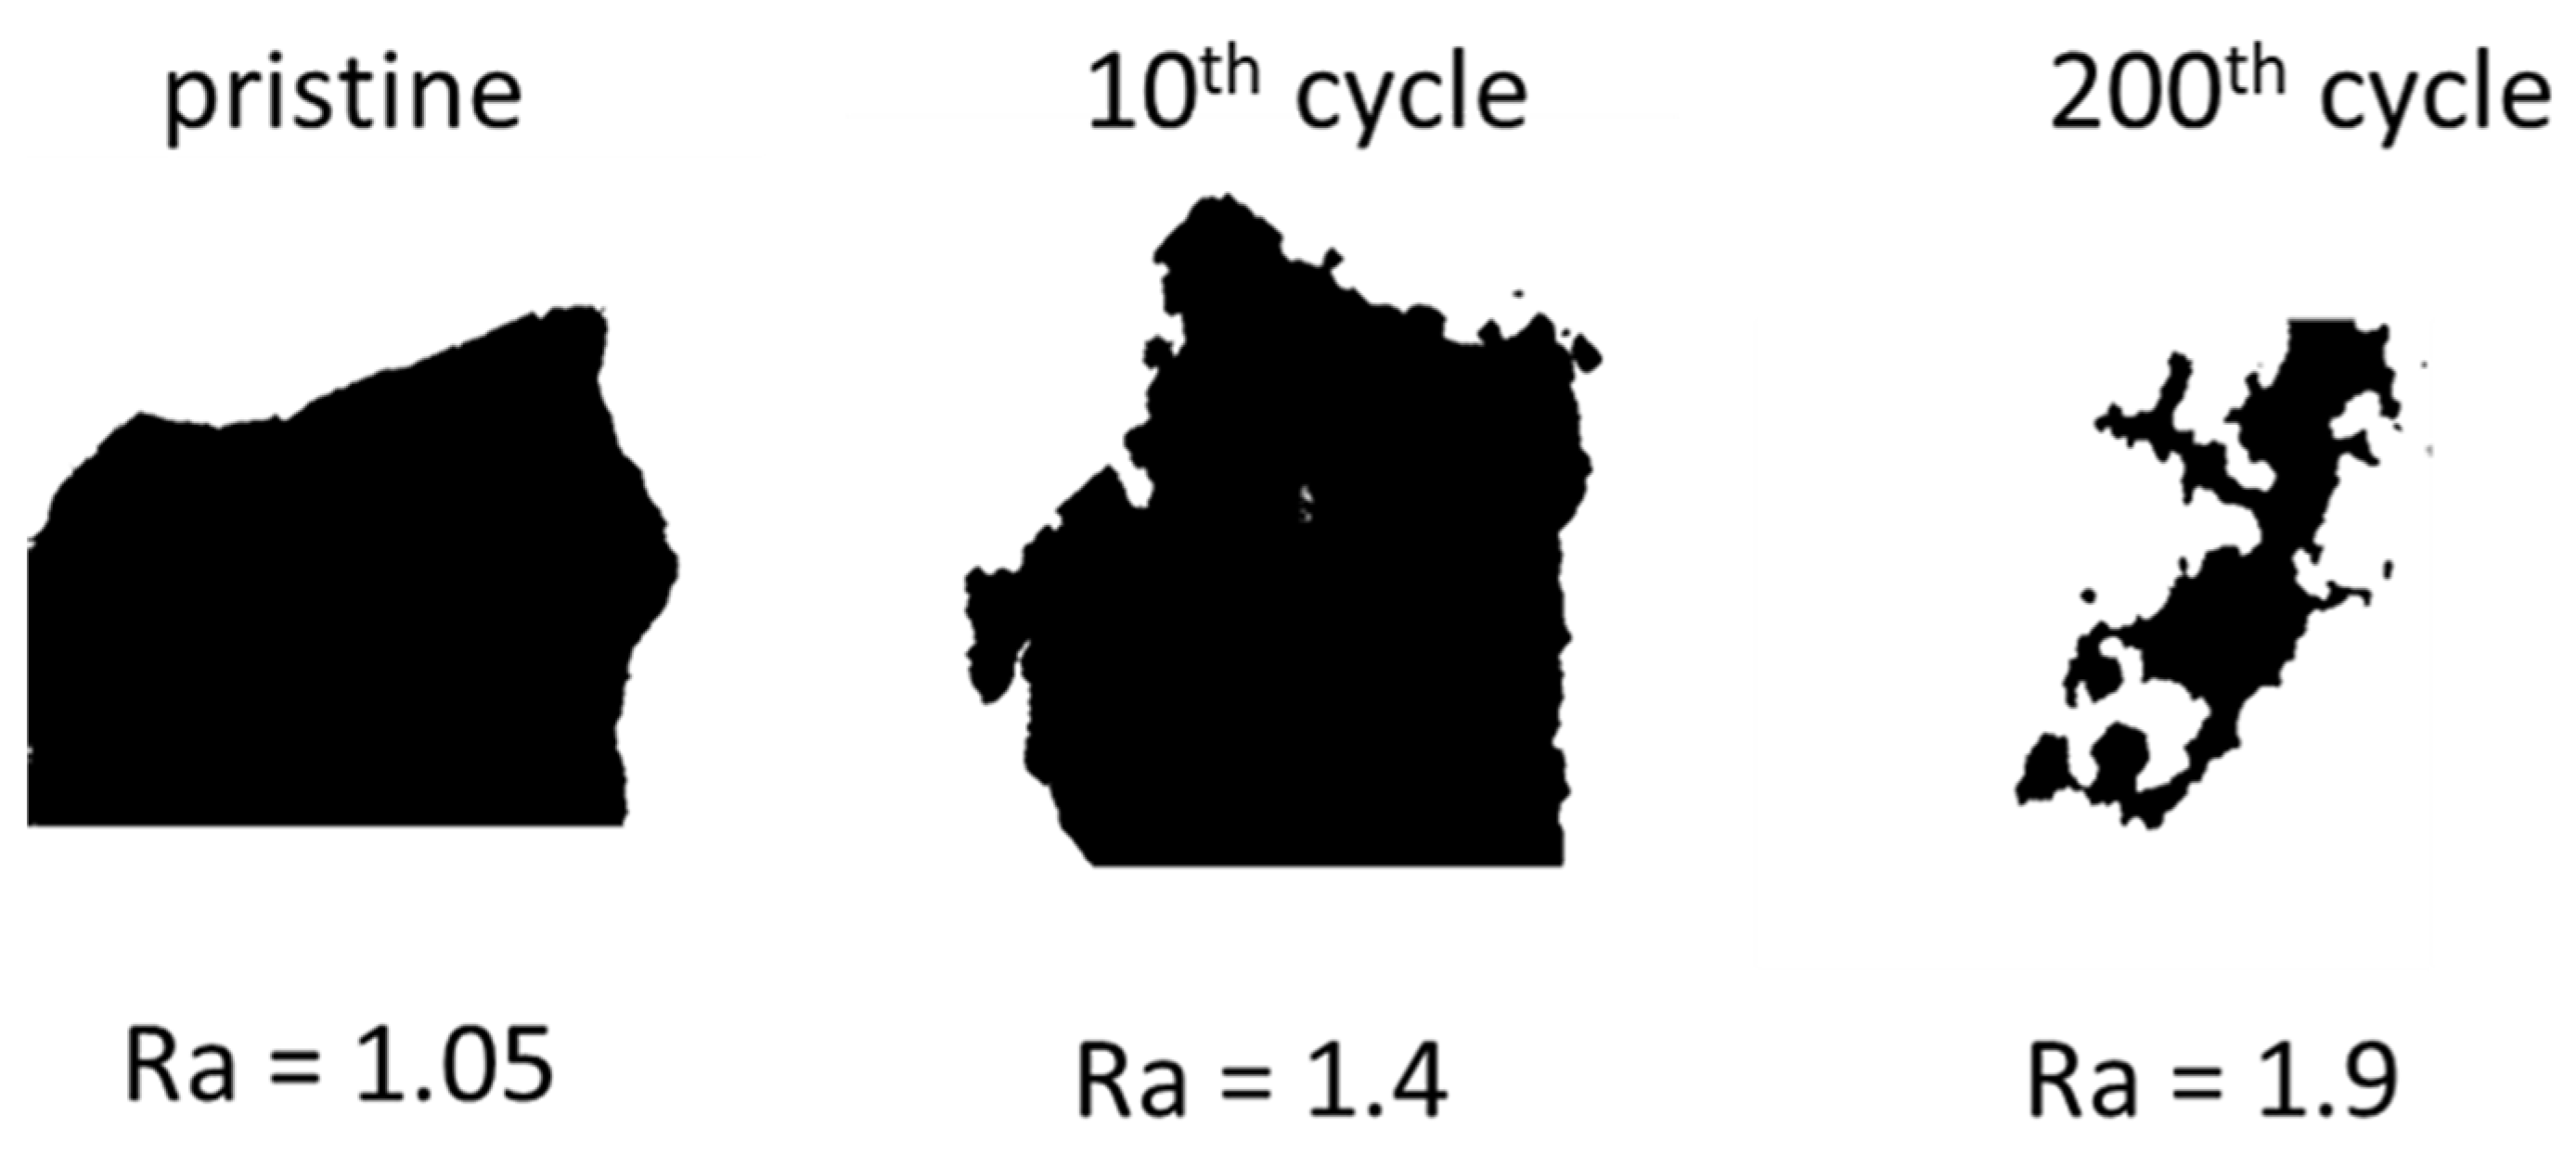
3.3.4. BIB-SEM Analyses

Figure 9 shows cross-sectional BIB-SEM images of the Si slag electrode before cycling and after 1, 10, and 200 cycles. These were taken at different magnifications and on different areas of interest, namely, over the entire thickness of the electrode (Figure 9a), at the interface with the current collector (Figure 9b), and on a Si slag particle (Figure 9c).
Figure 9a shows a progressive expansion of the electrode thickness with cycling, from 22.7 µm before cycling to 36.4 µm after 200 cycles, resulting in an increase of 64%. No cracks are discernible in the electrode after 1 and 10 cycles. On the other hand, cracks are clearly visible after 200 cycles, with a width of the order of a micrometer and a length of several tens of micrometers. These are present in both the longitudinal and transverse directions of the electrode. Cracks are also present at the interface with the current collector. However, as shown in Figure 9b, electrode coating/current collector contact points are still present after 200 cycles. A noticeable decrease in electrode porosity can also be observed after only 10 cycles. This is attributed to the accumulation of SEI products in the electrode porosity. This accumulation of SEI products may contribute to the irreversible expansion of the electrode and possibly induce its macrocracking as observed after 200 cycles. In contrast, within the Si slag particles (Figure 9c), no cracks are visible after 1 and 10 cycles, despite their micrometric size. This is remarkable in comparison with conventional micrometric silicon (diam. ≥ 150 nm), which cracks during its first cycle [43]. However, after 200 cycles, a significant change in particle morphology is observed. The particles evolved a dendritic-like structure, surrounded by a thick layer of the SEI. A similar particle shape after prolonged cycling has also been reported by Kumar et al. on micrometric particles consisting of a-Si/c-FeSi2 nanodomains [44]. Based on their observations, they speculate that cracks appear on the particle surface due to lithiation-induced tensile stresses. Electrolytic reactions are more favorable in these cracks. Thus, the SEI layer develops preferentially in the cracks, which, after further lithiation, can potentially expose a new surface, leaving behind the structure composed of active channels pointing like branches from the intact central region. Their experimental FIB-SEM results after 100 cycles tend to confirm this mechanism and clearly demonstrate the appearance of the branched structure. After longer cycling (300–700 cycles), the repeated volumetric variation of Si and its consumption along the cracking trajectories accentuates the shape of a tree-like structure, with channels progressively extending towards the core of the particle. They hypothesize that FeSi2 nanocrystallites may play a role in this remarkable structural evolution. It is indeed possible that inactive c-FeSi2 crystallites act as obstacles to the formation of the SEI and thus help to prevent the consumption of active Si channels as well as protect the central Si phase. Throughout this process, an inhomogeneous SEI forms continuously. While it remains thin at the very surface of the active channels, it thickens in the other surrounding regions (interchannels and interparticles). These thickness heterogeneities are a direct consequence of the particular evolution of particle shape and, at the same time, the development of complex interfaces with an increasingly high surface. In addition, Si can become trapped (hence, electronically isolated) by the thick SEI layer, leading to the growth of a Li-Si rich SEI layer. It should, however, be noted that several authors have also observed the formation of a stringy structure with Si particles without an inactive phase (e.g., ref. [45]). The formation of such a structure can be explained by the fact that lithiated silicon particles undergo dealloying reactions during lithium extraction, resulting in the roughening of the particle surface and the formation of void spaces. This phenomenon is repeated cycle after cycle, leading to the progressive formation of a dendritic/nanoporous silicon structure. The resulting increase in surface area leads to decomposition of the electrolyte and growth of the SEI towards the interior of the Si particles.
The various components of the electrode can be identified by segmentation of the BIB-SEM images as shown in Figure 10: in black, the porosity; in blue, the binder; in light gray, the Si; in dark gray, the SiC; in yellow, the GnP conductive additive; and in green, the SEI and binder. The binder is no longer discernible after cycling due to the formation of the SEI layer around the particles, which limits identification by thresholding because the gray levels are too close. A progressive increase in the thickness of the SEI layer is observed around the particles during cycling and is also accompanied by an overall reduction in porosity in the electrode. As mentioned above, the continuous growth of the SEI layer starting from the surface of the particles and progressing towards their core will give rise to a tree-like structure in the particles after 200 cycles. The key information here is that the SiC particles are unaffected by cycling, as also observed in the WAXS measurements, and have remained intact with no alteration to their morphology even when completely encircled by the SEI layer. Regarding the conductive additive, the graphene sheets remain intact, and their morphology does not appear to be altered by prolonged cycling.

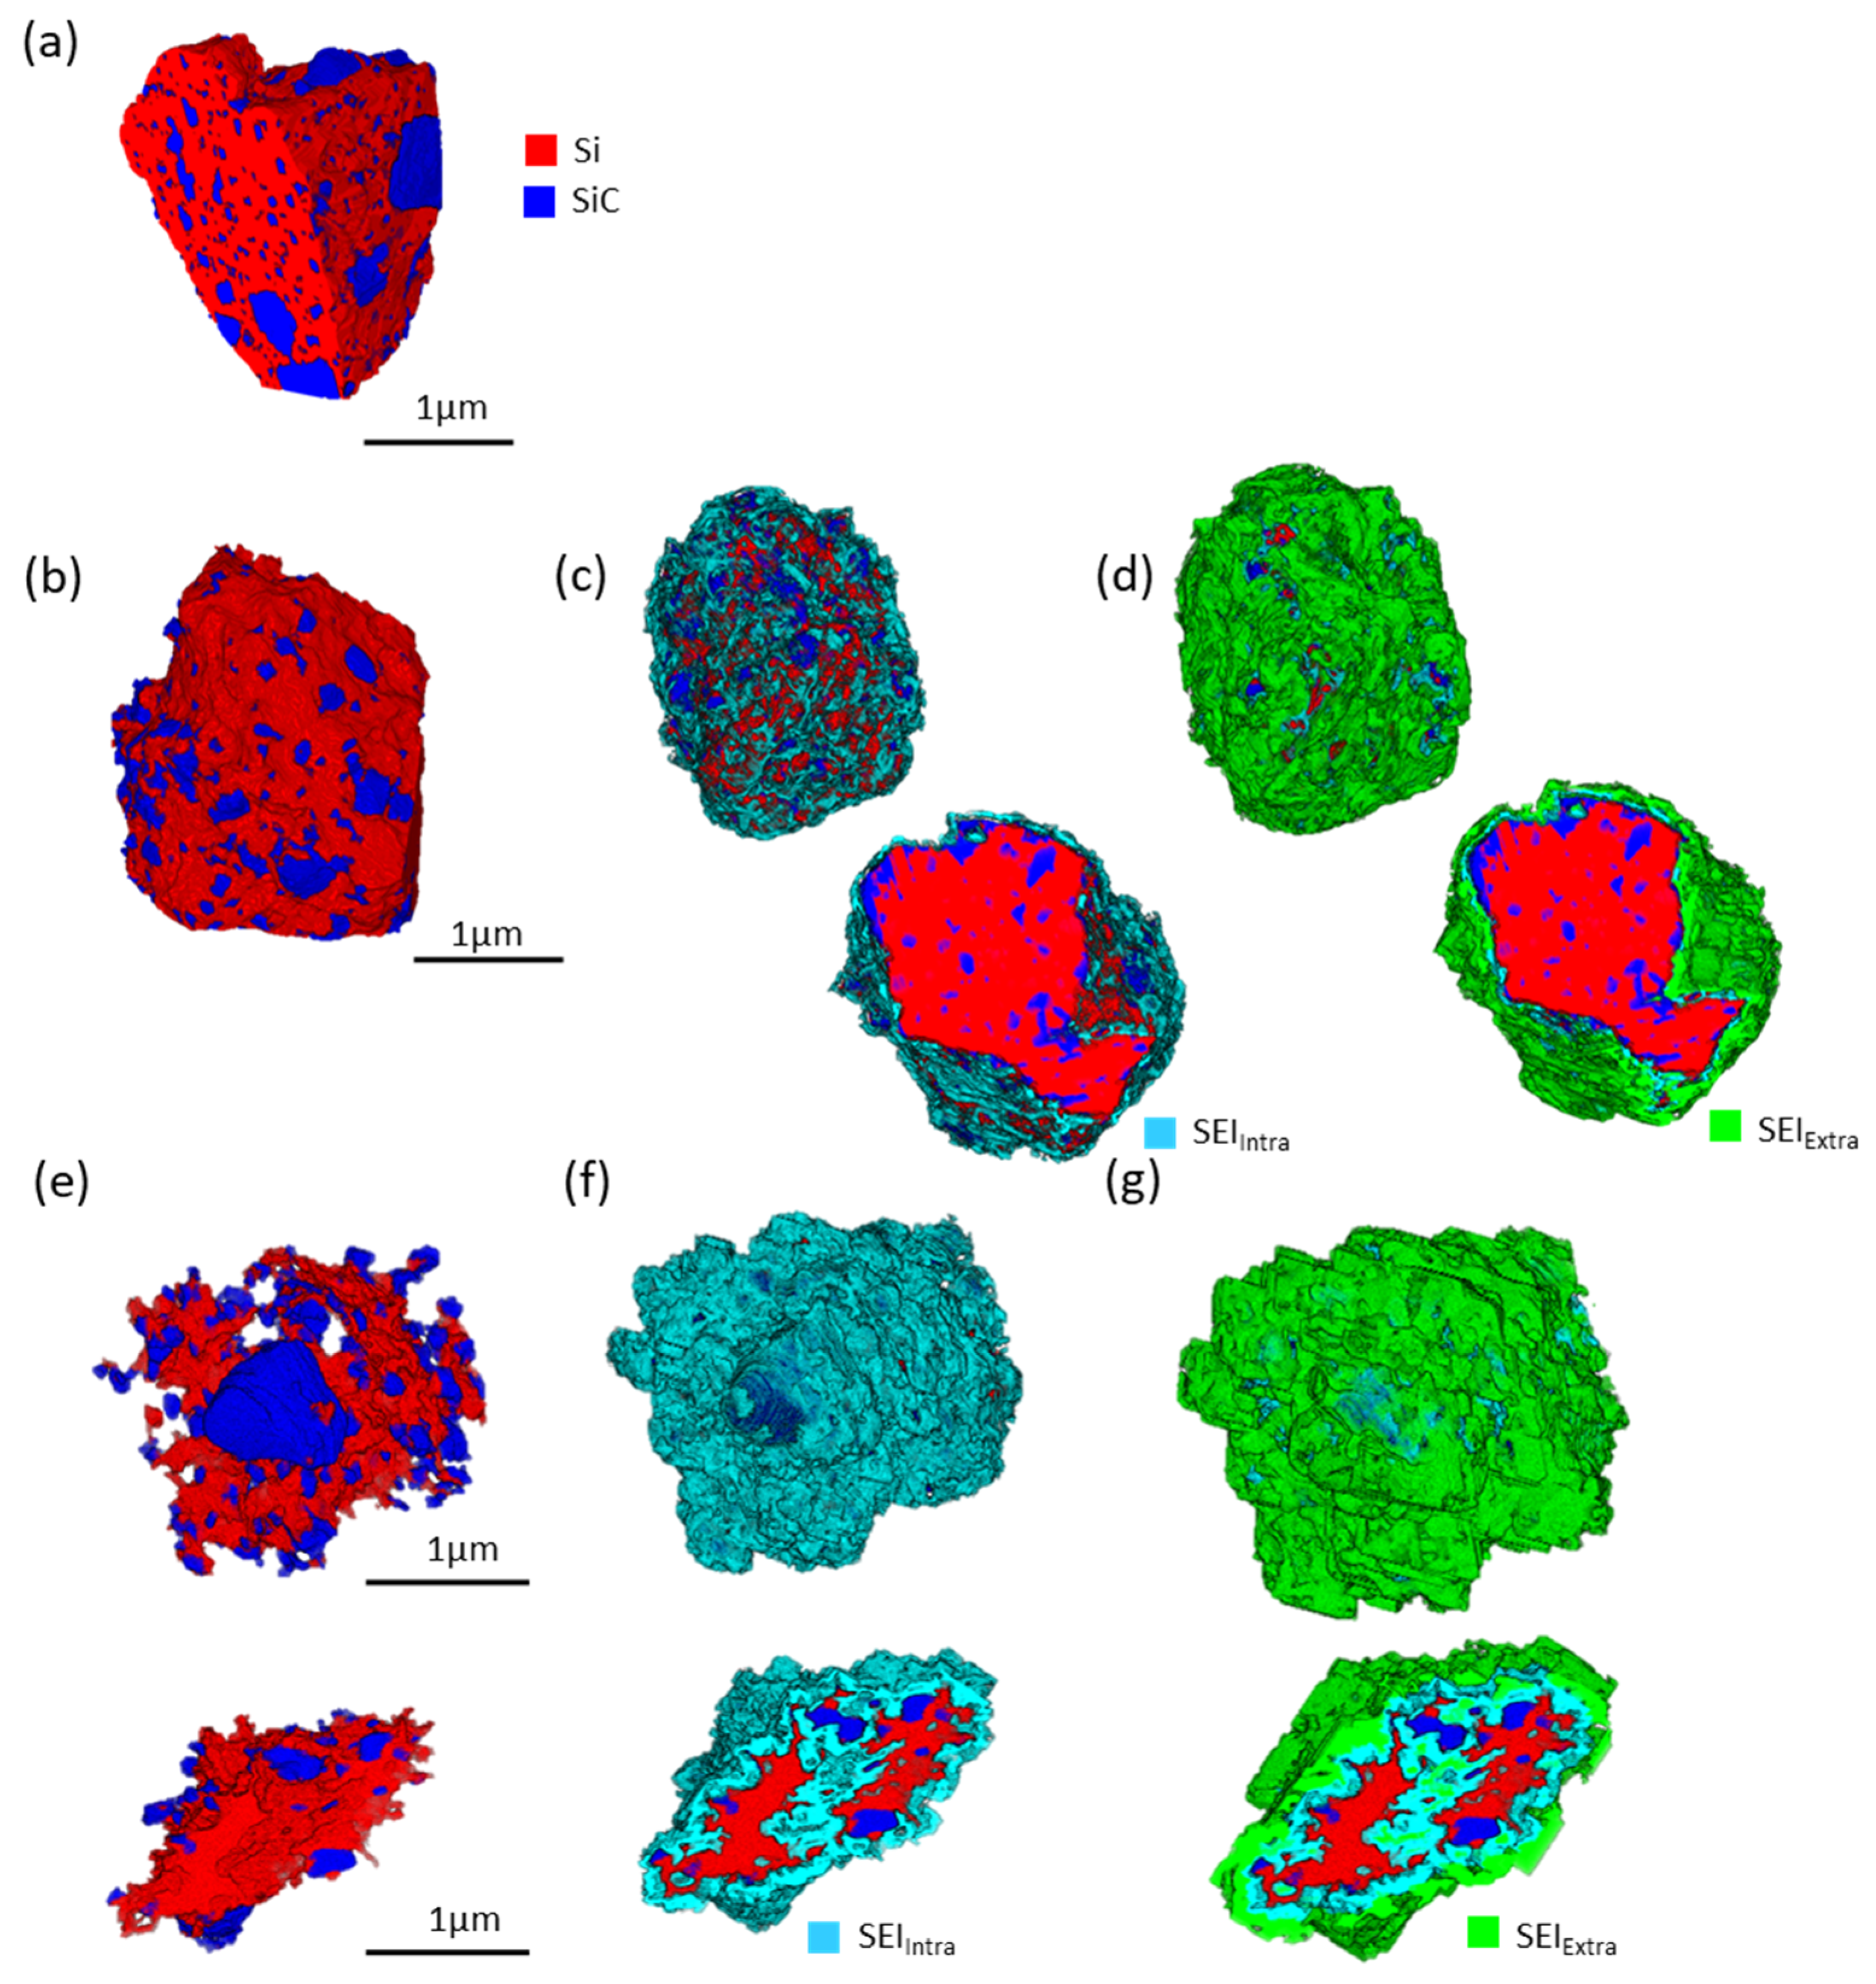
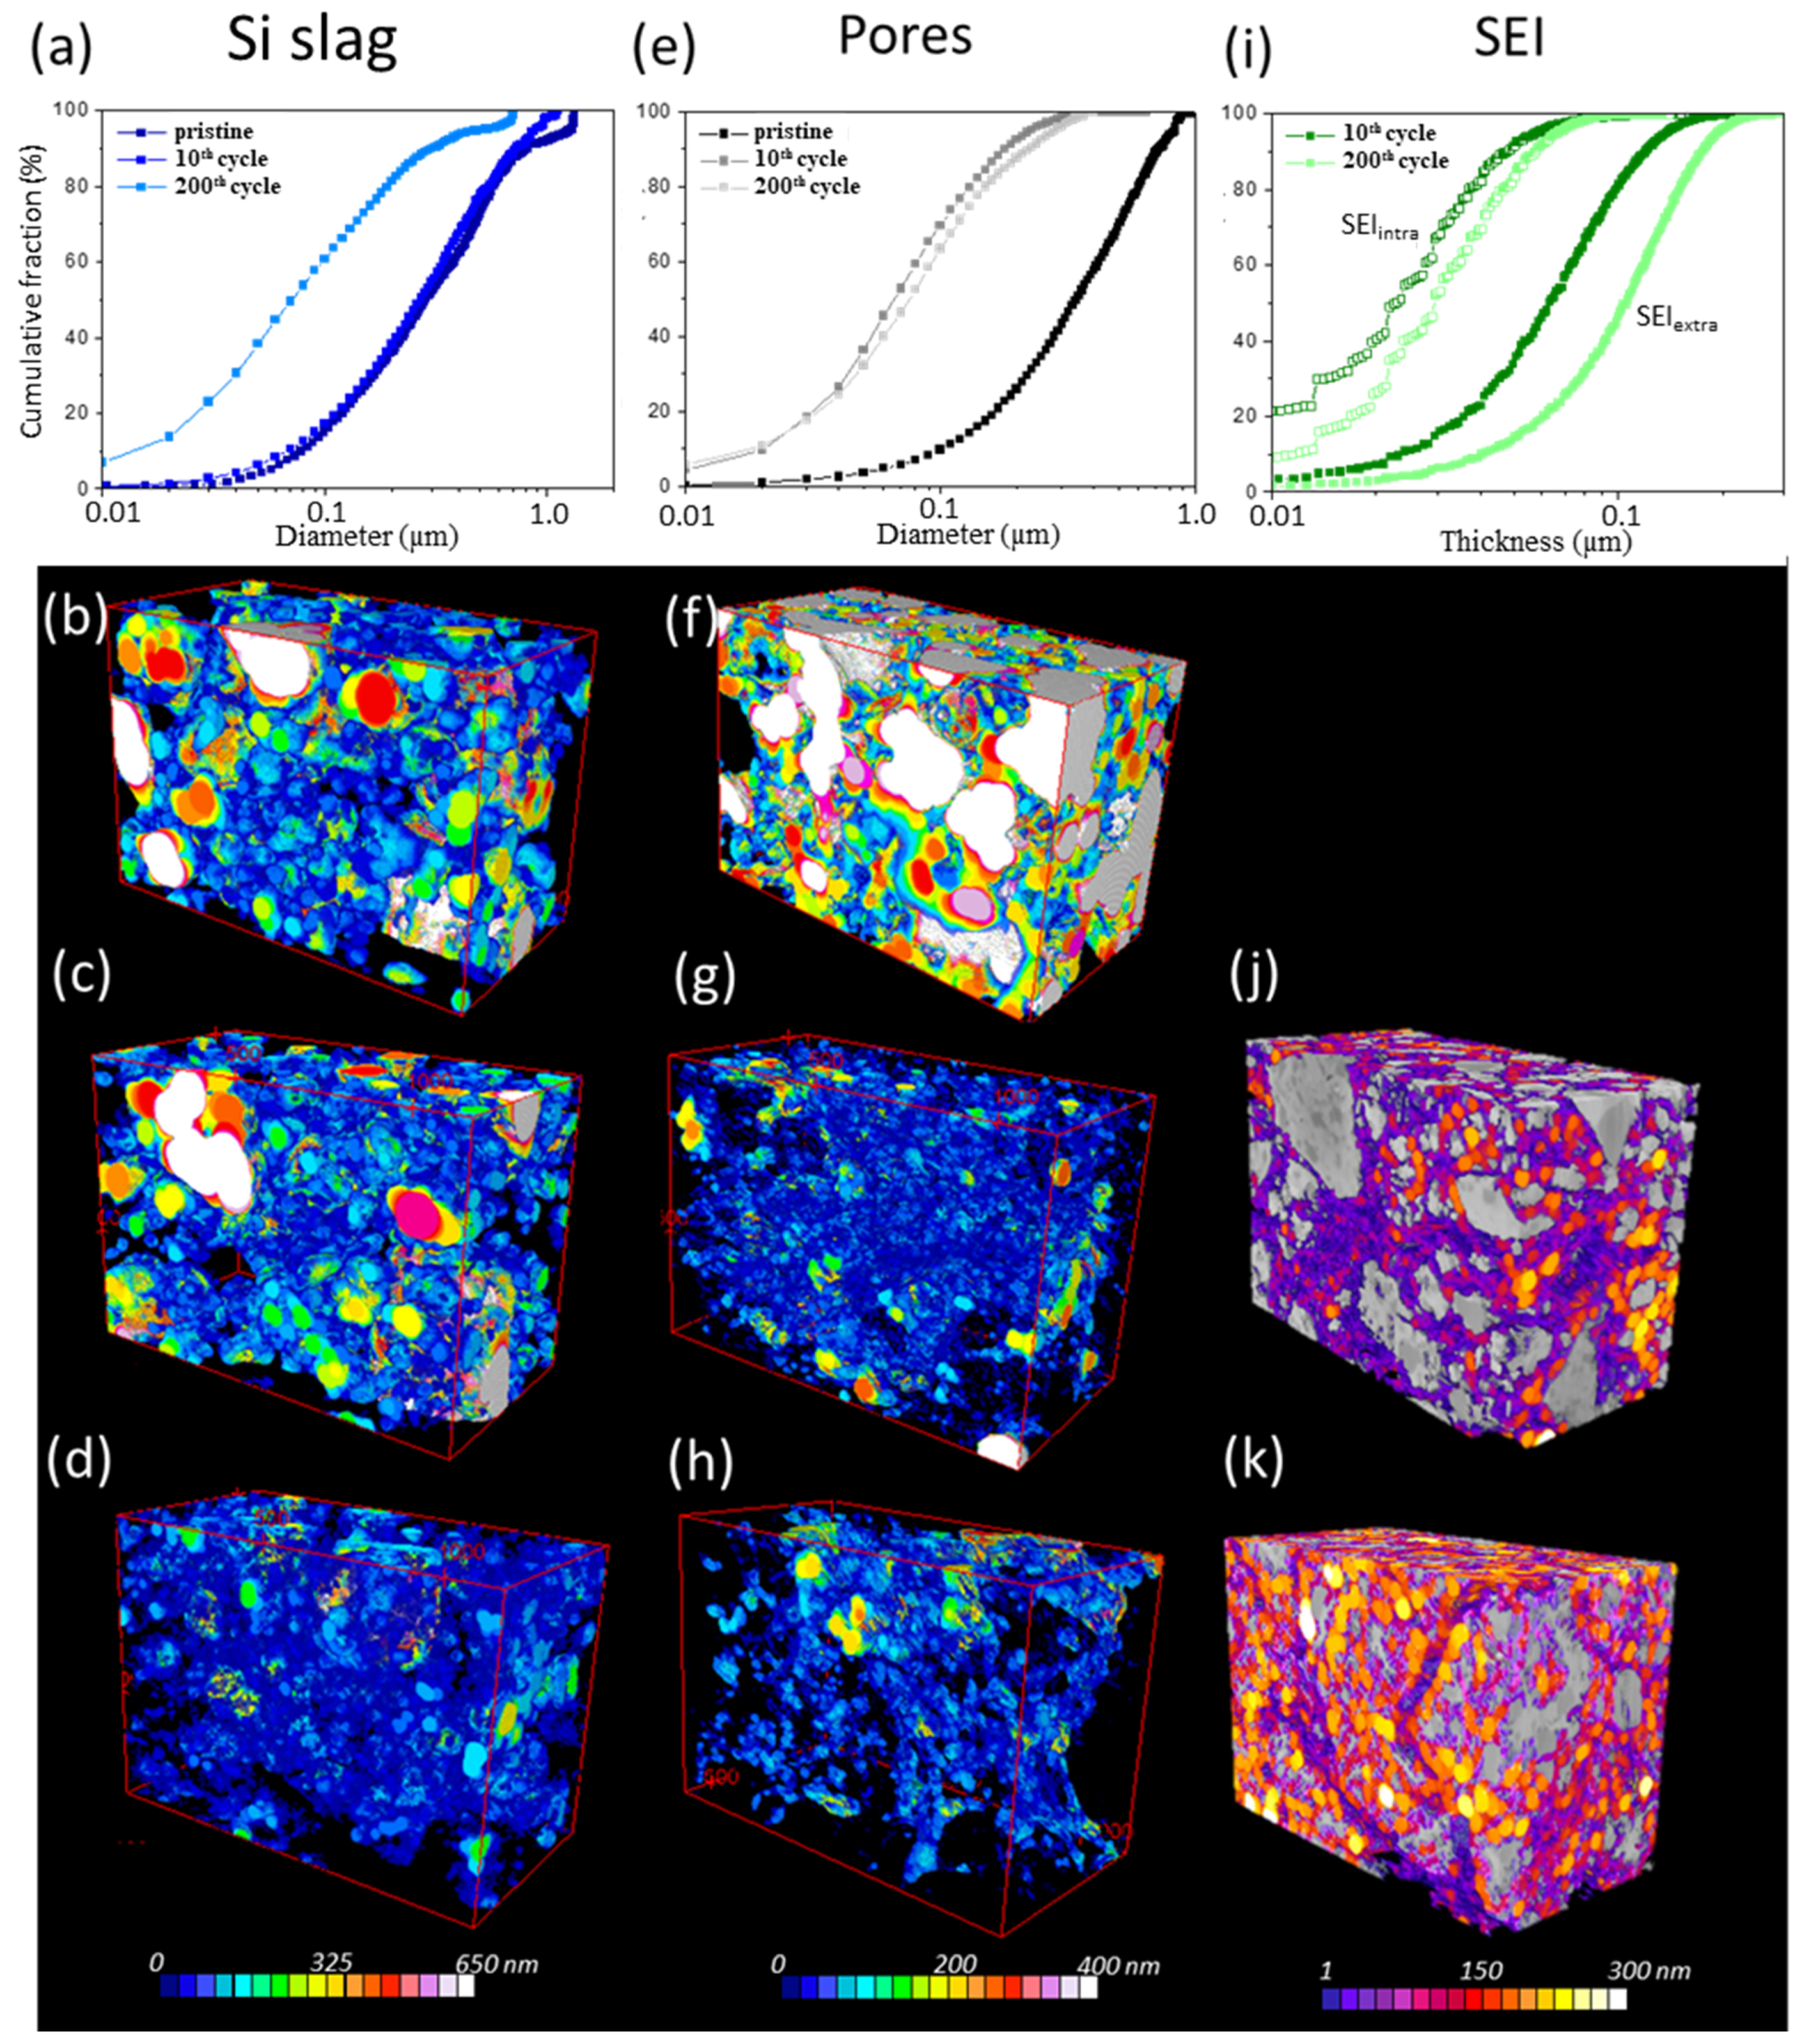
3.3.5. Three-Dimensional FIB-SEM Analyses

To further analyze the morphological variations of the Si slag electrode during cycling, a three-dimensional (3D) FIB-SEM analysis was carried out. Using appropriate image processing methods, a volume of 5.7 × 4 × 3 μm3 with a voxel size of 5 × 5 × 5 nm3 was reconstructed in which different phases can be identified and quantified. These analyses were carried out before cycling, after 10 cycles, and after 200 cycles. Typical segmentation steps of an FIB-SEM image are shown in Figure S1 and 3D views of the analyzed volumes are shown in Figures S2 and S3 in Supporting Information. The different phases which can be segmented by gray level thresholding of the FIB-SEM images are (i) the Si slag particles subdivided into Si and SiC fractions, (ii) the SEI subdivided into two fractions: the SEI intimately mixed with the Si slag particles (SEIintra) and the SEI present outside the Si slag particles (SEIextra), (iii) the pores, and (iv) the conductive additive (graphene). Their respective values are summarized in Table 1. Figure 11a–g show 3D views of segmented Si slag particles consisting of Si (red) and SiC (dark blue) in the initial state (a), after 10 cycles (b–d), and after 200 cycles (e–g). Intraparticle SEI and extraparticle SEI are shown in light blue and green, respectively.
A significant reduction in porosity occurs during cycling, with porosity dropping from 56.6% to 18.7% after only 10 cycles, and reaching 8.9% after 200 cycles. This decrease in porosity can be correlated with the growth in the SEI, whose volume fraction is 37.0% after only 10 cycles and rises more slowly thereafter, reaching 71.1% after 200 cycles. One can also see that the SEI distribution evolves with cycling since the SEIextra/SEIintra volume ratio drops from 2.6 (26.8/10.2) at cycle 10 to 1.4 (41.6/29.5) at cycle 200. This confirms the progressive penetration of SEI into the particle core during prolonged cycling, as previously described from BIB-SEM analyses. The growth of the SEI and the concomitant expansion of the electrode (+64% in thickness after 200 cycles as seen in Figure 9a) result in a decrease in the Si + SiC volume fraction from 37.6% before cycling to 11.5% after 200 cycles. This decrease is not observable after 10 cycles, as the SEI initially increases at the particle surface and is largely compensated by the decrease in electrode porosity, leading to a limited expansion of electrode thickness (+8% after 10 cycles, Figure 9a). It should also be noted that the Si/SiC volume ratio changes with cycling, dropping from 2.0 (24.9/12.7) before cycling to 0.9 (5.4/6.1) after 200 cycles. This decrease can be explained by the fact that Si is “nanoporosified” by the SEI’s internal growth and thus becomes more difficult to discern (to segment) after 200 cycles, unlike inactive SiC, which retains its initial morphology, as also confirmed by the previous BIB-SEM images.
As for the volume fraction of conductive additive (GnP), it remains constant during cycling (6–8%) even though the volumetric expansion of the electrode should logically lead to its decrease after 200 cycles. This highlights the uncertainty involved in estimating the volume fractions of phases present in small quantities, such as GnP. It should also be noted that the CMC binder and pH 3 buffer salts (citric acid and KOH) could not be segmented due to their small size and similar gray level to the SEI.
As shown in Figure 11, significant changes in the shape of Si slag particles are also observed during cycling with a progressive roughening of their surface leading to a dendritic/arborescent morphology after 200 cycles. This is reflected in the value of their arithmetic mean roughness (Ra) calculated according to the usual equation:
R a = 1 L 0 L z ( x · d x
where the straight line of length L represents the average profile of the particle surface, and the z(x) coordinate corresponds to the absolute distance from this line. Ra is 1.05 before cycling, 1.4 after 10 cycles, and 1.9 after 200 cycles (Figure 12).
From these 3D FIB-SEM analyses, it is also possible to quantify the evolution with cycling of the size (diameter) of Si slag particles and pores, as well as the thickness of the SEI layer. This evolution is expressed as cumulative distribution curves (Figure 13a,e,i) and can be visualized by a color scale on the 3D views of the analyzed volumes (Figure 13b,c,f–h,j,k). There is little change in the median size of Si slag particles after 10 cycles, decreasing from 290 to 270 nm (Figure 13a–d). In contrast, a significant decrease occurs after 200 cycles, with a median size of around 70 nm. This decrease is the result of SEI growth in the particles, leading to the dendritic structure, as clearly shown previously. Concerning the porosity of the electrode (Figure 13e–h), pore size decreases sharply from a median size (D50) of 340 to 60 nm between the initial state and the 10th cycle, inducing a ~4-fold decrease in electrode porosity as previously indicated. Pore size changes little thereafter (D50 = 80 nm after 200 cycles). This can be explained by the fact that during the first cycles, the SEI grows predominantly at the particle surface and thus fills the interparticle pore network. Subsequently, the SEI grows mainly inside the particles. As expected, the SEI thickness increases between the 10th and 200th cycles, from a median thickness of 60 to 106 nm for the SEIextra layer (Figure 13i–k). The thickness of the intraparticle SEI is thinner and increases little with cycling, from 20 to 30 nm between the 10th and 200th cycles. This illustrates the fact that SEI growth in the particles takes place by infiltrating deeper and deeper into the particles without any major increase in their thickness.

4. Conclusions

This work has shown that a Si/SiC composite, produced through the high-energy ball-milling of a by-product of the carbothermal reduction of silica, can be used as a high-capacity anode material for Li-ion batteries, with a capacity of 860 mAh g−1 (1.7 mAh cm−2) after 200 cycles in half-cell. The SiC component is not electroactive for lithiation but plays a key role in electrode stability by preventing the formation of the c-Li15Si4 phase, known to accelerate electrode degradation. As a result, and based on various characterization methods (electrochemical dilatometry, operando optical microscopy, 2D and 3D BIB/FIB-SEM analyses), one can observe (i) a decrease in the irreversible capacity associated with particle disconnections, (ii) a reduced and more reversible electrode expansion/contraction, (iii) a limited electrode macrocracking and delamination, and (iv) the absence of particle cracking. However, a progressive roughening/porosification of the particles is observed during cycling, favoring the SEI growth on and in the particles, which induces a significant reduction in electrode porosity and an increase in electrode thickness. This highlights the difficulty of stabilizing Si-based electrodes for prolonged cycling, even in the absence of particle cracking.
Further work is also needed to assess potential batch-to-batch variations in silicon slag composition that could affect electrode properties. In addition, a life cycle assessment (LCA) and cost analysis are needed to accurately assess the economic feasibility and environmental benefits of this Si slag as a low-cost, green anode material for Li-ion batteries.

Supplementary Materials

The following supporting information can be downloaded at https://www.mdpi.com/article/10.3390/batteries11040151/s1, Figure S1: Illustration of the segmentation of an FIB-SEM image of a Si slag electrode after 200 cycles; Figure S2: A 3D representation of the different phases segmented in the Si slag electrode before cycling, after 10 cycles, and 200 cycles; Figure S3: A 3D representation of the volumes analyzed in the initial state, at the 10th cycle, and at the 200th cycle; Text S1: An overview of the literature on Si-SiC composites as anode materials for Li-ion batteries [46,47,48,49,50,51,52,53,54]; Video S1: Surface of a Si slag electrode recorded during the first 2 cycles by operando optical microscopy.

Author Contributions

Conceptualization, L.R.; methodology, A.H., V.V., S.Q., T.D. and I.M.; investigation, A.H., V.V., S.Q., T.D., I.M., M.M. and N.H.; writing—original draft preparation, A.H. and L.R.; writing—review and editing, L.R., V.V., T.D. and N.H.; supervision, L.R.; project administration, L.R.; funding acquisition, L.R. All authors have read and agreed to the published version of the manuscript.

Funding

This research was funded by the Natural Sciences and Engineering Research Council (NSERC) of Canada (grant ALLRP 549341-19), Prima Québec (grant R19-13-003), PyroGenesis Canada Inc. and HPQ Silicon Resources Inc.

Data Availability Statement

The data that support the findings of this study are available from the corresponding author upon reasonable request.

Acknowledgments

The ESRF is thanked for the provision of beamtime allocated through inhouse proposals IHMA287 and IHCH1663. Likewise, thanks are due to the CLyM (Consortium Lyon Saint-Etienne de Microscopie) supported by the CNRS, the ‘‘Grand Lyon’’ and the Rhône-Alpes Region for the use of the Zeiss NVision40 FIB/SEM.

Conflicts of Interest

The authors declare no conflicts of interest.

References

  1. Feyzi, E.; Kumar, A.M.R.; Li, X.; Deng, S.; Nanda, J.; Zaghib, K. A comprehensive review of silicon anodes for high-energy lithium-ion batteries: Challenges, latest developments, and perspectives. Next Energy 2024, 5, 100176. [Google Scholar] [CrossRef]
  2. Shahverdi, A.; Carabin, P. Silica to High Purity Silicon Production Process. Patent Application WO 2017/024378 A1, 19 February 2017. [Google Scholar]
  3. Heitz, A.; Vanpeene, V.; Herkendaal, N.; Soucy, P.; Douillard, T.; Roué, L. Transforming silicon slag into high-capacity anode material for lithium-ion batteries. Battery Energy 2022, 1, 20220016. [Google Scholar] [CrossRef]
  4. Xu, C.; Xia, T.; Li, X.; Zhang, A.; Chen, Y.; Wang, C.; Lin, R.; Li, Z.; Dai, P.; Zhou, Y.; et al. Covalent Binding of Holey Si–SiC Layer on Graphene Aerogel with Enhanced Lithium Storage Kinetics and Capability. Surf. Coat. Technol. 2021, 420, 127336. [Google Scholar] [CrossRef]
  5. Du, J.; Zhu, R.; Chen, Q.; Xie, J.; Xian, H.; Zhang, J.; Zhu, J. In Situ Synthesis of Stable Silicon Carbide-Reinforced Silicon Nanosheets from Organoclay for High-Performance Lithium-Ion Battery Anodes. Appl. Surf. Sci. 2023, 617, 156566. [Google Scholar] [CrossRef]
  6. Yan, X.; Hu, L.; He, X.; Zhang, J.; Zhang, W.; Gan, Y.; Xia, Y.; Huang, H. Ball-Milling-Triggered Synthesis of Si/C/SiC@MCMB Composites from Carbon Dioxide for Improved Lithium Storage Capability. Energy Fuels 2023, 37, 746–753. [Google Scholar] [CrossRef]
  7. Gautam, M.; Kumar Mishra, G.; Furquan, M.; Bhawana, K.; Kumar, D.; Mitra, S. Design of Low-Stress Robust Silicon and Silicon-Carbide Anode with High Areal Capacity and High Energy Density for Next-Generation Lithium-Ion Batteries. Chem. Eng. J. 2023, 472, 144916. [Google Scholar] [CrossRef]
  8. Furquan, M.; Jangid, M.K.; Khatribail, A.R.; Vijayalakshmi, S.; Mukhopadhyay, A.; Mitra, S. Mechanical and Electrochemical Stability Improvement of SiC-Reinforced Silicon-Based Composite Anode for Li-Ion Batteries. ACS Appl. Energy Mater. 2020, 3, 12613–12626. [Google Scholar] [CrossRef]
  9. Ngo, D.T.; Le, H.T.T.; Pham, X.-M.; Park, C.-N.; Park, C.-J. Facile Synthesis of Si@SiC Composite as an Anode Material for Lithium-Ion Batteries. ACS Appl. Mater. Interfaces 2017, 9, 32790–32800. [Google Scholar] [CrossRef]
  10. Park, S.; Sung, J.; Chae, S.; Hong, J.; Lee, T.; Lee, Y.; Cha, H.; Kim, S.Y.; Cho, J. Scalable Synthesis of Hollow β-SiC/Si Anodes via Selective Thermal Oxidation for Lithium-Ion Batteries. ACS Nano 2020, 14, 11548–11557. [Google Scholar] [CrossRef]
  11. Yu, C.; Chen, X.; Xiao, Z.; Lei, C.; Zhang, C.; Lin, X.; Shen, B.; Zhang, R.; Wei, F. Silicon Carbide as a Protective Layer to Stabilize Si-Based Anodes by Inhibiting Chemical Reactions. Nano Lett. 2019, 19, 5124–5132. [Google Scholar] [CrossRef]
  12. Zhang, Y.; Hu, K.; Ren, J.; Wu, Y.; Yu, N.; Feng, A.; Huang, Z.; Jia, Z.; Wu, G. A Sandwich-Like Si/SiC/Nanographite Sheet as a High-Performance Anode for Lithium-Ion Batteries. Dalton Trans. 2019, 48, 17683. [Google Scholar] [CrossRef]
  13. Weng, Y.; Chen, G.; Dou, F.; Zhuang, X.; Wang, Q.; Lu, M.; Shi, L.; Zhang, D. In Situ Growth of Silicon Carbide Interface Enhances the Long Life and High Power of the Mulberry-Like Si-Based Anode for Lithium-Ion Batteries. J. Energy Storage 2020, 32, 101856. [Google Scholar] [CrossRef]
  14. Chen, Y.; Zhang, J.; Chen, X.; Yang, P.; An, M. Facile Preparation of Hollow Si/SiC/C Yolk-Shell Anode by One-Step Magnesiothermic Reduction. Ceram. Int. 2019, 45, 17040–17047. [Google Scholar] [CrossRef]
  15. Zhang, Z.; Li, H. Sequential-Template Synthesis of Hollowed Carbon Polyhedron@SiC@Si for Lithium-Ion Battery with High Capacity and Electrochemical Stability. Appl. Surf. Sci. 2020, 514, 145920. [Google Scholar] [CrossRef]
  16. Tzeng, Y.; He, J.-L.; Jhan, C.-Y.; Wu, Y.-H. Effects of SiC and Resorcinol–Formaldehyde (RF) Carbon Coatings on Silicon-Flake-Based Anode of Lithium-Ion Battery. Nanomaterials 2021, 11, 302. [Google Scholar] [CrossRef] [PubMed]
  17. Hu, X.; Xu, P.; Liao, M.; Lu, X.; Shen, G.; Zhong, C.; Zhang, M.; Huang, Q.; Su, Z. SiO Anode with Long-Term Cycling Ability Enhanced by a SiC Transition Layer Based on Polymethylsilane in LIBs. Appl. Surf. Sci. 2024, 653, 159308. [Google Scholar] [CrossRef]
  18. Choi, J.-H.; Choi, S.; Cho, J.S.; Kim, H.-K.; Jeong, S.M. Efficient Synthesis of High Areal Capacity Si@Graphite@SiC Composite Anode Material via One-Step Electro-Deoxidation. J. Alloys Compd. 2022, 896, 163010. [Google Scholar] [CrossRef]
  19. Liang, J.; Wang, W.; Yang, W.; Zhang, Z.; Zhang, X.; Jung, Y.; Dong, X. Facile Synthesis of Ceramic SiC-Based Nanocomposites and the Superior Electrochemical Lithiation/Delithiation Performances. Mater. Chem. Phys. 2020, 243, 122618. [Google Scholar] [CrossRef]
  20. Zhu, Y.; Hu, J.; Qin, C.; Li, Y.; Yang, Y. Synthesis of Free-Standing N-Doping Si/SiC/C Composite Nanofiber Film as Superior Lithium-Ion Batteries Anode. Mater. Lett. 2022, 306, 130895. [Google Scholar] [CrossRef]
  21. Chen, Z.; Jia, H.; Hoeppener, S.; Friebe, C.; Wang, J.; Chanteux, G.; Xie, D.; Lu, Y.; Vlad, A.; Schubert, U.S.; et al. Hollow Porous Silicon Nanospheres with 3D SiC@C Coating as High-Performance Anodes. Mater. Des. 2023, 226, 111624. [Google Scholar] [CrossRef]
  22. Tranchot, A.; Idrissi, H.; Thivel, P.X.; Roué, L. Impact of the Slurry pH on the Expansion/Contraction Behavior of Silicon/Carbon/Carboxymethylcellulose Electrodes for Li-Ion Batteries. J. Electrochem. Soc. 2016, 163, A1020–A1026. [Google Scholar] [CrossRef]
  23. Schindelin, J.; Arganda-Carreras, I.; Frise, E.; Kaynig, V.; Longair, M.; Pietzsch, T.; Preibisch, S.; Rueden, C.; Saalfeld, S.; Schmid, B.; et al. Fiji: An Open-Source Platform for Biological-Image Analysis. Nat. Methods 2012, 9, 676–682. [Google Scholar] [CrossRef] [PubMed]
  24. Paul, E.; Pierre, W.; Wenxing, Z. A variational model for multiplicative structured noise removal. J. Math. Imaging Vis. 2017, 57, 43–55. [Google Scholar]
  25. Berg, S.; Kutra, D.; Kroeger, T.; Straehle, C.N.; Kausler, B.X.; Haubold, C.; Schiegg, M.; Ales, J.; Beier, T.; Rudy, M.; et al. Ilastik: Interactive machine learning for (bio)image analysis. Nat. Methods 2019, 16, 1226–1232. [Google Scholar] [CrossRef] [PubMed]
  26. Kreshuk, A.; Zhang, C. Machine Learning: Advanced Image Segmentation Using Ilastik. Methods Mol. Biol. 2019, 2040, 449–463. [Google Scholar]
  27. Klinger, M. More features, more tools, more CrysTBox. J. Appl. Crystal. 2017, 50, 1226–1234. [Google Scholar] [CrossRef]
  28. Gauthier, R.; Scott, B.; Benett, J.C.; Salehabadi, M.; Wang, J.; Sainuddin, T.; Obrovac, M.N. The Amorphization of Crystalline Silicon by Ball Milling. Heliyon 2024, 10, e34881. [Google Scholar] [CrossRef]
  29. Zhao, M.; Zhang, J.; Wang, W.; Zhang, Q. Formation and Quantitative Analysis of Internal Structure of Si Nanoparticles Developed via Bead-Milling. AIP Adv. 2021, 11, 075101. [Google Scholar] [CrossRef]
  30. Timmons, A.; Todd, A.D.W.; Mead, S.D.; Carey, G.H.; Sanderson, R.J.; Mar, R.E.; Dahn, J.R. Studies of Si1-xCx Electrode Materials Prepared by High-Energy Mechanical Milling and Combinatorial Sputter Deposition. J. Electrochem. Soc. 2007, 154, 865–874. [Google Scholar] [CrossRef]
  31. Li, J.; Dahn, J.R. An In Situ X-Ray Diffraction Study of the Reaction of Li with Crystalline Si. J. Electrochem. Soc. 2007, 154, 156–161. [Google Scholar] [CrossRef]
  32. Iaboni, D.S.M.; Obrovac, M.N. Li15Si4 Formation in Silicon Thin Film Negative Electrodes. J. Electrochem. Soc. 2016, 163, 255–261. [Google Scholar] [CrossRef]
  33. Gauthier, M.; Mazouzi, D.; Reyter, D.; Moreau, P.; Lestriez, B.; Guyomard, D.; Roué, L. A Low-Cost and High-Performance Si-Based Electrode for Li-Ion Batteries. Energy Environ. Sci. 2013, 6, 2145–2155. [Google Scholar] [CrossRef]
  34. Nguyen, B.P.N.; Gaubicher, J.; Lestriez, B. Analogy Between Electrochemical Behaviour of Thick Silicon Granular Electrodes for Lithium Batteries and Fine Soils Micromechanics. Electrochim. Acta 2014, 120, 319–326. [Google Scholar] [CrossRef]
  35. Chen, Z.; Zhang, L.; Wu, X.; Song, K.; Ren, B.; Li, T.; Zhang, S. Effect of N/P Ratios on the Performance of LiNi0.8Co0.15Al0.05O2||SiOx/Graphite Lithium-Ion Batteries. J. Power Sources 2019, 439, 227056. [Google Scholar] [CrossRef]
  36. Klett, M.; Gilbert, J.A.; Pupek, K.Z.; Trask, S.E.; Abraham, D.P. Layered Oxide, Graphite and Silicon-Graphite Electrodes for Lithium-Ion Cells: Effect of Electrolyte Composition and Cycling Windows. J. Electrochem. Soc. 2017, 164, 6095–6102. [Google Scholar] [CrossRef]
  37. Chevrier, V.L.; Krause, L.J.; Jensen, L.D.; Huynh, C.; Triemert, M.; Bowen, E.L.; Thorson, J. Design of Positive Electrodes for Li-Ion Full Cells with Silicon. J. Electrochem. Soc. 2018, 165, 2968–2977. [Google Scholar] [CrossRef]
  38. Song, B.F.; Dhanabalan, A.; Biswal, S.L. Evaluating the Capacity Ratio and Prelithiation Strategies for Extending Cyclability in Porous Silicon Composite Anodes and Lithium Iron Phosphate Cathodes for High Capacity Lithium-Ion Batteries. J. Energy Storage 2020, 28, 101268. [Google Scholar] [CrossRef]
  39. Karkar, Z.; Mazouzi, D.; Reale Hernandez, C.; Guyomard, D.; Roué, L.; Lestriez, B. Threshold-like Dependence of Silicon-Based Electrode Performance on Active Mass Loading and Nature of Carbon Conductive Additive. Electrochim. Acta 2016, 215, 276–288. [Google Scholar] [CrossRef]
  40. Huet, L.; Mazouzi, D.; Moreau, P.; Dupré, N.; Paris, M.; Mittelette, S.; Laurencin, D.; Devic, T.; Roué, L.; Lestriez, B. Coordinatively Cross-Linked Binders for Silicon-Based Electrodes for Li-Ion Batteries: Beneficial Impact on Mechanical Properties and Electrochemical Performance. ACS Appl. Mater. Interfaces 2023, 15, 15509–15524. [Google Scholar] [CrossRef]
  41. Obrovac, M.N.; Krause, L.J. Reversible Cycling of Crystalline Silicon Powder. J. Electrochem. Soc. 2007, 154, 103–108. [Google Scholar] [CrossRef]
  42. Hernandez, C.R.; Etiemble, A.; Mazouzi, D.; Karkar, Z.; Maire, E.; Guyomard, D.; Lestriez, B.; Roué, L. A Facile and Very Effective Method to Enhance the Mechanical Strength and the Cyclability of Si-Based Electrodes for Li-Ion Batteries. Adv. Energy Mater. 2018, 8, 1701787. [Google Scholar] [CrossRef]
  43. Liu, X.H.; Zhong, L.; Huang, S.; Mao, S.X.; Zhu, T.; Huang, J.Y. Size-Dependent Fracture of Silicon Nanoparticles During Lithiation. ACS Nano 2012, 6, 1522–1531. [Google Scholar] [CrossRef] [PubMed]
  44. Kumar, P.; Berhaut, C.L.; Dominguez, D.Z.; De Vito, E.; Tardif, S.; Pouget, S.; Lyonnard, S.; Jouneau, P.-H. Nano-Architectured Composite Anode Enabling Long-Term Cycling Stability for High-Capacity Lithium-Ion Batteries. Small 2020, 16, 1906812. [Google Scholar] [CrossRef]
  45. Wetjen, M.; Solchenbach, S.; Pritzl, D.; Hou, J.; Tileli, V.; Gasteiger, H.A. Morphological Changes of Silicon Nanoparticles and the Influence of Cutoff Potentials in Silicon-Graphite Electrodes. J. Electrochem. Soc. 2018, 165, 1503–1514. [Google Scholar] [CrossRef]
  46. Kim, I.-S.; Blomgren, G.E.; Kumta, P.N. Si–SiC Nanocomposite Anodes Synthesized Using High-Energy Mechanical Milling. J. Power Sources 2004, 130, 275–280. [Google Scholar] [CrossRef]
  47. Yang, Y.; Ren, J.-G.; Wang, X.; Chui, Y.-S.; Wu, Q.-H.; Chen, X.; Zhang, W. Graphene Encapsulated and SiC Reinforced Silicon Nanowires as an Anode Material for Lithium-Ion Batteries. Nanoscale 2013, 5, 8689–8694. [Google Scholar] [CrossRef] [PubMed]
  48. Lipson, A.L.; Chattopadhyay, S.; Karmel, H.J.; Fister, T.T.; Emery, J.D.; Dravid, V.P.; Thackeray, M.M.; Fenter, P.A.; Bedzyk, M.J.; Hersam, M.C. Enhanced Lithiation of Doped 6H Silicon Carbide (0001) via High Temperature Vacuum Growth of Epitaxial Graphene. J. Phys. Chem. C 2012, 116, 20949–20957. [Google Scholar] [CrossRef]
  49. Virdis, S.; Vetter, U.; Ronning, C.; Kröger, H.; Hofsäss, H. Lattice Site Location of Ion-Implanted 8Li in Silicon Carbide. J. Appl. Phys. 2002, 91, 1046. [Google Scholar] [CrossRef]
  50. Sri Devi Kumari, T.; Jeyakumar, D.; Prem Kumar, T. Nano Silicon Carbide: A New Lithium-Insertion Anode Material on the Horizon. RSC Adv. 2013, 3, 15028. [Google Scholar] [CrossRef]
  51. Li, H.; Yu, H.; Zhang, X.; Guo, G.; Hu, J.; Dong, A.; Yang, D. Bowl-Like 3C-SiC Nanoshells Encapsulated in Hollow Graphitic Carbon Spheres for High-Rate Lithium-Ion Batteries. Chem. Mater. 2016, 28, 1179–1186. [Google Scholar] [CrossRef]
  52. Sun, C.; Wang, Y.-J.; Gu, H.; Fan, H.; Yang, G.; Ignaszak, A.; Tang, X.; Liu, D.; Zhang, J. Interfacial Coupled Design of Epitaxial Graphene@SiC Schottky Junction with Built-in Electric Field for High-Performance Anode of Lithium-Ion Batteries. Nano Energy 2020, 77, 105092. [Google Scholar] [CrossRef]
  53. Bijoy, T.K.; Karthikeyan, J.; Murugan, P. Exploring the Mechanism of Spontaneous and Lithium-Assisted Graphitic Phase Formation in SiC Nanocrystallites of a High Capacity Li-Ion Battery Anode. J. Phys. Chem. C 2017, 121, 15106–15113. [Google Scholar] [CrossRef]
  54. Nandan, R.; Takamori, N.; Higashimine, K.; Badam, R.; Matsumi, N. Confronting the Issues Associated with the Practical Implementation of Zinc Blende-Type SiC Anodes for Efficient and Reversible Storage of Lithium Ions. ACS Appl. Energy Mater. 2024, 7, 2088–2100. [Google Scholar] [CrossRef]
Figure 1. (a) BIB-polished cross-section SEM images in BSE mode and (b) corresponding segmented image with GnP conductive additive in yellow and CMC binder in blue. (c) BIB-SEM image focused on a Si slag particle and (d) its corresponding EBSD mapping with α-SiC in green and β-SiC in red.
Batteries 11 00151 g001
Figure 2. (a) TEM image showing a SiC zone and a Si-rich zone with corresponding diffraction patterns shown on the left and right, respectively. (b) TEM image compiled from 4 dark-field images associated with different diffracting waves. (c) High resolution TEM images of a Si/SiC region with a focus on the atomic planes of (d) the SiC area and of (e,f) the Si area.
Batteries 11 00151 g002
Figure 3. Fit of the Si (111) diffraction peak of the ball-milled Si slag powder.
Batteries 11 00151 g003
Figure 4. Cycling performance of a Si slag electrode (2 mg Si slag cm−2): (a) evolution of the areal discharge capacity and coulombic efficiency as a function of the cycle number; (b) dQ/dV curves for the 1st, 10th, and 200th cycles and (c) dQ/dV curve focused on the delithiation following a discharge potential maintained at 5 mV for 24 h. Evolution as a function of the number of cycles of the irreversible capacity (d) per cycle and (e) cumulated cycle after cycle, and (f) cumulated relative irreversible capacities associated with SEI (RICSEI) and disconnections (RICDISCON). The current density was 180 mA g−1 of Si slag for the first 5 cycles and 400 mA g−1 for subsequent cycles.
Batteries 11 00151 g004
Figure 5. (a) Half-cell charge/discharge curves (cycles 1 and 2) of the Si slag electrode (2.44 mg Si slag cm−2); (b) half-cell charge/discharge curves (cycles 1 and 2) of the NCA electrode with a nominal capacity of 3.5 mAh cm−2; (c) charge/discharge curves (cycles 1, 2, 5, and 50) of a full cell consisting of a Si slag negative electrode and an NCA positive electrode with an n/p ratio of 1.1; (d) evolution with cycling of the areal charge and discharge capacities and coulombic efficiency of the full cell. Full-cell cycling was performed between 2.7 and 4.2 V at a current density of 0.185 mA cm−2 (approx. C/20) for the first 5 cycles and 0.413 mA cm−2 (approx. C/9) for subsequent cycles.
Batteries 11 00151 g005
Figure 6. WAXS diffractograms of a Si slag electrode before and after 1, 10, and 50 cycles for two regions of interests (a,b).
Batteries 11 00151 g006
Figure 7. (a) Electrochemical dilatometric response over the first 10 cycles of a Si slag electrode (2 mg cm−2); (b) corresponding discharge and charge capacities. The current density was 90 mA g−1 of Si slag for the first cycle, 180 mA g−1 for the next 5 cycles, and 360 mA g−1 for the last 4 cycles.
Batteries 11 00151 g007
Figure 8. Selected surface images of a Si slag electrode (2 mg cm−2) recorded during the first two cycles by operando optical microscopy. The applied current density was 360 mA g−1 of Si slag.
Batteries 11 00151 g008
Figure 9. Transverse BIB-SEM images of Si slag electrodes (2 mg cm−2) after different cycling times, i.e., from left to right: before cycling, after 1 cycle, after 10 cycles and after 200 cycles, observed (a) at the electrode scale, (b) at the interface with the current collector, and (c) at the scale of a Si slag particle.
Batteries 11 00151 g009
Figure 10. Cross-sectional BIB-SEM images of Si slag electrode before cycling and after 1, 10, and 200 cycles with porosity highlighted in black, binder in blue, Si in light gray, SiC in dark gray, conductive additive in yellow, and SEI + binder in green.
Batteries 11 00151 g010
Figure 11. The 3D representation of Si slag particles consisting of Si (red) and SiC (dark blue) (a) in the initial state, (bd) after 10 cycles, and (eg) after 200 cycles. Intraparticle SEI and extraparticle SEI are shown in light blue and green, respectively.
Batteries 11 00151 g011
Figure 12. Evolution of Si slag particle roughness with cycling.
Batteries 11 00151 g012
Figure 13. Evolution with cycling of Si slag particle size (ad), pore size (eh), and SEI thickness (ik) presented as cumulative percent distribution curves and visualized as color scales on 3D views of analyzed volumes.
Batteries 11 00151 g013
Table 1. Volume fractions of the various phases extracted from 3D-FIB/SEM analyses.
SiSiCSi + SiCGnPPoresSEIintraSEIextraSEI Total
Pristine24.912.737.65.856.6000
10th cycle22.615.037.66.718.710.226.837.0
200th cycle5.46.111.58.58.929.541.671.1
Disclaimer/Publisher’s Note: The statements, opinions and data contained in all publications are solely those of the individual author(s) and contributor(s) and not of MDPI and/or the editor(s). MDPI and/or the editor(s) disclaim responsibility for any injury to people or property resulting from any ideas, methods, instructions or products referred to in the content.

