Article

Electrochemical Performance of Pre-Modified Birch Biochar Monolith Supercapacitors by Ferric Chloride and Ferric Citrate

by
Ziyue Song
,
Tianjie Feng
,
Donald W. Kirk
and
Charles Q. Jia
*
The Green Technology Lab, Department of Chemical Engineering and Applied Chemistry, University of Toronto, Toronto, ON M5S 3E5, Canada
*
Author to whom correspondence should be addressed.
Batteries 2025, 11(2), 47; https://doi.org/10.3390/batteries11020047
Submission received: 14 November 2024 / Revised: 16 January 2025 / Accepted: 24 January 2025 / Published: 25 January 2025
(This article belongs to the Special Issue High-Performance Super-capacitors: Preparation and Application)

Abstract

:
This study investigated the electrochemical properties of supercapacitors by pre-modifying thick birch biochar monoliths with FeCl3 or C6H5FeO7 solutions prior to wood pyrolysis. The pre-modification introduced iron species to the surface, promoting the specific surface area, charge-stored species, and surface functionalities, which enhanced the gravimetric capacitance. X-ray diffraction confirmed the successful loading of Fe3O4 and Fe. SEM implied the wider distribution of iron-rich particulates and porous carbon via self-pyrolysis on the biochar surface modified with 1.0 M C6H5FeO7. Contact angle measurements demonstrated the enhanced wettability of the biochar surfaces following pre-modification, with the C6H5FeO7-modified samples exhibiting superior wettability compared to the other groups. The gravimetric capacitance of the supercapacitor was dramatically promoted and reached 210 F/g and 219 F/g, respectively, when modified with 1.0M C6H5FeO7 and 1.0 M FeCl3 at a 5 mA/g current density. Compared to the birch biochar modified with 1.0 M FeCl3, the 1.0 M C6H5FeO7 had a higher current response peak and capacitive behavior in the CV analysis, demonstrated better ion diffusion capacity, and had lower charge-transfer resistance in the EIS results. But, a slight irreversible process on the electrode of the 1.0 M C6H5FeO7 group led to a lower level of the supercapacitor capacitance retention. The results using ferric solution pre-impregnation show how iron species doping can improve capacitance behavior, providing a feasible scheme for the modification of thick biochar monolith.

Graphical Abstract

1. Introduction

Cellulose, abundantly present in natural biomass, is interconnected through hydrogen bonding, giving rise to an intricate tubular bundle structure within living organisms [1]. Biomass that is characterized by a highly developed tubular bundle structure when being pyrolyzed yields a biochar possessing a well-defined pore architecture and a substantial specific surface area. This biochar is a stable carbon-rich product offering a secure and long-term carbon storage solution within the environment [2]. Its porosity minimizes ion diffusion resistance, while the combination of micropores and mesopores provides abundant active sites, facilitating efficient electron and ion transport within the biochar [3]. Consequently, biochar demonstrates favorable physical and electrochemical adsorption properties including valuable attributes encompassing a high surface area, porosity, surface functionality, and sorption capacity, rendering it suitable for utilization as an electrode in supercapacitors for effective energy storage.
The source of the biochar is important. For example, some wood species, such as balsa, are characterized by relatively sparse tubular bundle structures and thus exhibit a lower bulk density before and after pyrolysis [4,5]. This can reduce their charge storage capacity compared to other wood types, such as maple and birch, and have been proven to be effective electrode materials [6]. Recognizing the need to increase charge storage capacity, researchers have developed numerous biochar modification approaches, including physical, chemical, and biological modifications.
The most common physical modification includes the steam gasification to increase the surface areas and improve the surface morphologies through the surface corrosion of the biochar and syngas release [7]. Biological treatment is based on the principle that microbial surfaces are rich in functional groups (amino, carbonyl, carboxyl, and hydroxyl groups), which has improved the sorption properties of biochar through surface grafting [8]. Chemical modification is among the most widely used technique to enhance material properties. It primarily includes acid treatment, alkaline treatment, oxidizing agent modification, and the use of metal salts or oxidizing agents [9]. Compared to relatively mild reagents such as transition metal salt solutions, strong acid and base modification agents such as H2SO4 or NaOH lead to secondary pollution and require stringent handling protocols [10].
Transition metals oxides (TMOs) have been widely investigated as electrode materials because of their exceptional properties, such as structural flexibility, conductivity, environmental and cost friendliness, and high specific capacitance [11]. The metal salt solution produces the corresponding oxides during pyrolysis, and the innovative integration of biochar with magnetic transition metals and TMOs to produce magnetic biochar enhances catalytic efficiency by improving porosity, surface area, and active sites [11]. Zhang et al. [12] clearly indicated that the formation of iron oxide in granular-size porous biochar pretreated with impregnated FeCl3 solution generated carbonyl and carboxyl groups after pyrolysis. Meanwhile, magnetic biochar doped with iron and iron oxides exhibited rougher contact surfaces compared to pristine biochar [12]. Therefore, FeCl3 was regarded as the one of modifier agents in this experiment.
Compared to FeCl3, citrate, an organic acid salt with low molecular weight, is naturally abundant, eco-friendly in terms of green chemistry, and exhibits properties similar to those of citric acid [13,14]. Citrate salt can provide the required acid environment, which can introduce acidic functional groups, such as carboxylic groups, onto the surface of carbonized materials. This modified biochar exbibits impressive porosity, with the multiple functional groups increasing the sorption affinity and capacity for electrolyte ions by promoting charge exchange and surface complexation through newly formed active sites [15,16]. Ferric citrate is now widely used as an effective modification agent, with the advantages of being inexpensive and having the capability to improve biochar’s physicochemical and surface chemical properties, including specific surface area, pore size, molecular weight, cation exchange capacity, and the quantity and variety of functional groups [17]. In previous studies, citrate was predominantly used as a post-modifier to enhance biochar properties following pyrolysis. For instance, Wang et al. [18] demonstrated the use of ammonium citrate to post-modify ground biochar particles, creating a highly efficient adsorbent for trivalent lanthanum.
In this experimental study, we took a different approach by focusing on the pre-modification of the raw materials before pyrolysis. Meanwhile, we focused on the idea of pre-modification through metal salt solution impregnation of thick biochar monolith compared to general powdery or granular biochar. The enhancement in birch wood biochar monolith’s electrochemical performance for supercapacitor applications was pursued through the wood monolith impregnation of a ferric solution including the traditional modification agent FeCl3 and eco-friendly C6H5FeO7. The differences in the material and electrochemical characteristics between these two ferric pre-modifiers were observed as well.

2. Materials and Methods

2.1. Sample Preparation

Birch, predominantly found in the eastern part of Canada, widely thrives in cool, moist, and well-drained soil, especially in mixed hardwood forests. Birch turning squares, obtained from KJP Select Hardwood, Ottawa, ON, Canada, were cut into identical rectangular pieces (20 × 10 × 7 mm) and dried at 100 °C in an oven for 3 h until no weight change was measured. Ferric chloride power and ferric citrate powder were obtained from Sigma-Aldrich, St. Louis, MO, USA. The powder was weighed and dissolved in deionized water to prepare sample solutions with three distinct concentrations: 0.5, 0.7, and 1.0 M. The pieces were then submerged in the prepared ferric citrate or ferric chloride solution at 90 °C under stirring for 48 h. After submersion, the samples were allowed to air dry for 3 h before the final drying in the oven at 100 °C for another 3 h. KOH pellets, obtained from Sigma-Aldrich, were dissolved in deionized water to prepare 4 M KOH solutions.
The birch pieces after the pretreatments are shown in Figure 1.

2.2. Pyrolysis of Biochar Monolith and Cell Assembly

One untreated wood piece and two wood pieces treated with different ferric solutions were held in a metal mesh basket and lowered into the center of a vertical tube quartz furnace (125 cm in length and 10 cm in diameter) for pyrolysis. The heating parameters settings were obtained from Byrne and Nagle’s U.S. patent [19] to avoid crack formation in the biochar monolith. Low heating rates were applied in the proposed pyrolysis to avoid the explosive evaporation of the wood’s moisture and reach a stable and high carbon yield [19]. Grade 5.0 nitrogen gas was used at a flow rate of 400 mL/min throughout the pyrolysis to achieve anaerobic conditions. The pyrolysis schedule was divided into six continuous stages with holding temperature points of 90, 200, 400, 600, 800, and 1000 °C, with associated predefined heating rates of 8.3, 2.5, 1.3, 3.3, 6.7, and 6.7 °C/min, respectively, as presented in Table 1. After completing the 6th step and reaching a temperature of 1000 °C, the system was cooled to room temperature with nonstop nitrogen gas supply for approximately 18 h.
After cooling to room temperature, each thick biochar piece was cut into two pieces, and these pieces were ground to the same weight (±0.001 g), a similar square cross-section, and the same thickness of 1.7 mm (±0.05 mm) using 100-grit and 200-grit sandpaper. The ground biochar pieces were ultrasonically cleaned in 95% ethanol to remove the debris from the material’s surface. The pieces were then boiled in 4 M KOH for 1 h to increase their wettability and ion transport ability.
The groups of samples were labeled as ‘Untreated Birch’ for the unmodified birch biochar monolith; ‘FeCl3-0.5 M’, ‘FeCl3-0.7 M’, and ‘FeCl3-1.0 M’ for the birch biochar monolith pretreated with the corresponding FeCl3 solution; ‘FC-0.5 M’, ‘FC-0.7 M’, and ‘FC-1.0 M’ for the birch biochar monolith pretreated with the corresponding C6H5FeO7 solution.
A cell was assembled based on the schematic drawing shown in Figure 2. A pair of birch biochar electrodes was carefully aligned in parallel with each other and separated with a fibrous polysulfone separator 1 mm thick. The middle porous separator and two nickel wire meshes on the sides completely covered the cross -section of the biochar electrode. The upper side of the mesh was stripped of the transverse nickel wire structure and rolled into an extended wire. The extended wire was connected to the poles of the electrochemical measurement station. The entire system was tightly held in place by screwed Lucite plastic plates (5 × 5 × 0.5 cm) submerged in a 4 M KOH solution as the electrolyte. There were four screws located at the corners of the plastic plates that passed through the plates. Nuts held the screws on the other plate.

2.3. Characterizations of Biochar Material

2.3.1. X-Ray Diffraction

The composition of the birch biochar, both with and without pre-modification, was analyzed using X-ray diffraction (XRD). The untreated and birch biochar pieces treated with 1.0 M FeCl3 and 1.0 M C6H5FeO7 were powered for X-ray diffraction using a Rigaku MiniFlex 600 (Rigaku, Tokyo, Japan). The diffraction pattern was analyzed by comparison with the Joint Committee on Powder Diffraction Standards (JCPDS) cards from the International Centre for Diffraction Data.

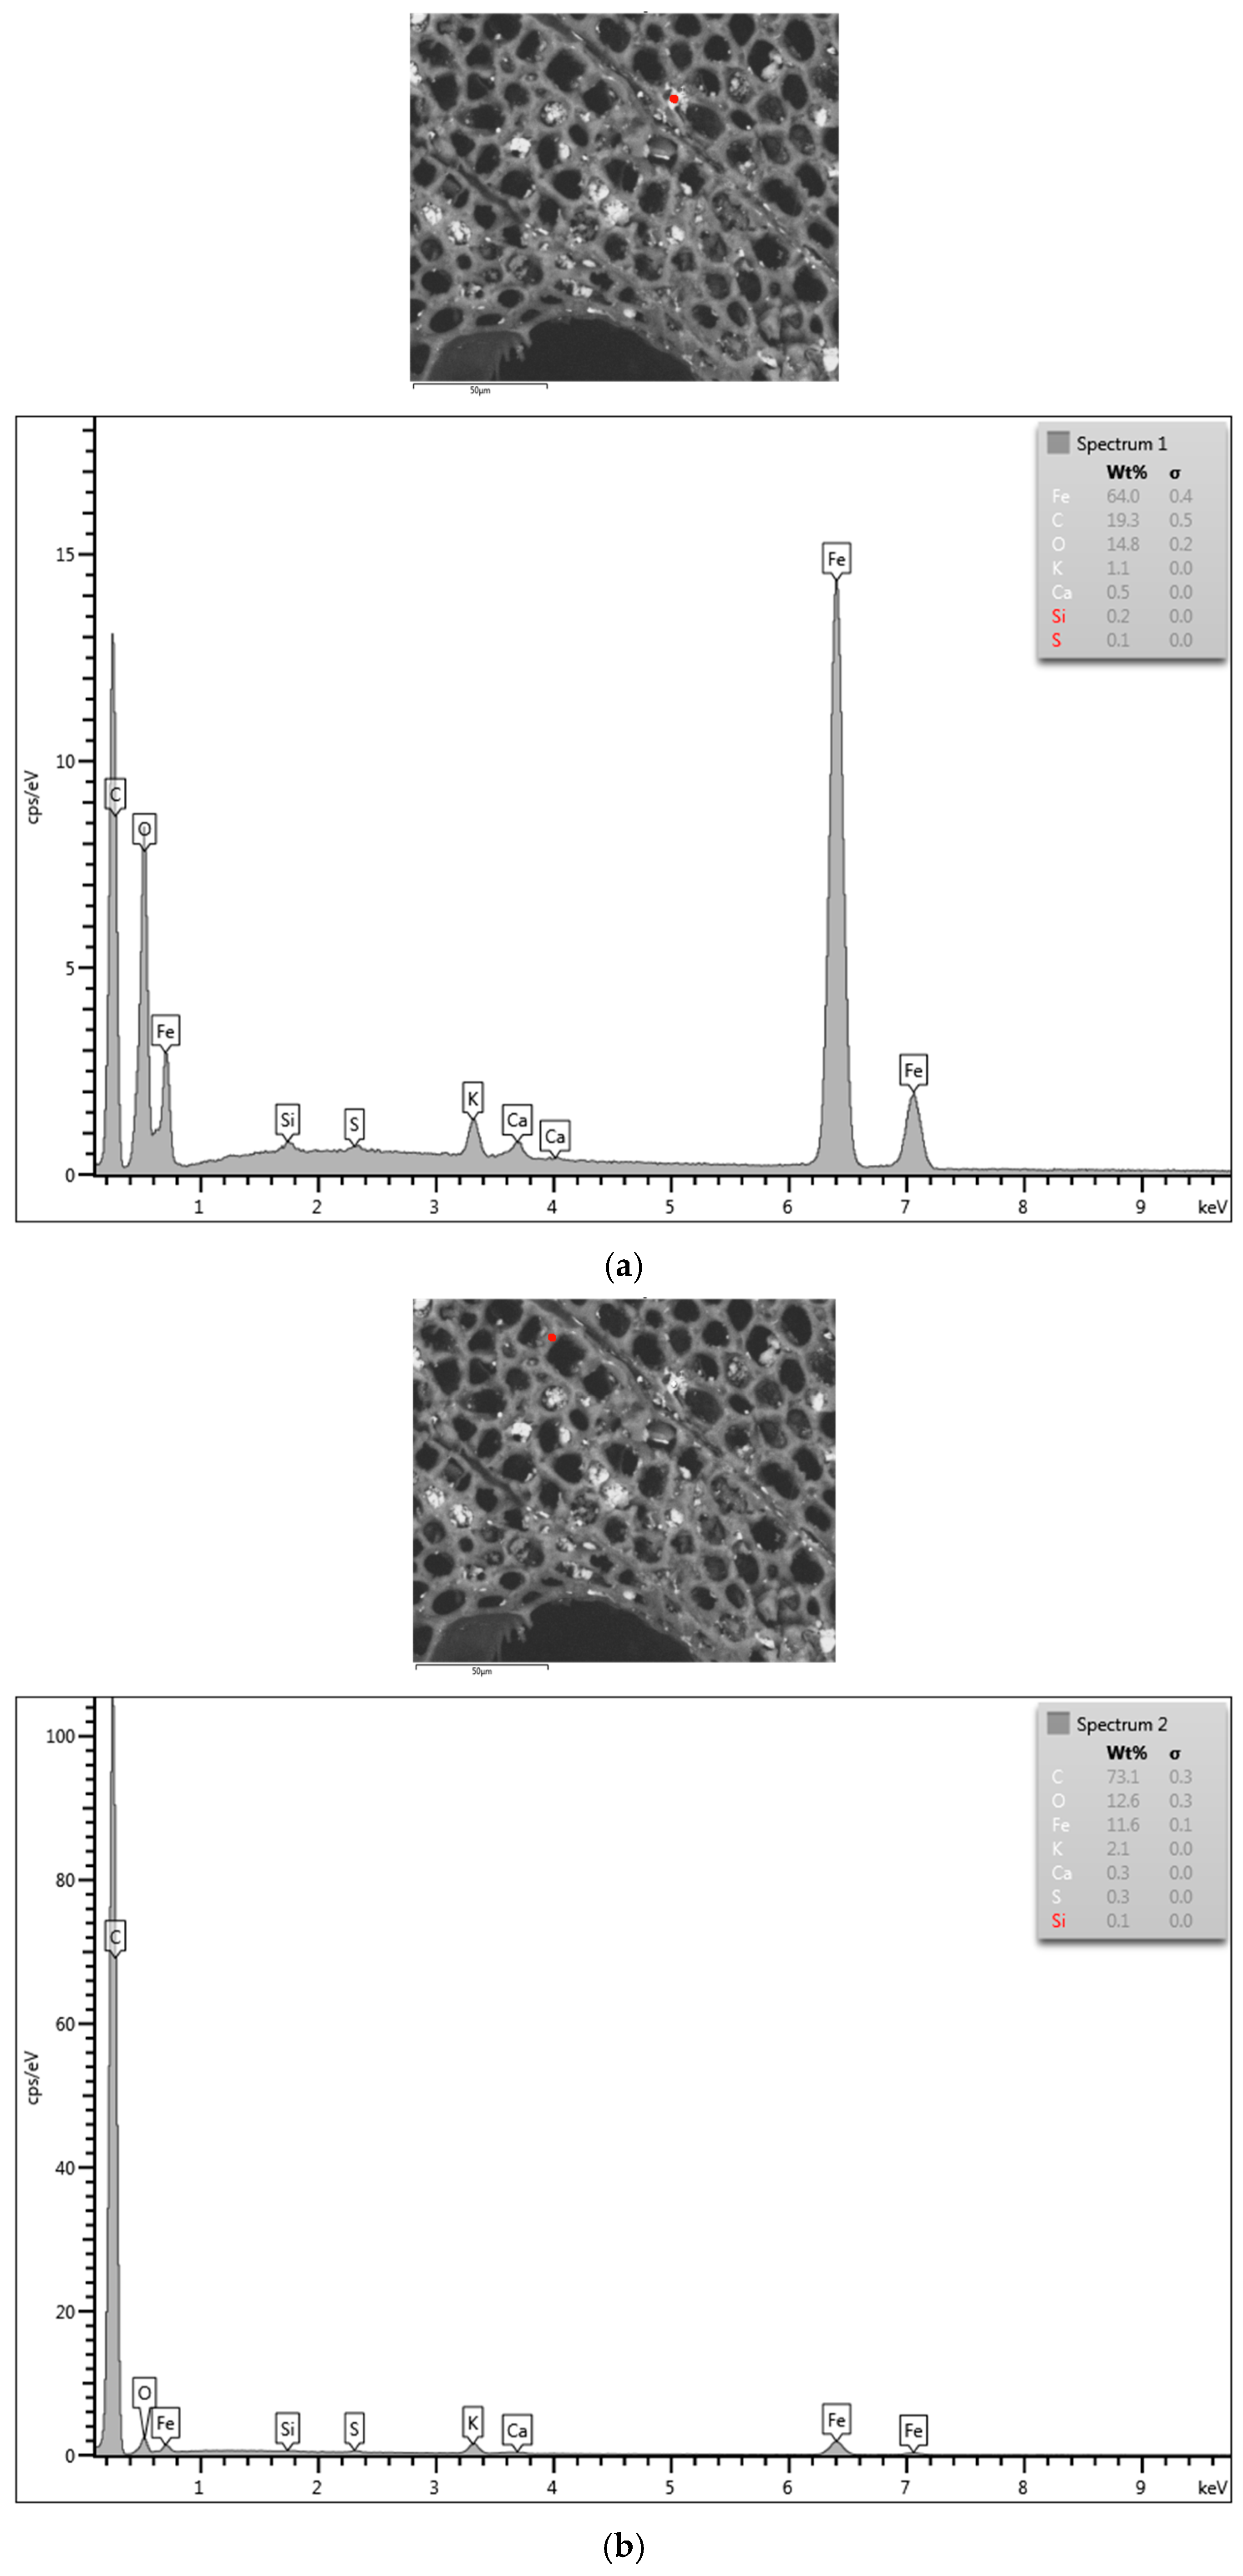
2.3.2. Scanning Electron Microscopy Analysis

The surface morphology of the biochar samples was analyzed using scanning electron microscopy (Hitachi SU3500 SEM, Hitachi, Tokyo, Japan) at high resolution. Two specific locations chosen on the material surface were investigated by Energy-Dispersive X-ray Spectroscopy (EDX) to determine their composition using AZtec software Version 6.1.

2.3.3. Surface Contact Angle

The contact angle of the liquid on the biochar surface indicated the wettability of the liquid to the biochar modified with ferric solution. The solid–liquid interface interactions of the biochar surface modified with FeCl3 and C6H5FeO7 were obtained by measuring the contact angle. Samples of untreated, FeCl3-1.0 M, and FC-1.0 M birch were placed on a horizontal measuring platform, while the capture camera was horizontally placed on the same platform. We made the 10 wt% isopropanol solution (IPA), as the contact angle indicator, by mixing amounts of isopropanol (99.5% purity, obtained from Sigma-Aldrich) in deionized water. The liquid droplets (~5 μL) on the material’s horizontal surfaces were captured, and the angles in the captured images were determined using the angle tool of ImageJ Version 1.54 j.

2.4. Electrochemical Characterization of Biochar Supercapacitor

Two nickel mesh current collectors with extended tabs, as shown in Figure 2, were connected to a Solartron Sl 1280B (Solartron Analytical, Leicester, UK) potentiostat to perform galvanostatic charge–discharge (GCD), cyclic voltammetry (CV), and electrochemical impedance spectroscopy (EIS). All the supercapacitor tests included a pre-cycle at 300 mA/g for 100 charge–discharge cycles in the 0–1.0 V potential range prior to conducting any measurement. The pre-cycle tests increased data reproducibility.

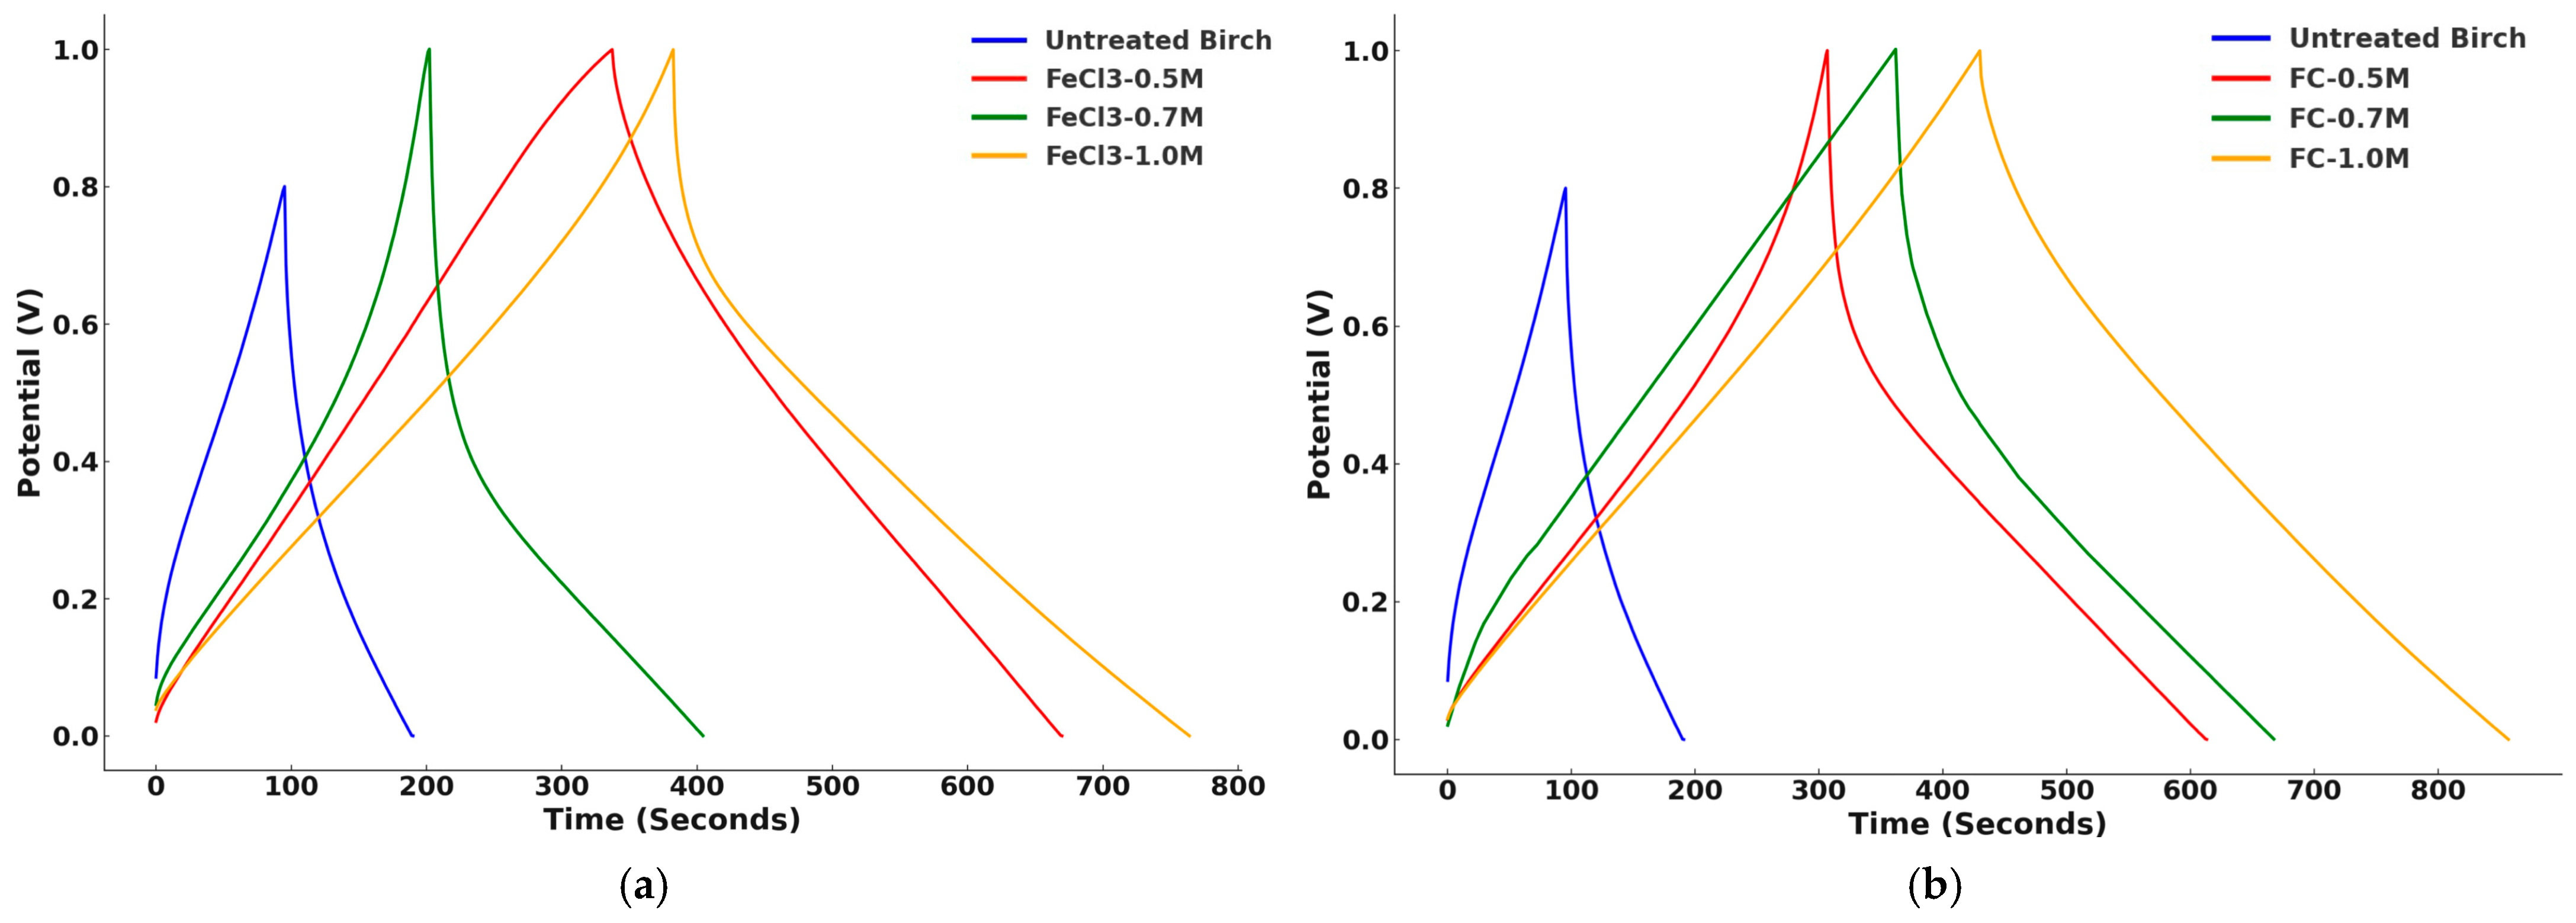
2.4.1. Galvanostatic Charge–Discharge

In this study, GCD measurements were conducted by applying a constant current ranging from 5 to 200 mA/g to explore the electrochemical behavior of the biochar supercapacitor. This measurement offered the ability to directly calculate the gravimetric capacitance (F/g), which was normalized to the mass of the active electrode material using Equation (1) [20]:
C g = I m d V d t
where Cg is the gravimetric capacitance (F/g); I/m is the constant mass current density (A/g); dV/dt (V/s) represents the change rate of the voltage during the discharge process past the region of IR drop.

2.4.2. Cyclic Voltammetry

Cyclic voltammetry (CV) tests were conducted within a potential window of ±0.8 V, with the initial potential set at −0.8 V. The treated samples with the best GCD performance were selected for comparison with the untreated birch biochar. A standard scan rate of 20 mV/s was applied across all groups to establish a consistent baseline for comparison. The choice of this voltage range and scan rate allowed a good evaluation of the material’s performance.

2.4.3. Electrochemical Impedance Spectroscopy

In this study, electrochemical impedance spectroscopy (EIS) (by Solartron Sl 1280B) was performed to investigate the electrode–electrolyte interface behavior of the biochar-based supercapacitors produced using untreated birch biochar, FeCl3-1.0 M, and FC-1.0 M over the frequency range of 0.05–20,000 Hz. The Randles equivalent circuit model was used and analyzed based on the Nyquist plot. The Python 3.12 fitting method was used to export the electrolyte resistance (Rs), the charge-transfer resistance (Rct), and Warburg impedance (Zw) via impedance package analysis.

2.4.4. Supercapacitor Retention

The retention of the supercapacitors was analyzed to reflect the supercapacitor’s durability for long-term use and examine the pseudo-capacitance resulting from the potentially irreversible redox reactions that occurred in some groups. Testing was conducted using the galvanostatic charge–discharge method at a current density of 0.5 A/g within a potential window of 0–1.0 V. Gravimetric capacitance values were recorded and calculated every 80 cycles over a total of 3520 cycles.

3. Results and Discussion

3.1. Recorded Mass of Materials

To investigate each material’s response to chemical treatment and pyrolysis processing, the precise tracking of the mass analysis was conducted at different stages: (1) of the cut wood pieces before placement in the oven; (2) of the pieces after the first drying for 3 h; (3) of the treated pieces after submerging and drying; (4) of the biochar pieces after pyrolysis at room temperature. The mass data are reported in Table 2 and Table 3. The mass analysis revealed distinct trends in the behavior of the wood samples during pre-modification.
For the samples treated with C6H5FeO7, the mass increased between the two drying stages and became more pronounced as the concentration of the ferric solution increased, indicating greater mass retention at higher concentrations. The FeCl3-treated samples, conversely, showed a consistent decrease in mass following modification and drying, reflecting an interaction between the FeCl3 solution and the wood material. Based on the findings of Gao et al. [21], where 25 mM FeCl3 hydrolysis at 160 °C for 50 min caused high lignin removal (75.5%) from switchgrass, it is likely that FeCl3 plays a similar role in lignin removal from birch wood. This aligns with the observed mass reductions in the FeCl3-treated samples, suggesting that the chemical modification facilitated lignin extraction from the wood. Figure 3 illustrates the color transformation of the 1.0 M FeCl3 solution before and after immersing the wood pieces for 2 days, indicating large amounts of lignin in the post-modification solution.

3.2. X-Ray Diffraction Results of Biochar Samples

The X-ray diffractometer results of the untreated and treated samples are shown in Figure 4.
The untreated birch showed two broad peaks, while the treated biochar slices subjected to ferric solution pretreatment exhibited multiple major and minor peaks in the 30–50° interval, corresponding to the formation of iron-based compounds. The raw XRD data were compared to the standard diffraction data. Figure 5 illustrates the alignment of the experimental data with the standard XRD patterns.
Peaks were observed at 30.3°, 35.3°, 43.4°, 53.5°, 56.8°, and 62.6°, well matching the standard diffraction peaks of magnetite (Fe3O4) of JCPDS card No. 03-0863, shown as yellow vertical lines in Figure 5, representing the (220), (311), (400), (422), (511), and (440) crystal faces of magnetite, respectively. The two diffraction peaks at 44.68° and 65.05° were consistent with the standard diffraction peaks of iron (Fe) per JCPDS card No. 06-0696, shown as purple vertical lines in Figure 5, representing the (110) and (200) crystal faces of iron. These diffraction peaks confirmed the successful loading of iron and oxides of bivalent and trivalent iron in the modified biochar. Conversely, the untreated birch biochar with broad peaks (approximately 2θ = 24° and 44°), indexed as the (002) and (101) planes, supported the presence of amorphous carbon in the biochar [22].

3.3. Scanning Electron Microscopy Results of Biochar

After X-ray analysis, the untreated birch biochar, FeCl3-1.0 M biochar, and FC-1.0 M biochar samples were separately rinsed using deionized water in an ultrasonic water bath for 15 min to wash off any impurities on the materials’ surfaces for SEM analysis. We used 200, 500, 800, and 1000 times magnification for each sample. The 500× backscattered electron images are presented in Figure 6, which were used to evaluate the surface features.
These results indicated that the birch biochar contained numerous <10 µm micropores and fewer ~100 µm macropores. The pore arrangement in the FeCl3-modified biochar retained the same fixed orientation as the unmodified birch biochar. The SEM captures of the pre-modified samples showed white granular deposits randomly embedded in the micropores for FeCl3-1.0 M and FC-1.0 M. The comparison between the FeCl3-1.0 M and FC-1.0 M micrographs showed that the ferric citrate modification obviously changed the morphology of the surface matrix of the carbons. The white attachments on the surface clearly indicated better adhesion compared to FeCl3-1.0 M. The red-circled region in Figure 6c reveals a distinctive feature: the increased presence of smaller micropores. This structural enhancement facilitated the embedding of white particles, resulting in a brighter biochar surface and the formation of characteristic white clusters in specific areas. The findings are consistent with those in previous work by Cheng et al. [23], who demonstrated the dual functionality of citrate as a precursor and a modifier in the synthesis of porous carbons via the green self-pyrolysis of citrate. And, during pyrolysis, the metal components in citrate are transformed into inorganic carbonates, which act as efficient activators to expand the pore structure [24]. Similarly, our experimental results confirmed that ferric citrate significantly enhanced the development of carbon micropores and promoted particle embedding. This was achieved through the self-pyrolysis process and the formation of carbonates during pyrolysis, further validating the dual role of citrate as an activator and a structural modifier during carbon material synthesis.
EDX was used to analyze the elemental composition of the white inclusions in the treated sample, as shown in Figure 7. The red dots in Figure 7 show the EDX test locations on an FeCl3-1.0 M sample. Red dot (a) centers on a white particle, and the spectrum demonstrates that the deposit was predominantly Fe. While red dot (b) was randomly chosen on the biochar surface beyond the white particles, and the spectrum presents the dominant peak of carbon. And, the comparison of the two EDX spectra shows that there is an oxygen signal associated with the particulate but not the biochar, consistent with the XRD analysis, which showed Fe3O4 as well as Fe. The elemental mapping in Figure 8 clearly shows the iron-rich particulates were attached to the carbon substrate, and the 5 µm particles were conglomerates of smaller ~1 µm particles. This indicates that there were significantly more iron-rich particulates deeper than just on the material’s surface and within the pores, as shown won in the original SEM image. It is likely that some iron species were much more deeply attached inside the pores, beyond the depth of the XRD analysis.

3.4. Contact Angle Measurements of Biochar Slices

The electrolyte wetting of the treated biochar monolith was an important indicator of capacitance performance; thus, contact angle measurements were undertaken. Three samples, untreated birch biochar, FeCl3-1.0 M biochar, and FC-1.0 M biochar, were boiled in KOH solution in a beaker on a hot plate at 270 °C for 1 h. The addition of the IPA to the deionized water monotonically decreased the contact angle due to the reduction in liquid surface tension. Therefore, it facilitated the visual distinction of the contact angle between the untreated and treated biochar pieces. Figure 9 illustrates horizontal images of a liquid droplet on the biochar surface.
The captured images, converted to grayscale, were imported to ImageJ to measure the angle between the tangent to the droplet and the surface. The contact angles are presented in Table 4. As illustrated in the table, the introduction of FeCl3 resulted in a 20% reduction in the contact angle of the biochar surface compared to that of the untreated biochar. This is similar to the findings of Li et al. [25], who noted that residue biochar modified with FeCl3 had increased hydrophilic performance, which was attributed to its higher specific surface area, more abundant functional groups, and impregnation with iron during modification. Notably, the most significant decrease in contact angle was observed for the FC-1.0 M biochars, which presented the best wettability among the three groups. The improved wettability, facilitated by the increased hydrophilicity, was reported to enhance the ionic transport kinetics of the electrolyte according to Chai et al. [26].

3.5. Analysis of Electrochemical Properties of Modified Biochar

3.5.1. Galvanostatic Charge–Discharge

The samples were conditioned using a pretest-cycling procedure to stabilize the system. Following pretest cycling, the cell underwent two entire cycles of charge and discharge processes. The charge/discharge results of the untreated and treated biochar cells were reproducible, and the data from the second cycle were utilized for the subsequent calculations and analyses. The supercapacitors were tested under six current densities, including 5, 10, 20, 50, 100, and 200 mA/g. The combined data under the 100 mA/g current density are shown in Figure 10 as an example.
The figure clearly illustrates that the GCD time of biochar modified with ferric solution was substantially higher in comparison to that of the unmodified biochar. FeCl3-1.0 M and FC-1.0 M demonstrated the longest time for charge and discharge, indicative of their highest specific capacitance. The associated gravimetric capacitance of each sample was calculated under each current density, shown in Table 5 and Figure 11 in detail. The calculations are presented in Appendix A.
The figure shows that the treated samples were significant improvements over the untreated samples in terms of gravimetric capacitance. The proposed pre-modified supercapacitors had better specific capacitance than the ones of Caguiat et al. [27], with the same battery setup and parameters, and a similar one to microporous hardwood biochar (13–21 F/g in the range of 5–25 mA/g from Caguiat et al.). The capacitance of all biochar samples decreased with the increase in current density. The FeCl3-1.0 M-treated samples (red curve) showed the highest capacitance at 5 mA/g, exceeding 200 F/g. At low current density, the enhanced charge accumulation at the surface facilitated the capacitance development. The capacitance for this modification decreased rapidly as the current density increased, converging around 110 F/g over 200 mA/g. At lower current densities, more of the electrode’s surface and active sites contributed to charge storage, but as current density increased, the reduced reaction time limited this, leading to lower capacitance. The treated samples all had better convergence than the untreated birch at higher current densities. Furthermore, at the lower concentrations, the FeCl3-0.5 M and FeCl3-0.7 M samples had similar trends but much lower capacitances than those at the highest concentration (FeCl3-1.0 M), with FeCl3-0.7 M performing slightly better than FeCl3-0.5 M. FC-1.0 M (red curve) showed similar behavior to FeCl3 in terms of having the highest gravimetric capacitance at low current densities, which decreased sharply as the current density increased. The FC-0.7 M and FC-0.5 M curves followed this trend at lower capacitances but correspondingly performed better than the FeCl3 groups. Ferric citrate modification had an even greater effect at all concentrations than FeCl3. It could be inferred from the SEM results that the capacitance performance was better because of the iron-rich particulate distribution on the biochar surface of the samples in the modified groups. The SEM images of the ferric citrate group further revealed denser and smaller surface micropores as well as a wider distribution of iron-rich particles, along with the presence of magnetite and iron clusters in specific regions. These findings again show that the biochar monolith, pre-modified with ferric citrate, had an increased number of active sites, which contributed to its enhanced charge storage capacity. Meanwhile, its better wettability contributed to the capacitance improvement by promoting the ionic transport kinetics of the electrolyte in the supercapacitors. Any reversible or irreversible reactions and the pseudo-capacitance of the treated groups were further revealed by cyclic voltammetry.

3.5.2. Cyclic Voltammetry

To elucidate the rationale behind the increase in the capacitance following the modification, CV tests were conducted. The potential window for the experiment was ±0.8 V, with the initial potential established at −0.8 V. A standard scanning rate of 20 mV/s was employed as a baseline. Figure 12 illustrates the combined CV graph of an untreated biochar sample and two samples treated with 1.0 M FeCl3 and C6H5FeO7 within the ±0.8 V potential window at a scanning rate of 20 mV/s. The CV for the untreated birch group did not exhibit any significant redox characteristic peaks throughout any of the cycle. This result indicated a lack of significant pseudo-capacitance in the untreated birch biochar electrode; the behavior was dominated by electrical double-layer capacitance. The small peaks could have been the result of the carboxyl or phenol groups on the biochar surface, which were reported in Oh et al.’s finding [28]. The modified samples exhibited significantly enhance electrochemical performance compared to the untreated birch in the CV graph. The CV peaks demonstrated redox reactions on the electrode, increasing the supercapacitor performance via Faradaic pseudo-capacitance. The enclosed areas of the three curves were calculated, shown in Table 6, which proved the differences in the materials’ capacitance, agreeing with the results of the GCD test, where FC-1.0 M had the best energy storage, while the untreated birch had the worst performance. The micropores of the porous carbons generated from citrate self-pyrolysis accommodated the most charges as well, probably contributing to its largest enclosed CV curve.
In addition to the comparisons with untreated birch, the reversible and irreversible redox reactions, as revealed by the curves’ peaks, were analyzed between the 1.0 M FeCl3 and 1.0 M C6H5FeO7 groups. The calculated potential peaks and absolute current peaks for both the oxidation and reduction directions are presented in Figure 12 and shown in Table 7. The detailed calculation method is provided in Appendix B.
From Table 7, for FeCl3-1.0 M and FC-1.0 M, the ratios of the absolute current peaks were both close to one, while the peak-to-peak separation potential (ΔEp) values were different. The ΔEp of FeCl3-1.0 M was 50 mV (standard <57 mV @ 25° for reversible process), indicating a reversible redox reaction on the electrodes of the FeCl3-1.0 M supercapacitors [29]. The ΔEp of FC-1.0 M (~65 mV) implied that a slight irreversible process occurred on the material’s surface [29]. Citrate can introduce more oxygen functional groups such as carboxyl groups to the surface of biochar [30]. He et al. [31] specifically revealed different electrode/electrolyte interface phenomena in the low, middle, and high potential CV region with the participation of oxygen functional groups, and they emphasized that the process of the hydrated K+ insertion/de-insertion reaction that occurred in the pore was quasi-reversible due to the squeezing from those functional groups. Despite this, the presence of some micropores and oxygen functional groups barely blocked the diffusion path of the hydrated ions to the bulk solution. The following equation indicates this process in an alkaline KOH electrolyte (where > represents the biochar surface) [31].
> C x O + H 3 O + + e > C x O H H 2 O
The observed peaks are related to the redox processes of iron species probably taking place at the triple Fe/Fe3O4/electrolyte interface [32]. The existence of iron species in the 4 M KOH electrolyte (pH = 14) might have been the crystalline forms of Fe(OH)3 and Fe(OH)2 sourced from magnetite based on the stability-field diagram in aqueous conditions (Figure 13), as concluded by Back and Barnes [33]. The two peaks might have resulted from the one-electron transfer between Fe(OH)3 and Fe(OH)2 in the cycle in both the FeCl3-1.0 M and FC-1.0 M groups. However, the electrode modified with C6H5FeO7 had an enhanced current response and larger area under the CV curve, and the kinetic differences in the internal system between two ferric solution groups were evaluated using electrochemical impedance spectroscopy.

3.5.3. Electrochemical Impedance Spectroscopy (EIS) and Supercapacitor Retention

Electrochemical impedance spectroscopy was conducted to investigate the behavior of the electrolyte resistance (Rs), the charge-transfer resistance (Rct) over the electrode–electrolyte interface, and the Warburg impedance (Zw). Figure 14 shows the complex combined Nyquist plot of the untreated birch, FeCl3-1.0 M, and FC-1.0 M on the same scale of –Z’’ and Z’, with the region of –2 Ω –Z’’ and Z highlighted’. The results are consistent with the Faradaic EIS based on the Randles equivalent circuit model [34]. Figure 15 presents the data fitting results of the three groups obtained with the Python impedance package. The fitting results are satisfactory and consistent with the model settings. The untreated birch had the best fitting result, while the fitting of FC-1.0 M was the worst. The Rs, Rct, and Zw of the three groups were calculated by Python based on the Randles circuit input, which are presented in Table 8. The Python script is provided in Appendix C.
Bulk electrolyte resistance refers to the resistance encountered by ions as they move through the electrolyte in an electrochemical cell. The Rs values of the three groups intersected within the values of the uncertainty range given by Python, which was consistent with the actual situation for the same 4 M KOH electrolyte. The charge-transfer resistance of the electrode–electrolyte interfacial region correlated with the high-frequency semicircle region. This refers to the resistance to the flow of electrons during the redox reactions at the interface between the electrode and the electrolyte. The observed semicircle diameters followed the trend FC-1.0 M < FeCl3-1.0 M < untreated birch, which corresponded to the increases in the Rct results. A lower Rct implies the kinetics of the heterogeneous electrochemical process are faster [34]. The best redox kinetics of FC-1.0 M correlated with the higher current response peak accelerating the electron transfer in the CV results, while the untreated birch’s redox current peak was not significant. The low-frequency region revealed the Warburg impedance of the ions on the electrode. The Warburg impedance expresses the difficulty of the mass transport of redox or electroactive species to an electrode surface [34]. From the values in Table 8, the Warburg impedance was the most significant factor affecting the system’s impedance. The highest Warburg impedance of the untreated birch indicated it had the lowest ion diffusion, while the treated samples showed a dramatic decrease in diffusion, with the doped redox iron species being more quickly transported under redox kinetics. The lowest Warburg impedance was observed for FC-1.0 M, indicating its better ion diffusion characteristics compared with FeCl3-1.0 M. The denser distribution of the iron species found in the SEM results and the improved wettability facilitating ion transfer could be the factors that influenced ion diffusion.
The capacitance retention and Coulombic efficiency were investigated to confirm the cycling stability of the biochar supercapacitors treated with FeCl3-1.0 M and FC-1.0 M via GCD at a 0.5 A/g current density under a 0–1.0 V potential window for 3520 cycles.
Figure 16 combines the results of two groups. The gravimetric capacitance values both converged to 90–94 F/g after 3520 cycles, while the decrease in the C6H5FeO7 group was larger than in the FeCl3 group. After calculation, the capacitance retention of FC-1.0 M was 81.9%, omitting the first two data points as outliers, after 3520 cycles, while that of FeCl3-1.0 M was 85.0%, when ignoring the outliers. Although the gathering of oxygen functional groups in the pores improved the electrode wettability, the observed irreversible process still prevented hydrated ions from entering the pores during the insertion/de-insertion reaction, which negatively affected the capacitance retention [33]. The effects of the functional groups introduced by the citrate and iron oxides on the surface chemistry, including micropore morphology, functional groups, and their electron transfer, need to be further studied.

4. Conclusions

A thick biochar monolith was pre-modified with FeCl3 and C6H5FeO7 solutions, and the surfaces and pores of the modified biochar monolith were successfully loaded with Fe3O4 and Fe species. SEM showed that the surface morphology of the biochar changed, leading to denser embedded iron-rich particulates via citrate self-pyrolysis in the 1.0 M C6H5FeO7 group. The contact angle measurements of the modified birch biochar demonstrated enhanced wettability and ion mobility, particularly for the C6H5FeO7-treated groups. The optimal concentration of the biochar modified with the two solutions was 1.0 M among three gradients of concentrations (0.5 M, 0.7 M, and 1.0 M), and its electrochemical performance was the highest. Its gravimetric capacitance at a current density from 5 mA/g to 200 mA/g was the highest among the concentration gradients. The capacitance of the biochar modified with 1.0 M FeCl3 was 210 F/g at 5 mA/g, while the 1.0 M C6H5FeO7 group reached 219 F/g at the same current density, compared to the 83 F/g capacitance of the untreated birch biochar. The CV diagram revealed that the pseudo-capacitance in the capacitor increased due to the redox reaction of Fe(OH)2 and Fe(OH)3 on the surface of the material, and 1.0 M C6H5FeO7 had better capacitive performance than the 1.0 M FeCl3 group. EIS revealed that the 1.0 M C6H5FeO7 group had the best ion diffusion capacity and least charge-transfer resistance over the electrode–electrolyte interface, which contributed to its having the best kinetics in the electrochemical process. However, after 3520 charge/discharge cycles, the 1.0 M C6H5FeO7 group had a lower level of capacitance retention than FeCl3, indicating that the slightly irreversible process of electron transfer on the electrode surface, from the possible side effects of the functional groups, potentially lad to the capacitance drop in the high-potential charge–discharge process.
This overall suggests that the magnetite and iron enhanced the capacitance of the supercapacitor, shedding light on a crucial aspect of the metal salt impregnation of the pre-modified biochar monolith, which warrants further investigation and analysis to obtain a more comprehensive understanding. Meanwhile, the ferric citrate pre-modifier can offer better electrochemical properties or other performance advantages in biochar monolith supercapacitors compared to ferric chloride owing to its specific features, including its porous carbon source and functional group enrichment, which paves the way for further research on the influence of the evolution of citrate during pyrolysis on the surface chemistry of thick biochar monolith.

Author Contributions

Conceptualization, C.Q.J., D.W.K., T.F. and Z.S.; methodology, Z.S. and T.F.; software, Z.S.; validation, Z.S.; formal analysis, Z.S. and T.F.; investigation, Z.S. and T.F.; resources, Z.S., T.F. and C.Q.J.; writing—original draft preparation, Z.S.; writing—review and editing, Z.S. and D.W.K.; visualization, Z.S.; supervision, C.Q.J. and D.W.K.; funding acquisition, C.Q.J. All authors have read and agreed to the published version of the manuscript.

Funding

This research was funded by the Natural Science and Engineering Research Council (NSERC) of Canada, grant number 453859.

Data Availability Statement

The raw data supporting the conclusions of this article will be made available by the authors on request.

Conflicts of Interest

The authors declare no conflicts of interest.

Appendix A. Calculation of Gravimetric Capacitance

Specific calculations methods of gravimetric capacitance were based on the following revised equation and notes.
C g = 2 × I m × V t
where 2 represents the two electrodes’ materials in the cathode and anode; I is the discharge current recorded with CView software every second; m is the average mass of one electrode; ΔVt is the potential change in the range of every 10 data points in CView (potential change every 10-s interval).
The exported gravimetric capacitance was the last calculated capacitance of the second GCD cycle (the end of the discharge).

Appendix B. Calculation of CV Parameters

Ratio of cathodic and anodic peak current and peak-to-peak separation potential in cyclic voltammetry analysis were both acquired from the following calculation strategy.
Figure A1. A sample CV with the necessary calculation lines and physical quantities.
Batteries 11 00047 g0a1
The cathodic and anodic peak potentials could be directly acquired from the CV graph datapoints, which were the corresponding current peaks in the two scanning directions.
The cathodic and anodic peak currents were calculated. The red baseline was from the point which was the location that the curve began to increase to the peak, to another point, where the slope of the curve tangent line was equal to 0. The cathodic peak current, Ip,c, was the difference in the red baseline and current peak in the y-axis direction.
Half-wave potential: E1/2 = ½ (Ep,a + Ep,c)
Standard potential: E0 = Ep,a + Ep,c
Ratio of cathodic and anodic peak current = |lp,c/lp,a|
Peak-to-peak separation potential (ΔEp) = |Ep,a − Ep,c|

Appendix C. Python Script of EIS Data Fitting

From impedance import preprocessing:
Frequencies, Z = preprocessing.readCSV(’EISdata.csv’)
Frequencies, Z = preprocessing.ignoreBelowX(frequencies, Z)
From impedance.models.circuits import CustomCircuit
circuit = ‘R0-p(R1-Wo1,C1)’
initial_guess = [.01, .01, .05, 100, 1]
circuit = CustomCircuit(circuit, initial_guess = initial_guess)
circuit.fit(frequencies, Z)
print(circuit)

References

  1. Somerville, C. Cellulose Synthesis in Higher Plants. Annu. Rev. Cell Dev. Biol. 2006, 22, 53–78. [Google Scholar] [CrossRef]
  2. Woolf, D.; Amonette, J.E.; Street-Perrott, F.A.; Lehmann, J.; Joseph, S. Sustainable Biochar to Mitigate Global Climate Change. Nat. Commun. 2010, 1, 56. [Google Scholar] [CrossRef] [PubMed]
  3. Zhai, Y.; Dou, Y.; Zhao, D.; Fulvio, P.F.; Mayes, R.T.; Dai, S. Carbon Materials for Chemical Capacitive Energy Storage. Adv. Mater. 2011, 23, 4828–4850. [Google Scholar] [CrossRef]
  4. Pan, X.; Zhang, N.; Yuan, Y.; Shao, X.; Zhong, W.; Yang, L. Balsa-Based Porous Carbon Composite Phase Change Material with Photo-Thermal Conversion Performance for Thermal Energy Storage. Sol. Energy 2021, 230, 269–277. [Google Scholar] [CrossRef]
  5. Gabhi, R.; Tan, K.; Feng, T.; Kirk, D.W.; Giorcelli, M.; Tagliaferro, A.; Jia, C.Q. Intrinsic Electrical Conductivity of Monolithic Biochar. Biomass Bioenergy 2024, 181, 107051. [Google Scholar] [CrossRef]
  6. Zhang, L.; Jiang, J.; Holm, N.; Chen, F. Mini-Chunk Biochar Supercapacitors. J. Appl. Electrochem. 2014, 44, 1145–1151. [Google Scholar] [CrossRef]
  7. Agyekum, E.B.; Nutakor, C. Recent Advancement in Biochar Production and Utilization—A Combination of Traditional and Bibliometric Review. Int. J. Hydrogen Energy 2024, 54, 1137–1153. [Google Scholar] [CrossRef]
  8. Javanbakht, V.; Alavi, S.A.; Zilouei, H. Mechanisms of Heavy Metal Removal Using Microorganisms as Biosorbent. Water Sci. Technol. 2014, 69, 1775–1787. [Google Scholar] [CrossRef] [PubMed]
  9. Wang, J.; Wang, S. Preparation, Modification and Environmental Application of Biochar: A Review. J. Clean. Prod. 2019, 227, 1002–1022. [Google Scholar] [CrossRef]
  10. Sevilla, M.; Díez, N.; Fuertes, A.B. More Sustainable Chemical Activation Strategies for the Production of Porous Carbons. ChemSusChem 2021, 14, 94–117. [Google Scholar] [CrossRef] [PubMed]
  11. Naseem, K.; Tahir, A.; Khan, A.S.; Qin, F.; Usman, M.; Karamat, S.; Al-Salihi, M. Unlocking the Potential of Magnetic Bio-Char as a Low-Cost Cathode Material for the Supercapacitor Application. Mater. Today Commun. 2024, 39, 108764. [Google Scholar] [CrossRef]
  12. Zhang, Z.; Wang, X.; Wang, Y.; Xia, S.; Chen, L.; Zhang, Y.; Zhao, J. Pb(II) Removal from Water Using Fe-Coated Bamboo Charcoal with the Assistance of Microwaves. J. Environ. Sci. 2013, 25, 1044–1053. [Google Scholar] [CrossRef] [PubMed]
  13. Ekanayake, A.; Rajapaksha, A.U.; Ahmad, M.; Vithanage, M. Enhanced Adsorption of Hexavalent Chromium from Aqueous Solution by Citric Acid-Modified Biochar from Invasive Plant Biomass. Water. Air. Soil Pollut. 2023, 234, 461. [Google Scholar] [CrossRef]
  14. Liu, Y.; Zhang, L.; Zhang, Z.; Zhang, Y.; Guan, Y. Citrate-Modified Biochar for Simultaneous and Efficient Plant-Available Silicon Release and Copper Adsorption: Performance and Mechanisms. J. Environ. Manag. 2022, 301, 113819. [Google Scholar] [CrossRef] [PubMed]
  15. Rajapaksha, A.U.; Chen, S.S.; Tsang, D.C.W.; Zhang, M.; Vithanage, M.; Mandal, S.; Gao, B.; Bolan, N.S.; Ok, Y.S. Engineered/Designer Biochar for Contaminant Removal/Immobilization from Soil and Water: Potential and Implication of Biochar Modification. Chemosphere 2016, 148, 276–291. [Google Scholar] [CrossRef] [PubMed]
  16. Hama Aziz, K.H.; Fatah, N.M.; Muhammad, K.T. Advancements in Application of Modified Biochar as a Green and Low-Cost Adsorbent for Wastewater Remediation from Organic Dyes. R. Soc. Open Sci. 2024, 11, 232033. [Google Scholar] [CrossRef]
  17. Mihoub, A.; Amin, A.E.-E.A.Z.; Motaghian, H.R.; Saeed, M.F.; Naeem, A. Citric Acid (CA)–Modified Biochar Improved Available Phosphorus Concentration and Its Half-Life in a P-Fertilized Calcareous Sandy Soil. J. Soil Sci. Plant Nutr. 2022, 22, 465–474. [Google Scholar] [CrossRef]
  18. Wang, Y.-Y.; Lu, H.-H.; Liu, Y.-X.; Yang, S.-M. Ammonium Citrate-Modified Biochar: An Adsorbent for La(III) Ions from Aqueous Solution. Colloids Surf. Physicochem. Eng. Asp. 2016, 509, 550–563. [Google Scholar] [CrossRef]
  19. Nagle, D.C.; Byrne, C.E. Carbonized Wood and Materials Formed Therefrom. US6051096A, 26 September 2000. [Google Scholar]
  20. Ge, Y.; Xie, X.; Roscher, J.; Holze, R.; Qu, Q. How to Measure and Report the Capacity of Electrochemical Double Layers, Supercapacitors, and Their Electrode Materials. J. Solid State Electrochem. 2020, 24, 3215–3230. [Google Scholar] [CrossRef]
  21. Mao, L.; Zhang, L.; Gao, N.; Li, A. FeCl3 and Acetic Acid Co-Catalyzed Hydrolysis of Corncob for Improving Furfural Production and Lignin Removal from Residue. Bioresour. Technol. 2012, 123, 324–331. [Google Scholar] [CrossRef] [PubMed]
  22. Dell’Era, A.; Pasquali, M.; Tarquini, G.; Scaramuzzo, F.A.; De Gasperis, P.; Prosini, P.P.; Mezzi, A.; Tuffi, R.; Cafiero, L. Carbon Powder Material Obtained from an Innovative High Pressure Water Jet Recycling Process of Tires Used as Anode in Alkali Ion (Li, Na) Batteries. Solid State Ion. 2018, 324, 20–27. [Google Scholar] [CrossRef]
  23. Cheng, H.; Song, Y.; Bian, Y.; Ji, R.; Wang, F.; Gu, C.; Yang, X.; Ye, M.; Ouyang, G.; Jiang, X. Meso-/Microporous Carbon as an Adsorbent for Enhanced Performance in Solid-Phase Microextraction of Chlorobenzenes. Sci. Total Environ. 2019, 681, 392–399. [Google Scholar] [CrossRef] [PubMed]
  24. Zhang, Q.; Yan, B.; Feng, L.; Zheng, J.; You, B.; Chen, J.; Zhao, X.; Zhang, C.; Jiang, S.; He, S. Progress in the Use of Organic Potassium Salts for the Synthesis of Porous Carbon Nanomaterials: Microstructure Engineering for Advanced Supercapacitors. Nanoscale 2022, 14, 8216–8244. [Google Scholar] [CrossRef] [PubMed]
  25. Li, X.; Chu, S.; Wang, P.; Li, K.; Su, Y.; Wu, D.; Xie, B. Potential of Biogas Residue Biochar Modified by Ferric Chloride for the Enhancement of Anaerobic Digestion of Food Waste. Bioresour. Technol. 2022, 360, 127530. [Google Scholar] [CrossRef] [PubMed]
  26. Chai, W.; Wang, F.; Miao, Z.; Che, N. Hydrophilic Porous Activated Biochar with High Specific Surface Area for Efficient Capacitive Deionization. Desalination Water Treat. 2024, 320, 100617. [Google Scholar] [CrossRef]
  27. Caguiat, J.N.; Arpino, G.; Krigstin, S.G.; Kirk, D.W.; Jia, C.Q. Dependence of Supercapacitor Performance on Macro-Structure of Monolithic Biochar Electrodes. Biomass Bioenergy 2018, 118, 126–132. [Google Scholar] [CrossRef]
  28. Oh, Y.J.; Yoo, J.J.; Kim, Y.I.; Yoon, J.K.; Yoon, H.N.; Kim, J.-H.; Park, S.B. Oxygen Functional Groups and Electrochemical Capacitive Behavior of Incompletely Reduced Graphene Oxides as a Thin-Film Electrode of Supercapacitor. Electrochimica Acta 2014, 116, 118–128. [Google Scholar] [CrossRef]
  29. Elgrishi, N.; Rountree, K.J.; McCarthy, B.D.; Rountree, E.S.; Eisenhart, T.T.; Dempsey, J.L. A Practical Beginner’s Guide to Cyclic Voltammetry. J. Chem. Educ. 2018, 95, 197–206. [Google Scholar] [CrossRef]
  30. Zhang, P.; Duan, W.; Peng, H.; Pan, B.; Xing, B. Functional Biochar and Its Balanced Design. ACS Environ. Au 2022, 2, 115–127. [Google Scholar] [CrossRef] [PubMed]
  31. He, Y.; Zhang, Y.; Li, X.; Lv, Z.; Wang, X.; Liu, Z.; Huang, X. Capacitive Mechanism of Oxygen Functional Groups on Carbon Surface in Supercapacitors. Electrochim. Acta 2018, 282, 618–625. [Google Scholar] [CrossRef]
  32. Monteiro, J.F.; Ivanova, Y.A.; Kovalevsky, A.V.; Ivanou, D.K.; Frade, J.R. Reduction of Magnetite to Metallic Iron in Strong Alkaline Medium. Electrochim. Acta 2016, 193, 284–292. [Google Scholar] [CrossRef]
  33. Back, W.; Barnes, I. Relation of Electrochemical Potentials and Iron Content to Ground-Water Flow Patterns; Professional Paper; USGS Numbered Series; U.S. Government Printing Office: Washington, DC, USA, 1965. Available online: https://pubs.usgs.gov/publication/pp498C (accessed on 1 November 2024).
  34. Lazanas, A.C.; Prodromidis, M.I. Electrochemical Impedance Spectroscopy—A Tutorial. ACS Meas. Sci. Au 2023, 3, 162–193. [Google Scholar] [CrossRef] [PubMed]
Figure 1. Photographs of wood pieces; from left to right: (1) FeCl3-treated; (2) C6H5FeO7-treated; (3) untreated birch.
Batteries 11 00047 g001
Figure 2. A schematic drawing of a supercapacitor: (a) bolted plastic plate; (b) nickel mesh with extended current collector; (c) biochar electrode; (d) porous separator film; (e) 4 M KOH electrolyte.
Batteries 11 00047 g002
Figure 3. Color of FeCl3 solution before and after pretreatment (from left to right).
Batteries 11 00047 g003
Figure 4. X-ray diffraction patterns of the untreated birch and the treated birch (treated with 1.0 M FeCl3 and 1.0 M C6H5FeO7).
Batteries 11 00047 g004
Figure 5. The analyzed XRD of biochar compared to the PDF card with the Fe and Fe3O4 peaks highlighted.
Batteries 11 00047 g005
Figure 6. SEM images of backscattered electrons (BSEs) at 500× of (a) untreated birch; (b) FeCl3-1.0 M; (c) FC-1.0 M.
Batteries 11 00047 g006
Figure 7. EDX results of FeCl3-1.0 M biochar, with two selected spots highlighted by red dots (a,b).
Batteries 11 00047 g007
Figure 8. EDX spectral imaging of ×800 SEM of FeCl3-1.0 M sample (elements: (a) iron; (b) carbon).
Batteries 11 00047 g008
Figure 9. Images of a drop of solution on the biochar surface: (a) untreated birch; (b) FeCl3-1.0 M; (c) FC-1.0 M.
Batteries 11 00047 g009
Figure 10. GCD graphs of untreated birch biochar supercapacitors and ones treated with different concentrations of FeCl3 and C6H5FeO7 under 100 mA/g: (a) untreated birch and FeCl3 groups; (b) untreated birch and C6H5FeO7 groups.
Batteries 11 00047 g010
Figure 11. Gravimetric capacitances of (a) untreated birch vs. FeCl3 treated birch and (b) untreated birch vs. C6H5FeO7 treated birch.
Batteries 11 00047 g011
Figure 12. Cyclic voltammetry results of FeCl3-1.0 M and FC-1.0 M birch groups and untreated birch at ±0.8V potential window and 20 mV/s scanning rate.
Batteries 11 00047 g012
Figure 13. Stability-field diagram for aqueous ferric–ferrous system (Eh is the potential at the hydrogen electrode) [33].
Batteries 11 00047 g013
Figure 14. EIS data plotting of untreated birch, FeCl3-1.0 M, and FC-1.0 M.
Batteries 11 00047 g014
Figure 15. Data fitting results impoarted by Python: (a) untreated birch, (b) FeCl3-1.0 M, and (c) FC-1.0 M.
Batteries 11 00047 g015
Figure 16. Gravimetric capacitance (left vertical coordinate) and Coulombic efficiency (right vertical coordinate) of FeCl3-1.0 M and FC-1.0 M under 3520 cycles of charge/discharge processes.
Batteries 11 00047 g016
Table 1. The conditions of the 6 pyrolysis steps.
Step No.Heating Rate (°C/min)Final Temp (°C)Holding Time (min)
18.390180
22.52006
31.34006
43.36006
56.78006
66.710006
Table 2. Mass table of FeCl3 groups at 4 different stages.
Stage0.5 M0.7 M1.0 M
Mass (g)Change %Mass (g)Change %Mass (g)Change %
14.2131 4.8427 4.3845
23.7959.92%4.357610.02%3.95359.83%
33.240614.61%3.652516.18%3.66137.39%
41.243638.38%1.423438.97%1.488640.66%
Table 3. Mass table of C6H5FeO7 groups at 4 different stages.
Stage0.5 M0.7 M1.0 M
Mass (g)Change %Mass (g)Change %Mass (g)Change %
14.3928 3.472 2.8594
23.99349.09%3.124210.02%2.57449.97%
34.21215.48%3.41069.17%2.914213.20%
41.35732.22%0.91226.740.815127.97%
Table 4. Contact angle of untreated birch biochar, FeCl3-1.0 M biochar, and FC-1.0 M biochar.
SampleContact Angle θ
Untreated birch biochar83°
FeCl3-1.0 M66°
FC-1.0 M54°
Table 5. Summary of calculated gravimetric capacitance (F/g) from GCD.
Sample No.5 mA/g10 mA/g20 mA/g50 mA/g100 mA/g200 mA/g
Untreated Birch837873645345
FeCl3-0.5 M978884807976
FeCl3-0.7 M1059794929090
FeCl3-1.0 M210185161136125112
FC-0.5 M150130118111107102
FC-0.7 M183160140121116106
FC-1.0 M219187161138127117
Table 6. Calculated enclosed areas of CV curves (untreated birch, FeCl3-1.0 M, and FC-1.0 M).
Area (A·V/cm2)
Untreated Birch0.0754
FeCl3-1.0 M0.3211
FC-1.0 M0.4319
Table 7. Potential and absolute current peaks of FeCl3-1.0 M and FC-1.0 M.
Potential Peak (Volts)Absolute Current Peak (A/cm2)
OxidationReductionOxidationReduction
FeCl3-1.0 M0.53−0.580.079−0.075
FC-1.0 M0.73−0.660.065−0.064
Table 8. Calculated bulk electrolyte resistance (Rs), charge-transfer resistance (Rct), and Warburg impedance (Zw) of untreated birch, FeCl3-1.0 M, and FC-1.0 M.
Untreated BirchFeCl3-1.0 MFC-1.0 M
Rs (Ω)0.470.490.53
Rct (Ω)0.520.410.31
Zw (Ω)39.117.213.2
Disclaimer/Publisher’s Note: The statements, opinions and data contained in all publications are solely those of the individual author(s) and contributor(s) and not of MDPI and/or the editor(s). MDPI and/or the editor(s) disclaim responsibility for any injury to people or property resulting from any ideas, methods, instructions or products referred to in the content.

