1. Introduction
The global market share of the electrical vehicles has been growing exponentially in recent years. Lithium-ion battery (LIB) technology makes an important contribution to the electrification of power trains due to their high energy and power density, and long service time. Thanks to the great reduction of the battery prices in the last three decades, electric vehicle (EV) manufacturers can build high-capacity batteries in their flagship models to overcome the range anxiety [
1]. However, due to the cost burden and design restrictions, this approach is not suitable for Light EVs (LEV) and small/middle class EVs, which are very crucial for the universal electrification of mobility. Besides driving range, other criteria like purchase price, lack of charging infrastructure, and charging time are very important for customer acceptance of electromobility [
2].
In the last decade, the number of public chargers increased exponentially worldwide, and the share of fast chargers also grew [
3]. However, charging time depends not only on the capabilities of the charger, but also on the battery properties, environmental conditions, and charging protocol. The standard charging protocol for LIB is the constant current–constant voltage (CC-CV) [
4]. CC-CV is a two-stage protocol. In the CC-stage, the battery is charging at a constant current up to the upper voltage limit (e.g., 4.2
), and then in CV-stage, charging continues by constant voltage until a predefined cut-off current (e.g., 0.05 C, where C represents the charge rate at which a battery can be fully charged or discharged in one hour) [
5]. The CC-CV protocol is easy to implement, but it is not an optimal method for fast charging because of the very long CV phase. Increasing the current rate in the CC-Stage extends the charging time in CV-Stage, thus the reduction of the total charging time is limited. Moreover, high current rates can provoke lithium plating (Li-plating), i.e., deposition of metallic Li on the anode surface, which accelerates the irreversible energy and power degradation of the battery and can cause safety issues [
6]. Since automotive applications demand a long battery lifetime (e.g., 10–15 years) for economic feasibility, the effect of the charging protocol on the battery service life cannot be neglected.
Several charging protocols have been proposed in the literature to optimize the trade-off between charging time, charging efficiency, and service life. Refs. [
7,
8] provide a detailed summary of these charging protocols. Many studies show that Li-plating is the predominant aging and failure mechanism during charging [
9,
10]. Dendrite growth induced by Li-plating is considered one of the most critical factors triggering battery failures [
11,
12,
13,
14], though, in fact, deposition of Li-metal should actually not be even possible in a cell under ideal conditions. It is only thermodynamically feasible if the anode surface potential falls below 0 V vs. Li/Li
+. During charging, the potential of typically used graphite anodes is in the range of approx. 1
and
, and does not fall below this critical limit, provided that the operating voltage window of the full-cell is below
[
15]. However, under real operating conditions, several factors can alter the half-cell potential, and can, locally or on a larger scale, lead to a drop in anode surface potential. Therefore, in practice, Li-plating is hard to prevent, and eventually occurs in small amounts in most LIB cells. It can, however, be minimized by consideration of crucial factors. Besides temperature, the upper cut-off voltage
, and constructive properties (cell balancing and geometry), the charging C-rate significantly affects the anode potential [
9,
16,
17]. Therefore, charging patterns that allow more control over current are particularly suitable for the development of healthy fast charging strategies. In this aspect, the varieties of multi-stage constant current charging (MCC) protocols have been widely investigated. The MCC charging protocol basically consists of two or more CC-stages. Additionally, a CV-stage can be implemented when the cell voltage reaches the end-of-charge voltage. The shifting between stages can be based on SOC intervals or
[
8]. The MCC charging protocol can reduce the charging time, prolong the cycle life and standing out from many other charging methods by its implementation simplicity [
18,
19,
20,
21]. To prevent Li-plating and to reduce the charging time simultaneously, selection of the optimal number of CC stages, current rates, and shifting conditions is the main challenge in the development of MCC charging. This can be handled as a combinatorial multi-criteria optimization problem, but testing every combination is not applicable. Therefore, the Taguchi method with orthogonal arrays is proposed to systematically reduce the necessary number of experiments [
18,
20]. Also, optimization algorithms such as particle swarm optimization (PSO) [
21] and ant colony system (ACS) [
22] are applied to find an optimal current pattern with different objectives, like high charging efficiency, reduced charging time, low heat generation, less capacity loss, etc. In addition to these approaches, detection of Li-plating can help to find the optimal charging current pattern. Various methods have been introduced to detect Li-plating based on cell measurements, like analysis of Coulombic efficiency, impedance, voltage, thickness, etc. [
23,
24,
25,
26,
27]. Also, Li-plating can be directly detected by the three-electrode method. In this method, anode potential vs. Li/Li
+ is measured. A potential drop to 0
indicates Li-plating [
28]. Although this method is easy to implement, it needs a reference electrode, which is not available in commercial cells. However, experimental three-electrode cells can be built with a reference electrode using collected electrodes from the commercial cell to be investigated. In such an experimental setup, the influence of the charging rate and possibly other parameters on the potential at the negative electrode-electrolyte interface can be determined. These measured correlations can then be used for fast charging of commercial cells made of the same electrodes, but without the three-electrode setup. Several investigations show the suitability of this approach for the development of optimized charging current [
9,
28,
29,
30].
Our research advances the development of fast charging protocols by incorporating SOC-based thresholds derived from the three-electrode cell experiments to govern a multi-stage constant current (MCC) charging protocol for commercial cells. This SOC-based approach offers enhanced stability over conventional MCC protocols, which primarily rely on voltage-based control. This is crucial, as the voltage characteristic of LIBs can be significantly affected by both external factors, like temperature variations, and internal factors, such as electrochemical hysteresis, while the majority of SOC-based MCC algorithms in the literature are developed through expensive cell testing and lack detailed electrochemical analysis [
18,
20,
21,
22]. Alternatively, Epding et al. [
30] introduced a SOC-based MCC charging protocol for LTO cells based on three-electrode experiments. In that work, the aging performance of the proposed protocol is validated on lab-scale experimental three-electrode cells, without extending it to the application on commercial cells. Sieg et al. [
28], on the other hand, successfully applied insights from three-electrode experiments to larger-scale pouch cells, employing SOC as a critical transfer parameter from experimental to commercial cells. However, their focus remains on large-scale pouch cells designed primarily for EV applications. Their SOC estimation relies on high-accuracy laboratory current measurements (Coulomb counting), incorporating a SOC estimation error of 2% to reflect realistic conditions in selected tests.
Our study enhances this existing framework by adapting the methodology for cylindrical commercial cell formats, integrating a high-accuracy SOC estimator, and extending its relevance to NMC (Lithium Nickel Manganese Cobalt Oxides (LiNixMnyCo1−x−yO2)) cell chemistry. The chosen commercial cell, with its nominal capacity, is well-suited for light EVs, such as electric bicycles. This not only validates the theoretical foundations of our approach, but also emphasizes its scalability for diverse industrial applications, particularly in the rapidly growing light EV sector.
The novelty of our work lies in the integration of precise SOC thresholds obtained from three-electrode experiments for MCC charging algorithm with a highly accurate SOC estimator. This synergy enables the development of scalable charging current guidelines for standard commercial cells, bridging the gap between experimental insights and their practical implementations. Our approach eliminates the need for cells with a physical third electrode during application or extensive cell testing in the development phase of the charging protocol. By doing so, it aims to reduce charging time and, through minimizing the risk of Li-plating, prevent the acceleration of aging caused by fast charging. This contributes significantly to the advancement of lithium-ion battery charging technologies.
This paper is organized as follows: First, the optimal charging pattern is designed with the help of three-electrode method. Experimental three-electrode cells are reconstructed from commercial 21,700 type NMC cells. Second, an accurate SOC estimator suitable for a Battery Management System (BMS), namely an Extended Kalman Filter (EKF), is developed to ensure the proper control of the charging current on real application. Third, cell tests are performed to prove the performance of the proposed approach. Aging tests are conducted, and the proposed MCC protocol is compared with standard CC-CV charging. In the final section, the conclusions are given.
2. Materials and Methods
2.1. Electrochemical Characterization
The electrodes of NMC commercial cylindrical cells of type 21700 were analyzed electrochemically using three-electrode measurements. For this purpose, the commercial cells first were cycled for 5 cycles at standard conditions according to the manufacturer specifications (
Table 1), and then discharged to
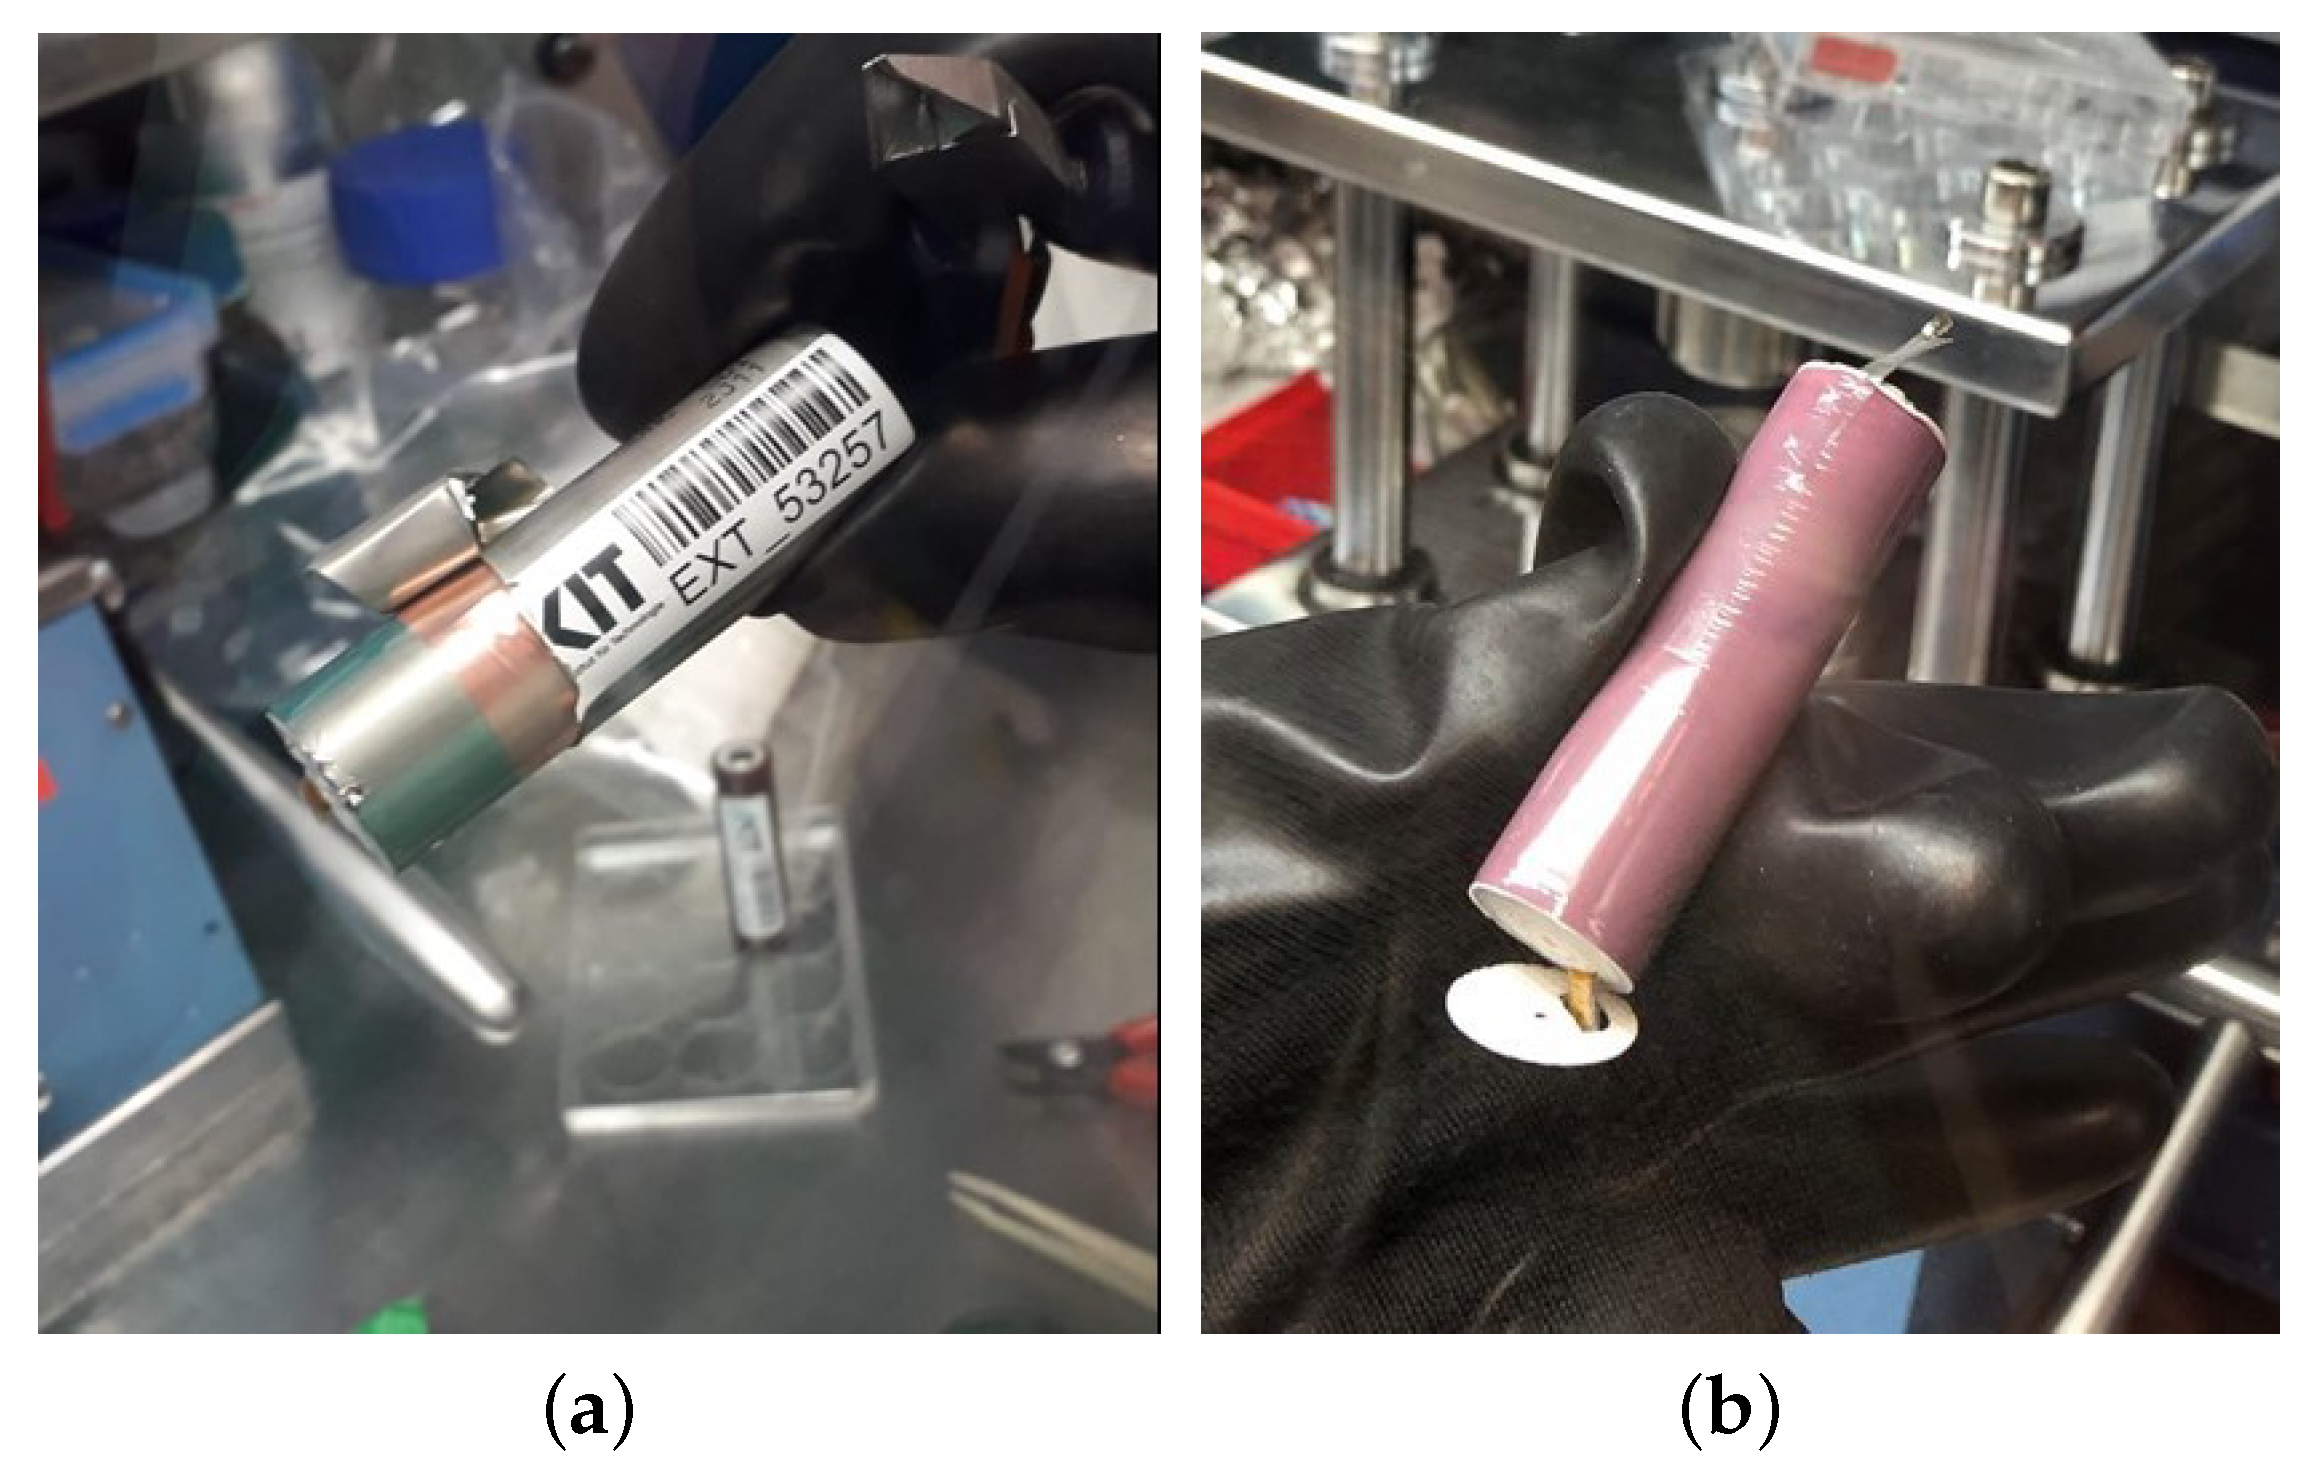
. This “pre-cycling” is performed to allow completion of possibly incomplete electrolyte decomposition and SEI forming processes that might manipulate the later acquired data. The cells were then opened under inert atmosphere in an argon-filled glovebox by use of appropriate tools (
Figure 1a). After the extraction, the so-called jelly roll (
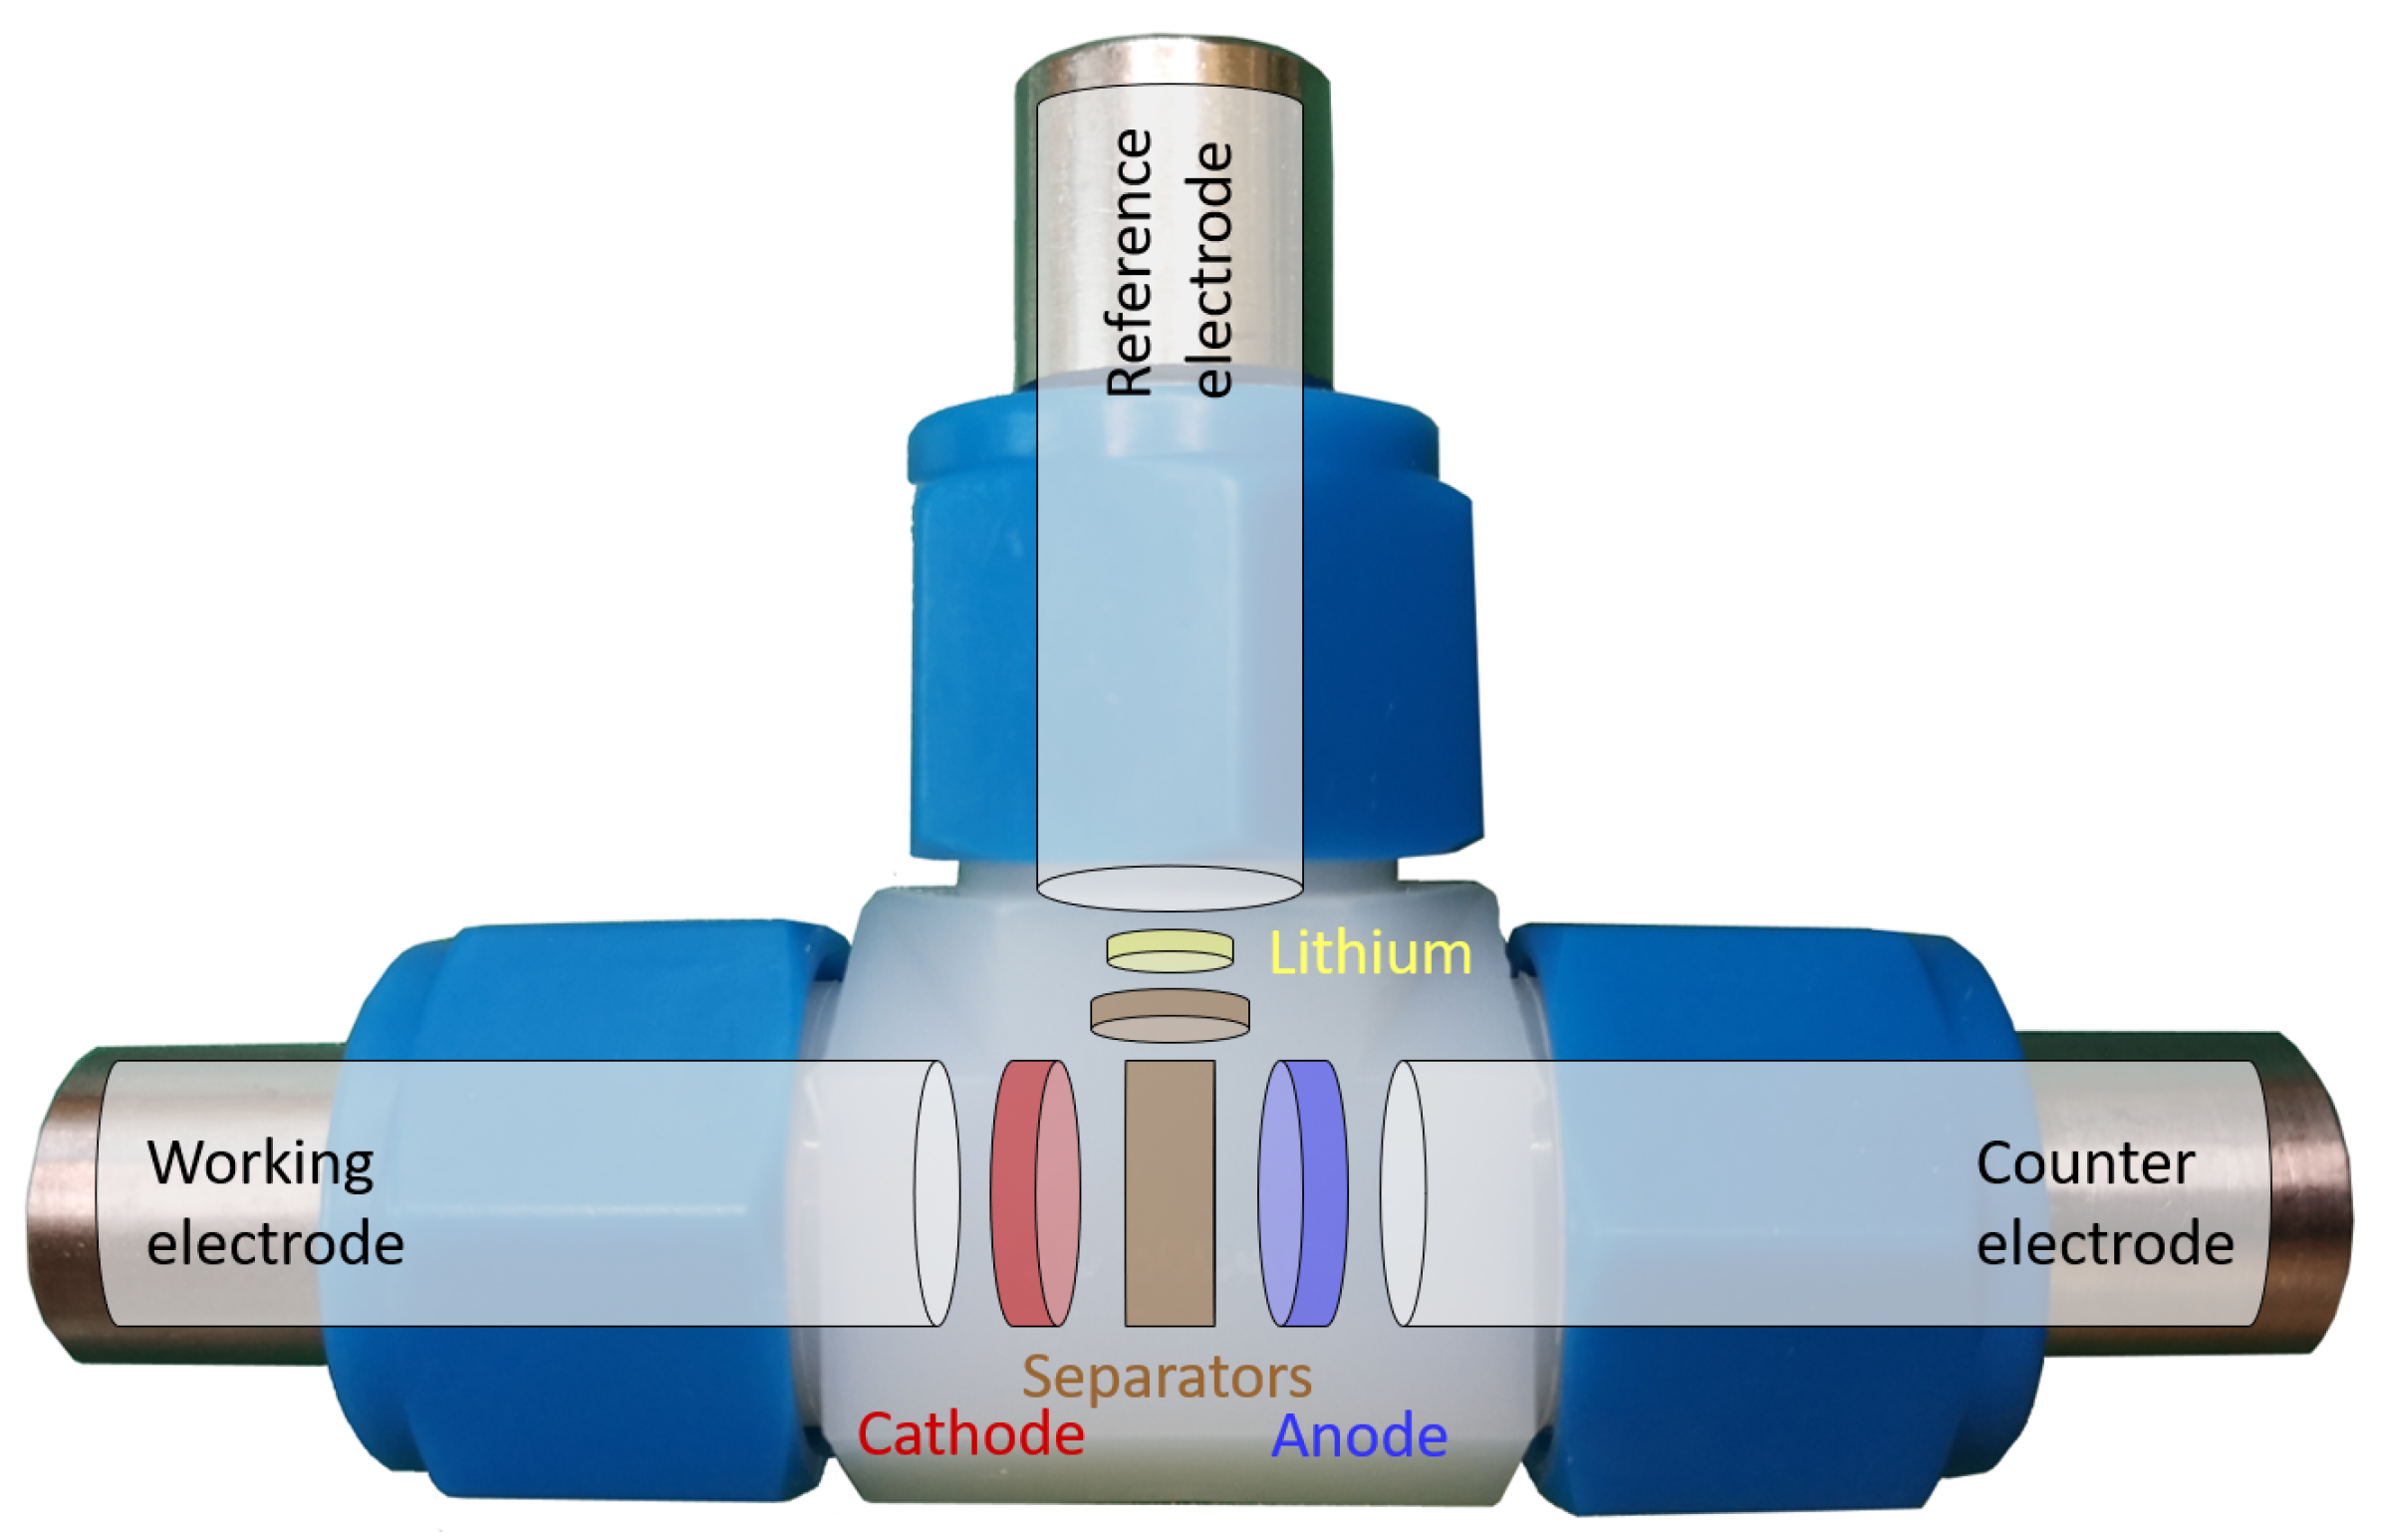
Figure 1b) consisting of anode, cathode, and separator was carefully unrolled, and the three components were isolated from each other. Then, the electrodes were washed with dimethyl carbonate (DMC) to remove any electrolyte residues. Furthermore, the electrode coating was carefully removed from the anode and cathode current collector foil, each on one side without damaging the opposite side’s coating. From the resulting one-sided coated electrodes, individual circular electrodes were punched and reassembled in three-electrode cells (Swagelok T-cell type), as shown in
Figure 2.
In the three-electrode configuration, the cell is operated at a specific full cell potential, i.e., defined by the potential difference between the working electrode (WE) and the counter electrode (CE). Ideally, the CE has a constant potential, so that the potential changes and the underlying processes at the WE can be analyzed.
However, using common LIB electrode materials (in this study, NMC as WE and graphite as CE), the potentials at both electrodes vary, simultaneously depending on the SOC and the operating conditions, which makes it hard to study the underlying processes at each electrode [
31]. To observe the processes at the WE and CE in isolation, an additional reference electrode (RE) (e.g., Li|Li
+) is therefore required, which taps the voltage at the WE and CE without itself being actively involved in the electrochemical reaction. Each three-electrode cell was equipped with an extracted cathode as WE (⌀12
) and anode as CE (⌀13
) being separated by a fresh glass fiber separator (Whatman GF/D, ⌀13
). Lithium foil was used as reference electrode, which was additionally separated by a glass fiber separator (⌀3
). As an electrolyte, 450
of 1 M lithium hexafluorophosphate (LiPF
6) in a mixture of ethylene carbonate (EC) and dimethyl carbonate (DMC) at a weight ratio of 1:1 was used (LP30, Gotion Inc., Fremont, CA, USA).
The electrochemical characteristics of our experimental three-electrode cells are very similar to those of standard commercial cells. Voltage values are traditionally used as thresholds for MCC protocols due to their straightforward application. However, the voltage of LIBs is highly non-linear, influenced by SOC, temperature, and hysteresis, which can lead to inconsistencies in charge current control. Alternatively, the change in actual available capacity (Ah) offers a more linear characteristic, and is more suitable for charge current control. However, the capacity of the experimental cell differs significantly from that of commercial cells, making direct application obtained thresholds impractical. The SOC, as a normalized parameter, bridges this gap and allows the transfer of the results from the three-electrode experimental cell to the commercial cells. For this purpose, the area of coated electrode surface of the unrolled jelly roll was determined. Since the cathode fundamentally determines the amount of cyclable lithium in the system, the areal capacity [ −2] was determined as a ratio of the 1 C discharge capacity and the cathode area of the commercial 21700 cell.
Then, a rate test was performed on the three-electrode cells, in which the amperage was defined according to this areal capacity. Charging and discharging took place in the full-cell voltage window of – , where the discharge rate was set to C/2 and the charge rate was varied from C/10 to C/5, C/2, 1 C, and 2 C after every two cycles. By using the three-electrode setup, the anode and cathode potentials were observed individually and the critical SOC for a potential onset of Li-plating at the anode, i.e., when the anode potential falls below 0 , can be determined for each C-rate. Eventually, the MCC protocol is normalized based on the measured three-electrode cell capacity, which allows us to scale up the charging protocol to the commercial cells.
The cells were cycled with a Biologic VMP3 battery cycler. Pre-cycling and long-term cycling of the 21700 cells was performed by use of a BaSyTec XCTS battery cycler. The experiments were conducted at 25 °C. Future work will involve validating this method under various ambient conditions to ensure its robustness in real-world applications.
2.2. Cell Modeling and Parameter Identification
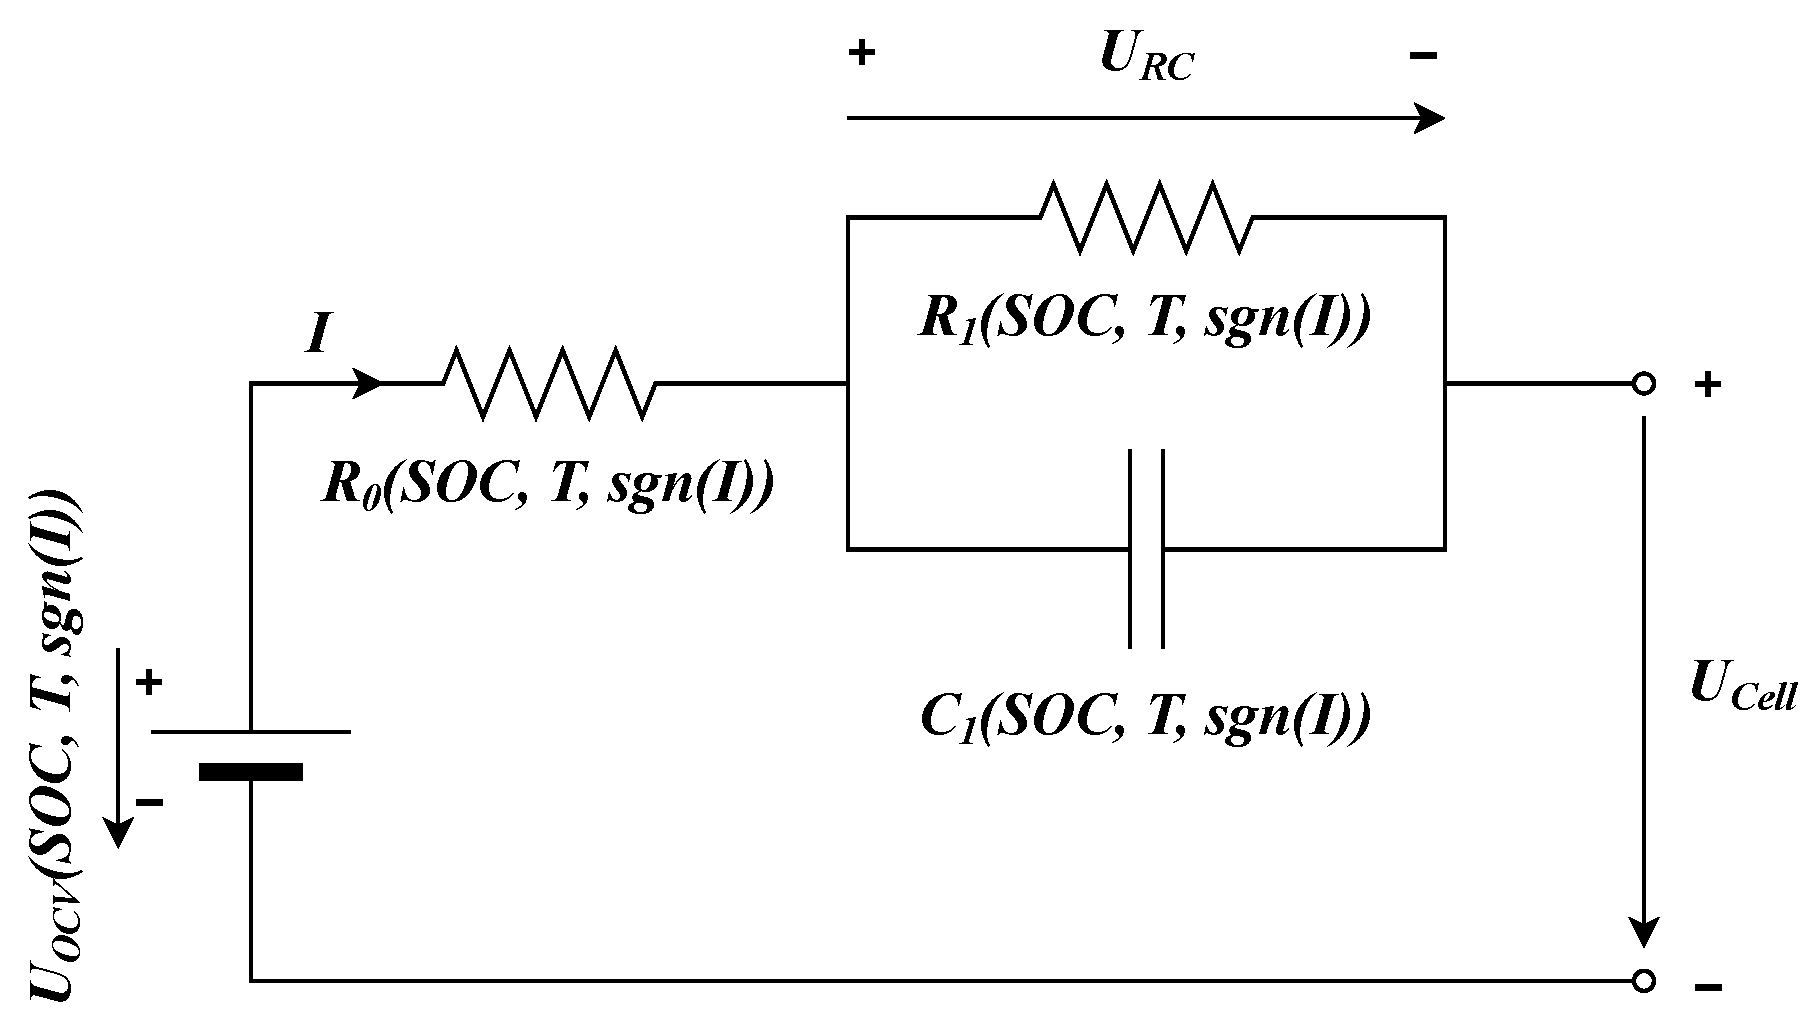
In this research, we utilize a single RC branch Thevenin equivalent circuit model (ECM) to accurately mimic the electrical characteristics of LIBs and to develop a foundational model for SOC estimation.
Figure 3 visualizes the used model. It comprises the cell’s open circuit voltage (
), the terminal voltage of the cell (
), and the polarization voltage (
), along with
representing the ohmic resistance, and
and
corresponding to the polarization resistance and capacitance, respectively. The cell current,
I, is considered positive during discharge and negative during charging.
The model’s mathematical representation, including Equations (
1) and (
2), is derived using Kirchoff’s laws of current and voltage. These equations are fundamental to the model’s integration to SOC estimator and simulation within the MATLAB/Simulink R2020b environment of MathWorks.
The precise parametrization of these elements was conducted with a Hybrid Pulse Power Characterization (HPPC) test [
32] using a BaSyTec XCTS battery cycler. To capture the thermal dependencies, the tests are carried out under seven different temperatures:
°C, 5 °C, 15 °C, 25 °C, 35 °C, 45 °C, and 55 °C. Additionally, to incorporate the hysteresis effect in our model, we conduct these tests in both charging and discharging directions. The HPPC tests are performed in increments of 10% SOC. The derived parameter values are then compiled into 3D lookup tables.
This extensive development and parametrization of the battery model set the stage for the subsequent chapter, where we will delve into the implementation of an Extended Kalman Filter (EKF) for precise SOC estimation. The detailed modeling and parametrization are crucial for ensuring the accuracy and efficacy of the SOC estimation process in our proposed SOC-dependent, aging-optimized fast charging algorithm.
2.3. State of Charge Estimation
The change in the SOC of a LIB can be represented as a time-dependent function, as demonstrated in Equation (
3). Here,
represents the SOC at a specific time
t,
) is the initial SOC at the starting time
,
is the current as a function of time, and
is the nominal capacity.
Coulomb counting is the fundamental method for SOC estimation based on Equation (
3). Unfortunately, it is susceptible to errors arising from noisy current measurements and uncertainties in the initial SOC value, as well as deviations caused by charge transfer due to electrochemical side reactions. These limitations can lead to cumulative errors over time. To address these challenges, model-based approaches are employed, which offer enhanced accuracy. Consequently, in our work, we have incorporated the EKF for SOC estimation to overcome the inherent drawbacks of the Coulomb counting method and ensure more reliable and precise SOC calculations.
The EKF is a recognized adaptation of the classic Kalman filter, specifically designed for estimating states in nonlinear systems like LIBs. The EKF approach involves linearizing nonlinear systems at each time step using a first-order Taylor approximation. It is a well-established technique in battery management systems. Originally, Plett [
33] pioneered the application of the EKF method for SOC estimation in LIBs. Employing a discrete-time cell model, the EKF incorporates measurement signals of current, voltage, and temperature. As a model-based recursive technique, it effectively addresses the primary challenges in SOC estimation, such as measurement noise, online estimation, and initial value problem [
34]. Consequently, this has led to a significant focus among researchers on developing EKF-based SOC estimators [
35,
36,
37].
Based on the Thevenin ECM as outlined in Equations (
1) and (
2), and the SOC as defined in Equation (
3), the process and measurement equations for the EKF are formulated in the discrete-time domain as follows:
where
is the state vector,
the process noise,
the cell voltage measurement vector,
the measurement noise,
the nonlinear measurement function,
A the state transition matrix,
B the control input matrix,
the input vector,
the nominal capacity,
k discrete-time instant, and
is the sampling time in seconds.
In this study, we represent estimated values using a hat symbol , and a priori predictions are indicated by a minus symbol .
The EKF algorithm can be broken down into two main steps: prediction and update. In the prediction step, the EKF forecasts the future state
of the battery based on its current state and input variables. This involves updating the state prediction, which encapsulates the expected battery behavior, and the error covariance prediction
, which estimates the uncertainty of this prediction. Following this, the EKF proceeds to the update step, where it incorporates new measurement data to correct the predicted state. This correction is achieved by calculating the Kalman Gain
, which balances the prediction with new measurements, and then updating the state and error covariance estimates to more accurately reflect the observed battery behavior.
Table 2 summarizes the implemented EKF algorithm. The EKF assumes that
and
are independent, zero-mean Gaussian noise processes, each characterized by their respective covariance matrices,
Q and
R. The linearization of the measurement function
is realized with Jacobian matrix
, as defined in Equation (
6).
2.4. Aging Analysis
In our study, we conducted cycling tests on three cells using the standard charging procedure, as shown in
Table 1, and on two cells using the proposed MCC charging algorithm, to investigate the impact of these charging algorithms on the aging process. In both procedures, charging is extended with a CV charging phase at the end until I < C/20 and the cells are discharged with a constant current of 1 C. For all cells, a capacity test and a direct current internal resistance (RiDC) test at various SOC (10%, 30%, 50%, 70%, 90%) are conducted every 50 cycles. During the capacity test, the cells are charged using the standard CCCV charging procedure and then discharged at a constant current of 1 C until they reach the lower cut-off voltage
.
The RiDC tests, which can be considered a variation of the Galvanostatic Intermittent Titration Technique (GITT) profile, involve applying current pulses of 1 C in the discharge direction at each determined SOC level for 20
, followed by a relaxation phase of 5 min. After each RiDC test, the cell is discharged to the next SOC level with a constant current of C/3, followed by a relaxation phase of 15 min. The DC internal resistances were determined by Ohm’s law according to Equation (
7) using the difference between the potentials at rest state before the pulse
and at the end of the pulse
, caused by the applied pulse current
I.
The degradation of cells is described by the State of Health (SOH). In the context of this paper, we interpreted SOH as a capacity loss and computed using Equation (
8), where
is the actual capacity of an used cell and
is the initial reference capacity of a new cell. The reference capacity
is determined with capacity tests with 1C discharge rate at 25 °C conducted on new cells at the start of the aging tests. The aging test was performed until the end of life of the cells, i.e., 80% SOH.
3. Results
3.1. Results of Electrochemical Characterization
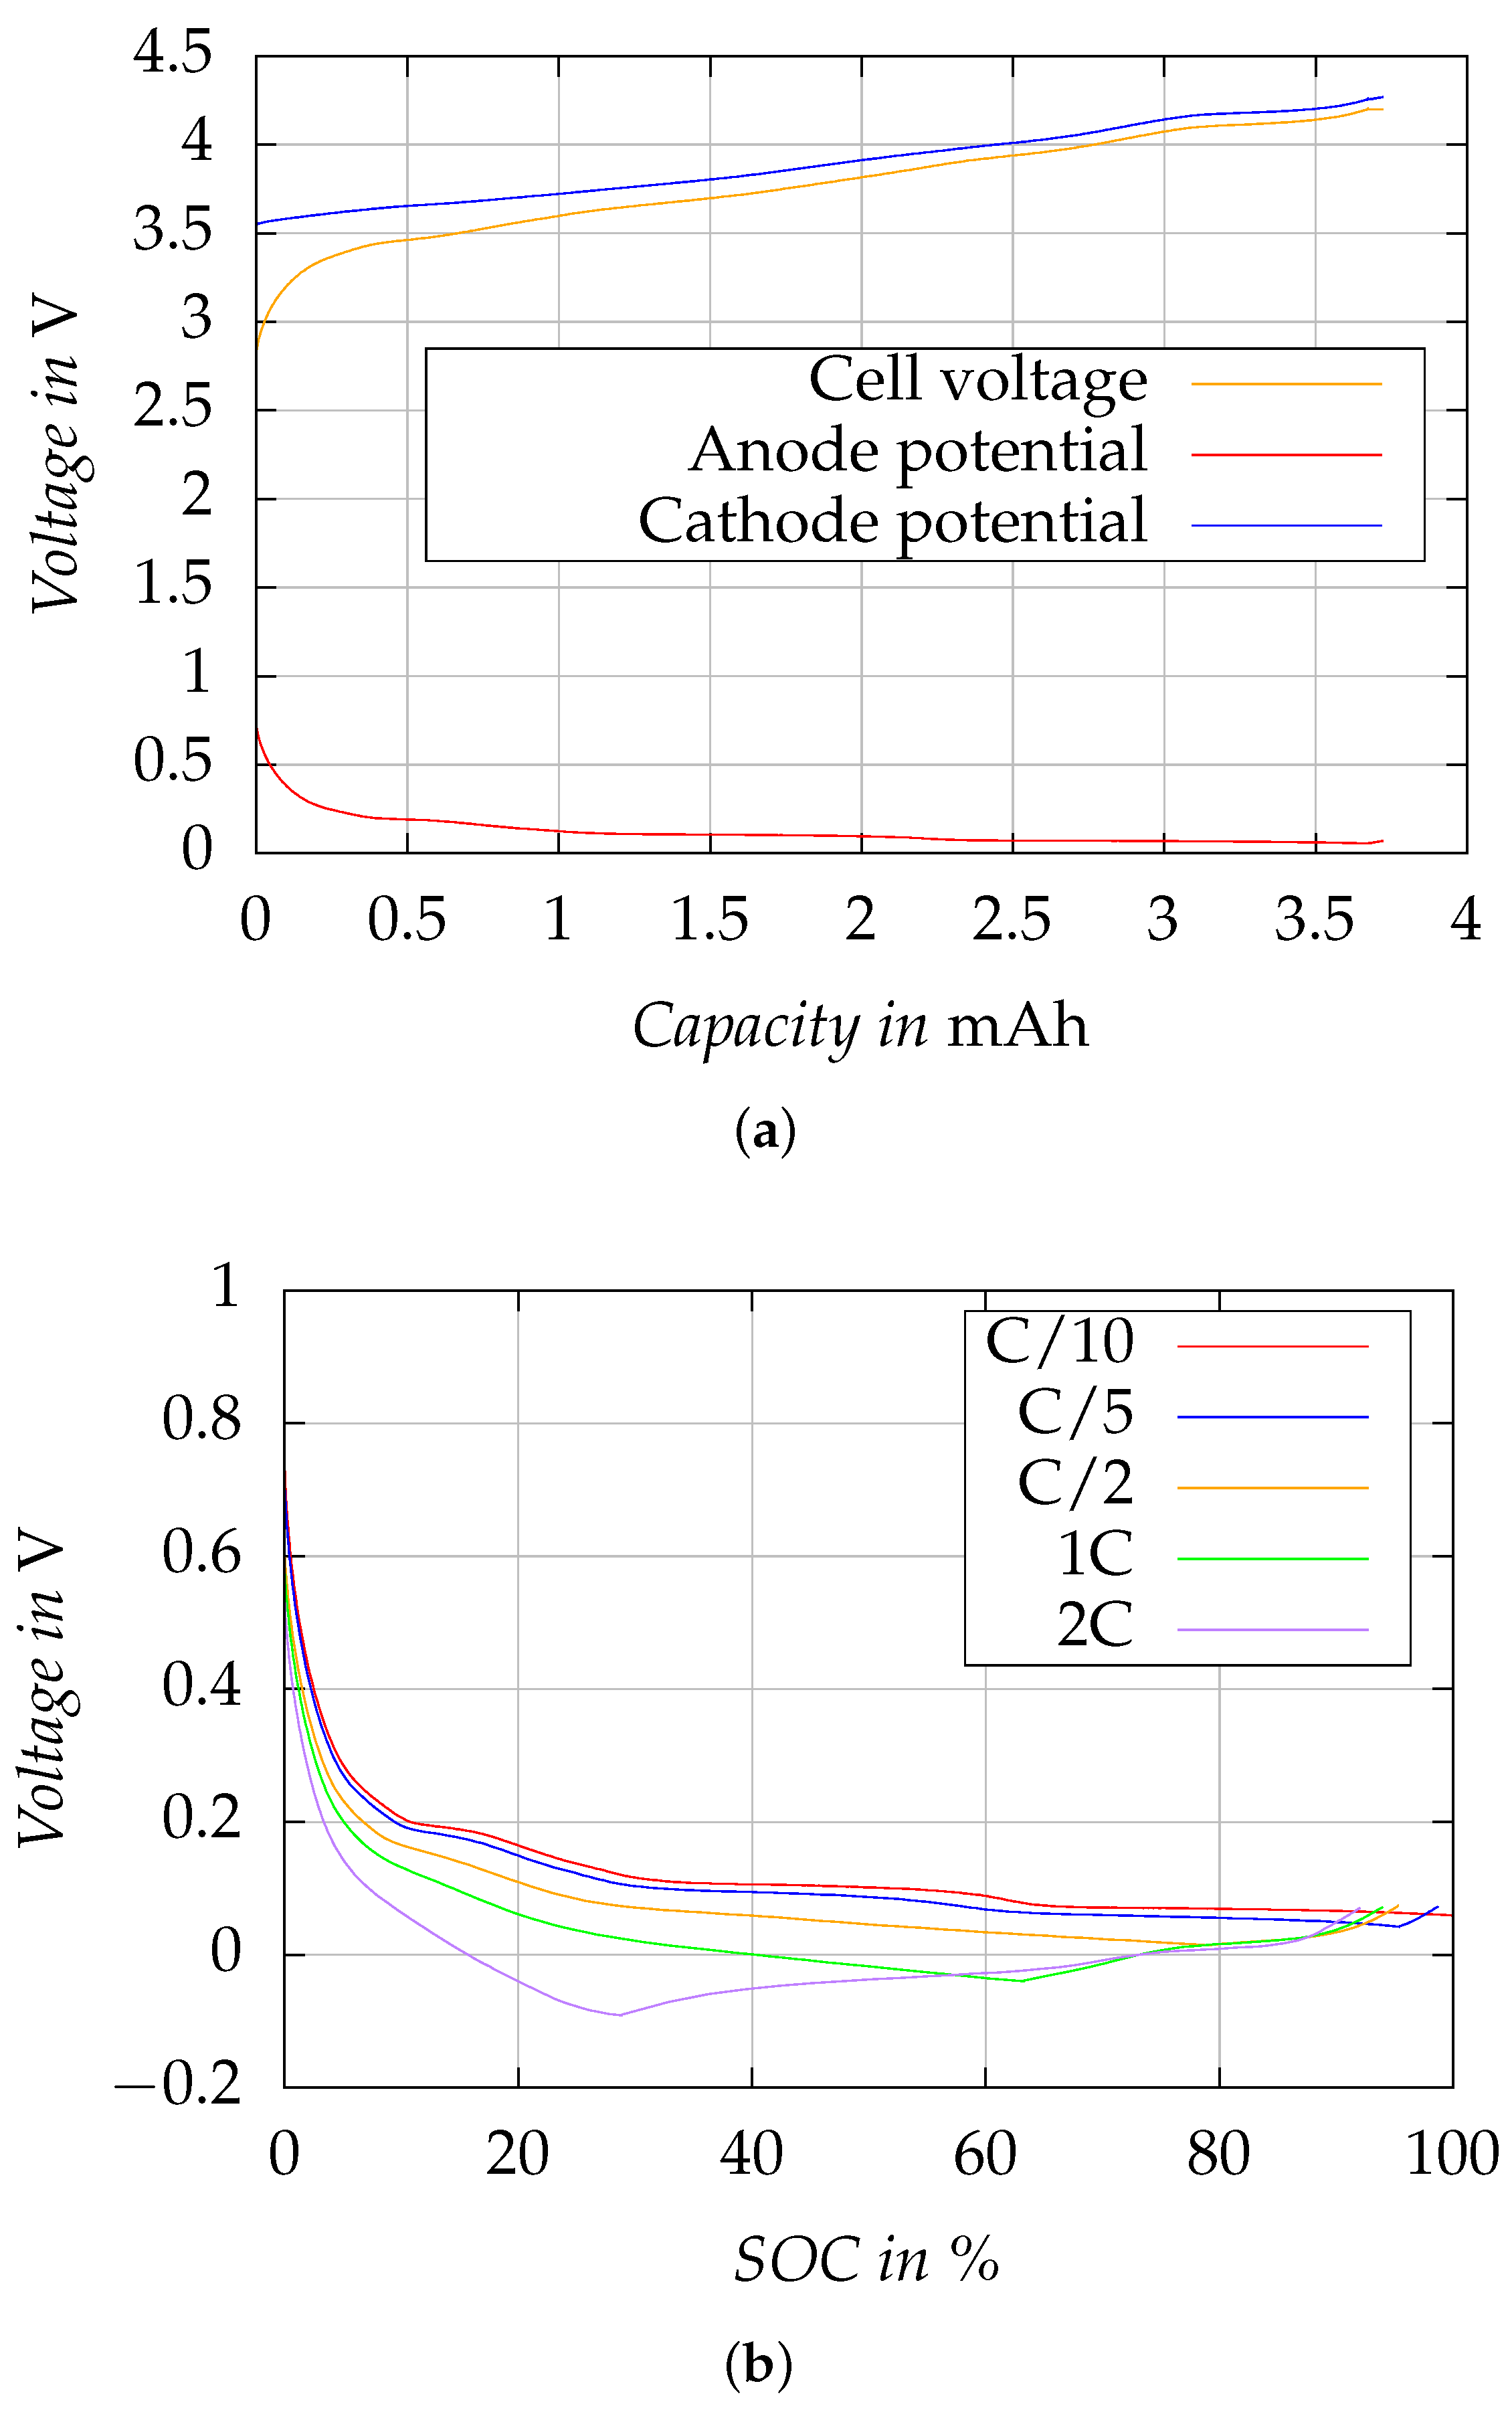
Figure 4 shows the results of the electrochemical characterization of the three-electrode cell for determination of the SOC-dependent maximum charge rate (at 25 °C).
Figure 4a shows the potentials measured at anode and cathode against the reference electrode, as well as the resulting full cell potential exemplary for the charge cycle with C/10 rate. During charging, when Li ions are extracted from the cathode and intercalate into the active material of the anode, the anode potential is reduced. In turn, the Li host material in the cathode is electrochemically oxidized and the cathode potential increases. The anode potential shows a flat plateau shape curve, which is typical for graphite anode material [
15]. At the rate of C/10, it does not fall below 0
, i.e., Li-plating is not expected. When the full cell potential reaches
the charge mode switches from CC to CV and the current decreases which, in turn, leads to a relaxation of overpotentials at the electrode surfaces reflected by an increase in anode potential and a decrease in cathode potential.
Figure 4b illustrates the change in anode potential relative to the SOC during charging at various C-rates, specifically C/10, C/5, C/2, 1 C, and 2 C. With higher C-rates, an increasing negative shift in anode potential can be observed, eventually leading to a drop below 0
at C-rates ≧ C/2. As a consequence, when the C rate increases, the maximum SOC that can be achieved at an anode potential of >0
gradually becomes smaller. The increase in anode potential at higher SOC is caused by a decrease in charge current when the transition from CC- to CV-charge mode takes place. With increasing C-rate the SOC at the beginning of the CV step is decreasing, being approx. 95% at C/5, 79% at C/2, 63% at 1 C, and 29% at 2 C. Maintaining the anode potential above 0
during charging is imperative to prevent Li-plating and to preserve the battery’s operational safety. Based on these findings, we have devised a multi-stage constant current (MCC) charging profile aimed at reducing charging times while simultaneously preventing Li-plating.
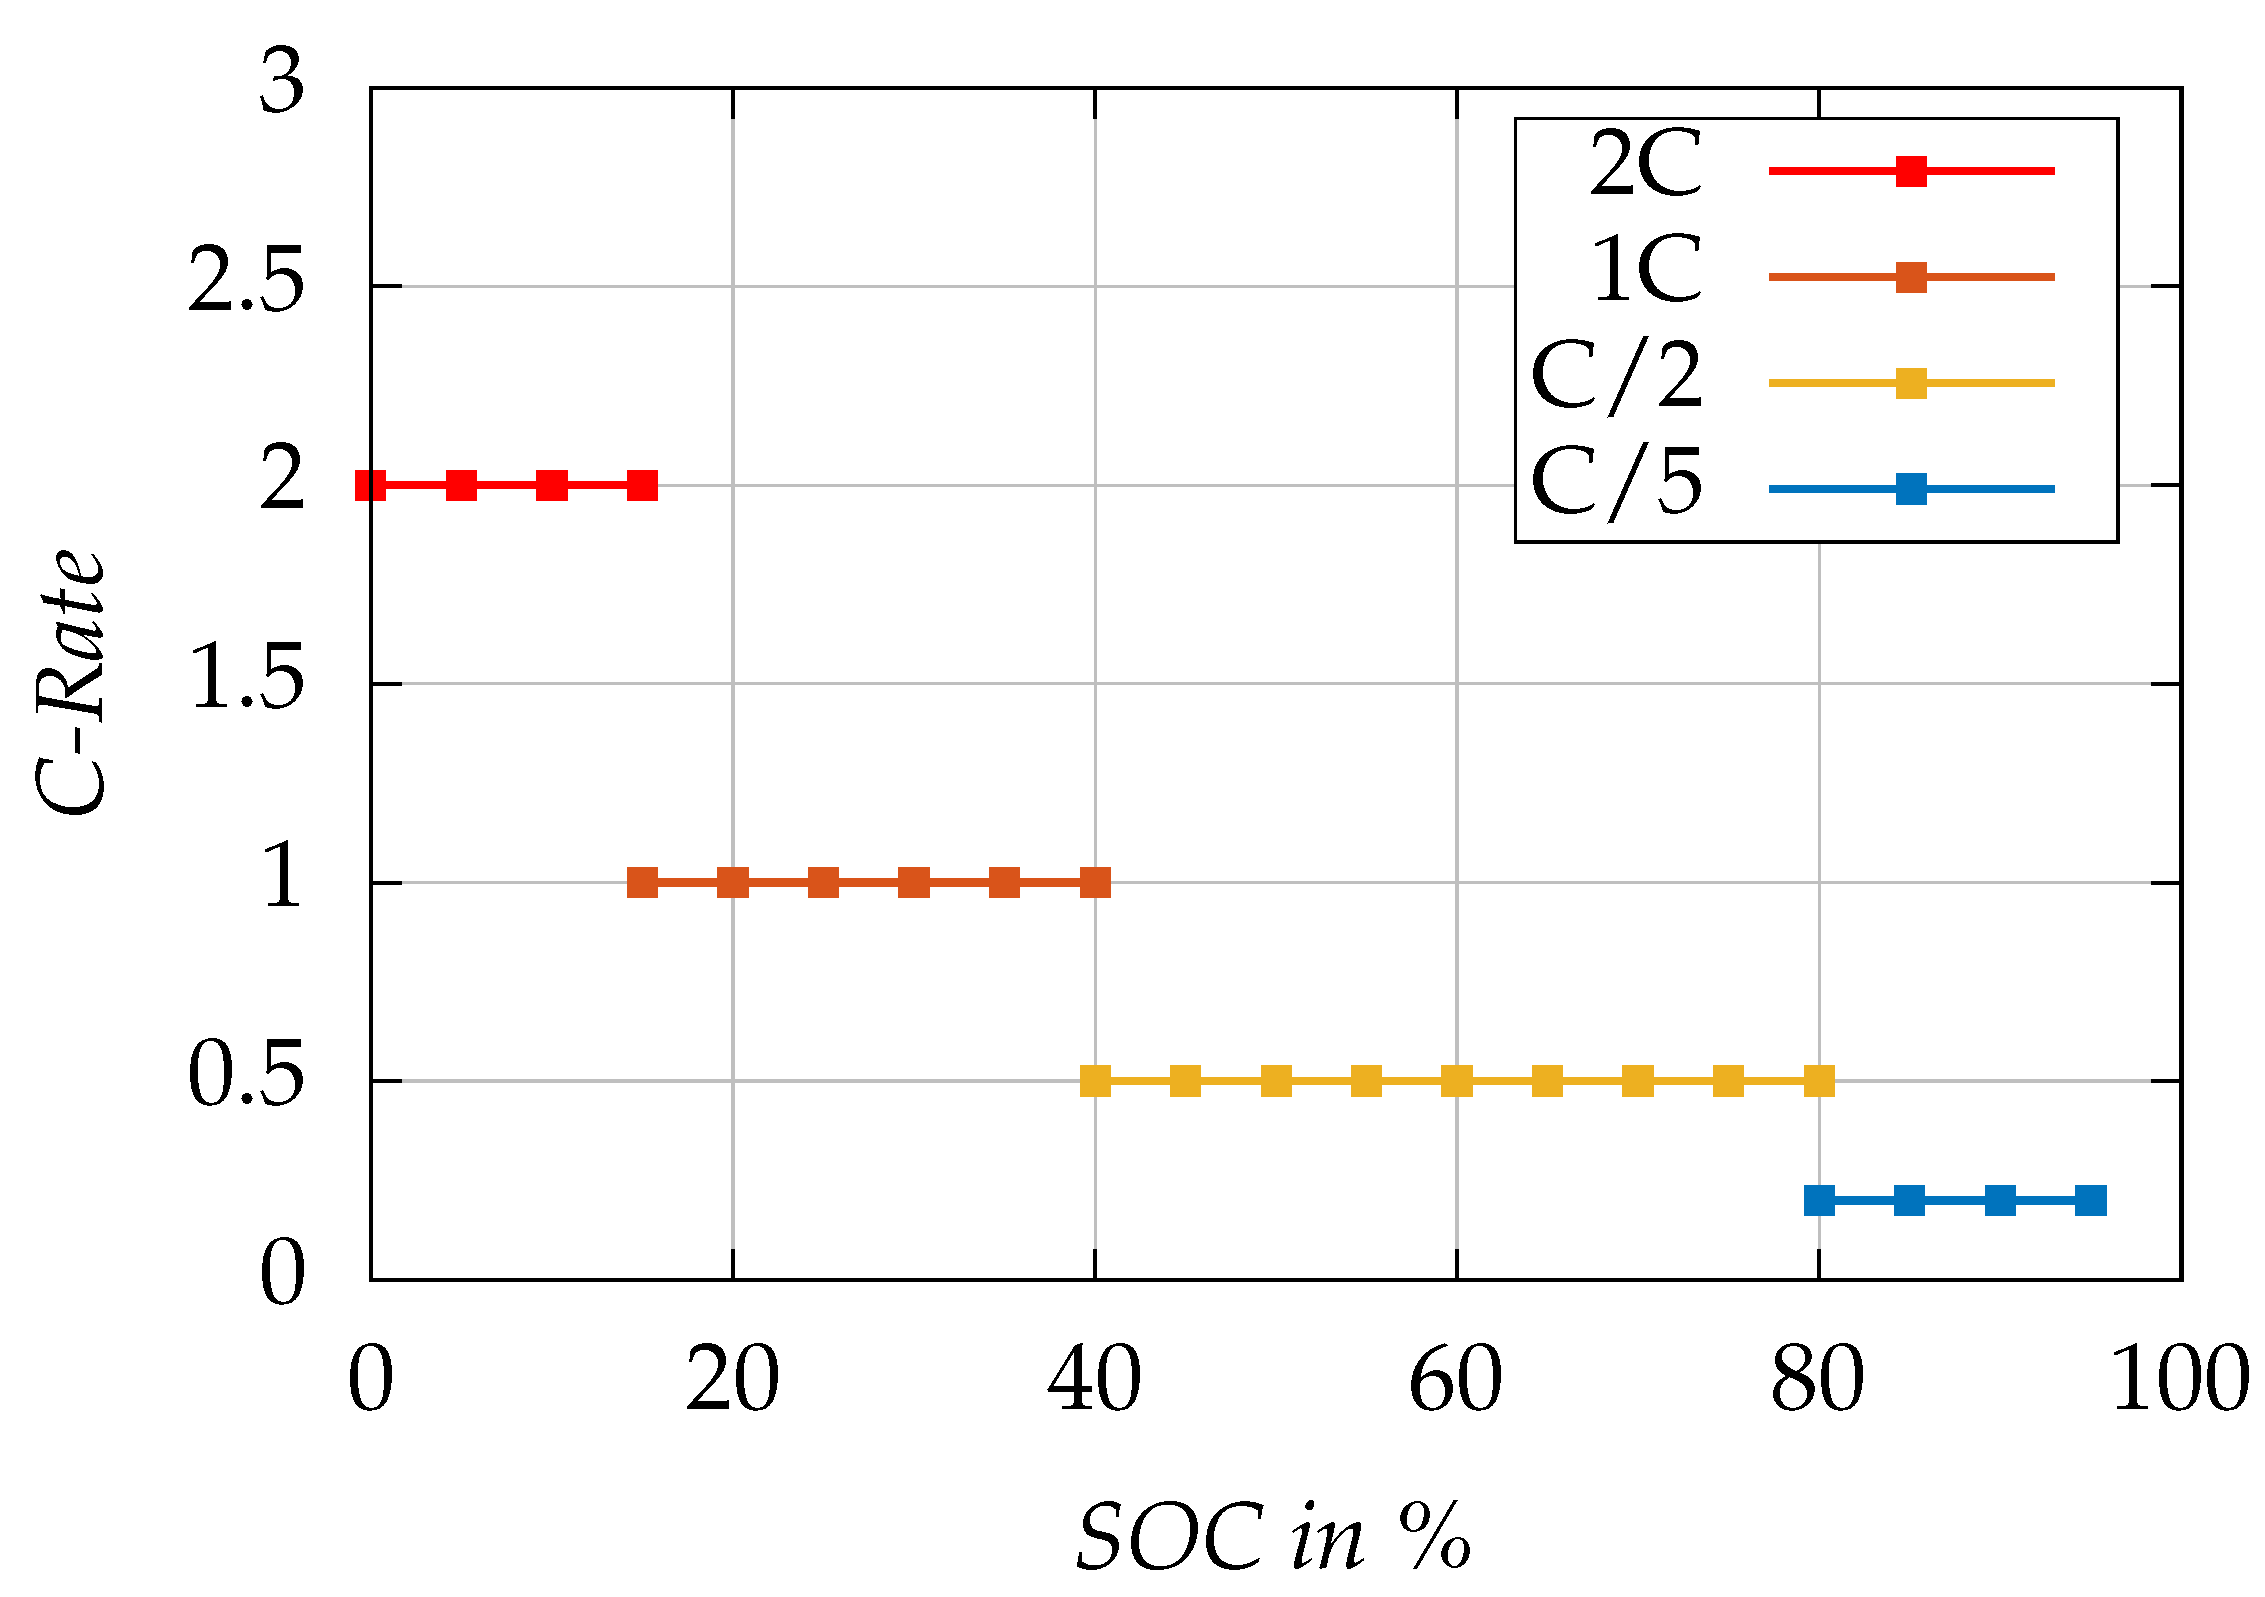
Figure 5 visualizes the SOC-dependent charging stages of the proposed MCC charging protocol.
Table 3 summarizes the details of the proposed MCC stages with outlining the duration required to charge through each phase. The standard charging protocol recommended by the cell manufacturer employs CCCV charging with a CC phase with a constant current rate of C/2 up to
, and a CV phase with a cut-off current of C/30. The MCC profile provides a time-saving advantage for the lower SOC range. It completes the charge up to 80% in
, which is about 30% faster then standard charging, which takes 96
.
A full charge requires approximately 140 , including a 38 CV phase with standard charging, and it takes 127 with a 15 minute CV phase using MCC charging. The proposed MCC charging method is about 10% faster in the case of a full charge that includes a CV phase.
3.2. Results of Parameter Identification and Cell Modeling
The results of the HPPC tests are analyzed in Matlab. The parameters of the cell model, namely open-circuit voltage , and the resistances and capacitance , and , are identified for various temperatures and SOC levels using Matlab’s optimization function “fminsearch()”.
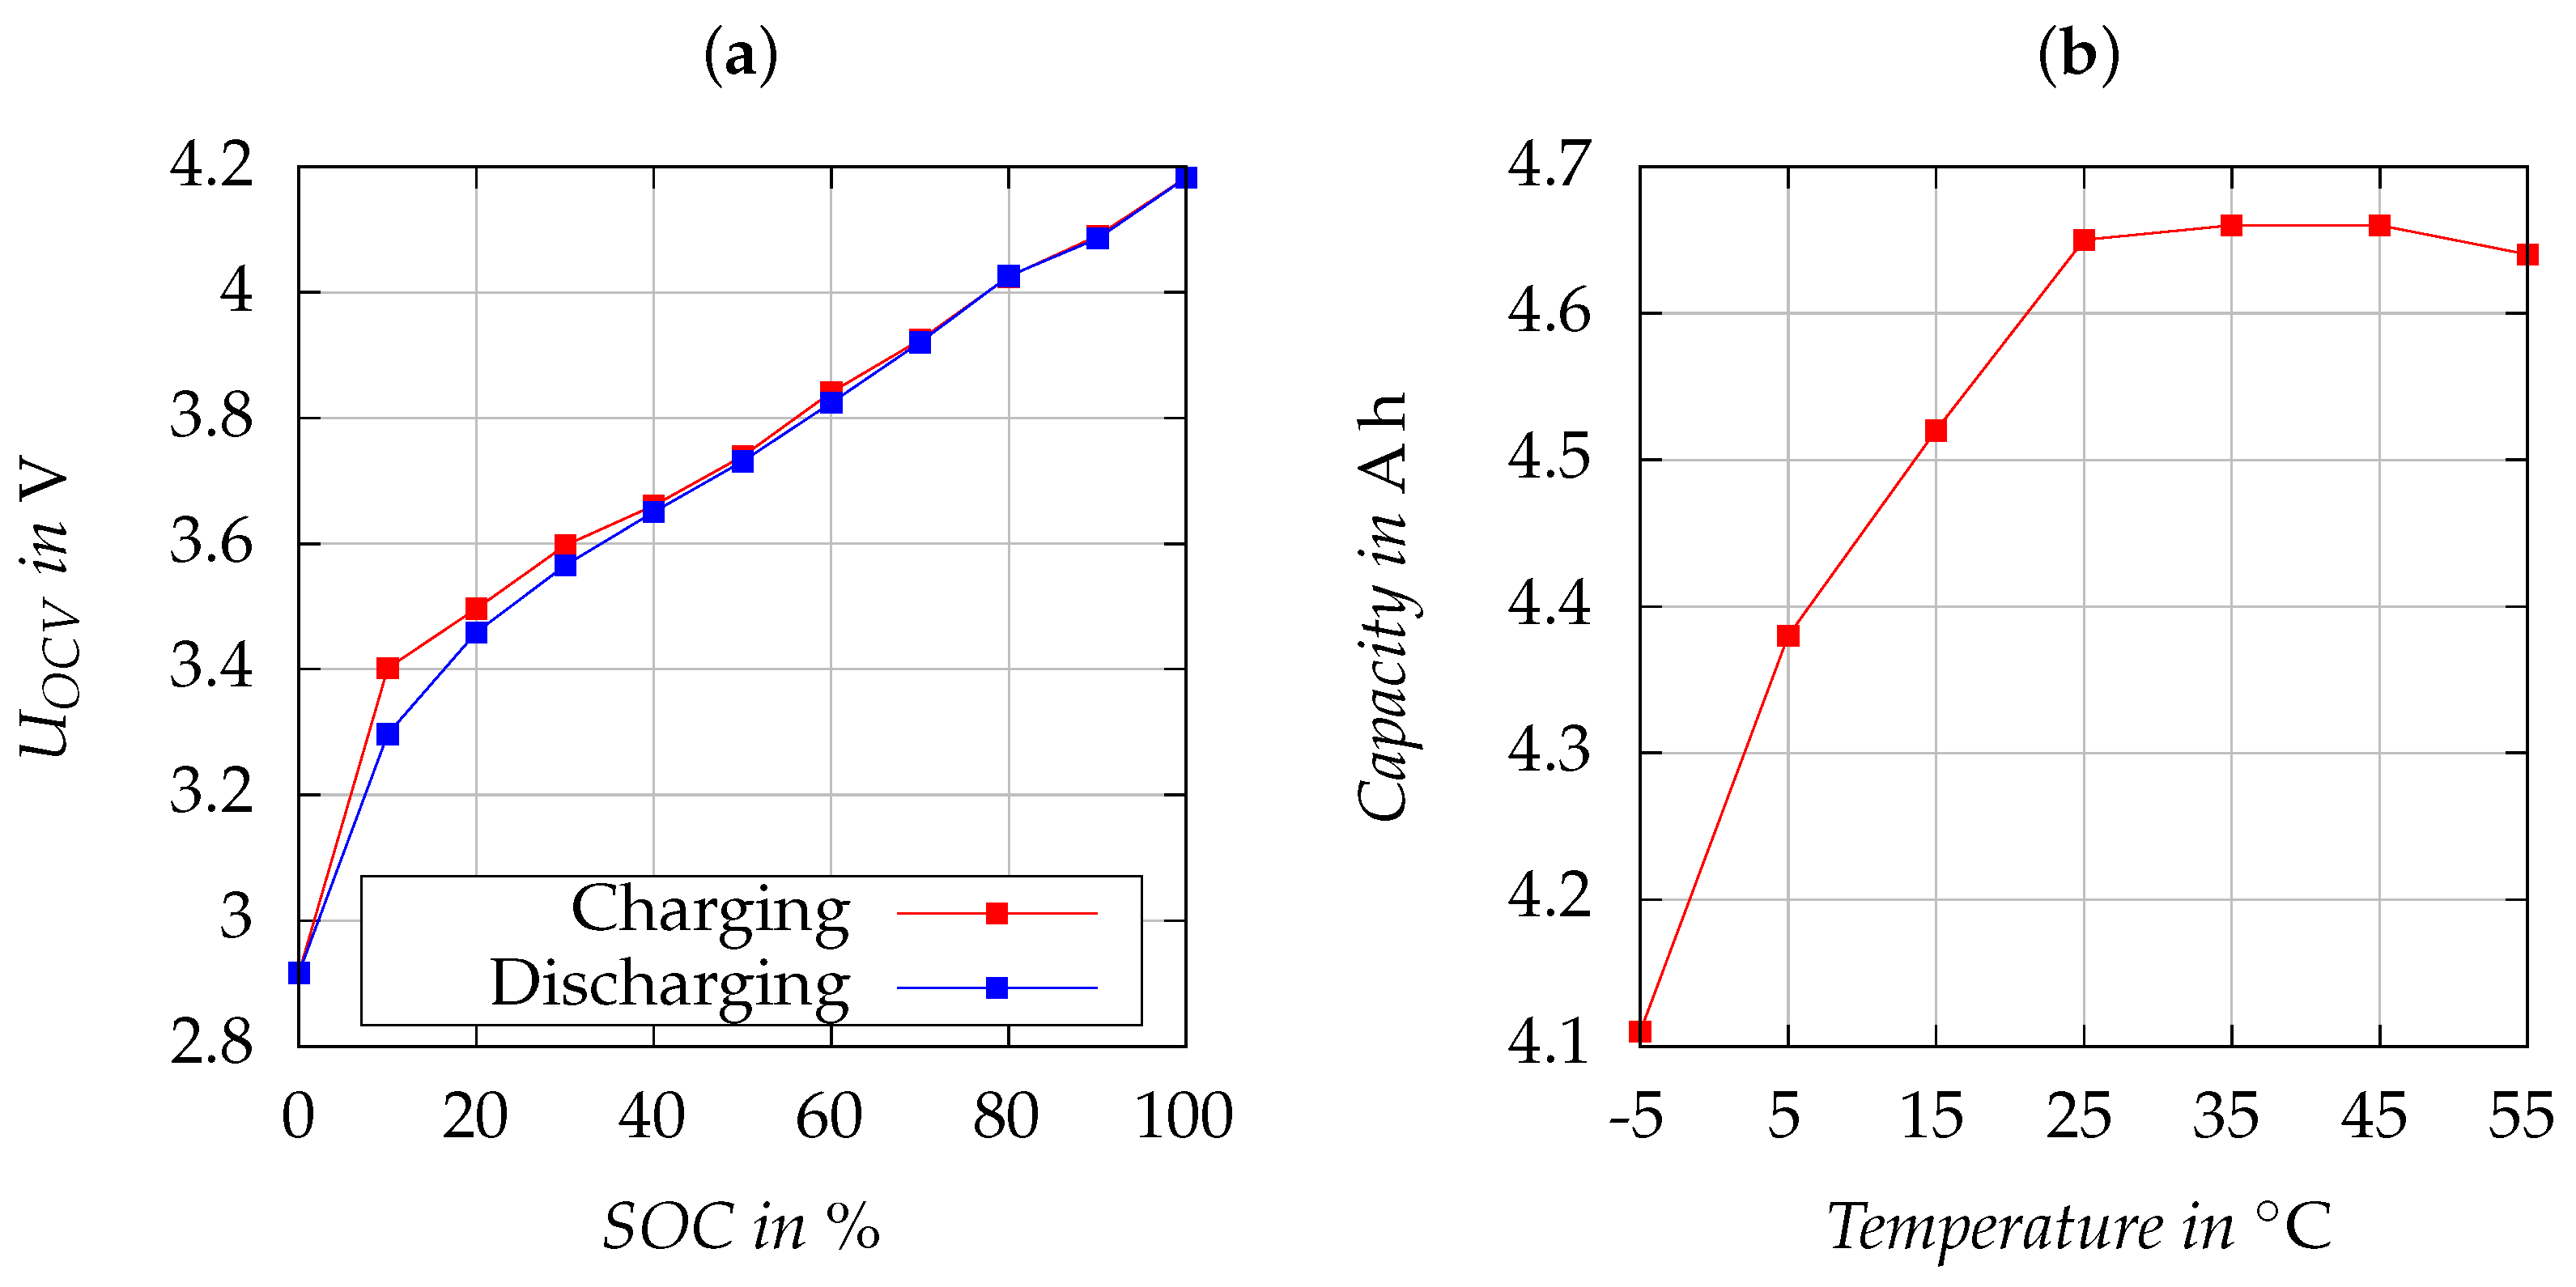
Figure 6a illustrates
by charging and discharging at 25 °C. The cell’s nominal capacity is specified as
. The influence of temperature on the cell capacity was examined under a 1 C discharge current, and the results are visualized in
Figure 6b. As expected, the capacity decreases with descending temperatures. The results of the capacity test are incorporated into the cell model using temperature-dependent 2D lookup tables. Similarly,
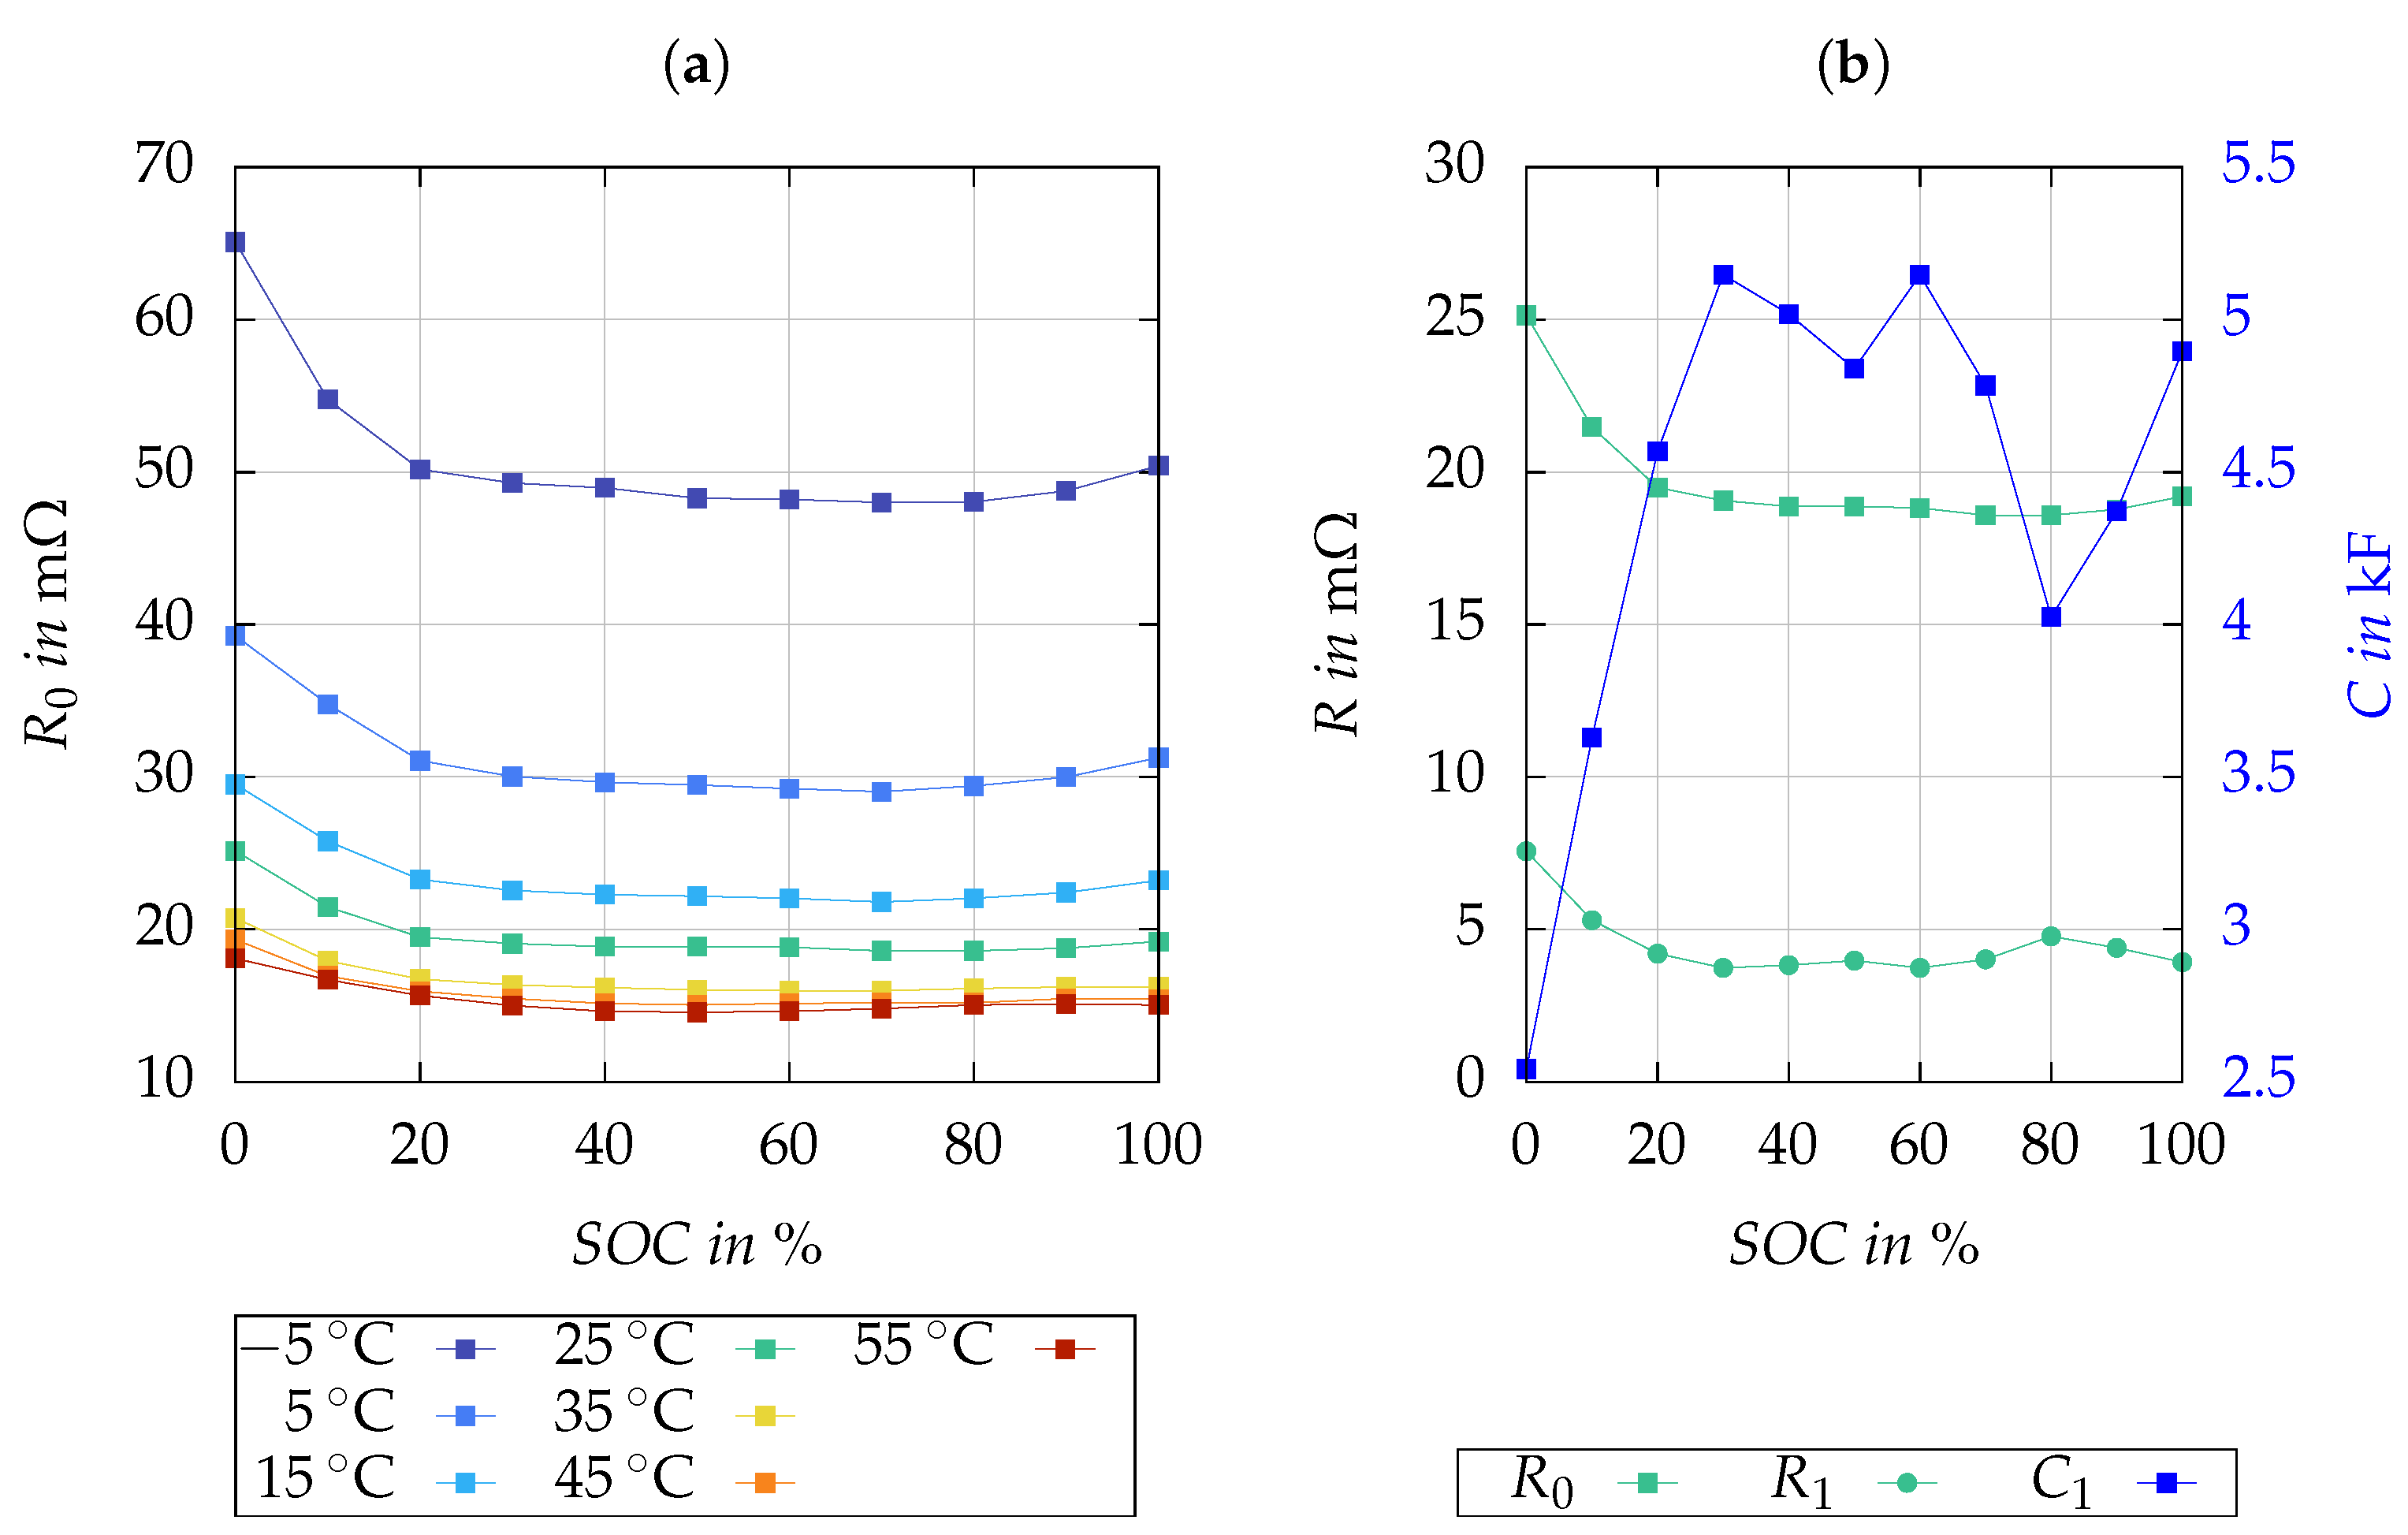
Figure 7a demonstrates the relationship of
with temperature and SOC, while
Figure 7b illustrates the SOC-dependent behaviors of
,
and
at 25 °C. As expected,
decreases with increasing temperature. The parameter identification results indicate that the effect of SOC on the model parameters
,
and
is limited. Consequently, for simplicity, they are considered constant with respect to SOC in Equation (
5).
To validate our cell model and, subsequently, the SOC estimator, we established a comprehensive testing procedure. Initially, the test cell was fully discharged to its minimum voltage limit, establishing a reference point for the baseline SOC calculations. This was as follows: First, a complete charge–discharge cycle at a rate of C/3 to capture the cell’s static characteristics. Subsequently, the cell was charged to various SOC levels (20%, 30%, 50%, 70%, 90%) and subjected to a dynamic current profile that was synthetically generated from empirical LEV riding data to emulate real-world conditions.
The validation process was paralleled by simulating the same test sequence using the developed cell model within the MATLAB/Simulink environment. The simulated cell voltages were then compared with the experimental data to evaluate the model’s fidelity. In this study, we employed the root mean square error (RMSE) as the metric for quantifying the discrepancy between the simulated or estimated values
and measured or reference values
x. Equation (
9) describes the RMSE calculation, where
n represents the count of data points.
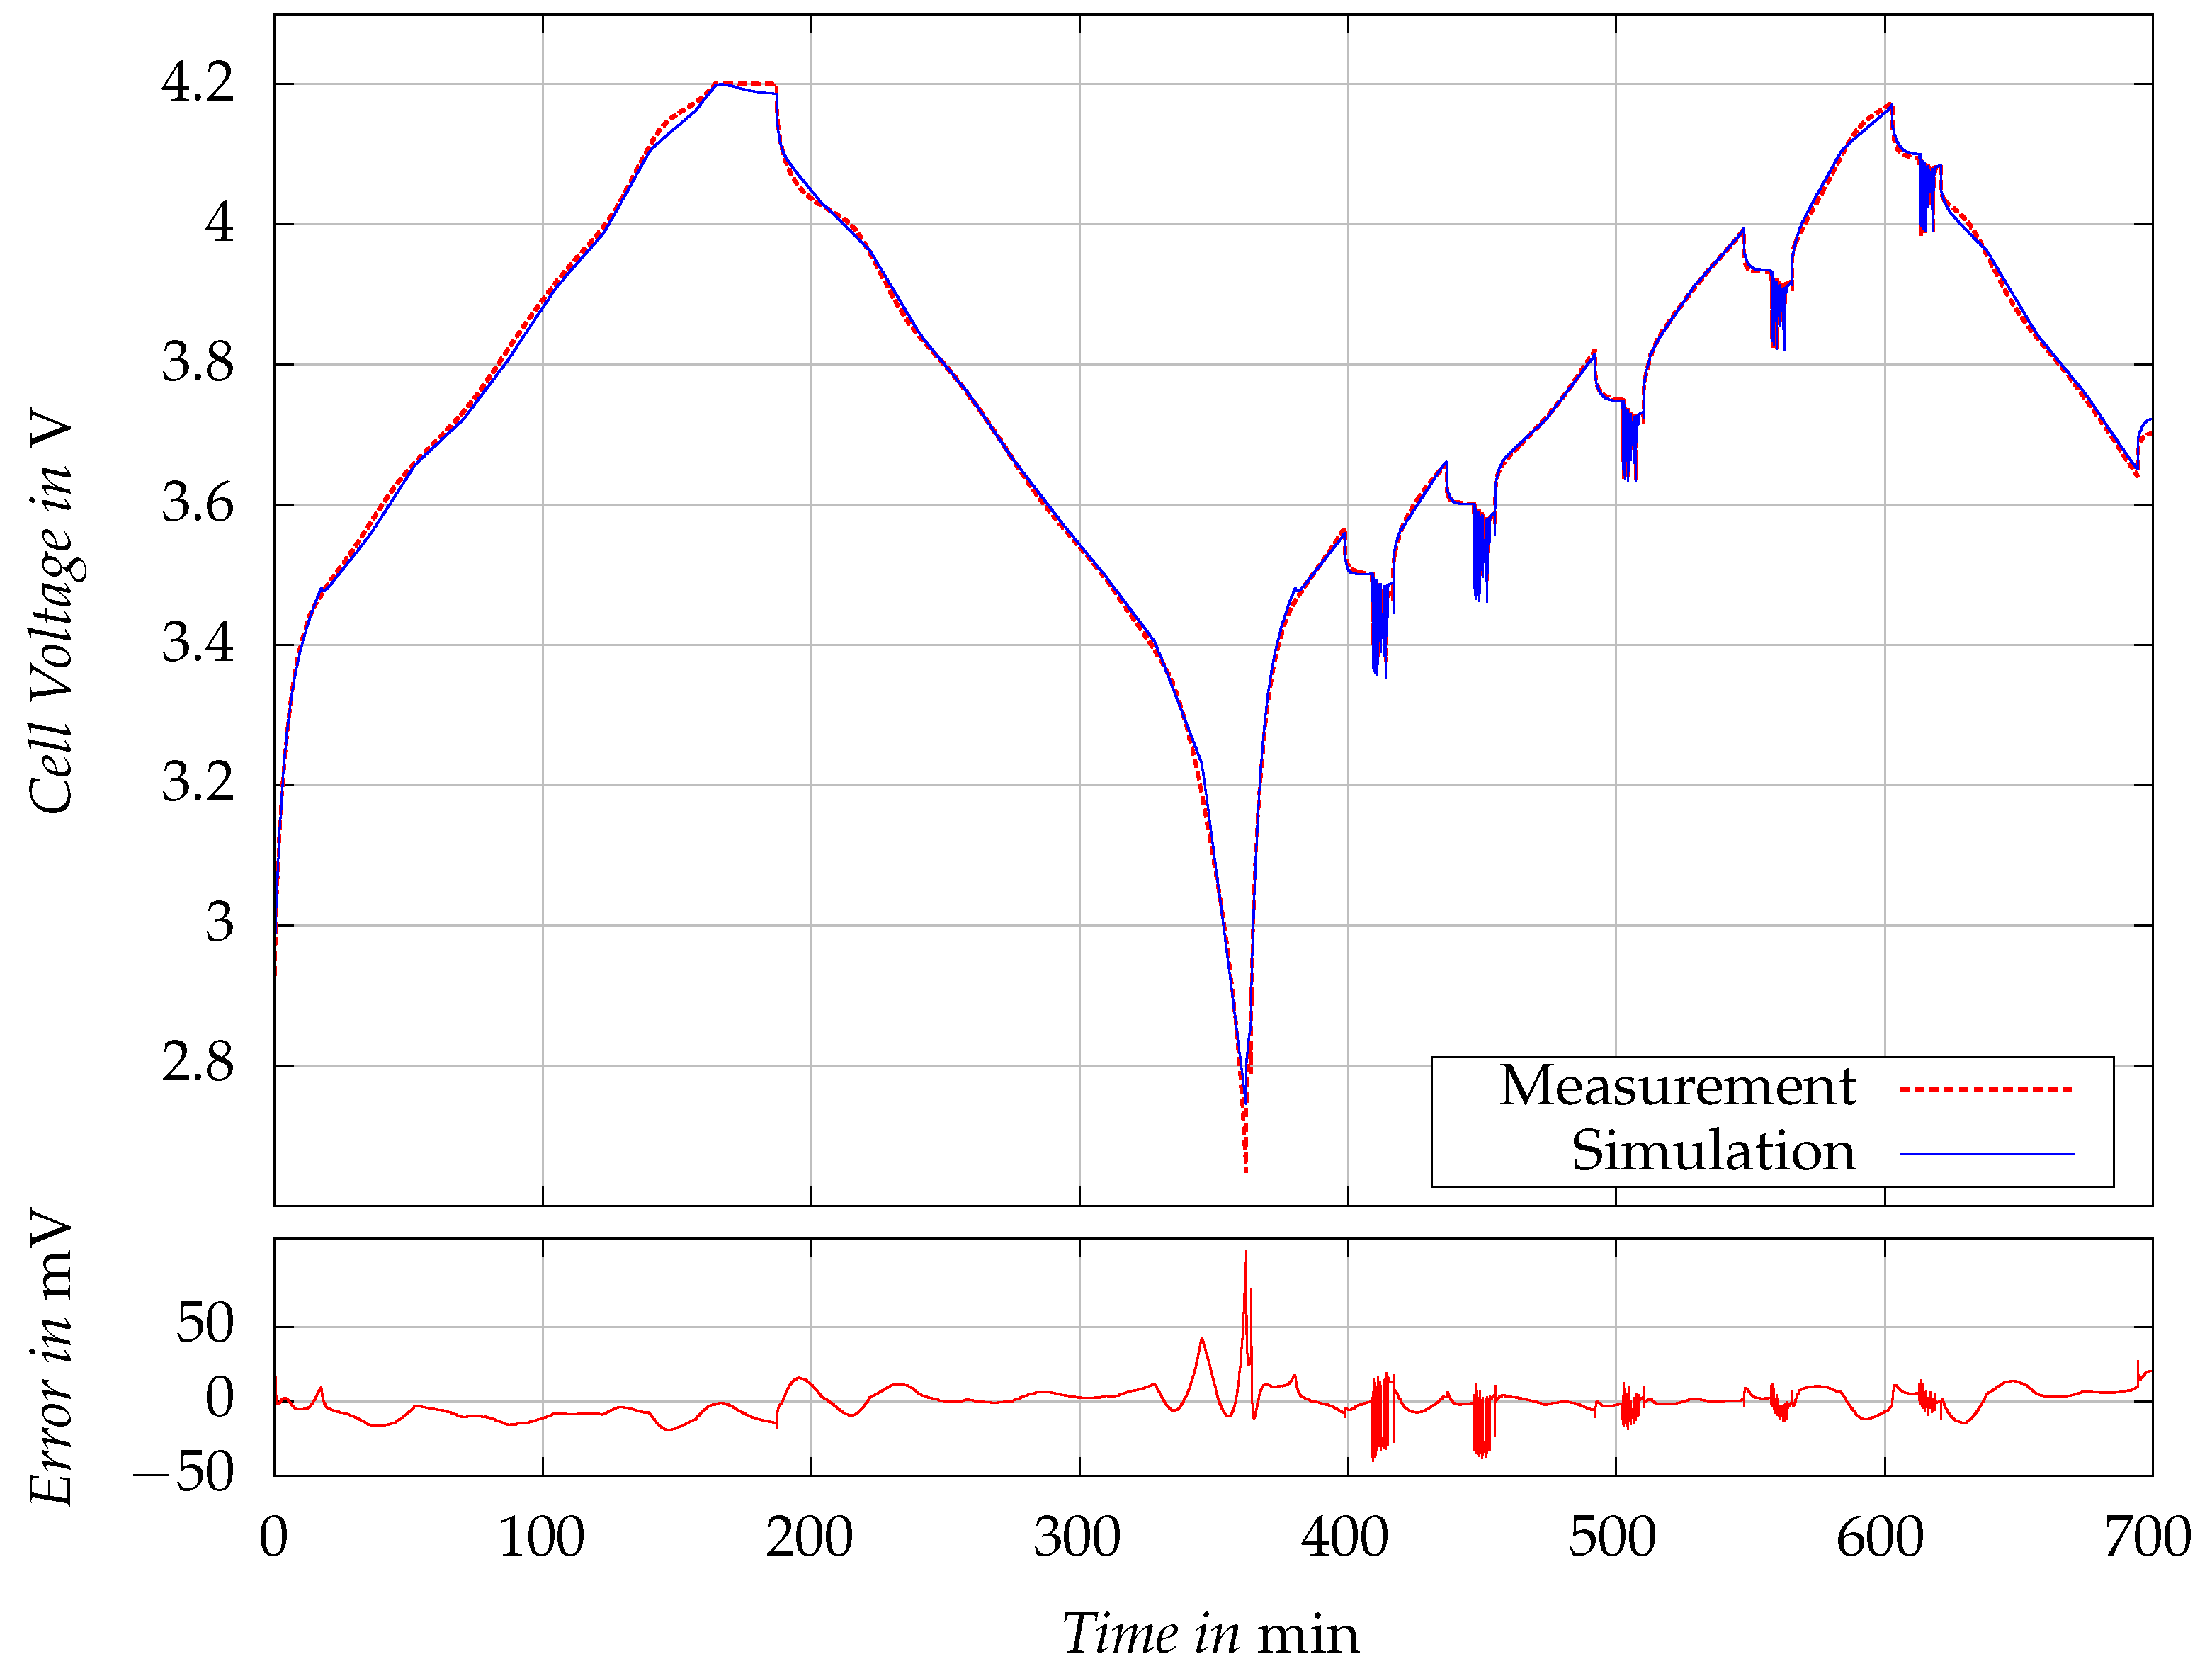
Figure 8 visualizes the measured cell voltages
and the simulated cell voltages
for the validation test, as well as the corresponding simulation error. The RMSE of the voltage simulation is
. An exceptionally high error of
was observed outside of the operating range, notably when the cell was fully discharged. Despite this outlier, the simulation model’s performance is robust, with the RMSE reflecting a high fidelity in capturing the cell’s voltage dynamics. The model’s performance remains consistent not only under constant current conditions, as noted during the initial charge/discharge cycle of the test, but also under dynamic load conditions. This robustness is observable in the second phase of the validation test, wherein the cell tested with realistic driving profiles of LEV across various levels of SOC.
3.3. Results of EKF-Based State of Charge Estimator
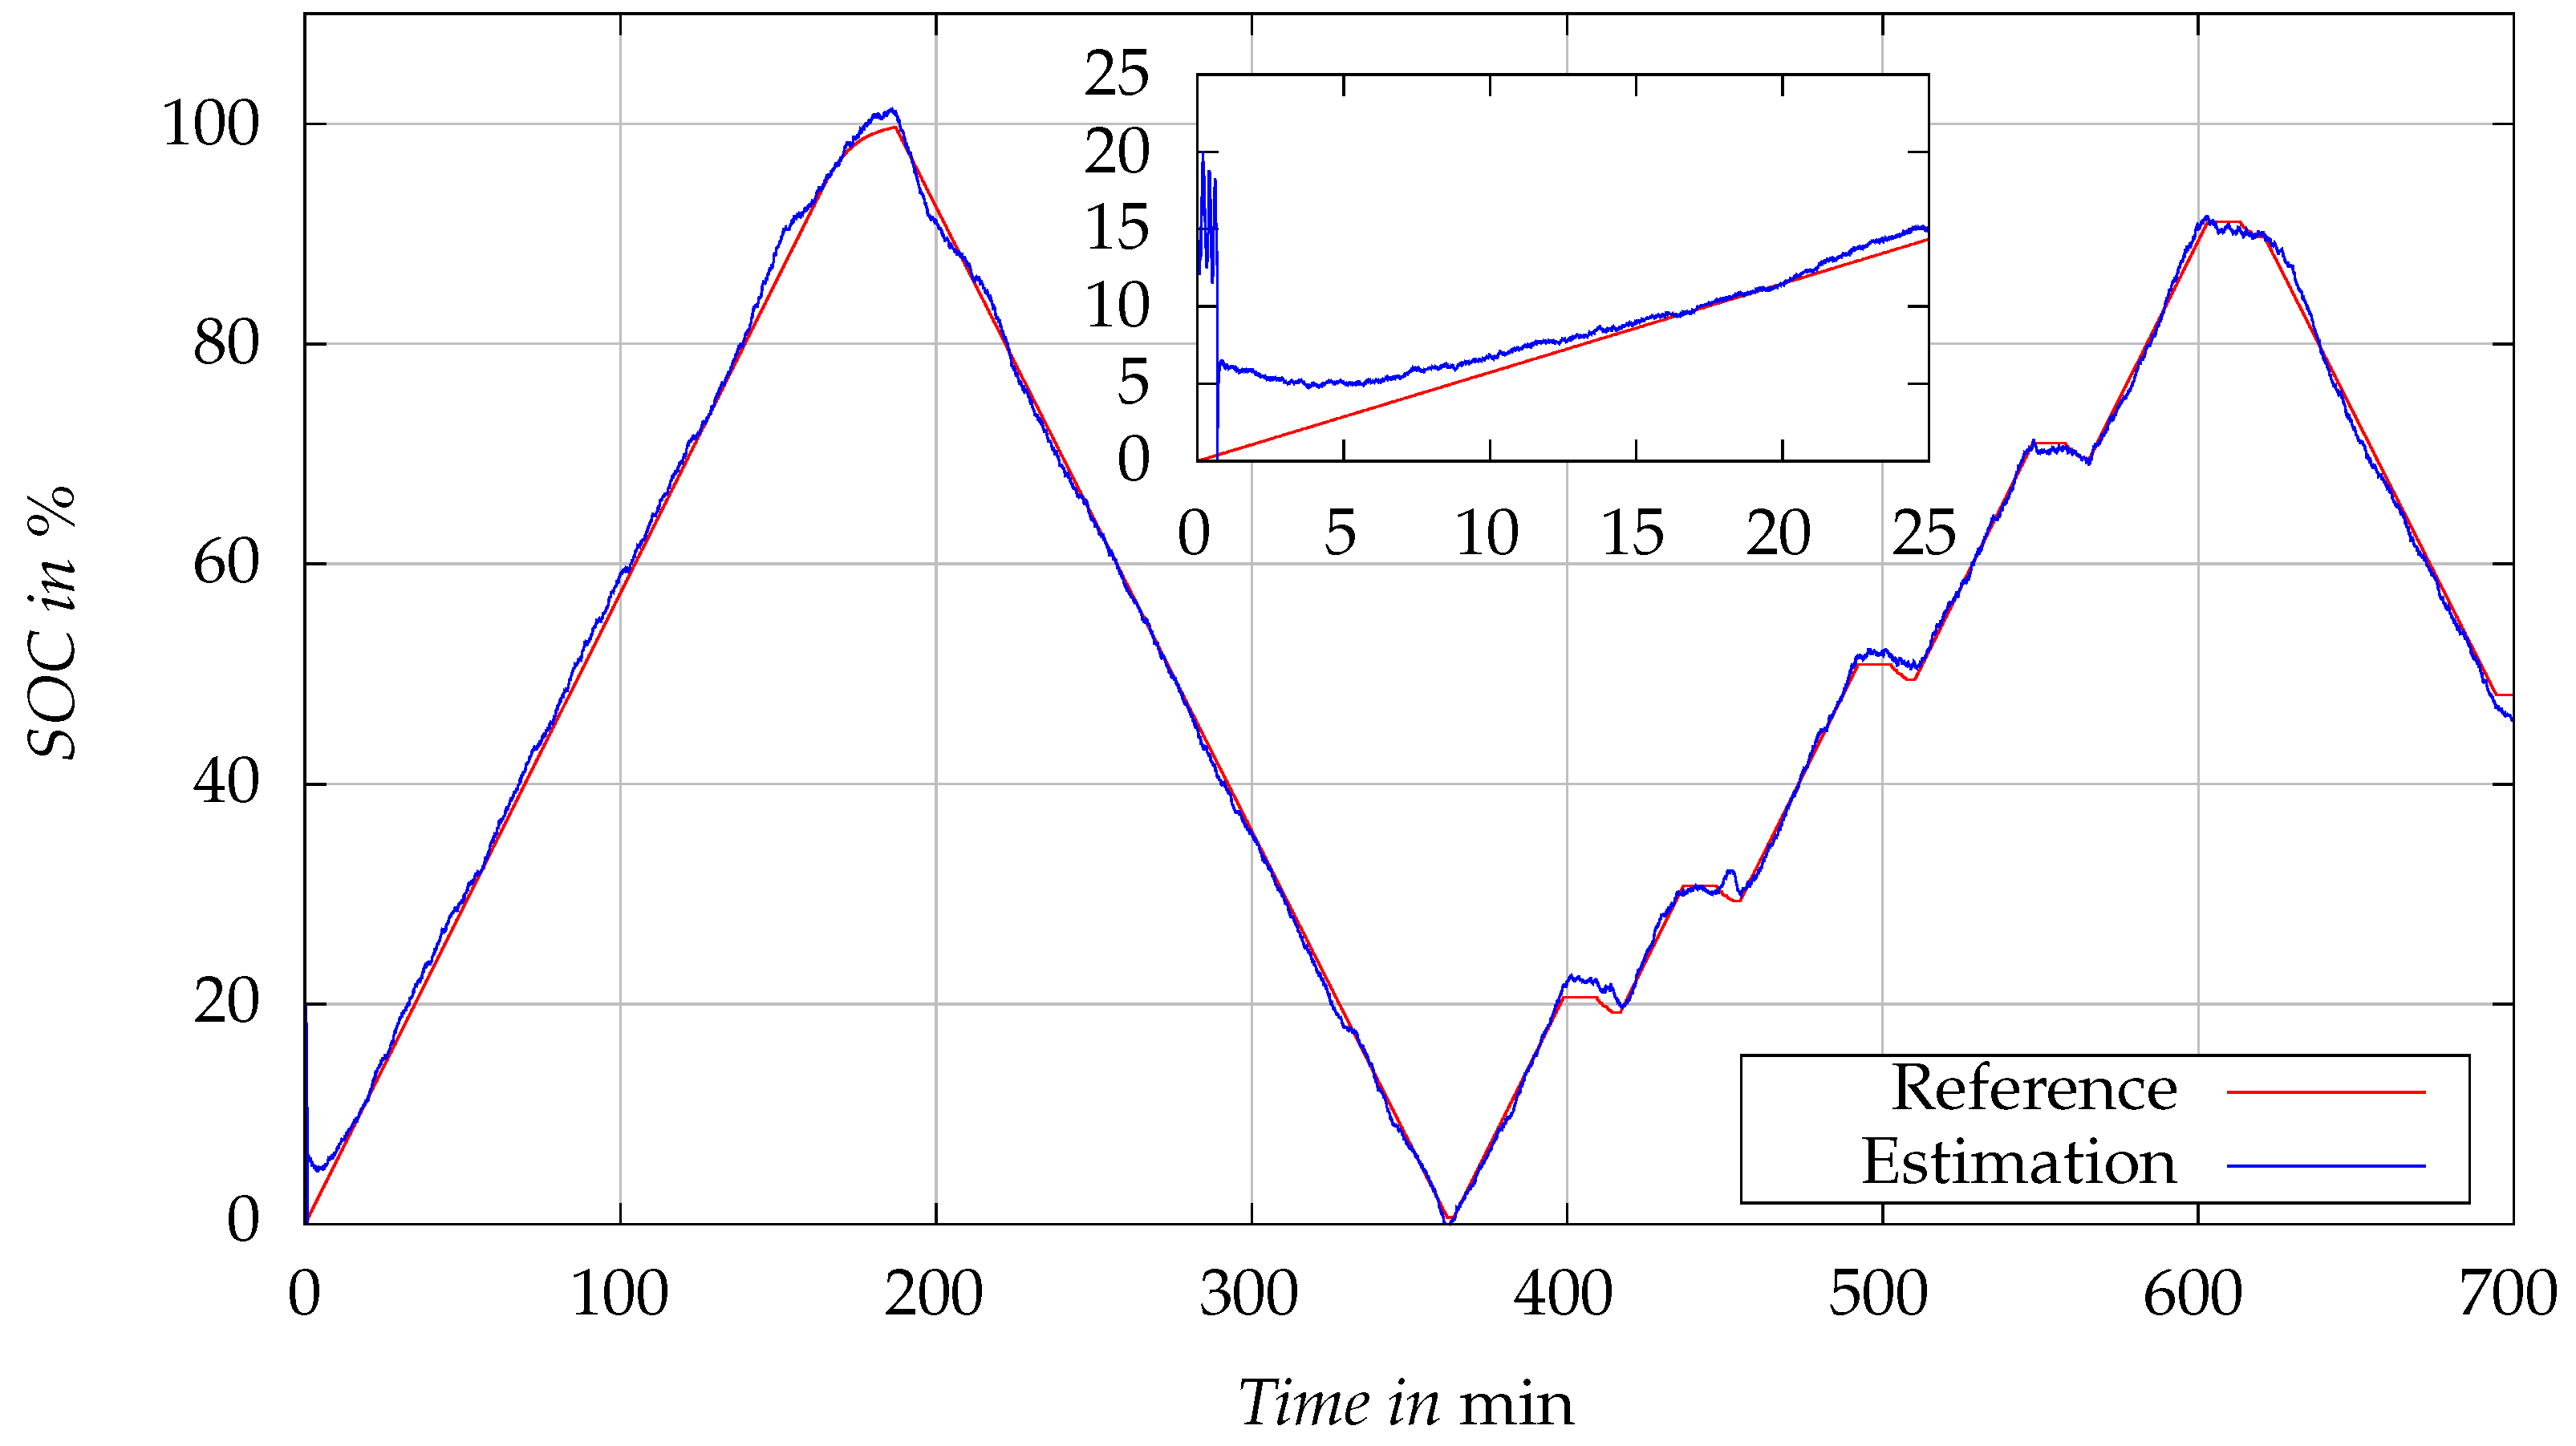
Figure 9 presents the validation results of the developed EKF-based SOC estimator at the temperature of 25 °C. The graph compares the SOC values estimated by the EKF algorithm with the reference SOC values. The reference SOC values are derived using Coulomb counting method. The current is measured with a resolution of 1
and an accuracy of 0.1%. The test current profile employed here is identical to the one previously used to validate the cell model.
Initially, the SOC estimation begins with an intentional discrepancy, starting at an estimated SOC of 20% when the actual reference SOC is at 0%. This initial error serves to test the robustness of the EKF algorithm in correcting errors caused by incorrect initial values. As the test progresses, the EKF-estimated SOC rapidly aligns with the reference SOC values, showcasing the estimator’s capability to rectify the initial error.
In the zoomed inset, it is clearly evident that despite the substantial initial estimation error, the EKF algorithm quickly converges to the reference SOC. The close tracking between the estimated and reference values beyond this convergence point confirms the precision of the EKF algorithm in real-time SOC estimation under the specified test conditions. The RMSE of the test, including the initial value error, is 1.08%.
The algorithm’s ability to accurately track the SOC, especially in the charging phase, enables precise control of the charging current, which is critical for the proposed SOC-dependent charging algorithm.
3.4. Aging Performance of the MCC Proposed Charging Algorithm
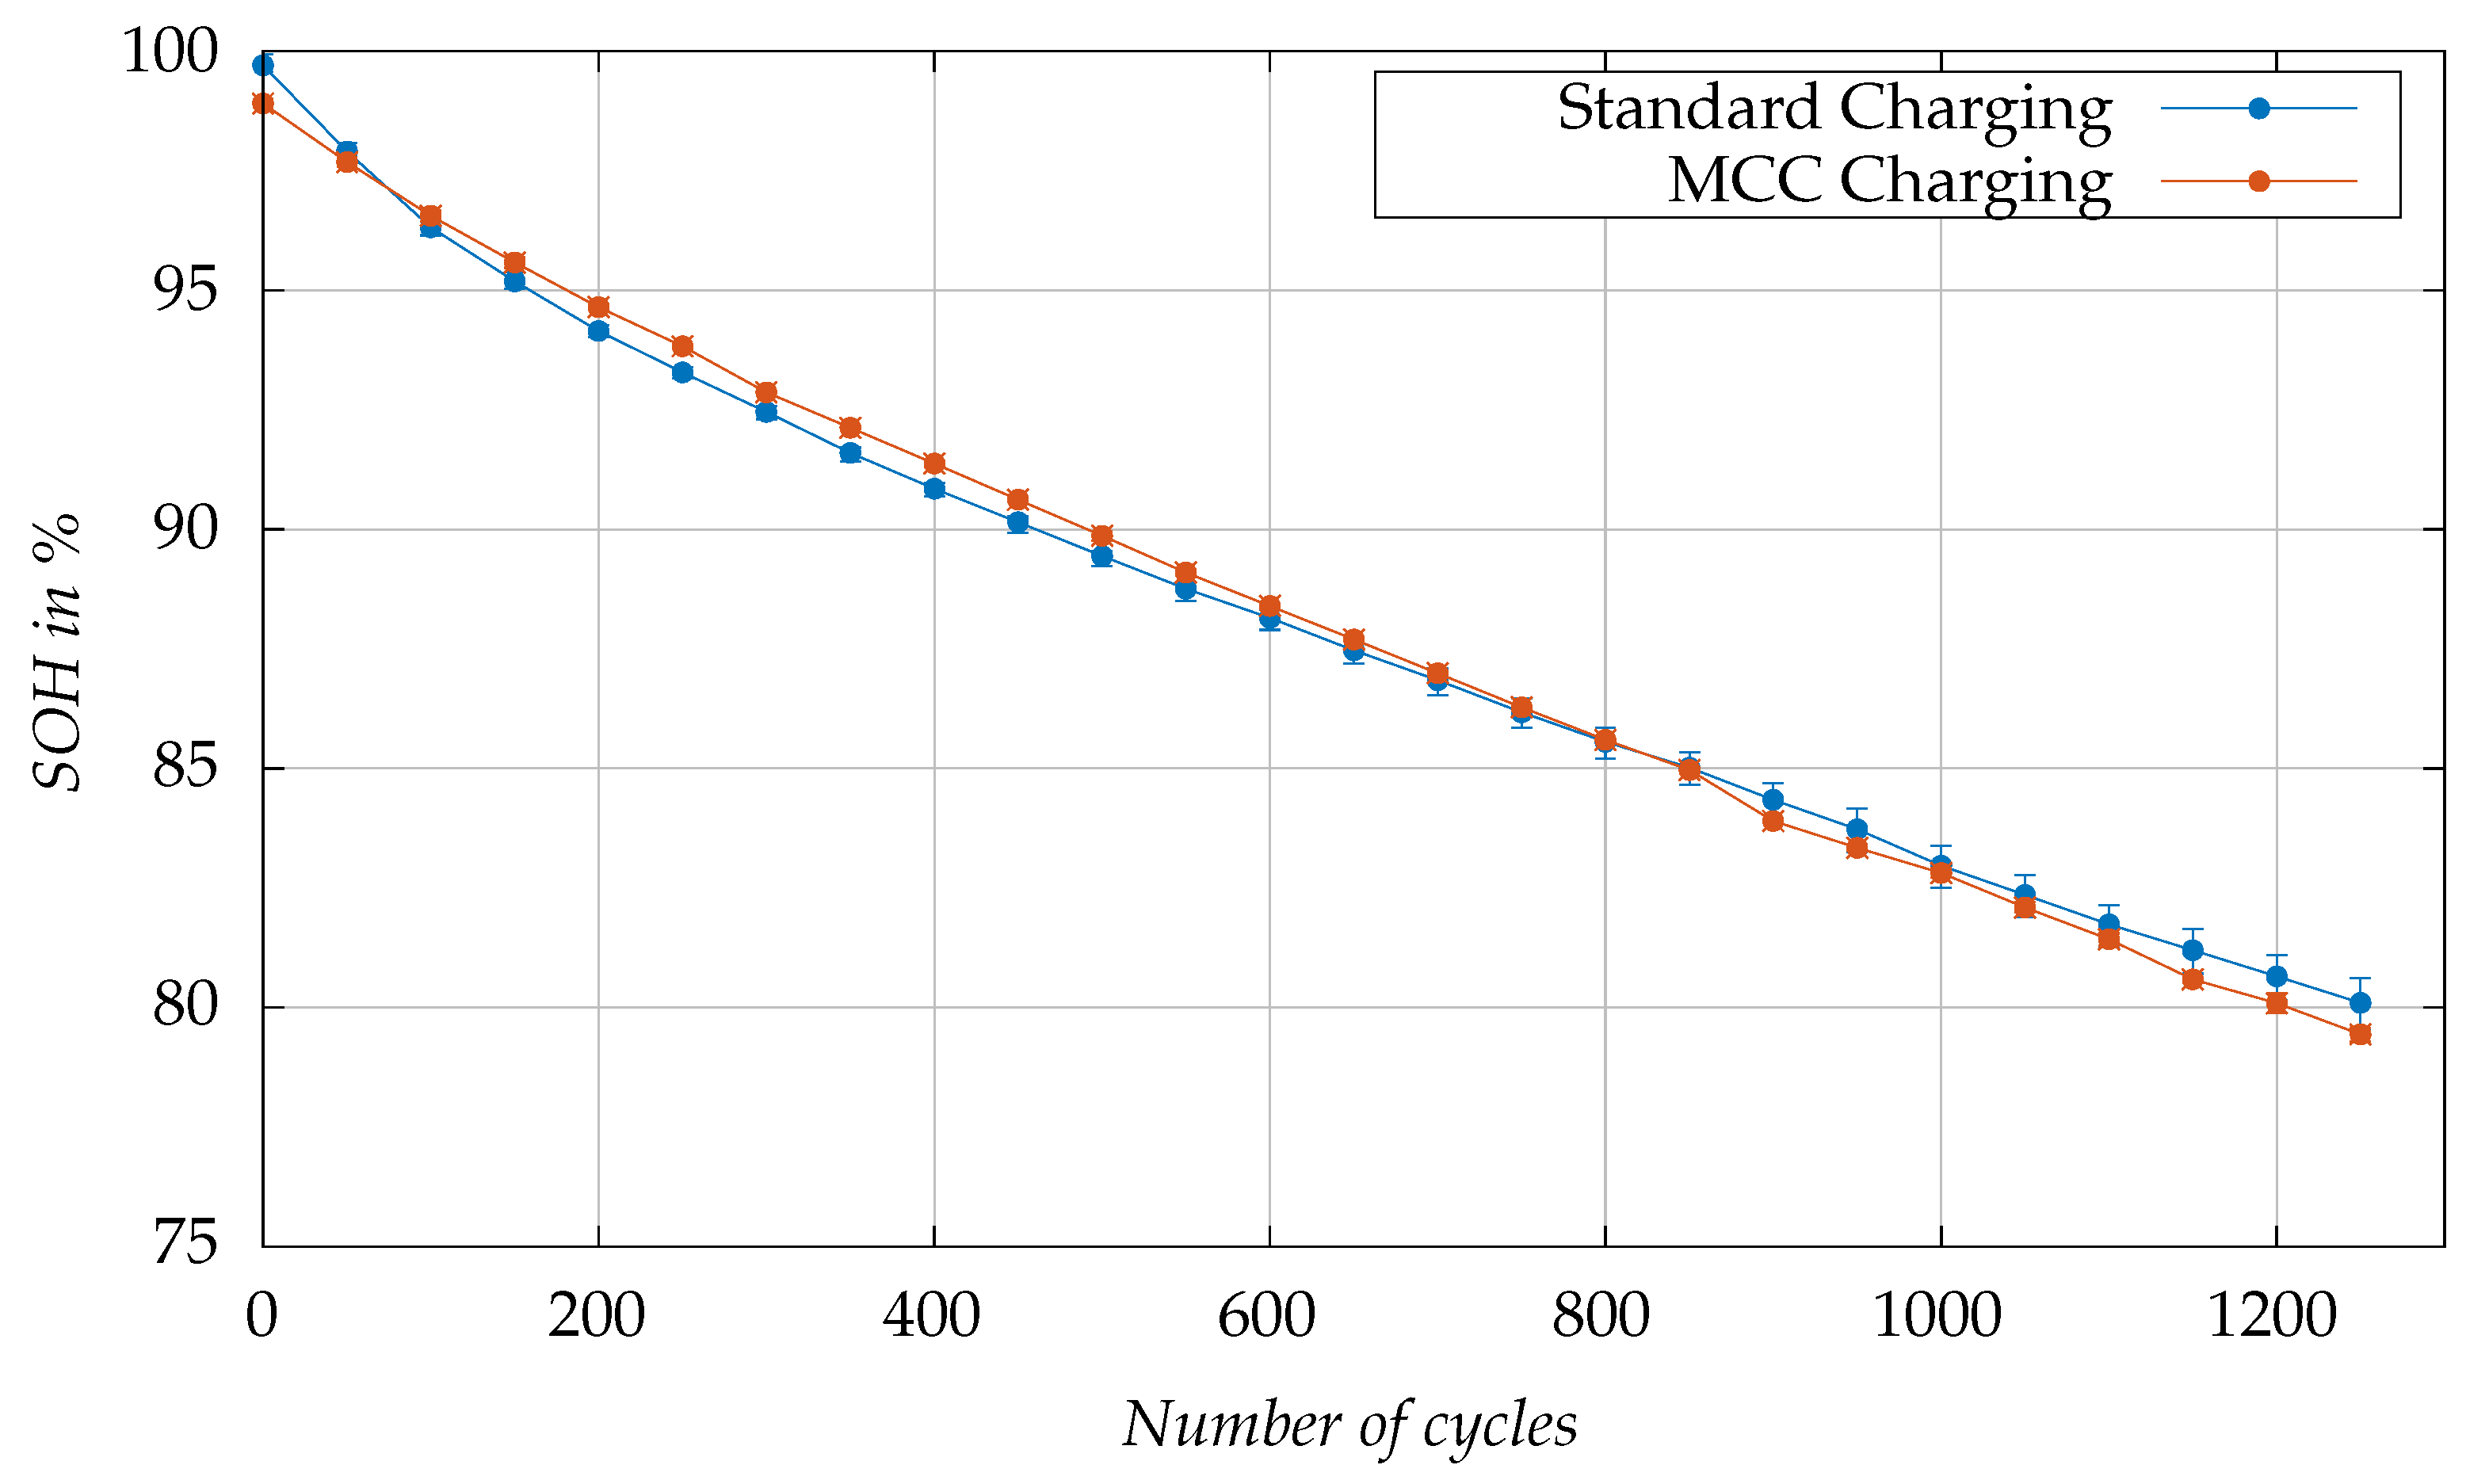
Figure 10 visualizes the aging test results, showing the change in SOH as a function of the number of cycles. The figure displays the minimum, maximum, and mean values for each measurement. We tested three cells under standard charging and two cells with MCC charging. The deviation between the cells in each group is negligible. The slight variation in SOH observed at the beginning of the tests between the cells subjected to standard charging, and those undergoing MCC charging can be attributed to the different calendar aging loads resulting from varying storage times of the cells. Notably, the standard charging test campaign started significantly earlier than the MCC charging test campaign. Furthermore, a slight drop in SOH of the cells tested with MCC charging after 850 cycles is observed, which results from an interruption in testing for eleven days due to maintenance work in the test field. During the maintenance work, the cells were disconnected and subsequently reconnected. The contacting is accompanied by certain contact resistances, which cause a slight scattering of measurement data of individual cells and presumably also contribute to the observed drop.
The aging rate under MCC charging is slightly slower in the first part of the aging test (up to 90% SOH) compared to standard charging, and then becomes similar in the second part of the test. The end of life (EOL), determined as 80% SOH, was reached approximately 50 cycles sooner in cells subjected to MCC charging, when mean values are considered. Meanwhile, a cell subjected to standard charging reached EOL concurrently, at the 1200-cycle threshold. These observations support the expectation that the proposed MCC charging, despite its efficiency in reducing charging time, does not significantly affect the rate of aging compared to standard charging. The trends observed are consistent across the test for both charging methods, highlighting the successful transfer of insights from lab-scale experimental three-electrode cells to commercial cylindrical cells. This consistency demonstrates the scalability and practical applicability of the proposed MCC charging development method.
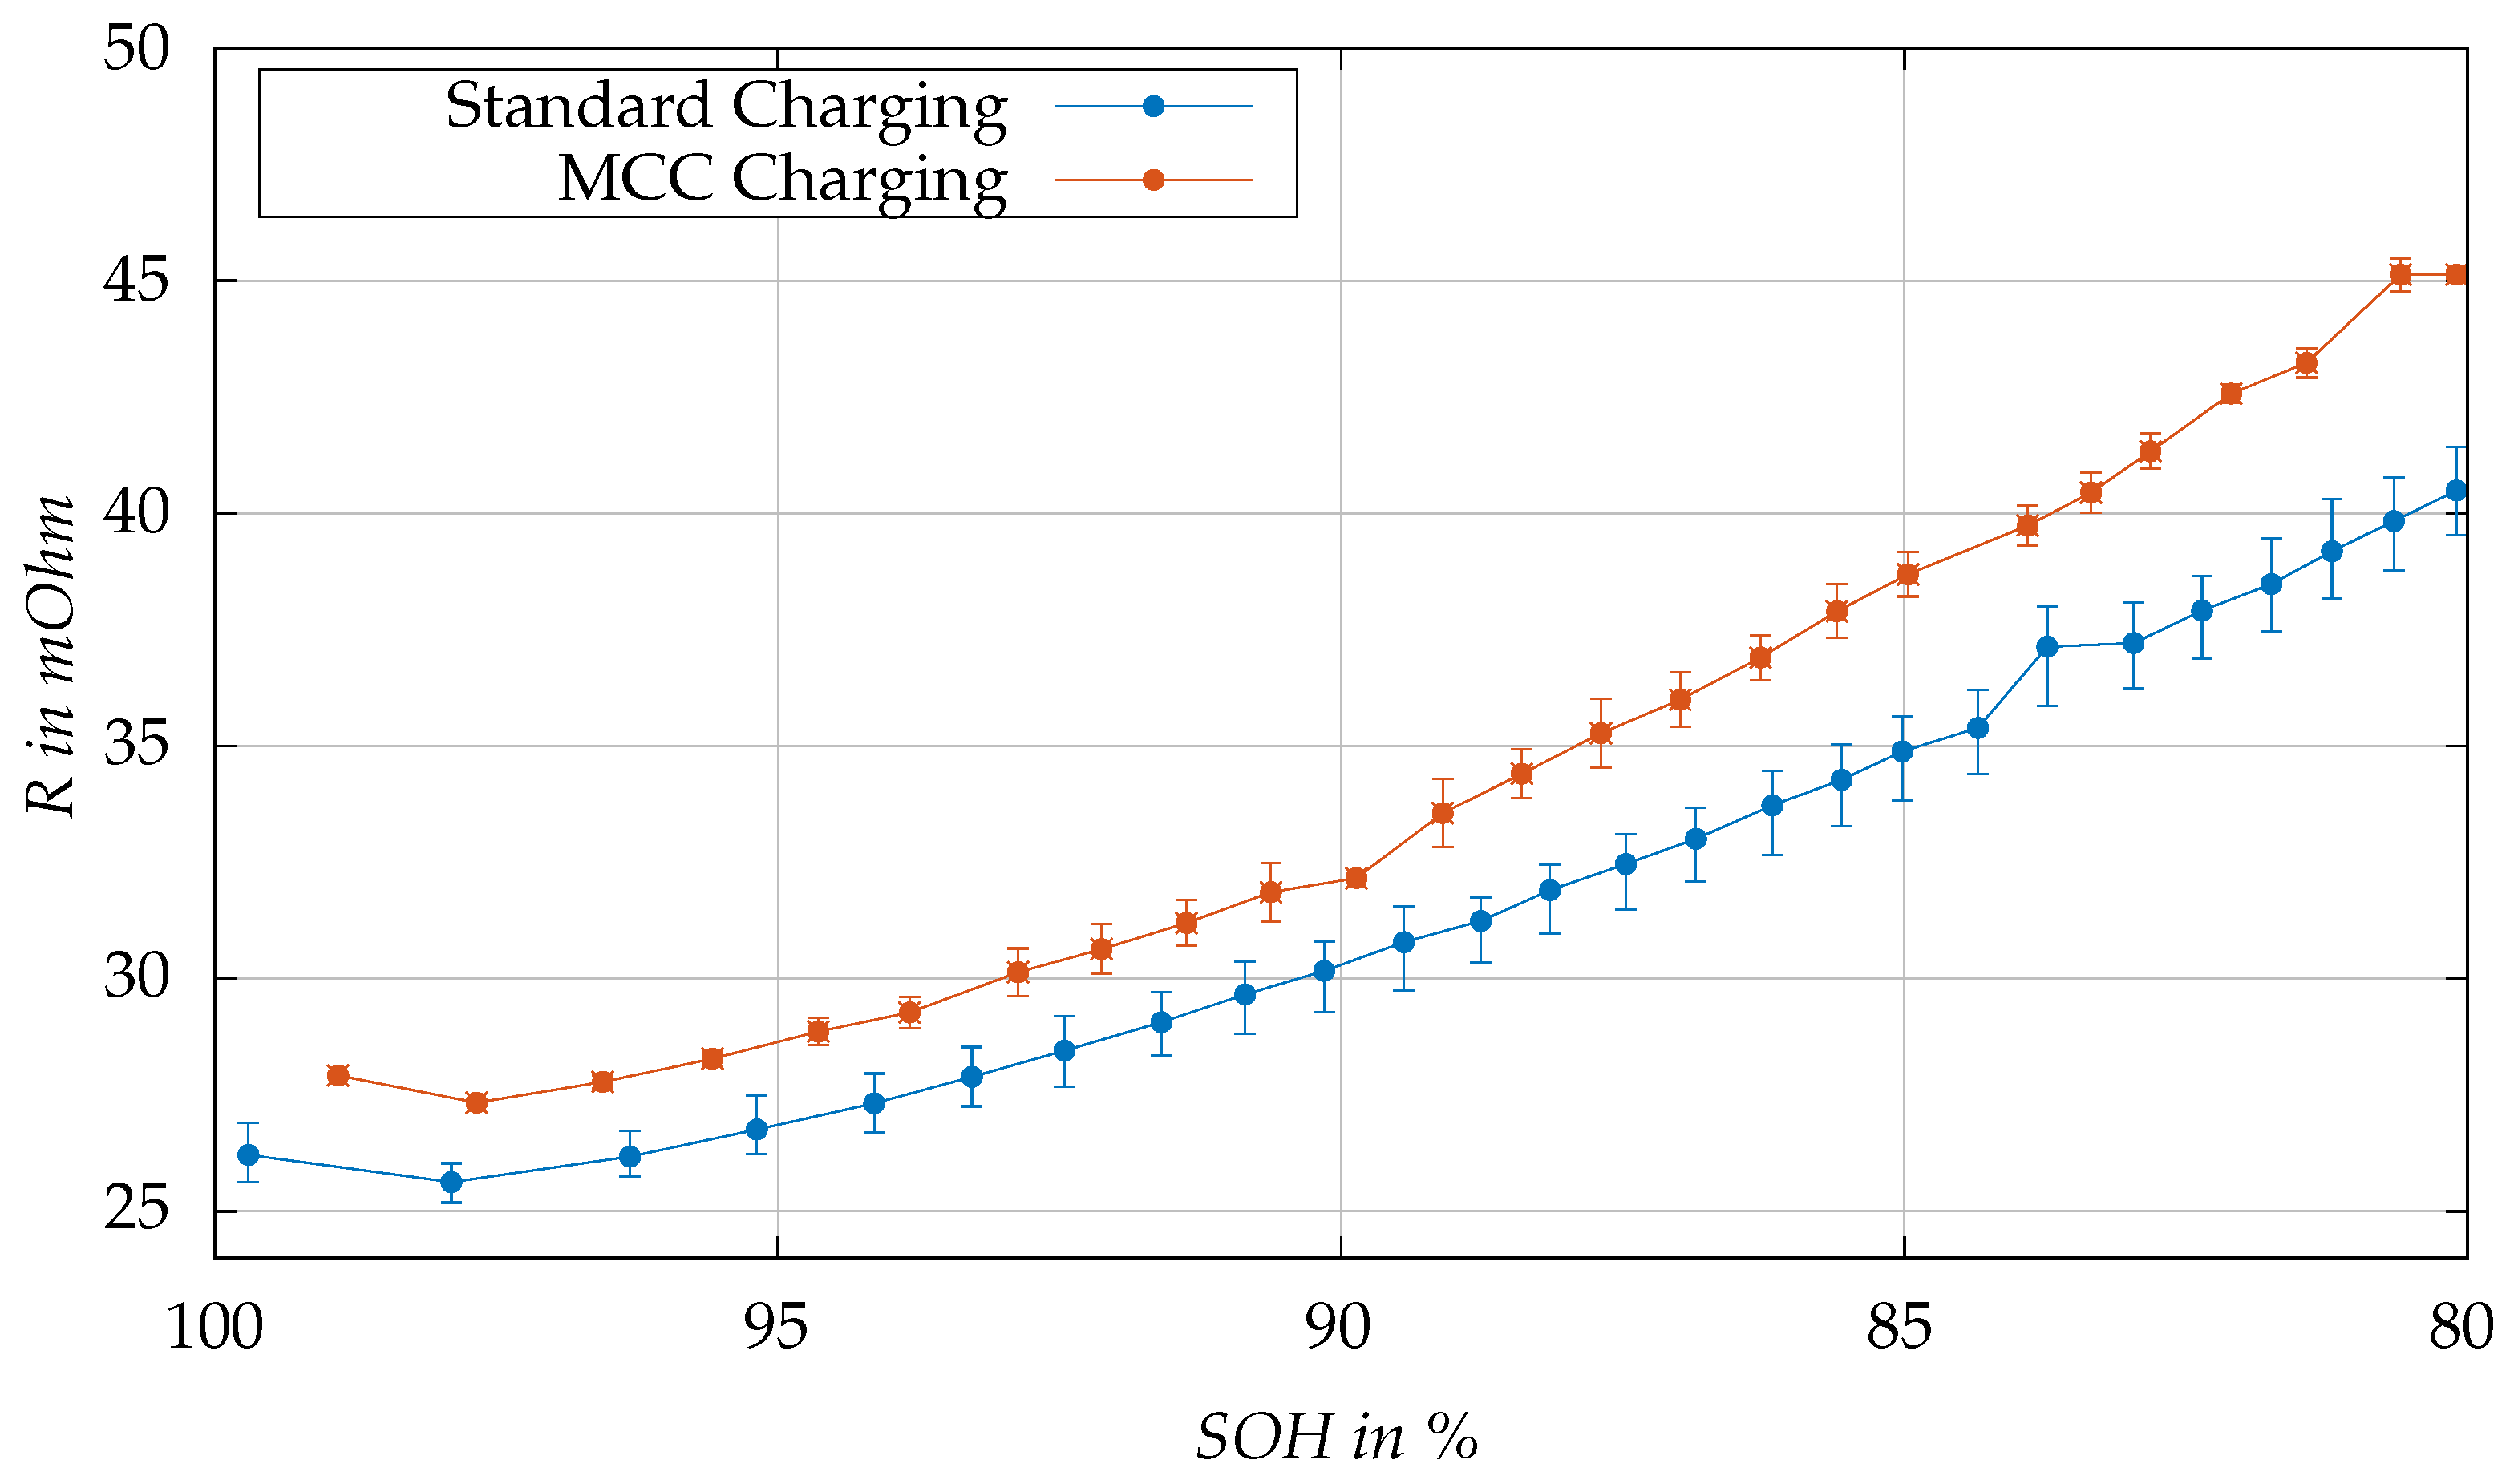
Figure 11 illustrates the change in total internal resistance (
+
) at 50% SOC at 25 °C, throughout the aging process, for the proposed MCC charging protocol versus the standard charging protocol. In the mid-SOC range, the cell’s resistance is more stable and exhibits a plateau. Therefore, 50% SOC is used for the resistance comparisons to reduce the impact of aging on SOC accuracy. The initial disparity in resistance and SOH values between the two tests, as previously discussed, is attributed to the varying storage time of the cells. Both sets of cells show a similar small decrease in internal resistance during the first cycles of the aging test. This is a typical effect of partial recovery after longer storage time. Then, both tests show an expected increase in resistance values over aging. The parallel trends observed indicate that the MCC charging algorithm does not induce additional Li-plating, which would be suggested by an unusual increase in resistance. These findings support our capacity test results, reinforcing that the MCC algorithm, designed for fast charging, preserves the integrity of the cell aging characteristics.
4. Discussion and Conclusions
This paper significantly contributes to the field of battery MCC charging technology by enhancing the existing framework with the integration of a high-accuracy SOC estimator and by demonstrating its applicability to commercial cylindrical cells with NMC cell chemistry. The successful integration facilitates the transfer of precise SOC thresholds derived from three-electrode cell experiments to the commercial cell level, thereby enhancing practical applications and bridging the gap between experimental insights and industrial implementation.
We introduced an aging-optimized, SOC-dependent MCC charging algorithm designed to decrease charging times without accelerating battery degradation, by reducing the risk of Li-plating. This study underlines the importance of combining electrochemical analysis with modeling and estimation techniques to address the key challenges in battery charging. Our approach, leveraging SOC as a transfer parameter, ensures the scalability of laboratory findings to industrial applications.
The optimal charging pattern was determined using an experimental three-electrode cell, which allowed monitoring the anode potential to detect Li-plating. By incorporating the SOC thresholds derived from these experiments, the proposed MCC charging protocol offers enhanced stability compared to conventional voltage-based MCC protocols. This stability is rooted in the SOC-based approach is reduced susceptibility to factors that typically affect voltage-based protocols, such as temperature variations and electrochemical hysteresis.
To ensure proper control of the charging current in real-world applications, we developed an accurate State of Charge (SOC) estimator with a Root Mean Square Error (RMSE) of 1.08%, based on the Extended Kalman Filter (EKF), suitable for Battery Management Systems (BMS). Our experimental results demonstrate that our approach can decrease the time to reach 80% SOC by 30%, compared to the conventional constant CC-CV charging method, without accelerating the aging processes.
The integration of precise SOC thresholds from three-electrode experiments with an accurate SOC estimator facilitates the development of scalable charging guidelines for standard commercial cells. This method eliminates the need for physical reference electrodes during application and reduces the requirement for extensive cell testing in the charging protocol development phase.
In conclusion, the proposed aging-optimized, SOC-dependent MCC charging algorithm effectively reduces charging time while minimizing the risk of Li-plating, thereby preventing the acceleration of aging caused by fast charging. Although the study yields promising outcomes, incorporating temperature dependency into the MCC algorithm could potentially enhance charging efficiency and prolong battery life under variable environmental conditions. Future work will involve conducting three-electrode experiments at different temperatures to extend the charging profiles and incorporate temperature dependency. Consequently, subsequent research will explore the impact of temperature more thoroughly and investigate the underlying degradation mechanisms through post-mortem analyses, continuing to advance our understanding and application of efficient charging methodologies. This study contributes to the advancement of LIB charging technologies, particularly for the rapidly growing light electric vehicle (LEV) sector.
