Abstract
The mechanical pressure that arises from the external structure of the automotive lithium battery module and its fixed devices can give rise to the concentration and damage of the internal stress inside the battery and increase the risks of battery degradation and failure. Commercial batteries cannot be disassembled, and the diffusion stress distribution at different times during discharge is notoriously difficult to determine. This paper, therefore, establishes the electrochemical force-coupling model based on the electrochemical and diffusion mechanics principles of batteries and studies the internal stress distribution of the battery under the diffusion stress of the electrode-material level and external pressure. Mainly driven by the electrochemical potential of the electrode particle diffusion stress stemming from the lithium-concentration difference inside and outside the particles, rupture is more likely to occur at the surface of the negative-electrode active particle at the end of discharge or the beginning of charging, as shown in simulation analysis. The variation in the volume of electrode material also leads to different stress and strain inside different areas, with the order of strain and stress being negative active material > negative collector fluid > positive active material > positive fluid. Therefore, huge stress and deformation will first cause the negative active particles to deviate from the fluid gradually and squeeze the diaphragm, resulting in mechanical failure accordingly.
1. Introduction
Against the backdrop of cutting carbon emissions and achieving the dual-carbon target, new energy vehicles are highly sought after in the car market. For their features like a high output voltage, a high energy density, and a long cycle life [1,2], lithium-ion batteries have emerged as the first choice for energy storage equipment of new energy electric vehicles. A certain pressure or binding force is usually applied to the vehicle battery module so as to keep the battery cell from random displacement and ensure a good battery contact as well. This binding force helps maintain close stacking and contact between cells to provide better current conduction and heat transfer. However, the lithium-induced phase change of the active materials will result in a marked transformation in the volume of lithium-ion battery electrodes. The designing and manufacturing of battery modules, therefore, necessitate considering the binding force and pressure distribution of the battery cell to balance safety and battery performance and maximize the battery’s cycle life.
The lithium-battery-generated stress can be divided into two parts according to the source [3], with part of the mechanical pressure coming externally, such as external extrusion, collision, acupuncture, and other conditions [4]. The other part of the stress comes from the diffusion stress inside the lithium battery. When the lithium ion is embedded in the active particles, the volume of the particles will expand. The active particles’ expansion and contraction result in diffusion stress on the electrode [5]. Currently, there is ample literature on the expansion characteristics and surface pressure distribution of lithium-ion batteries. Verena et al. [6] conducted experiments on a Si/C|NMC811 soft-pack battery at different pressures for flexible compression and at fixed spacing for fixed compression. Their research on the battery surface pressure distribution reveals that low-pressure fixed compression and medium-pressure flexible compression have positive impacts on the cycle life. Prado et al. [7] assessed the relationship between electrode expansion and capacity by tracking the changes in the electrode size through displacement sensors. They found that reducing the electrode porosity leads to an overall higher expansion and irreversible expansion. According to the research by Deich et al. [8], who have conducted a long-term aging study on an NMC ternary battery through experiments, there is a strong linear correlation between the maximum pressure and the health state, internal resistance and energy density, and tolerance and attenuation, which are mainly caused by the increased pressure. The experimental results of Vidal et al. [9] show that the life of all batteries exceeds 80% of the initial capacity after 400 cycles. The cells tested at constant pressure show a capacity retention similar to that observed in hard sleeves after 500 cycles. The cells show better capacity retention at the highest pressure, but also higher resistance at the 30 s pulse of 2C. And, Clerici et al. [10] built an experimental bench with an optical laser sensor to predict the changes in cell-normalized thickness and measure the changes in the thickness of the battery during charging and discharging at various current rates. With the help of the laser band micrometer for his research, Hemmerling et al. [11] have concluded that the thickness change does not vary significantly with the cell height due to the observed mechanism. However, observation shows the battery poles drop slightly in volume as a result of high battery stiffness. Bucci et al. [12], who tested the residual stress of deposited Al2O3 NM films using X-ray diffraction, found that the residual stress of Al2O3 films increases with the deposition velocity and temperature. The miniature Raman spectroscopy technology is used by Liu et al. [13] to study the residual stress of a graphite anode. The results show that the early diffusion stress accumulation is the main source of residual stress, and the long-term accumulated diffusion stress causes the expansion of the active material layer and the rupture of surface particles, resulting in the attenuation of battery capacity. Using a combination of in situ scanning electron microscopy and digital image-related techniques, Tao et al. [14] have found a 50% irreversible expansion in the initial cycle and reversible anisotropic deformation in the subsequent cycle. The average strain in the vertical direction was 4.94%, about 18 times higher than the average strain in the horizontal direction of the electrode [15]. Zhou et al. [16] developed the surface pressure test platform for a semi-rigid cushion battery placed in rigid metal plywood was developed and the experimental results show that the capacity of an aging battery increases irreversibly after compression, which has positive significance for the secondary utilization of the aging battery’s whole life cycle.
The above studies show that deformation will occur to both cylindrical batteries and soft-pack batteries to varying degrees. The traditional experimental methods, however, can only help monitor external features, such as the voltage, temperature, and capacity, and obtaining the stress and strain characteristics of internal particles remains elusive. Researchers have shifted their attention to the use of precise in situ experimental techniques in recent years, but the techniques have yet to find engineering applications restricted by experimental sites and the hefty price. The numerical simulation, however, has its unique advantages. The effectiveness of the model can be verified with only a small number of experiments, and the model can be put into engineering application to observe the internal characteristics of the battery, which effectively shorten the battery development and performance test cycle and help to clarify the relationship between the battery’s internal electrochemistry and force and the coupling mechanism.
Gupta et al. developed a multiscale homogenization model that couples mechanics and electrochemistry at the particle, electrode, and cell scales to obtain electrochemically induced stresses at the above three scales. This homogenization method is particularly effective for extracting the battery’s high-stress regions and can be used to obtain the optimal pressure that must be applied to the end plate of the battery module [17]. Actually, the battery’s expansion and contraction are accompanied by changes in the electrode’s material properties, such as compressive modulus and other parameters. Von Kessel proposed a modeling method for complex compressive mechanical behavior, which can simulate the viscoelastic and poreelastic properties of large-scale lithium-ion batteries, and the model, if further developed and correctly parameterized, can be implemented in the battery management system [18].
When building the model, the electrode’s expansion displacement can also be input into the model, and Bernhard Rieger et al. proposed a model that considers the change in battery thickness. In order to increase the accuracy of the model, the effect of the thermal expansion of the battery on the expansion displacement of the battery is added by intercalation replacement, and the concentration-dependent volume change is used in the graphite electrode to improve the accuracy of the model [15]. Bernhard Rieger proposes an efficient multi-dimensional approach to modeling the mechanical effects of lithium-ion batteries, taking into account the homogeneity of the temperature or current density distribution. The above approach also considers the mechanical mechanism of the displacement distribution on the cell due to volume changes and the thermal expansion superposition caused by intercalation, as well as stresses in the electrode active material particles. The two battery designs were compared, including the same electrode cell size and different tab positions. The model shows that, during the discharging process, the local cell displacement changes only slightly, due to the superposition of thermal and intercalation displacement [19]. Mei and Wang established a heterogeneous electrochemical–mechanical coupling model, calculated the distribution of the lithium-concentration field and particle diffusion stress in the electrode particles through simulation, and calculated the electrode particle concentration distribution more accurately through the heterogeneous model. They concluded that the equivalent stress is larger on the surface of the electrode particles, while the lithium-concentration distribution of the positive and negative-electrode particles differs, with the lithium concentration of adjacent particles in the positive electrode being higher and that of adjacent particles in the negative electrode being lower. Excessive diffusion stress within the electrode particles hinders the diffusion of lithium ions within the particles [20].
Zhang proposed a new coupled electrochemical–mechanical model to account for the changes in porosity and transmission distance due to lithium intercalation and applied pressure. The experimental results show that the model can accurately describe the voltage change of the battery at different discharging rates, and reveal the potential effect of mechanical deformation on the electrochemical behavior of the battery at high rates [21]. Chen et al. established a mechanical–electrochemical coupling model of silicon–carbon cathode lithium-ion batteries and used Si-C550/NMC811 batteries to verify the multi-physics coupling model. This model is used to analyze the electrochemical, stress, and volumetric expansion behaviors of the experimental battery. They found that the design parameters, such as the mechanical strength, press density, and NP ratio of the casing, have a direct impact on the maximum power density and energy density of the battery [22].
Through the study and understanding of the previous research status, it is found that there are few studies on the diffusion stress and strain distribution in the battery. This paper, therefore, establishes a one-dimensional and three-dimensional stress-simulation model, verifies the accuracy of the electrochemical and mechanical model through experiments, and analyzes the distribution of diffusion stress and strain in the battery at the active particle level and the battery level through the established coupling model. The framework of this paper is shown in Figure 1, and the specific research content is as follows:
(1) An electrochemical–mechanical coupling model was established based on the internal electrochemical principle of lithium-ion batteries and the relationship between the electrochemistry and mechanical properties;
(2) A battery electrical performance test platform and a cyclic expansion stress test platform were built to obtain the basic performance data of the test battery, including charging and discharging tests at different rates and battery surface pressure tests during discharging. The accuracy of the model is verified by the battery’s basic performance test data;
(3) Analysis of the one-dimensional electrochemical–mechanical coupling model shows that the difference between lithium concentration inside and outside the particles is the main factor that induces the electrode diffusion stress, and a study is conducted on the influence of external conditions, such as ambient temperature and magnification, on the electrode diffusion stress. By analyzing the three-dimensional electrochemical–mechanical coupling model, we obtain the distribution of diffusion stress and strain in the battery.
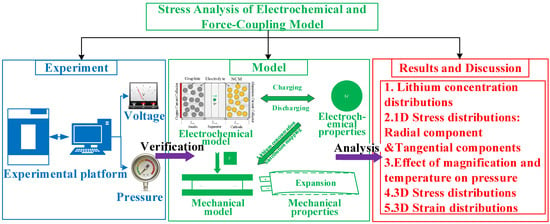
Figure 1.
Schematic diagram of the article framework.
2. Establishment and Validation of Electrochemical–Mechanical Coupling Model
Based on the theory of porous electrodes, an electrochemical model of lithium-ion batteries is established using a pseudo-two-dimensional (P2D) model. Then, a particle-scale diffusion-induced stress model is then coupled based on the distribution of lithium-ion concentration in the positive and negative active particles to analyze and study the stress and strain inside the active particles. The schematic diagram of the P2D model is shown in Figure 2. It can be seen from the figure that the reaction domain of the P2D model is mainly divided into two phases and three regions, which are the solid-phase region (electrode solid particles) and the liquid-phase region (electrode and diaphragm pores). The three-region reaction mainly includes solid-phase diffusion and conduction, liquid-phase diffusion and conductive migration, and interfacial electrochemical reaction.
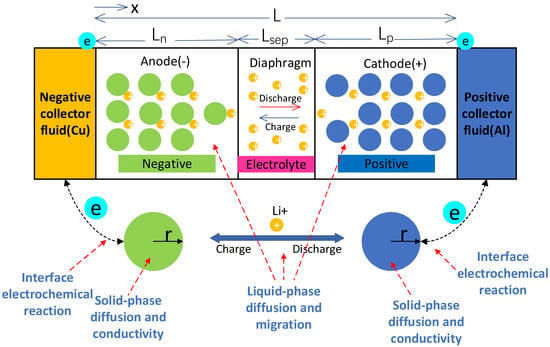
Figure 2.
Schematic diagram of the lithium-ion battery model.
2.1. Establishment of Electrochemical Model
When the lithium-ion battery is normally charged and discharged, the electrochemical reaction of the active lithium between the positive electrode and the negative electrode can be described by a simplified equation. There are five main electrochemical equations, namely the conservation of solid charge, liquid charge, solid diffusion, liquid diffusion, and B-V electrochemical reaction equations.
- The charge conservation equation;
Both solid- and liquid-phase potentials in lithium-ion batteries conform to Ohm’s law. Among them, the solid-phase Ohm’s law is
is the solid-phase effective conductivity (S·m−1); is the solid-phase ohmic potential (V); is the solid-phase conductivity (S·m−1); is the solid-phase volume fraction; and is the solid-phase current density (A/m−2);
The boundary conditions are as follows:
is the external circuit current (A); is the pole area (m2); is the negative thickness (m); is the positive thickness (m); and is the diaphragm thickness (m).
Ohm’s law for the liquid phase is given by
is the effective conductivity of the liquid phase (S∙m−1); is the liquid-phase potential (V); R is the molar gas constant (J·mol−1·K−1); T is the battery temperature (K); and is the liquid-phase current density (A/m−2).
The boundary conditions followed by the Ohmic law of the liquid phase are as follows:
- 2.
- The liquid-phase diffusion equation;
The concentration distribution of internal lithium ions in the electrolyte phase is obtained based on the Fick material diffusion law, and the control equation is as follows:
is the liquid-phase volume fraction; is the liquid-phase lithium concentration (mol·m−3); is the liquid-phase effective diffusion coefficient (m2·s−1); ; is the number of lithium-ion migrations; is the specific surface area of electrode particles (m−1); and is the electrode lithium-ion flux (mol·s−1·m−2).
The boundary conditions of the liquid-phase diffusion equation are as follows:
- 3.
- Solid-phase diffusion equation;
Solid-phase diffusion is the diffusion of lithium ions inside the active particles of positive- and negative-electrode materials. Solid-phase diffusion of lithium ions can be represented by Fick’s second law in the spherical coordinate system.
is the solid-phase lithium concentration of the positive- and negative-electrode material (mol·m−3); is the positive- and negative-electrode materials active particles lithium-ion solid-phase diffusion coefficient (m2·s−1); and is the active particle radius of the positive- and negative-electrode materials (m);
The boundary conditions for the solid-phase lithium diffusion are as follows:
- 4.
- Electrochemical reaction equation at the solid–liquid phase interface.
The surface of electrolytic particles is solid–liquid phase handover, and the reaction of lithium-ion embedded stripping electrode particles is assumed according to the Bulter–Volmer equation. So, the particle surface current density and the reaction rate can be described by the following equation:
is the exchange current density (A/m−2); is the overpotential (V); is the anode transfer coefficient; is the cathode transfer coefficient; k is the reaction rate constant (m·s−1); and is the maximum solid-phase lithium concentration (mol·m−3).
2.2. Establishment of the Battery Force Mode
From the linear elastic equation, we can obtain the diffusion stress–strain relationship of the spherical particles under the non-uniform distribution of lithium concentration:
is the strain component; E is the Young’s modulus (Pa); is the Poisson ratio; is the Dirac-Dat function, when , , when , ; is the stress component (Pa); is the diffused lithium concentration and initial lithium-concentration difference (mol·m−3); is the partial molar volume (m3·mol).
Since the electrode material is assumed to be spherical particles, the stress of spherical particles can be divided into tangential stress and radial stress, which is indicated by the following equation:
is the tangential strain and is the radial strain.
According to the model assumption, the stress soon reaches the equilibrium speed. The electrode particles in the lithium-ion diffusion process, therefore, can be regarded as a quasi-static mechanical equilibrium system, which is expressed as follows by the equation:
The boundary conditions are as follows:
The relationship between the lithium-ion concentration and the diffusion stress in the electrode particles can be obtained by the boundary condition of the combined Formula (18):
is the average lithium concentration of the electrode active particle (mol·m−3). When r approaches zero, approaches , and we can obtain the following:
According to the above formula, the tangential stress component of the center of the active particle is equal to the radial stress component, and the central particle stress is the hydrostatic stress. Therefore, in the active particle stress, the average hydrostatic stress of the active particle is:
The Von Mises equivalent stress calculation formula is as follows:
2.3. Coupled Relation between the Electrochemical and Force Model
In this coupling process, the electrochemical model first calculates the distribution of the lithium-ion concentration inside the battery to obtain the SOC distribution and, then, couples the concentration distribution into the force model. The force model calculates the distribution of internal diffusion-induced stress based on how the volume of the active material varies with local SOC.
The lithium-ion mole flux J at the electrode solid–liquid phase junction is expressed as follows:
is the diffusion concentration of lithium-ion; is the rate of lithium-ion mobility; is the velocity of lithium-ion diffusion; is the electrochemical potential within a particle; and is the standard electrochemical potential, which is a constant. Lithium-ion mole flux J in the electrode solid–liquid phase depends on the lithium concentration, temperature, and stress in the particle. Substituting these quantities into the above formula yields:
Substitute Formula (23) into Formula (9):
The boundary conditions of the battery under constant current charge and discharge conditions are as follows:
Under the corresponding boundary conditions, the connection Equations (21) and (24) obtain the relationship between the diffusion stress and the lithium-ion concentration of the electrode particles.
The fixed parameters required for the above model establishment are divided into geometric parameters, electrochemical parameters, and mechanical parameters, which are set as follows in Table 1.

Table 1.
Table of model parameters.
The establishment of the model in this article was carried out using COMSOL simulation software (COMSOL Multiphysics 6.0). The process of establishing the model using COMSOL simulation software generally includes several steps: first, setting necessary parameters, then establishing a geometric model, adding materials to the geometric model according to actual conditions, setting the physical field to be studied, completing the physical properties required for research of the materials, setting the boundary conditions for the physical field to be studied, selecting appropriate control equations and calculation formulas, inputting the physical field parameters that are in line with the actual conditions, setting appropriate working conditions, and dividing the geometric model into grids. The software solves the finite element based on grid partitioning and, then, sets the solving conditions to calculate the simulation results of the physical field model. Through software post-processing, drawing, tabulation, and other operations, the simulation results of the physical field model can be obtained at any position in the physical field. Physical quantities are presented through three-dimensional, two-dimensional, one-dimensional, and numerical methods. The modules used in the model-building process are shown in Figure 3.
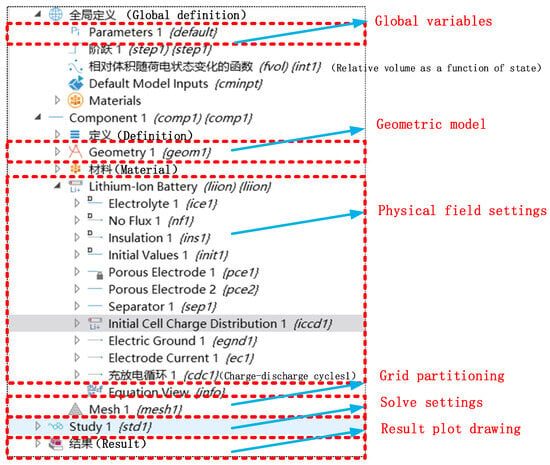
Figure 3.
Model developer section.
2.4. Model Validation
This paper adopts a commercial ternary polymer lithium-ion soft-pack cell, with a nominal voltage of 3.7 V, a charging cut-off voltage of 4.2 V, and a discharge cut-off voltage of 2.75 V. The battery voltage and battery surface pressure are verified by the acquisition model of the battery test platform shown in Figure 4. The selected film pressure sensor is a piezoresistance sensor, and the battery surface pressure is obtained through the fitting relationship between the resistance and the pressure. The resistance data of the pressure sensor were collected by key34970A produced by Agilent Company in Santa Clara, CA, USA.
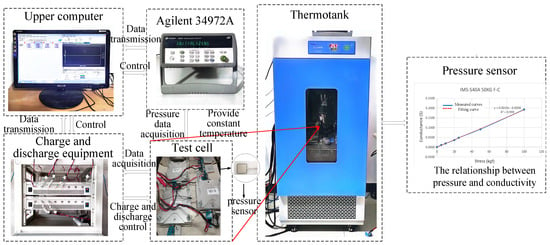
Figure 4.
Experimental test system.
The model is verified by charging and discharging at normal temperature. As shown in Figure 5a, the simulation data of charging and discharging voltage is well consistent with the test data, and the maximum error between the simulation and the actual test voltage is 3.1%, indicating that the parameters of the model at normal temperature are accurate and meet the requirements for application. We choose the surface pressure of the battery as the index for model validation because there is still a lack of experimental methods to directly obtain the full-field stress distribution during the operation of commercial lithium-ion batteries. Considering the existing conditions in the laboratory, we adopt measures to apply constraints to the battery and monitor the surface pressure, which indirectly reflects the average stress in the battery. The experiment shown in Figure 5b was carried out at 1C rate discharge at an initial pressure of 100 kPa. The average error of the measured pressure and simulation results is 19.8% during the whole charging and discharging process, which proves that the coupling model can improve the mechanical characteristics of the simulation battery.
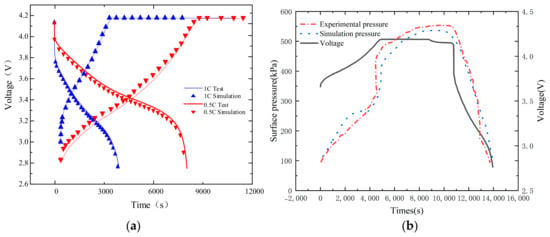
Figure 5.
Validation of the experiment and model simulation data. (a) Verification of charge-discharge curve model of different ratios; (b) Experimental model of battery surface pressure.
3. Simulation and Stress Analysis of Lithium-Ion Batteries
The phase transition of the graphite anode in lithium-ion batteries is accompanied by significant changes in the lattice parameters and also changes in the feature of the electrochemical potential. The graphite expands during charging as a result of the formation of graphite–lithium intercalation compounds during lithiation. The expansion is often believed to be linear within the biphasic region. When the batteries’ graphite negative electrode undergoes lithiation and delithiation, the lithium ions are in a constant process of embedding and stripping out of the graphite anode’s active material particles, which causes repeated expansion and contraction of the graphite anode. As the number of battery charging and discharging cycles increases, the electrode active particles can break as a consequence of the continuous accumulation of diffusion stress stemming from the continuous embedding of lithium ions and the withdrawal of graphite active particles. This, in turn, leads to the breakage and failure of the electrode active material layer, which ultimately causes capacity decline and other performance degradation in the single battery. The previously mentioned electrochemical force-coupling model can be used to study the distribution of diffusion stress in the electrode in order to further understand the changes in the diffusion stress induced by the lithium-concentration difference inside and outside the active particles in the battery during the entire charging and discharging process.
3.1. Simulation Analysis of 1D Model Stress
It can be concluded from the construction process of the electrochemical force-coupling model that the diffusion stress of a lithium-ion battery is proportional to the lithium concentration. Through the established electrochemical force-coupling model, the discharge behavior simulation analysis of lithium-ion batteries is obtained in Figure 5. From Figure 6, we can observe the changes in lithium-ion concentration, diffusion stress, and volume at different parts of the electrode active particles. Stress within the active particles can be divided into tangential, radial, and Von Mises stresses.
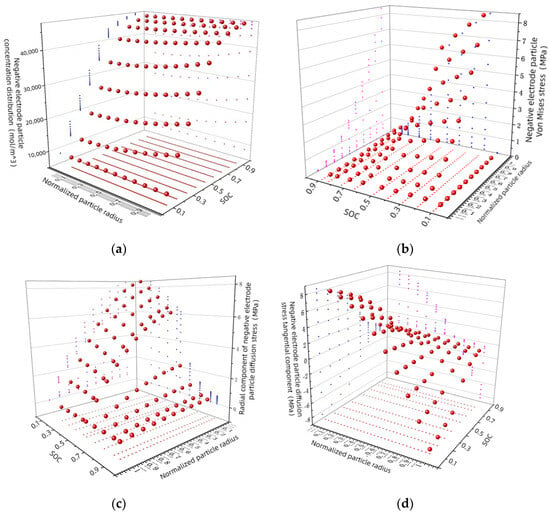
Figure 6.
(a) Change of lithium concentration of negative-electrode particles during charging process; (b) negative-electrode particles Von Mises stress process; during charging: (c) radial component; (d) tangential component.
According to the fourth strength theory, the Von Mises force can be used as the basis for material-failure determination. When the equal effect force exceeds the material yield strength limit, the material begins to yield. The distribution of Von Mises effector force in the charging process is shown in Figure 6b. At any given moment during charging, the diffusion stress increases with the increasing distance from the particle radius; the diffusion equal effect force at the center of the electrode particle is zero. The diffusion stress of electrode particles is maximum at the beginning of charging and gradually decreases with the progress of charging. Discharge is the opposite of charge. Combined with Figure 6a, the negative-electrode particle lithium-concentration changes during the charging process. At the beginning of the charging process, the lithium concentration outside the particles is higher than inside the particles. Therefore, the largest effect force, such as the particle’s Von Mises force, appears at the beginning of charging. As the charging proceeds, the lithium-concentration difference inside and outside the particles gradually decreases. Therefore, the effector forces, such as Von Mises, within the particle gradually decrease. According to the calculation of Equation (22), the electrode diffusion stress reaches the maximum at the end of discharge, so rupture is most likely to occur at the surface of the negative-electrode active particle.
As shown in Figure 6c, the radial stress inside the particle behaves as tensile stress during the charging process, and the radial stress at the center of the particle is always the highest during the entire charging process. And, the radial stress at the particle surface reaches almost zero. As charging progresses, the radial stress decreases anywhere inside the particle. This is related to the concentration gradient inside and outside the anode’s active particle. At the beginning of charging, the lithium concentration outside the particle is higher than that inside the particle, so the radial stress in the particle is the largest at the beginning of charging, and with the progress of charging, the lithium-concentration difference inside and outside the particle gradually decreases. So, the tangential stress inside the particle is also gradually decreasing.
As shown in Figure 6d, during the charging process, the tangential stress inside the particle presents two forms of tensile stress and compressive stress. In the central part of the particle, the form of tensile stress is mainly manifested, while in some areas near the surface of the particle, the form of compressive stress is manifested. At a distance of from the center of the particle, the tangential stress is zero. In the charging stage, the tangential stress on the surface of the anode’s active particles is the largest at the beginning of charging, which is the compressive stress. In the discharge stage, the tangential stress on the surface of the negative active material particles at the end of discharge is the largest, which is the tensile stress. As a result, the surface of the anode’s active particles is more likely to crack at the end of discharge or at the beginning of charging. It can also be seen from the figure that the two components of the electrode particle diffusion stress are equal at the center of the particle, so the equivalent stress at the center of the particle is zero according to the calculation of Equation (21).
3.2. Effect on Diffusion Stress under Different External Conditions
As can be seen from Figure 7a,b, when the discharging rate increases from 0.2C to 1C, the Von Mises stress of the negative-electrode particle near the surface increases sharply, with its size being about six times the original, the most drastic change of all. When the discharging ratio is changed to 2C, the diffusion stress of the electrode particles increases sharply, with the largest stress appearing at the particle surface, with more than 30 MPa. As can be seen from Figure 7c,d, the electrode particle diffusion stress is larger in the environment below 10 °C than at any other temperatures from the beginning of discharge and exceeds 40 MPa at the end of the discharging. However, the diffusion stress of the electrode particles did not change significantly at the ambient temperatures of 20 °C, 25 °C, and 40 °C. For graphite anode materials, the tensile yield strength limit of the common graphite anode materials available in the market is approximately 30 MPa [28]. The 2C discharging rate and 10 °C environment temperature of the Von Mises stress is greater than the graphite anode material’s tensile yield strength limit, which is very likely to cause rupture on the active material surface, or even cause graphite negative-electrode failure, and a decline in battery discharging capacity.
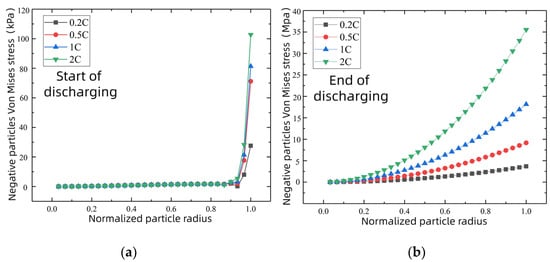
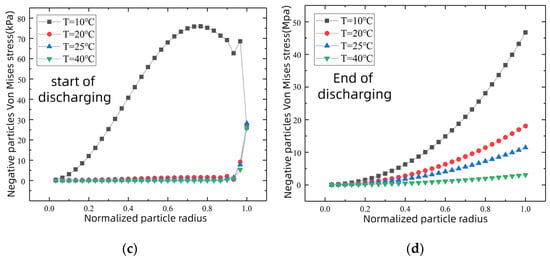
Figure 7.
Negative particle stress changes at the beginning and end of discharging under different external conditions. Different discharging rate conditions at 25 °C: (a) start of discharging; (b) end of discharging. Different ambient temperature conditions at 0.5C: (c) start of discharging; (d) end of discharging.
High temperature may cause other decomposition reactions of the electrolyte and the SEI membrane. The battery, therefore, needs to be used at the ambient temperature of 20 °C~35 °C. High rates of overcharging and discharging should be avoided, and the number of multiple charging and discharging cycles should be reduced as much as possible to protect the battery’s structure and performance.
3.3. Stress-Simulation Analysis of 3D Model
The three-dimensional model in this article is calculated using a unidirectional coupling method in COMSOL simulation software. First, the relevant parameters and operating conditions of the electrochemical model are configured, and after grid partitioning, the transient solution is performed after initialization calculation to obtain the changes in internal parameters during the charging and discharging process. Then, the results of the electrochemical model calculation are input into the dependent variable solved by the solid mechanics module. By setting the relationship between the negative-electrode lithium-concentration distribution field and the negative-electrode volume expansion, and adding boundary conditions and initial values, the stress and strain distribution field during the charging and discharging process of the battery are obtained through steady-state calculations.
In terms of stress analysis, the one-dimensional model can only simulate and analyze the diffusion-induced stress and strain caused by the lithium concentration change of the negative-electrode active material particles but cannot carry out a stress analysis from the perspective of the whole battery, which necessitates the construction of a three-dimensional model. The diffusion and migration of lithium ions inside the battery can cause the diffusion stress to differ in different areas of the battery. The specific reason is that the difference in lithium concentration induced by the diffusion of lithium ions inside the active particles of the electrode causes diffusion stresses in the electrode particles, further leading to diffusion stresses at the electrode-material level. As a result, the electrode material undergoes volume changes, compresses other parts of the battery, and ultimately generates stress of differing degrees in different areas of the battery.
Battery modules are usually constrained by a fixed structure. Therefore, the simulation first simulates the pressure of the clamp and, then, discharges the current of 1C to analyze the changes in the mechanical properties inside the battery. Figure 8 presents the lithium-concentration distribution of each part of the battery when the initial pressure increases by 100 kPa in the electrode direction. In this process, the lithium ion spreads from the negative-electrode active material to the positive-electrode active material through the diaphragm, and the negative-electrode material changes from the state of rich lithium to that of lean lithium, with an average lithium concentration of about 1700 mol/m3. The cathode material changes from a lithium-poor state to a lithium-rich state, with an average lithium concentration of about 26,500 mol/m3.
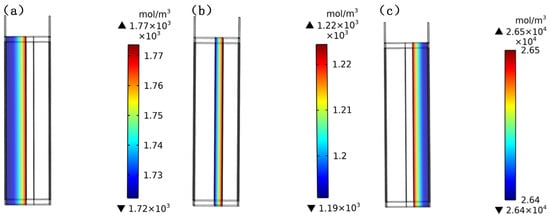
Figure 8.
Lithium-concentration distribution inside the battery at the end of the discharging: (a) the negative region; (b) the diaphragm region; (c) the positive region.
The strain of each part appears to be large in the marginal area, while it is relatively small in the central area with the stress and strain showing the same pattern. As shown in Figure 9, the negative active material layer shows the largest strain, reaching 0.02, and the negative active material shows the largest stress, reaching 10 MPa on average. The strain appears to be large in the peripheral areas, possibly due to the constraint of the battery structure. The strain turns out to be huge in the negative-electrode active material, as the embedding and detaching of lithium ions generate diffusion stress in the negative electrode of the active material. The stress distribution corresponds to the strain distribution: negative active material > negative fluid > positive active material > positive fluid. During the discharge process, lithium ions are embedded in the negative particles, so the negative material has a large strain with the adjacent fluid collection.
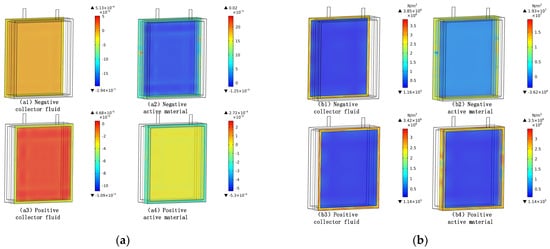
Figure 9.
Strain and stress of each part in the battery. (a) Strain of each part in the battery; (b) stress of each part in the battery.
4. Summary
To overcome the difficulties in measuring the stress distribution inside the battery in the actual test, this paper simulates the actual condition and determines the distribution of diffusion stress and material effect force throughout the process of charging and discharging, which allows for a better understanding of stress and local stress inside the battery.
1. We establish the electrochemical model based on the principle of the Newman lithium-ion battery model. By coupling the lithium-concentration field distribution and the force model in the electrochemical model, we can achieve the electric performance analysis and simulation analysis of battery particles, the electrode, and battery stress under constant current charging and discharging conditions and variable current conditions;
2. Through coupling model analysis, we obtained the distribution field of lithium concentration inside the electrode active particles during electrode lithiation and delithiation processes, radial diffusion stress distribution of particles, tangential diffusion stress distribution of particles, Von Mises equivalent stress distribution, and strain distribution of electrode-material layer. The presence of the lithium-concentration difference inside and outside the particles and the distribution of the stress inside the electrode particles further prove that the diffusion stress of electrode particles is mainly driven by the electrochemical potential stemming from the difference in the lithium concentration inside and outside the particles. The results show that there is a strong correlation between the electrode diffusion stress and the particle lithium-concentration field distribution;
3. This article simulates the operation process of using fixtures to pressurize the battery through model simulation and analyzes the distribution of internal diffusion stress in the battery through simulation results. The results indicate that the maximum stress of the battery occurs in the edge region, while the stress in the middle region is relatively small. The maximum stress of the battery can reach 10 MPa at a discharging rate of 1C. The order of stress and strain is negative active material > negative current collector > positive active material > positive current collector.
Author Contributions
Conceptualization, W.S. and Y.L.; methodology, W.S. and J.C.; software, C.H.; validation, R.X., C.H. and J.L.; formal analysis, X.J.; investigation, B.S.; resources, W.S.; data curation, Y.L.; writing—original draft preparation, C.H.; writing—review and editing, R.X.; visualization, J.X.; supervision, W.S.; project administration, W.S. All authors have read and agreed to the published version of the manuscript.
Funding
The completion of this manuscript is supported by the project “Fundamental Research Funds for the Central Universities”. The project number is 2024JBZX011. The completion of the manuscript has also been supported by “the research and engineering demonstration of a safe, autonomous and controllable intelligent control system for ten-kilowatt clean energy”. The project number is GINY-22-108.
Data Availability Statement
The data are contained within the article.
Conflicts of Interest
Author Yinghao Li was employed by the company Datang Mobile Communications Equipment Co., Ltd. The remaining authors declare that the research was conducted in the absence of any commercial or financial relationships that could be construed as a potential conflict of interest.
References
- Wang, W.; Han, L.; Xiang, C.; Ma, Y.; Liu, H. Synthetical efficiency-based optimization for the power distribution of power-split hybrid electric vehicles. Chin. J. Mech. Eng. 2014, 27, 58–68. [Google Scholar] [CrossRef]
- Li, W.; Xu, G.; Xu, Y. Online learning control for hybrid electric vehicle. Chin. J. Mech. Eng. 2012, 25, 98–106. [Google Scholar] [CrossRef]
- Chen, T.; Feng, X.; Ouyang, M.; Lu, L. Model-based multi-scale thermal safety design of power battery system. China Mech. Eng. 2018, 29, 1840–1846+1874. [Google Scholar]
- Bagheri, A.; Arghavani, J.; Naghdabadi, R. On the effects of hydrostatic stress on Li diffusion kinetics and stresses in spherical active particles of Li-ion battery electrodes. Mech. Mater. 2019, 137, 103134. [Google Scholar] [CrossRef]
- Niu, S.; Wu, K.; Zhu, G.; Wang, Y.; Qu, Q.; Zheng, H. Expansion stress during silicon-based anode cycling in lithium-ion batteries. Energy Storage Sci. Technol. 2022, 11, 2989–2994. [Google Scholar]
- Müller, V.; Scurtu, R.-G.; Richter, K.; Waldmann, T.; Memm, M.; Danzer, M.A.; Wohlfahrt-Mehrens, M. Effects of mechanical compression on the aging and the expansion behavior of Si/C-composite|NMC811 in different lithium-ion battery cell formats. J. Electrochem. Soc. 2019, 166, A3796–A3805. [Google Scholar] [CrossRef]
- Prado, A.Y.; Rodrigues, M.-T.F.; Trask, S.E.; Shaw, L.; Abraham, D.P. Electrochemical dilatometry of Si-bearing electrodes: Dimensional changes and experiment design. J. Electrochem. Soc. 2020, 167, 160551. [Google Scholar] [CrossRef]
- Deich, T.; Storch, M.; Steiner, K.; Bund, A. Effects of module stiffness and initial compression on lithium-ion cell aging. J. Power Sources 2021, 506, 230163. [Google Scholar] [CrossRef]
- Vidal, D.; Leys, C.; Mathieu, B.; Guillet, N.; Vidal, V.; Borschneck, D.; Chaurand, P.; Genies, S.; De Vito, E.; Tulodziecki, M. Si–C/G based anode swelling and porosity evolution in 18650 casing and in pouch cell. J. Power Sources 2021, 514, 230552. [Google Scholar] [CrossRef]
- Clerici, D.; Mocera, F.; Somà, A. Experimental characterization of lithium-ion cell strain using laser sensors. Energies 2021, 14, 6281. [Google Scholar] [CrossRef]
- Hemmerling, J.; Guhathakurta, J.; Dettinger, F.; Fill, A.; Birke, K.P. Non uniform circumferential expansion of cylindrical Li-ion cells—The potato effect. Batteries 2021, 7, 61. [Google Scholar] [CrossRef]
- Bucci, G.; Swamy, T.; Bishop, S.; Sheldon, B.W.; Chiang, Y.-M.; Carter, W.C. The effect of stress on battery-electrode capacity. J. Electrochem. Soc. 2017, 164, A645. [Google Scholar] [CrossRef]
- Liu, P.; Sridhar, N.; Zhang, Y.-W. Lithiation-induced tensile stress and surface cracking in silicon thin film anode for rechargeable lithium battery. J. Appl. Phys. 2012, 112, 093507. [Google Scholar] [CrossRef]
- Tao, R.; Zhu, J.; Zhang, Y.; Song, W.-L.; Chen, H.; Fang, D. Quantifying the 2D anisotropic displacement and strain fields in graphite-based electrode via in situ scanning electron microscopy and digital image correlation. Extrem. Mech. Lett. 2020, 35, 100635. [Google Scholar] [CrossRef]
- Rieger, B.; Erhard, S.V.; Rumpf, K.; Jossen, A. A new method to model the thickness change of a commercial pouch cell during discharge. J. Electrochem. Soc. 2016, 163, A1566. [Google Scholar] [CrossRef]
- Zhou, L.; Xing, L.; Zheng, Y.; Lai, X.; Su, J.; Deng, C.; Sun, T. A study of external surface pressure effects on the properties for lithium-ion pouch cells. Int. J. Energy Res. 2020, 44, 6778–6791. [Google Scholar] [CrossRef]
- Gupta, P.; Gudmundson, P. A multi-scale model for simulation of electrochemically induced stresses on scales of active particles, electrode layers, and battery level in lithium-ion batteries. J. Power Sources 2021, 511, 230465. [Google Scholar] [CrossRef]
- Von Kessel, O.; Deich, T.; Hahn, S.; Brauchle, F.; Vrankovic, D.; Soczka-Guth, T.; Birke, K.P. Mechanical impedance as a tool for electromechanical investigation and equivalent modeling of lithium-ion batteries. J. Power Sources 2021, 508, 230337. [Google Scholar] [CrossRef]
- Rieger, B.; Erhard, S.V.; Kosch, S.; Venator, M.; Rheinfeld, A.; Jossen, A. Multi-dimensional modeling of the influence of cell design on temperature, displacement and stress inhomogeneity in large-format lithium-ion cells. J. Electrochem. Soc. 2016, 163, A3099. [Google Scholar] [CrossRef]
- Mei, W.; Wang, Q.; Sun, J. Stress simulation of graphite particles during charging of lithium-ion batteries based on the electrochemical-force coupling model. Eng. Mech./Gongcheng Lixue 2020, 37, 352–357. [Google Scholar]
- Zhang, X.; Klinsmann, M.; Chumakov, S.; Li, X.; Kim, S.U.; Metzger, M.; Besli, M.M.; Klein, R.; Linder, C.; Christensen, J. A modified electrochemical model to account for mechanical effects due to lithium intercalation and external pressure. J. Electrochem. Soc. 2021, 168, 020533. [Google Scholar] [CrossRef]
- Chen, Y.; Yang, L.; Guo, F.; Liu, D.; Wang, H.; Lu, J.; Zheng, J.; Yu, X.; Li, H. Mechanical-electrochemical modeling of silicon-graphite composite anode for lithium-ion batteries. J. Power Sources 2022, 527, 231178. [Google Scholar] [CrossRef]
- Feng, X.; Weng, C.; Ouyang, M.; Sun, J. Online internal short circuit detection for a large format lithium-ion battery. Appl. Energy 2016, 161, 168–180. [Google Scholar] [CrossRef]
- Yu, Q. Electrochemical-Thermal Coupling Simulation of NCM Ternary Power Battery. Master’s Thesis, Chongqing University, Chongqing, China, 2021. [Google Scholar]
- Huang, J. An investigation of heat transfer and capacity fade in a prismatic Li-ion battery based on an electrochemical-thermal coupling model. Appl. Therm. Eng. 2020, 171, 115080. [Google Scholar]
- Zhang, J.; Liu, Y.; Wang, C.; Tan, H. An electrochemical-mechanical phase field model for lithium dendrite. J. Electrochem. Soc. 2021, 168, 090522. [Google Scholar] [CrossRef]
- Shen, X.; Zhang, R.; Shi, P.; Chen, X.; Zhang, Q. How does external pressure shape Li dendrites in Li metal batteries? Adv. Energy Mater. 2021, 11, 2003416. [Google Scholar] [CrossRef]
- Christensen, J.; Newman, J. Stress generation and fracture in lithium insertion materials. J. Solid State Electrochem. 2006, 10, 293–319. [Google Scholar] [CrossRef]
Disclaimer/Publisher’s Note: The statements, opinions and data contained in all publications are solely those of the individual author(s) and contributor(s) and not of MDPI and/or the editor(s). MDPI and/or the editor(s) disclaim responsibility for any injury to people or property resulting from any ideas, methods, instructions or products referred to in the content. |
© 2024 by the authors. Licensee MDPI, Basel, Switzerland. This article is an open access article distributed under the terms and conditions of the Creative Commons Attribution (CC BY) license (https://creativecommons.org/licenses/by/4.0/).