Abstract
In this paper, a novel experimental setup to quantify the particle deposition during a lithium-ion battery thermal runaway (TR) is proposed. The setup integrates a single prismatic battery cell into an environment representing similar conditions as found for battery modules in battery packs of electric vehicles. In total, 86 weighing plates, positioned within the flow path of the vented gas and particles, can be individually removed from the setup in order to determine the spatial mass distribution of the deposited particles. Two proof-of-concept experiments with different distances between cell vent and module cover are performed. The particle deposition on the weighing plates as well as the particle size distribution of the deposited particles are found to be dependent on the distance between cell vent and cover. In addition, the specific heat capacity of the deposited particles as well as the jelly roll remains are analyzed. Its temperature dependency is found to be comparable for both ejected particles and jelly roll remains. The results of this study help researches and engineers to gain further insights into the particle ejection process during TR. By implementing certain suggested improvements, the proposed experimental setup may be used in the future to provide necessary data for simulation model validation. Therefore, this study contributes to the improvement of battery pack design and safety.
1. Introduction
The thermal runaway (TR) of lithium-ion batteries attracts increasingly more attention as one of the most critical safety issues related to electric vehicles (EVs). On the one hand, this is caused by the occasionally emerging fire accidents of EVs that attract public attention [1,2,3]. On the other hand, the phenomenon is extensively studied within the scientific community, as shown in the increasing number of annual publications [4].
The main characteristics of a TR can be summarized as significant heat release caused by self-sustaining exothermic reactions, accompanied by gas and particle ejection. A TR can be triggered by either mechanical, electrical, or thermal abuse and may lead to fire or explosion of the battery cell [3,5]. Within an EV battery pack, the occurrence of a single cell TR results in the risk of so-called TR propagation, which is the process of TRs propagating from one cell to neighboring ones, resulting in catastrophic consequences [6,7,8]. Feng et al. proposed two different pathways for this failure development: an “expected” and an “unexpected” failure sequence. The expected sequence is primarily driven by heat conduction and consequently the TR first propagates from the triggering cell to its neighbors within the module. Secondly, the TR propagates to adjacent modules. The unexpected sequence is primarily caused by the gas–particle flow vented out of the trigger cell. The ignition of the venting gases may lead to fire and the particle accumulations can result in short circuits between cells or modules. Such fires and short circuits cause uncertainties and therefore the propagation sequence is difficult to predict for the unexpected pathway [8].
The gas–particle flow during TR as the origin of the unexpected pathway has been investigated by several researchers in recent years [9]. Experimental and numerical studies have been conducted to investigate the behavior of the ejected gas and particles in order to explore potential strategies to prevent or mitigate the unexpected failure sequence. On the experimental side, previous studies focused on different topics such as the characteristics of the jet stream out of the vent [10,11,12,13], the elemental composition of the venting gas [14,15,16], the size distribution of the ejected particles [12,16,17,18,19,20], and the elemental composition of the vented particles [14,15,16,17,20,21,22]. For example, Zou et al. investigated the jet manifestation, temperature and velocity of a prismatic cell triggered by external heating into TR [10]. Garcia et al. focused on optical jet observations by Schlieren visualization and Natural Luminosity of a cylindrical cell [11]. Wang et al. used the planar laser scattering technique to observe the jet flow of a prismatic cell and estimate characteristics such as gas and particle velocities [12]. Ding et al. conducted experiments with a cylindrical cell and investigated the influence of a low-pressure/high-altitude environment on the mass loss and flame height during TR [13]. The size distribution of the particles ejected during TR was investigated among others by Zhang et al. in Refs. [16,17]. They triggered a prismatic cell by external heating into TR within a sealed chamber. Wang et al. used the same cell within the same setup and additionally investigated the thermal oxidation characteristics of the ejected particles depending on their size [18]. Wang et al. analyzed the particle size distribution as well as the particle deposition of a prismatic cell within a combustion chamber [12]. Premnath et al. investigated battery modules containing either cylindrical cells or prismatic cells. However, their focus was on particles with a diameter smaller than [19]. Liao et al. investigated the elemental composition of the ejected particles during TR for a cylindrical cell. They used an autoclave and focused on the influence of a varying state of charge on the venting behavior [14]. Chen et al. also evaluated the elemental composition of the ejected particles during TR for a cylindrical cell. They varied the state of charge, heating temperature, as well as heating power and additionally analyzed the thermal properties of the collected powder by thermogravimetric analysis—differential scanning calorimetry (TGA-DSC) [20]. Essl et al. analyzed the elemental composition of the ejected particles during TR of a pouch cell [15]. Zhang et al. and Wang et al. also determined the elemental composition of the ejected particles within their studies [16,17,22]. Held et al. focused on the contamination after a battery fire. Therefore, they triggered a module containing 12 prismatic cells with each into TR and analyzed the elemental composition of the fire soot depositing on the surroundings [21].
On the numerical side, there is only a small number of publications dealing with the venting behavior of lithium-ion batteries. Coman et al. were one of the first to introduce isentropic flow equations in their TR models to account for the heat dissipation due to gas and particle ejection [23]. They also extended their model from the single-cell level to the battery-pack level in the following years [24]. However, their model did not simulate the gas flow itself but the influence of the venting process on the thermal behavior of the solid body [23,24]. Ostanek et al. performed a similar study investigating the influence of the electrolyte vaporization and gas generation due to decomposition reactions on the cell body modeled as a solid [25]. Li et al. studied the flow through different vent geometries for 18,650 cells by performing CFD simulations. The results provide insights into the jet structure as well as the turbulence levels and can be used to estimate the influence on combustion and heat transfer to the surrounding cells [26]. Kim et al. focused on the internal pressure increase, the resulting venting process and the subsequent gas-phase dynamics of 18,650 cells [27]. However, both models consider a single cell only and consequently are not capable of predicting the thermal impact of the vented gas and particles on the neighboring cells. Citarella et al. were one of the first to consider the gas flow within their model to investigate the TR propagation behavior of a battery pack [28]. Another study of Mishra et al. focused on the spread of the gas flow within a battery pack by studying parameters such as the cell-to-cell gap, the distance between cell vent and housing, as well as the location of the vent [29].
The models mainly focused on the gas phase of the venting process, although the ejected particles are assumed to have a significant influence on the TR propagation process. To address this issue, Wang et al. built a multiphase model including both fluid flow and particles. They investigated not only the jet behavior and particle ejection, but also the particle deposition after TR [12]. However, there is a lack of experimental data that are needed to validate such simulation models.
This publication focuses on the experimental determination of the particle deposition during a lithium-ion battery TR. The objective is to develop an experimental setup that allows for quantification of the mass distribution of ejected particles in a battery module-like environment. Therefore, a novel experimental setup for prismatic batteries is proposed and two proof-of-concept experiments are performed with different distances between battery cell and cover. In addition, the particle size distribution of depositing particles is analyzed and specific heat capacity measurements are conducted. To the authors’ knowledge, an experimental determination of the mass distribution of depositing particles during TR has not been the subject of any scientific publication. In addition, specific heat capacity measurements of ejected particles and jelly roll remains after a TR are not yet available in the literature. The results of this study help engineers or researchers to gain further insights into the particle ejection process during TR. By implementing certain suggested improvements, the proposed experimental setup may be used in the future to provide necessary data for simulation model validation. Therefore, this study contributes to the improvement of battery pack design and safety.
2. Experimental Setup
In this study, a novel experimental setup to quantify the particle deposition during a lithium-ion battery TR is proposed. The setup integrates a single prismatic battery cell into a battery module-like environment as found in EV battery packs. Within the flow path of the vented gas and particles, there are several weighing plates that can be individually removed from the setup in order to determine the spatial mass distribution of the deposited particles. Afterwards, the collected particles as well as the remains of the jelly roll are further analyzed to determine mass loss of the battery cell during TR, size distribution of the vented particles, and specific heat capacity measurements of both vented particles and jelly roll remains.
2.1. Geometry
The experimental setup used in this study is shown in Figure 1. The main component is the investigated battery cell (dimensions ) that is compressed within a steel frame. In order to reduce the heat transfer from the cell to its surroundings, a thermal insulation material is used on both sides of the cell (thickness of ). In addition, there is a built-in load cell to adjust the compression force to specified values. The steel frame can be attached to a base plate, resulting in the substructure shown in Figure 1a. As shown in Figure 1b, an intermediate sheet metal surrounding the battery cell can be attached to the base plate. Grooves are milled into this sheet metal, so that in total 86 weighing plates (T-shape with an upper surface of ) can be inserted. Afterwards, two fixation plates are screwed to each side of the intermediate sheet metal as shown in Figure 1c. The result is a flat surface that is on the level of the top of the battery cell. Finally, a cover is attached to the base plate via telescopic legs, allowing for setting different distances between the battery cell’s vent and the cover. Figure 1d shows the resulting assembly that can be integrated into a steel box as shown in Figure 1e. Figure 1f schematically shows the nailing process for TR initiation.
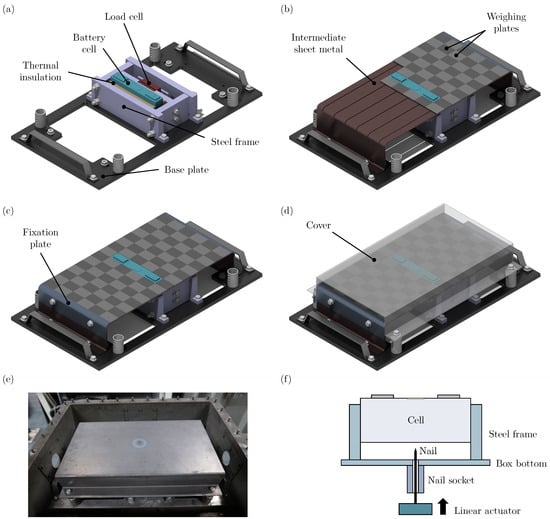
Figure 1.
(a) Substructure of the experimental setup including a steel frame to fix the position of the battery cell. (b) Intermediate sheet metal that is used to position the weighing plates. (c) Fully assembled and fixed weighing plates. (d) Full experimental setup with cover. (e) Full view of the setup within a steel box. (f) Schematic representation of linear actuator for nailing process.
2.2. Test Procedure and Evaluation Methodology
Two proof-of-concept experiments with different distances between cell vent and cover are performed. Therefore, the cell is installed into the steel frame and compressed with a force of in order to ensure a fixed position during nail penetration and simulate conditions as found in a battery module for EV battery packs. Afterwards, the intermediate sheet metal is screwed to the base plate and the weighing plates are inserted into the grooves. Subsequently, the position of the weighing plates is fixed by mounting the fixation plates to both ends of the intermediate sheet metal. The cell is then charged from a state of charge of (used during logistics) to with the constant current constant voltage (CCCV) charging method. In the final step, the cover is attached at two specified heights h:
- Test 1: distance between cell vent and cover, which aims to represent EV battery pack conditions.
- Test 2: distance between cell vent and cover, which aims to show the influence of the distance on particle deposition.
The full setup is attached to the steel box, which comes with a nail actuator that is used to penetrate the bottom side of the battery cell with a steel nail ( diameter) as shown in Figure 1f. The penetration depth is with a penetration speed of . The nail is not retracted from the battery after TR initiation.
The nail penetration triggers a TR and consequently results in gas and particles being ejected out of the cell vent. Since the cover is flushed with the long sides of the intermediate sheet metal, the resulting flow path is directed towards both fixations plates. Vented particles that are carried by the gas flow eventually deposit either on one of the weighing plates or within/outside of the steel box.
In preparation for the disassembly of the test setup and the evaluation of the results, 86 sealable glasses are labeled and weighed in order to collect the particles deposited on each individual weighing plate. As soon as the setup is cooled down, the cover and the fixation plates are dismounted. Next, each weighing plate is individually taken out of the intermediate sheet metal and deposited particles are collected in the prepared glasses. To do so, loose particles on each weighing plate are first poured into the corresponding glass with the aid of a funnel as exemplary shown in Figure 2a. Then, the weighing plates are wiped off with the aid of a brush to collect non-adherent particles. Particles that are sticking to the weighing plates and therefore cannot be collected by pouring or wiping are not collected in this step, but scraped off in the second step. This helps to differentiate the mass of particles that are sticking to the weighing plates from particles that are loose as shown in Figure 2b. After collecting all particles, the intermediate sheet metal is dismounted from the base plate, and the tested cell can be removed from the steel frame for further analysis.
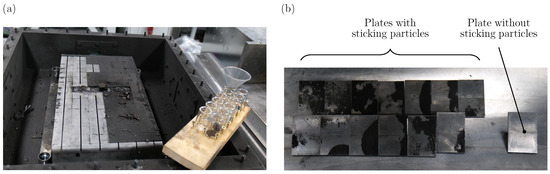
Figure 2.
(a) Process of particle collecting with sealable glasses and funnel. (b) Examples of plates with sticking particles and a plate without sticking particles.
2.2.1. Particle Deposition and Particle Size Distribution
After each test, the mass loss during TR of the battery cell is calculated by
with being the mass of the cell before the test and being the mass of the cell after the test. The mass of deposited particles is determined for each weighing plate i by
where is the mass of each glass in its empty state and is the mass of each glass with the collected particles inside. The weighing of the glasses is performed twice: first, the glasses with collected loose particles are weighed. Afterwards, the sticking particles are scraped off the weighing plates and added to the corresponding glass. The second weighing results in the mass of sticking particles for each weighing plate i:
with being the mass of the glass with added scraped-off particles. The total sum of particles deposited on the weighing plates is the sum of all loose particles and all sticking particles :
After the mass distribution on the weighing plates is determined, the particle size distribution is analyzed. Therefore, the particles (diameter d) are separated into four different size ranges by sieving:
- ,
- ,
- ,
- .
2.2.2. Specific Heat Capacity Measurements
The specific heat capacity of the four particle size samples is measured via the differential scanning calorimetry (DSC) apparatus 204 F1 Phoenix manufactured by Netzsch®, Selb, Germany. In addition, four samples of the jelly roll remains, i.e., the burnt remains inside the cell after the TR process from four different positions as shown in Figure 3 are analyzed. Therefore, three probes of approximately of each sample are loaded in aluminum crucibles under air atmosphere. In order to ensure specimens containing all chemical components, the three particle samples with as well as all four samples out of the jelly roll remains are ground in a ball mill before loading the crucibles (four times of milling for with and a pause in between). The measurements are performed in a temperature range of 25–500 °C with a temperature rate of . The blank measurement is performed with an empty crucible and the calibration measurement with a sapphire standard (mass: , diameter: , thickness: ).
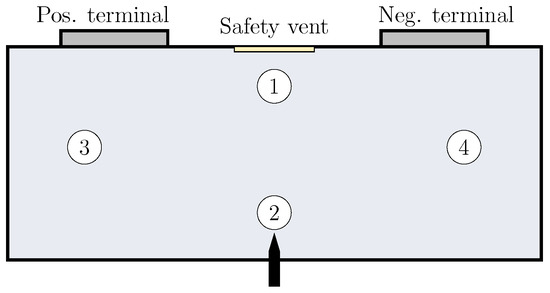
Figure 3.
Schematic representation of the battery cell with the four positions of sample extraction out of the jelly roll remains after TR: (1) beneath the safety vent, (2) above the nailing position, (3) middle of the jelly roll beneath the positive terminal, and (4) middle of the jelly roll beneath the negative terminal.
2.3. Investigated Cell
The properties of the investigated battery cell are summarized in Table 1. The cells are prismatic prototype lithium-ion batteries with a nominal capacity between and . The cell consists of a LiNi0.8Mn0.1Co0.1O2 (NMC811) cathode and a graphite anode. The electrolyte is based on lithium hexafluorophosphate (LiPF6) conducting salt with ethylene carbonate (EC), ethyl methyl carbonate (EMC), diethyl carbonate (DEC), and dimethyl carbonate (DMC) solvents. The cells are in a fresh/unused aging state.

Table 1.
Basic properties of the investigated cell.
3. Results and Discussion
Two proof-of-concept experiments with different distances between the battery cell’s vent and the experimental setup’s cover were performed to investigate the suitability of the setup for quantifying the particle deposition after a lithium-ion battery TR. In both experiments, the cell was triggered into TR by nail penetration and showed an expected venting behavior with gas release and particle ejection (only) through the vent, i.e., post-test analysis did not show any indications of gas or particle venting through the nailing hole. In the following, the particle deposition on the weighing plates as well as the mass loss of the cells during TR, the size distribution of the collected particles, as well as the specific heat capacity of both collected particles and samples out of the jelly roll remains are analyzed and discussed. The authors would like to point out that all results analyzed and discussed in the following are based on just the two proof-of-concept experiments and consequently the reliability of the statements made is limited.
3.1. Particle Deposition
Figure 4 shows the view on the weighing plates after cover removal for Test 1 with a distance between cell vent and cover (Figure 4a) and Test 2 with a distance between cell vent and cover (Figure 4b). In order to facilitate the result description and interpretation, the weighing plates are assigned to six columns as indicated with the numbered circles.
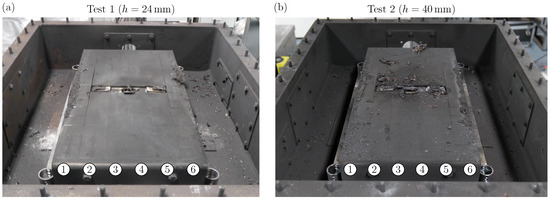
Figure 4.
(a) View on the weighing plates of Test 1 after cover removal. (b) View on the weighing plates of Test 2 after cover removal. The numbered circles indicate the weighing plates’ column number.
For Test 1 (see Figure 4a), there is no blank surface visible, which means that all weighing plates are fully covered with particles. On the outer Columns 1 and 6, accumulations of particles can be seen. These seem to concentrate towards the center of the intermediate sheet metal (at the position of the battery cell) and decrease towards the fixation plates. On the weighing plates within the middle Columns 2–5, there are no larger clumps of particles visible. In addition, a significant amount of particles deposits within the steel box. This is also the case for Test 2 (compare with Figure 4b). However, the particle deposition on the weighing plates shows significant differences compared to Test 1. The particle accumulations on the outer Columns 1 and 6 are also visible, but not as clearly as for Test 1. Also, there are bigger particles depositing towards the fixation plates over all the weighing plate columns as well as around the battery cell. In general, the particle deposition on the weighing plates appears random for Test 2.
A possible cause of the observed differences in particle deposition is the varying distance between cell vent and cover. As shown in Figure 5, the lower distance of for Test 1 compared to for Test 2 results in the flow path area A being smaller in Test 1. More precisely, the flow path area is in Test 1 and in Test 2. Because is 40% smaller than , the gas flow velocities are higher in Test 1 assuming that the volume flow rate of venting gas is the same in both tests. As a consequence of higher flow velocities, the forces acting on particles within the flow, such as drag force or Saffman lift, are higher. Therefore, the flow is capable of carrying larger particles and particles of the same size for a longer distance. Consequently, large particles are carried by the gas flow into the steel box for Test 1, whereas the lower gas velocities in Test 2 lead to the deposition of such large particles on the weighing plates. The accumulations of particles in Columns 1 and 6 are observed for both tests, which is in accordance with the expected flow field. Assuming ideal conditions, three stagnation points form: one above the cell vent at the cover, and two more at each side wall of the intermediate sheet metal (Columns 1 and 6) in the row of the battery cell. Independently of flow path area A, the gas velocity approaches zero towards a stagnation point. Therefore, particles are likely to accumulate next to these positions.
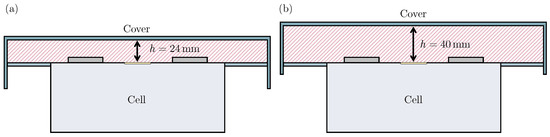
Figure 5.
Schematic representation of flow area A during (a) Test 1 with and (b) Test 2 with .
The results of visual observation are in accordance with the measured mass distributions of deposited particles as shown in Figure 6. For each weighing plate, the mass of collected particles according to Equation (4) is shown for Test 1 in Figure 6a and for Test 2 in Figure 6b.
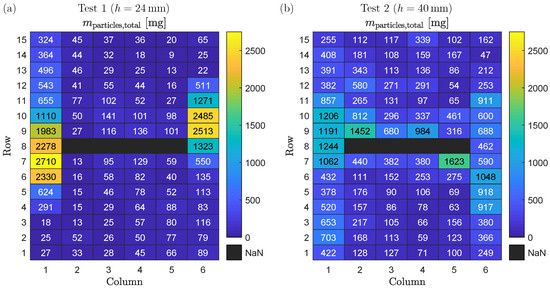
Figure 6.
(a) Mass of deposited particles on each weighing plate for Test 1. (b) Mass of deposited particles on each weighing plate for Test 2.
For Test 1 (see Figure 6a), the maximum mass of particles collected from a single weighing plate is (Row 7, Column 1), whereas the minimum mass is (Row 14, Column 5). The accumulation of particles in the outer Columns 1 and 6 as seen in the visual observation is confirmed by the measured mass values. Interestingly, the mass of collected particles in Column 6 decreases to values already in Row 6, while for Column 1 this is the case just from Row 3 to 1. For Rows 9 to 15, a similar observation is made: in Column 1, the minimum collected particle mass is (Row 15), whereas in Column 6 the minimum values are ≤65 mg for Rows 13 to 15. A possible cause is that particles on weighing plates of the outer columns fall down into the steel box when the cover is removed after the test. There is a conflict of objectives in the design of the experimental setup in this respect. On the one hand, the cover has to be flush with the weighing plates so that no gas or particles escape at the sides of the outer columns. On the other hand, the cover can be under tension due to the high temperatures during the test, which can lead to particles falling from the weighing plates into the steel box when the cover is removed. For the inner Columns 2 to 5, more particle mass seems to deposit next to the battery cell (e.g., Row 9, Columns 3 to 5). However, there exist also outliers such as Rows 7 and 9 in Column 2.
For Test 2 (see Figure 6b), the maximum mass of particles collected from a single weighing plate is (Row 7, Column 5), whereas the minimum mass is (Row 14, Column 6). As for Test 1, the particle accumulation in Columns 1 and 6 that has been observed visually is confirmed by the measured mass distribution on the weighing plates. However, a significant higher mass of deposited particles is found in the inner Columns 2 to 5 compared to Test 1. In addition, the two weighing plates with the maximum mass of particles collected are in Columns 2 and 5 and therefore not in the outer columns. As explained above, it is hypothesized that this observed behavior is the result of lower gas flow velocities in Test 2 compared to Test 1 due to the higher distance between cell vent and cover.
The separate evaluation of the measured mass distribution of loose and sticking deposited particles is shown in Figure 7. For each weighing plate, the total mass of loose and sticking particles according to Equations (2) and (3), respectively, is shown for Test 1 in Figure 7a,c, as well as for Test 2 in Figure 7b,d.
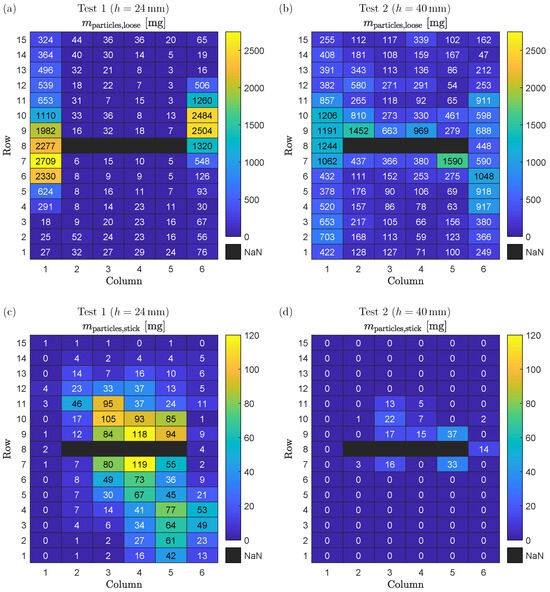
Figure 7.
(a) Mass of deposited loose particles on each weighing plate for Test 1. (b) Mass of deposited loose particles on each weighing plate for Test 2. (c) Mass of deposited sticking particles on each weighing plate for Test 1. (d) Mass of deposited sticking particles on each weighing plate for Test 2.
For Test 1, the mass distribution of loose particles (Figure 7a) is similar to the mass distribution of all particles (Figure 6a). One exception is the area around the battery cell: the mass of loose particles is increasing from Row 7 or 9 (next to the battery cell) towards Row 1 or 15 (next to the fixation plates). This can be explained by the mass distribution of sticking particles as shown in Figure 7c that accumulate towards the battery cell. The sticking of particles to the weighing plates is caused by high temperature above the melting point of the particle’s material composition. Therefore, the high mass of sticking particles is equivalent to the high temperatures of both gas and particles during TR. This is in accordance with the shown results: the further away from the battery cell, the longer the vented gas and particles can cool down, and consequently the less particle mass is sticking to the weighing plates.
As observed in Test 1, the mass distribution of loose particles in Test 2 (Figure 7b) is similar to the mass distribution of all particles in Test 2 (Figure 6b), and sticking particles are only present in the area close to the battery cell (Rows 7 to 11) as shown in Figure 7d. However, the total mass of sticking particles is significantly lower for Test 2 compared to Test 1, which can be related to lower temperatures: as the distance between cell vent and cover is longer for Test 2 compared to Test 1, the pressure loss between the inner battery cell and the environment is lower. Consequently, the total pressure in the area next to the battery cell is also lower, which results in decreased gas temperatures due to a higher expansion of the gas from inside of the cell to outside of the cell.
The sum of collected particle mass on all weighing plates as well as the mass loss during the TR of the cells is summarized in Table 2 for each test. The results are in accordance with the observations made above:
Table 2.
Experimental results of the two tests with different distance between cell vent and cover.
- The battery cell’s mass loss during TR is lower for the distance between cell vent and cover (Test 1) compared to the distance between cell vent and cover (Test 2). This behavior can be explained by a higher pressure loss from the inside of the battery cell to the outside of the battery cell for Test 1 due to the smaller flow area, A. However, the difference may also be caused by the statistical variance of nail penetration tests.
- The total mass of particles deposited on the weighing plates, , is lower for the distance between cell vent and cover (Test 1) compared to the distance between cell vent and cover (Test 2). This is explained by higher gas flow velocities in Test 1 compared to Test 2 due to the smaller flow area A.
- The total mass of sticking particles deposited on the weighing plates is higher for the distance between cell vent and cover (Test 1) compared to the distance between cell vent and cover (Test 2). This is explained by higher gas flow temperatures in Test 1 compared to Test 2.
- Only of the total ejected particle mass deposits on the weighing plates for Test 1, assuming that of the total mass loss during TR are particles as found in the literature [30]. For Test 2, of the total mass of ejected particles deposits on the weighing plates under the same assumption.
3.2. Particle Size Distribution
Figure 8 shows the mass percentage of the four particle size ranges for both tests of this study (black and red bars) and compares these results to values from the literature [12,16,17,18]. Zhang et al. (blue bars) triggered a prismatic lithium-ion battery with an NMC622 cathode into the TR within a sealed chamber by external heating and analyzed the ejected solid particles regarding particle size distribution. They found particles within the range of . However, particles with a size of were found to account for of the total ejected particle mass [16]. Within a second study, Zhang et al. (brown bars) also analyzed the ejected particles for the same cell within the same experimental setup. The maximum particle size was found to be ≈8 mm [17]. Wang et al. (green bars) conducted a third study with the setup of Zhang et al. and found particles within the size range of [18]. Wang et al. (violet bars) investigated the vented particles of a prismatic lithium-ion battery with an LFP cathode within a sealed chamber. They used an electric heater to trigger the TR and collected particles with sizes up to [12]. Note that the mass percentage of Sizes 3 () and 4 () could not be estimated for the results of Wang et al. published in Ref. [12].
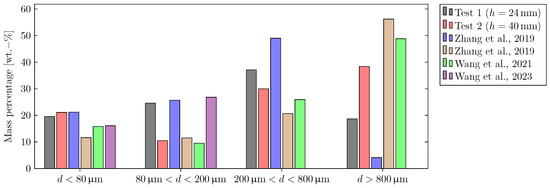
Figure 8.
Comparison of the particle size distribution evaluated for both tests in this study with values from the literature [12,16,17,18]. The mass percentage of Sizes 3 and 4 could not be estimated for the study of Wang et al. (Ref. [12]).
For Test 1 ( distance between cell vent and cover), there is an increase in the mass percentage values from Size range 1 (: ) over Size range 2 (: ) to Size range 3 (: ). The mass percentage of Size range 4 (: ) shows the lowest value. An explanation for these results is that a large fraction of Size range 4 particles is not depositing on the weighing plates but within the steel box due to the high gas flow velocities. It is also possible that particles of Size range 4 shatter into smaller pieces when they impinge into the walls. This can additionally explain the high mass percentage values for particle Size range 3. In addition, the shape of larger particles usually deviates more from the shape of an ideal sphere as shown in previous publications [12,17]. This may lead to higher drag coefficients.
The results of Test 2 (a distance between cell vent and cover) show that the mass percentage of Size range 1 particles (: ) is close to the results of Test 1. It is therefore hypothesized that the deposition of Size range 1 particles is nearly independent of the gas flow velocities and therefore the distance between cell vent and cover due to their small diameter. In contrast to Test 1, there is an increase in the mass percentage values from Size range 2 (: ) over Size range 3 (: ) to Size range 4 (: ) for Test 2. Due to the lower gas velocities during Test 2, the forces of the gas flow acting on Size range 4 particles are not high enough to carry them into the steel box.
The results of this study are comparable to the results found in the literature [12,16,17,18]. For Size range 1, both tests of this study show comparable values to those of the study of Zhang et al. in Ref. [16]. However, comparison of the results of all three studies conducted within the sealed reactor introduced by Zhang et al. reveals that there can be deviations in the particle size distributions for experiments conducted with the same cell and test procedure within the same setup [16,17,18]. These deviations are also observed for particle Size range 2: while the results of Test 1 are comparable to the results of Refs. [12,16], the results of Test 2 are close to the values published in Refs. [17,18]. For Size range 3, the results of this study’s tests are within the range of the literature values, which is also the case for Size range 4 [16,17,18]. At this point, however, it has to be mentioned that for the results of this study, the size distribution of particles depositing on the weighing plates is analyzed, whereas for the studies in the literature all ejected particles are collected and investigated.
3.3. Specific Heat Capacity Measurements
Figure 9 shows the specific heat capacity over temperature for the four particle size ranges measured via DSC for Test 1 (solid line) and Test 2 (dashed line). The shown curves are the mean values of at least two of the three measurements conducted with probes of each particle size range sample. Some measurements had to be neglected due to significant swelling of the crucible and/or high mass loss (>) during the measurement.
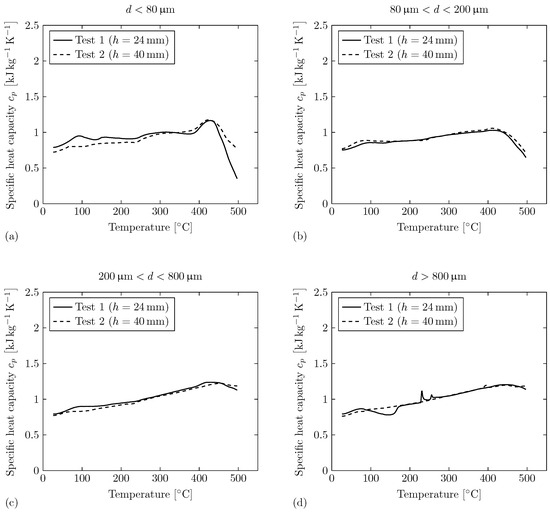
Figure 9.
Specific heat capacity of the collected particles depositing on the weighing plates for both tests measured via DSC. The shown curves are the mean values of three probes measured for each size range. (a) Particle size range of . (b) Particle size range of . (c) Particle size range of . (d) Particle size range of .
For particle Size range 1 (), the specific heat capacity curves over temperature are comparable for both tests. For Test 1, the values of the specific heat capacity are on a slightly elevated level compared to Test 2 for . The curves of both tests show a decreasing trend of the specific heat capacity for , which could be related to an exothermic reaction. For particle Size ranges 2 () and 3 (), the specific heat capacity curves over temperature are also comparable for both tests. There exist no irregularities within the course of the curves, besides the decreasing trend of the specific heat capacity for for particle Size range 2. For particle Size range 3, the decreasing trend is not as significant as for particle Size ranges 2 or 1. For particle Size range 4 (), there exist individual irregularities for the specific heat capacity curves over temperature for each test. For Test 1, an exothermic reaction can be observed for . Two endothermic peaks appear at and . For Test 2, there exists an endothermic peak at .
In conclusion, the specific heat capacity measurements deliver comparable values for all four particle size ranges in both tests. This is an important finding that helps to determine correct parameters for, e.g., simulation models of the gas–particle flow during TR. The found differences between the particle size ranges are potentially caused by the different oxidation characteristics due to different surface areas, which was already investigated in previous studies [18,22]. With increasing particle size, however, the decreasing trend at temperatures of seems to be less significant. Explicit irregularities are only observed for particle Size range 4. This corresponds with the results of the thermal gravimetric analysis of Wang et al. conducted on ejected particles during TR of a prismatic battery with an NMC622 cathode [18]. They observed a moderate mass loss within the temperature range of for particles of all size ranges. In addition, the results of the smallest particles () indicated gas that evolved from volatile thermal decomposition or a diffusion of volatiles that were adsorbed in the pores of particles [18].
Figure 10 shows the specific heat capacity over temperature of the four samples out of the jelly roll remains (compare to Figure 3) measured via DSC for Test 1 (solid line) and Test 2 (dashed line). The shown curves are the mean values of at least two of the three measurements conducted with probes of each sample out of the jelly roll remains. Some measurements had to be neglected due to significant swelling of the crucible and/or high mass loss (>) during the measurement.
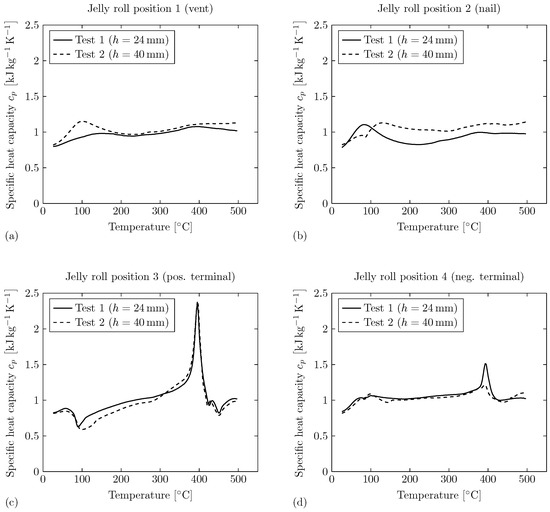
Figure 10.
Specific heat capacity of the jelly roll remains for both tests measured via DSC. The shown curves are the mean values of three probes measured for each position (compare to Figure 3). (a) Sample extracted from Position 1 (vent), (b) Sample extracted from Position 2 (nail), (c) Sample extracted from Position 3 (pos. terminal), (d) Sample extracted from Position 4 (neg. terminal).
For Position 1 (underneath vent, compare to Figure 3), the specific heat capacity curves over temperature are comparable for both tests. For Test 2, the specific heat is on a slightly elevated level compared to Test 1. In addition, an endothermic reaction can be observed for for Test 2. For Test 1, the curve shows a decreasing trend of the specific heat capacity for . For Position 2 (close to the nail, compare to Figure 3), the specific heat capacity curves over temperature show a comparable behavior for both tests besides individual irregularities. For Test 1, there exists an endothermic reaction for . For higher temperatures, the course of the curve is on a lower level compared to Test 2. For Test 2, a small exothermic peak is observed at , followed by an endothermic reaction within the temperature range of . For Position 3 (positive terminal side, compare to Figure 3), the specific heat capacity curves over temperature show significant irregularities for both tests. An exothermic peak can be observed for for Test 1 and for Test 2. In addition, there exist strong endothermic peaks at for both tests. Further exothermic peaks are observed at and . For Position 4 (negative terminal side, compare to Figure 3), the specific heat capacity curves over temperature also show significant irregularities for both tests. For both tests, endothermic peaks can be observed at . For Test 2, there exist smaller peaks indicating chemical reactions within the temperature range of .
In conclusion, the results show that the specific heat capacity of the jelly roll remains depends on the position within the jelly roll. The specific heat capacity measurements of Position 1 (underneath the vent) and Position 2 samples (close to the nail) delivered comparable results, but there exist significant differences from Position 3 (positive terminal side) and Position 4 (negative terminal side) samples. The latter show a strong endothermic peak at . Based on the data available from this study, it is unfortunately not possible to analyze the exact causes of these differences. Further research is therefore recommended in this context.
Figure 11 shows the specific heat capacity curves over temperature of the collected particles (solid lines) as well as the jelly roll remains (dashed lines) measured via DSC over temperature for Test 1 (black) and Test 2 (red). The shown curves are the mean values of all four particle sizes and all four jelly roll positions from Figure 9 and Figure 10, respectively.
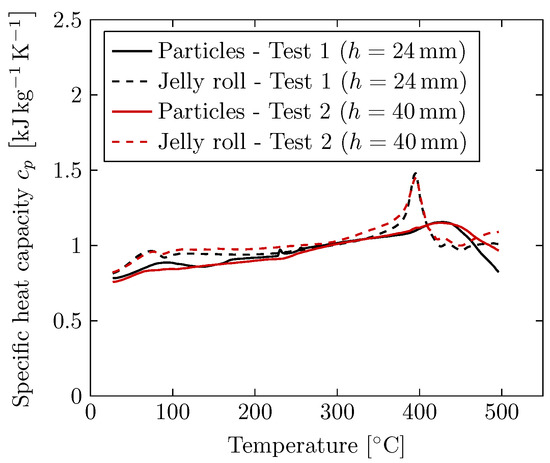
Figure 11.
Specific heat capacity of the collected particles depositing on the weighing plates as well as the jelly roll remains for both tests measured via DSC. The shown curves are the mean values of all four particles sizes and all four jelly roll positions from Figure 9 and Figure 10, respectively.
The specific heat capacity measurements deliver comparable values for the particles ejected in both tests (solid lines). Therefore, it is concluded that there is a negligible dependence between the ejected particle’s specific heat capacity and the distance between cell vent and cover. In addition, there is no significant influence of the particle size on the specific heat capacity, as shown in Figure 9. The particle’s specific heat capacity can be set independently of the particle size and the battery’s installation case within simulation models, which is an important finding. For the jelly roll remains (dashed lines), the specific heat capacity measurements also deliver comparable values in both tests. It is concluded that there is a negligible dependence between the jelly roll remains’ specific heat capacity and the distance between cell vent and cover. However, there is an influence of the position within the jelly roll remains on the specific heat capacity, as shown in Figure 10.
Comparison of the specific heat capacity measurements of the ejected particles with the measurements of the jelly roll remains shows that the jelly roll remains have a slightly higher specific heat capacity. In addition, the occurrence of the endothermic peak at for the jelly roll remains is a significant difference from the behavior of ejected particles. In this context, further investigations are recommended.
3.4. Suggestions for Further Improvement of the Proposed Setup
Based on the results of the proof-of-concept study presented here, the following suggestions for improvement are recommended for future research:
- As only a small fraction of the total ejected particle mass deposits on the weighing plates, it is recommended to extend the intermediate sheet metal. However, this can also result in higher time consumption for test preparation and evaluation.
- Determining the time-dependent particle deposition on the weighing plates, e.g., by implementing miniature load cells may provide further insights into the particle ejection process. This can also result in a more accurate weight measurement and lesser effort for post-test analysis.
- It is recommended to also collect particles that deposit within the steel box. This can offer further insights into the particle size distribution of all ejected particles.
- The milling process might be improved. There were still Cu particles that were not finely shredded with the method used in this study.
- Further findings could be obtained through the determination of the chemical composition for both ejected particles and jelly roll remains, for example, with inductively coupled plasma optical emission spectroscopy (ICP-OES).
- The presented results serve as proof of concept in the first place. Further tests must be carried out in order to quantify statistical deviations.
4. Conclusions
The presented study proposes a novel experimental setup to quantify the particle deposition during a lithium-ion battery TR. The setup integrates a single prismatic battery cell into an environment representing similar conditions as found for battery modules in EV battery packs. Within the flow path of the vented gas and particles, there are several weighing plates that can be individually removed from the setup in order to determine particle deposition. Two proof-of-concept experiments with a different distance between battery cell vent and cover are conducted. In addition, the size distribution of the vented particles is determined and specific heat capacity measurements are performed via DSC for both the vented particles and the jelly roll remains. The authors would like to point out once again that the results of this study are based on just two proof-of-concept experiments and consequently the reliability of the statements made below is limited.
4.1. Particle Deposition
- The distance between cell vent and cover has a significant influence on the particle deposition on the weighing plates.
- With a distance between cell vent and cover, particle accumulations concentrate at the side walls.
- With a distance between cell vent and cover, particle accumulations are randomly distributed over the entire area. In addition, larger particles deposit on the weighing plates.
4.2. Particle Size Distribution
- The distance between cell vent and cover has an influence on the size distribution of particles depositing on the weighing plates.
- The mass percentage of small particles () is found to be nearly independent of the gas flow velocities.
4.3. Specific Heat Capacity Measurements
- The specific heat capacity measurements deliver comparable values for all four particle size ranges in both tests.
- The specific heat capacity measurements for the jelly roll remains indicate influence of the position within the jelly roll and the specific heat capacity.
- The influence of the distance between cell vent and cover on the specific heat capacity is negligible.
In summary, the proposed experimental setup is generally suitable to quantify the particle deposition during a lithium-ion battery TR. However, there is a need for further improvement in order to enhance the quality and reliability of the results. By additionally increasing the number of tests, the results may offer further insights into the particle ejection process during lithium-ion battery TRs. This is of utmost importance, as the ejected particles carry a significant amount of energy and can be responsible for causing short circuits during TR propagation within battery packs. Today, there is a lack of understanding of the role of ejected particles in TR propagation behavior, although they pose a safety risk. This study helps researches and engineers to gain a better understanding of the gas–particle flow occurring during TR. By implementing certain suggested improvements, the proposed experimental setup may in addition be used for simulation model validation. Crucial input parameters of such models are particle size distribution as well as the specific heat capacity of the particles; both are also provided within this study. Therefore, this study contributes to the improvement of battery pack design and safety.
Author Contributions
Conceptualization, S.H. and H.K.; methodology, S.H.; investigation, S.H. and H.K.; data curation, S.H.; writing—original draft preparation, S.H.; writing—review and editing, H.K., S.Z. and O.H.; visualization, S.H.; supervision, S.Z. and O.H. All authors have read and agreed to the published version of the manuscript.
Funding
This research received no external funding.
Data Availability Statement
The original contributions presented in the study are included in the article; further inquiries can be directed to the corresponding author.
Acknowledgments
The authors gratefully acknowledge the support of our BMW Group colleagues from the technology material and process analysis (TWA) in conducting the experiments and the support of our student Yunus Emir who took over a part of the CAD construction. In addition, S. Hoelle acknowledges the support of the TUM Graduate School.
Conflicts of Interest
Authors Sebastian Hoelle, Hyojeong Kim and Sascha Zimmermann were employed by the company BMW Group. The remaining authors declare that the research was conducted in the absence of any commercial or financial relationships that could be construed as a potential conflict of interest.
Abbreviations and Symbols
The following abbreviations are used in this manuscript:
| CCCV | constant current constant voltage |
| DSC | differential scanning calorimetry |
| DEC | diethyl carbonate |
| DMC | dimethyl carbonate |
| EC | ethylene carbonate |
| EMC | ethyl methyl carbonate |
| EV | electric vehicle |
| ICP-OES | inductively coupled plasma optical emission spectroscopy |
| LiPF6 | lithium hexafluorophosphate |
| NMC | lithium nickel manganese cobalt oxide |
| SoC | state of charge |
| TR | thermal runaway |
The following symbols are used in this manuscript:
| A | flow path area, m2 |
| specific heat capacity, | |
| d | diameter, m |
| h | height between cell vent and cover of the test setup, m |
| m | mass, kg |
| difference, - | |
| Indices: | |
| cell | index representing the full cell |
| i | index representing the weighing plate i |
| glas | index representing a glass (used for particle collection and weighing) |
| loose | index representing loose particles on a weighing plate |
| particles | index representing the particles vented during TR |
| postTR | index representing the state after TR |
| scraped | index representing particles that are scraped off from a weighing plate |
| stick | index representing sticking particles |
| total | index representing the total amount of particles on a weighing plate |
| TR | index representing the TR process |
References
- Sun, P.; Bisschop, R.; Niu, H.; Huang, X. A Review of Battery Fires in Electric Vehicles. Fire Technol. 2020, 56, 1361–1410. [Google Scholar] [CrossRef]
- Huang, W.; Feng, X.; Han, X.; Zhang, W.; Jiang, F. Questions and Answers Relating to Lithium-Ion Battery Safety Issues. Cell Rep. Phys. Sci. 2021, 2, 100285. [Google Scholar] [CrossRef]
- Feng, X.; Ouyang, M.; Liu, X.; Lu, L.; Xia, Y.; He, X. Thermal runaway mechanism of lithium ion battery for electric vehicles: A review. Energy Storage Mater. 2018, 10, 246–267. [Google Scholar] [CrossRef]
- Liu, J.; Li, J.; Wang, J. In-depth analysis on thermal hazards related research trends about lithium-ion batteries: A bibliometric study. J. Energy Storage 2021, 35, 102253. [Google Scholar] [CrossRef]
- Jindal, P.; Bhattacharya, J. Review—Understanding the Thermal Runaway Behavior of Li-Ion Batteries through Experimental Techniques. J. Electrochem. Soc. 2019, 166, A2165–A2193. [Google Scholar] [CrossRef]
- Ouyang, D.; Chen, M.; Huang, Q.; Weng, J.; Wang, Z.; Wang, J. A Review on the Thermal Hazards of the Lithium-Ion Battery and the Corresponding Countermeasures. Appl. Sci. 2019, 9, 2483. [Google Scholar] [CrossRef]
- Wang, Q.; Mao, B.; Stoliarov, S.I.; Sun, J. A review of lithium ion battery failure mechanisms and fire prevention strategies. Prog. Energy Combust. Sci. 2019, 73, 95–131. [Google Scholar] [CrossRef]
- Feng, X.; Ren, D.; He, X.; Ouyang, M. Mitigating Thermal Runaway of Lithium-Ion Batteries. Joule 2020, 4, 743–770. [Google Scholar] [CrossRef]
- Li, W.; Xue, Y.; Feng, X.; Rao, S.; Zhang, T.; Gao, Z.; Guo, Y.; Zhou, H.; Zhao, H.; Song, Z.; et al. Characteristics of particle emissions from lithium-ion batteries during thermal runaway: A review. J. Energy Storage 2024, 78, 109980. [Google Scholar] [CrossRef]
- Zou, K.; Chen, X.; Ding, Z.; Gu, J.; Lu, S. Jet behavior of prismatic lithium-ion batteries during thermal runaway. Appl. Therm. Eng. 2020, 179, 115745. [Google Scholar] [CrossRef]
- Garcia, A.; Monsalve-Serrano, J.; Sari, R.L.; Martinez-Boggio, S. An optical investigation of thermal runaway phenomenon under thermal abuse conditions. Energy Convers. Manag. 2021, 246, 114663. [Google Scholar] [CrossRef]
- Wang, G.; Kong, D.; Ping, P.; Wen, J.; He, X.; Zhao, H.; He, X.; Peng, R.; Zhang, Y.; Dai, X. Revealing particle venting of lithium-ion batteries during thermal runaway: A multi-scale model toward multiphase process. eTransportation 2023, 16, 100237. [Google Scholar] [CrossRef]
- Ding, C.; Zhu, N.; Yu, J.; Li, Y.; Sun, X.; Liu, C.; Huang, Q.; Wang, J. Experimental investigation of environmental pressure effects on thermal runaway properties of 21700 lithium-ion batteries with high energy density. Case Stud. Therm. Eng. 2022, 38, 102349. [Google Scholar] [CrossRef]
- Liao, Z.; Zhang, S.; Li, K.; Zhao, M.; Qiu, Z.; Han, D.; Zhang, G.; Habetler, T.G. Hazard analysis of thermally abused lithium-ion batteries at different state of charges. J. Energy Storage 2022, 27, 101065. [Google Scholar] [CrossRef]
- Essl, C.; Golubkov, A.W.; Gasser, E.; Nachtnebel, M.; Zankel, A.; Ewert, E.; Fuchs, A. Comprehensive Hazard Analysis of Failing Automotive Lithium-Ion Batteries in Overtemperature Experiments. Batteries 2020, 6, 30. [Google Scholar] [CrossRef]
- Zhang, Y.; Wang, H.; Li, W.; Li, C. Quantitative identification of emissions from abused prismatic Ni-rich lithium-ion batteries. eTransportation 2019, 2, 100031. [Google Scholar] [CrossRef]
- Zhang, Y.; Wang, H.; Li, W.; Li, C.; Ouyang, M. Size distribution and elemental composition of vent particles from abused prismatic Ni-rich automotive lithium-ion batteries. J. Energy Storage 2019, 26, 100991. [Google Scholar] [CrossRef]
- Wang, Y.; Wang, H.; Zhang, Y.; Cheng, L.; Wu, Y.; Feng, X.; Lu, L.; Ouyang, M. Thermal oxidation characteristics for smoke particles from an abused prismatic Li(Ni0.6Co0.2Mn0.2)O2 battery. J. Energy Storage 2021, 39, 102639. [Google Scholar] [CrossRef]
- Premnath, V.; Wang, Y.; Wright, N.; Khalek, I.; Uribe, S. Detailed characterization of particle emissions from battery fires. Aerosol Sci. Technol. 2022, 56, 337–354. [Google Scholar] [CrossRef]
- Chen, S.; Wang, Z.; Yan, W. Identification and characteristics analysis of powder ejected from a lithium ion battery during thermal runaway at elevated temperatures. J. Hazard. Mater. 2020, 400, 123169. [Google Scholar] [CrossRef]
- Held, M.; Tuchschmid, M.; Zennegg, M.; Figi, R.; Schreiner, C.; Mellert, L.D.; Welte, U.; Kompatscher, M.; Hermann, M.; Nachef, L. Thermal runaway and fire of electric vehicle lithium-ion battery and contamination of infrastructure facility. Renew. Sustain. Energy Rev. 2022, 165, 112474. [Google Scholar] [CrossRef]
- Wang, H.; Wang, Q.; Jin, C.; Xu, C.; Zhao, Y.; Li, Y.; Zhong, C.; Feng, X. Detailed characterization of particle emissions due to thermal failure of batteries with different cathodes. J. Hazard. Mater. 2023, 458, 131646. [Google Scholar] [CrossRef] [PubMed]
- Coman, P.T.; Rayman, S.; White, R.E. A lumped model of venting during thermal runaway in a cylindrical Lithium Cobalt Oxide lithium-ion cell. J. Power Sources 2016, 307, 56–62. [Google Scholar] [CrossRef]
- Coman, P.T.; Darcy, E.C.; White, R.E. Simplified Thermal Runaway Model for Assisting the Design of a Novel Safe Li-Ion Battery Pack. J. Electrochem. Soc. 2022, 169, 040516. [Google Scholar] [CrossRef]
- Ostanek, J.K.; Li, W.; Mukherjee, P.P.; Crompton, K.R.; Hacker, C. Simulating onset and evolution of thermal runaway in Li-ion cells using a coupled thermal and venting model. Appl. Energy 2020, 268, 114972. [Google Scholar] [CrossRef]
- Li, W.; Quiroga, V.L.; Crompton, K.R.; Ostanek, J.K. High Resolution 3-D Simulations of Venting in 18650 Lithium-Ion Cells. Front. Energy Res. 2021, 9, 788239. [Google Scholar] [CrossRef]
- Kim, J.; Mallarapu, A.; Finegan, D.P.; Santhanagopalan, S. Modeling cell venting and gas-phase reactions in 18650 lithium ion batteries during thermal runaway. J. Power Sources 2021, 489, 229496. [Google Scholar] [CrossRef]
- Citarella, M.; Suzzi, D.; Brunnsteiner, B.; Schiffbänker, P.; Maier, G.; Schneider, J. Computational Modelling of Thermal Runaway Propagation in Lithium-Ion Battery Systems. In Proceedings of the 2019 IEEE Transportation Electrification Conference (ITEC-India), Bengaluru, India, 17–19 December 2019; Available online: https://ieeexplore.ieee.org/abstract/document/9080817 (accessed on 22 April 2024).
- Mishra, D.; Shah, K.; Jain, A. Investigation of the Impact of Flow of Vented Gas on Propagation of Thermal Runaway in a Li-Ion Battery Pack. J. Electrochem. Soc. 2021, 168, 060555. [Google Scholar] [CrossRef]
- Hoelle, S.; Scharner, S.; Asanin, S.; Hinrichsen, O. Analysis on Thermal Runaway Behavior of Prismatic Lithium-Ion Batteries with Autoclave Calorimetry. J. Electrochem. Soc. 2021, 168, 120515. [Google Scholar] [CrossRef]
Disclaimer/Publisher’s Note: The statements, opinions and data contained in all publications are solely those of the individual author(s) and contributor(s) and not of MDPI and/or the editor(s). MDPI and/or the editor(s) disclaim responsibility for any injury to people or property resulting from any ideas, methods, instructions or products referred to in the content. |
© 2024 by the authors. Licensee MDPI, Basel, Switzerland. This article is an open access article distributed under the terms and conditions of the Creative Commons Attribution (CC BY) license (https://creativecommons.org/licenses/by/4.0/).