Article

Modelling Li-V2O5 Batteries Using Galvanostatic Intermittent Titration Technique and Electrochemical Impedance Spectroscopy: Towards Final Applications

by
Johanna Naranjo-Balseca
,
Cynthia Martínez-Cisneros
* and
Alejandro Várez
*
Department of Materials Science and Engineering and Chemical Engineering, University Carlos III of Madrid, 28911 Leganes, Spain
*
Authors to whom correspondence should be addressed.
Batteries 2024, 10(6), 172; https://doi.org/10.3390/batteries10060172
Submission received: 8 April 2024 / Revised: 4 May 2024 / Accepted: 20 May 2024 / Published: 23 May 2024
(This article belongs to the Section Battery Modelling, Simulation, Management and Application)

Abstract

:
Given the relevance of lithium and post-lithium batteries as electrochemical energy storage systems, the peculiar crystalline structure of V2O5 and its doping capacity play key roles in lithium-ion battery technology. To integrate them in high-efficiency modules, systematic methodologies are required to estimate the state of charge in a reliable way and predict the Li-V2O5 battery’s performance according to their electrochemical phenomena, including two plateaus in the galvanostatic cycling curves and the dynamic behavior governed by the energy demand. Most state of charge estimation and battery modeling procedures are focused on conventional Li-batteries that show a unique plateau. In this work, we propose a systematic methodology based on the galvanostatic intermittent titration technique and electrochemical impedance spectroscopy to study battery performance in the time and frequency domains, respectively. The proposed methodology, with a time–frequency correlation, promotes a deeper understanding of the electrochemical phenomena and general behavior of Li-V2O5 batteries, allowing for its subsequent extrapolation to more complex and higher-capacity lithium and post-lithium batteries used in high-power applications with a minimum error.

Graphical Abstract

1. Introduction

The global energy demand has significantly increased in recent years, and this trend is expected to continue. The main energy supply sources mostly rely on the use of fossil fuels, limited resources whose use is controversial, given their associated environmental impacts. A renewable energy transition is, therefore, needed to ensure a clean supply chain, respecting the environment while preserving the level of development and quality of life of the present and future generations [1]. In this sense, electrochemical storage systems, specifically batteries, are considered to be the alternative of choice, mainly due to their large storage capacity, high energy density, low self-discharge, and lack of memory effect when compared with other technologies [2,3,4].
Within the advances in lithium-ion battery technology, the peculiar crystalline structure of vanadium pentoxide (V2O5) has made it a notable contributor to improving the performance and durability of batteries, mitigating the problems associated with electrode degradation and capacity fading [5]. This is because the intricate atomic lattice, characterized by an ordered arrangement of vanadium and oxygen atoms, favors ionic diffusion, facilitating the efficient intercalation and de-intercalation of Li+ during the charging and discharging cycles of the batteries. In addition to these features, the crystalline structure of V2O5 can be adjusted and optimized to improve its electrochemical properties, so it is possible to modify the lattice spacing and incorporate various dopants to enhance the Li+ storage capabilities [6,7]. This adaptability makes Li-V2O5 batteries a potential candidate for the development of high-performance lithium-ion batteries with a higher energy density, longer cycle life, and faster charging capabilities. These improvements could promote Li-V2O5 batteries’ emergence, as current and future energy needs require innovative contenders in a new era of lithium-ion energy storage, with potential use in fully developed and mature applications such as electric vehicles (EVs) [8,9], hybrid electric vehicles (HEVs) [10], and smart grids [11], among others [12,13]. Despite the Li batteries commonly used in these applications presenting typical electrochemical behavior with simple galvanostatic charge and discharge curves [14,15], Li-V2O5 batteries exhibit more complex electrochemical behavior with two plateaus in their galvanostatic cycling [16]. Guaranteeing the optimal integration of Li-V2O5 batteries in high-performance applications requires determining and even predicting their behavior by estimating the state of charge (SoC) [17,18,19] and obtaining an accurate battery model [15], which allows for reproducing both the behavior defined by the electrochemical phenomena taking place and the dynamic behavior defined by the current changes experienced during the charge and discharge cycles governed by the energy demand.
In this work, we propose a systematic methodology based on the galvanostatic intermittent titration technique (GITT) [20,21] and electrochemical impedance spectroscopy (EIS) [22,23,24] to study battery performance in the time and frequency domains, respectively. The proposed methodology, with a time–frequency correlation, provides a deeper understanding of the electrochemical phenomena taking place in Li-V2O5 batteries, as well as an insight into its their behavior in terms of energy demand. A deep understanding of the complex phenomena taking place in Li-V2O5 cells would enable the subsequent extrapolation of the proposed methodology to more complex and higher-capacity lithium and post-lithium batteries used in high-power applications with a minimum error.

2. Experimental Procedure

2.1. Galvanostatic Charge/Discharge Curves

The studied VL2020 coin cell, manufactured by Panasonic (Moriguchi, Japan), has a vanadium oxide (V2O5) cathode, lithium alloy anode, and non-aqueous liquid electrolyte. With a nominal capacity of 20 mA and a maximum current rate of C/13 (1.5 mA), this cell can be considered as a low-capacity power cell whose main application relies on memory backup power supplies for automation equipment (personal computers and fax machines), audio–video equipment (video tape recorders), communications equipment (mobile phones), and hybrid systems with solar batteries as remote controllers. The main specifications of this battery are summarized in Table 1.
The galvanostatic charge and discharge curves of the VL2020 cell are experimentally obtained at different C-rates (C/13, C/25, C/35, and C/45), as shown in Figure 1A, by setting the Neware (Shenzhen, China) BTS-4000 potentiostat to the constant current (CC) cycling mode. The lower the C-rate, the higher the capacity, reaching values up to 27.5 mAh. According to the experimental data obtained (Figure S1), the polarization effects become more significant as the charge/discharge rate increases, which implies a higher impedance in the cell and, therefore, a slower rate of ion transfer, which hinders intercalation reactions. Two plateaus are observed at approximately 3 V and 3.2 V during charge and 3 V and 2.8 V during discharge, which are attributed to the phase transitions experienced by the cathode material during discharge, i.e., from α-V2 to ε-Li0.5V2O5 and from ε-Li0.5V2O5 to δ-LiV2O5 [5,6,7,16]. This shows a clear difference regarding the electrochemical behavior of most widely used lithium batteries, which typically present simpler behavior with a unique plateau [8,14,25,26]. In this case, the presence of two plateaus might complicate the modeling process of the cell, jeopardizing the accuracy when applying methods typically used for conventional lithium cells, including the mathematical models of Shepherd [11,27] and Nernst [12,28]. Therefore, here, we propose a systematic methodology based on the application of the GITT and EIS that, being able to fulfil complex electrochemical behavior, can be later extrapolated to the electrochemical characterization and modeling of new cathode materials towards novel lithium and post-lithium batteries.

2.2. Estimation of State of Charge (SoC)

The state of charge is the proportion of the available charge at a point compared to the total available charge when the cell is fully charged. Therefore, an SoC value of 100% is considered when the battery is fully charged and a value of 0% is considered when it is fully discharged. In many applications where lithium batteries are used as an energy storage system, the SoC is calculated using the basic Coulombic counting method or its variations, since it has an acceptable accuracy and involves a simple computational implementation [17,29,30,31].
This method consists of periodically calculating the current flowing out of and into the cell, estimating the SoC by subtracting or adding the accumulated net charge. In this case, since the cell capacity is always known and the current flow can be accurately measured, the SoC is estimated by the ampere-hour integral Expression (1)
SoC = SoC 0 + 1 Q n · t 0 t I b · dt ,
where SoC0 is the initial value of the state of charge, Ib is the current flowing through the cell during charging and discharging, and Qn is the nominal capacity [30,31].
The curves obtained from the SoC estimation by applying (1) to the experimental data obtained in Figure 1A are shown in Figure 1B. In this case, to increase the fitting and accuracy, the maximum capacity values obtained experimentally during charging and discharging are taken as nominal values (Figure 1A). On the other hand, both the cell current and charge/discharge times are obtained from the potentiostat used to control the cycling process (Neware BTS-4000).

2.3. Battery Modeling Considerations

To model the battery, two approaches are considered, the conventional Thevenin model (Figure 2A) and the SoC-dependent Thevenin model (Figure 2B). The main difference between them relies on the variability of the latter in the values of the elements of the electrical circuit. Ri corresponds to the internal resistance, the RnCn grids reproduce the dynamic behavior corresponding to the polarization effect in the cell, and the power supply, referred to as OCV, corresponds to the open-circuit voltage.
In general, increasing the number of RC elements is considered to improve the fitting, increasing the accuracy of the Thevenin model when reproducing the cell behavior. However, the use of more than four RC grids to implement the electrical circuit considerably increases the computational demand, without any significant improvement in the model’s accuracy, especially in SoC-dependent models [32]. Therefore, the criterion we follow to set the number of RC elements is, according to the literature [33], increasing the number of RC networks until the difference between the experimental charge/discharge curves and simulated curves reaches a steady state. Following this approach, the number of RC grids chosen is three.

2.4. Modeling Techniques

2.4.1. Galvanostatic Intermittent Titration Technique (GITT)

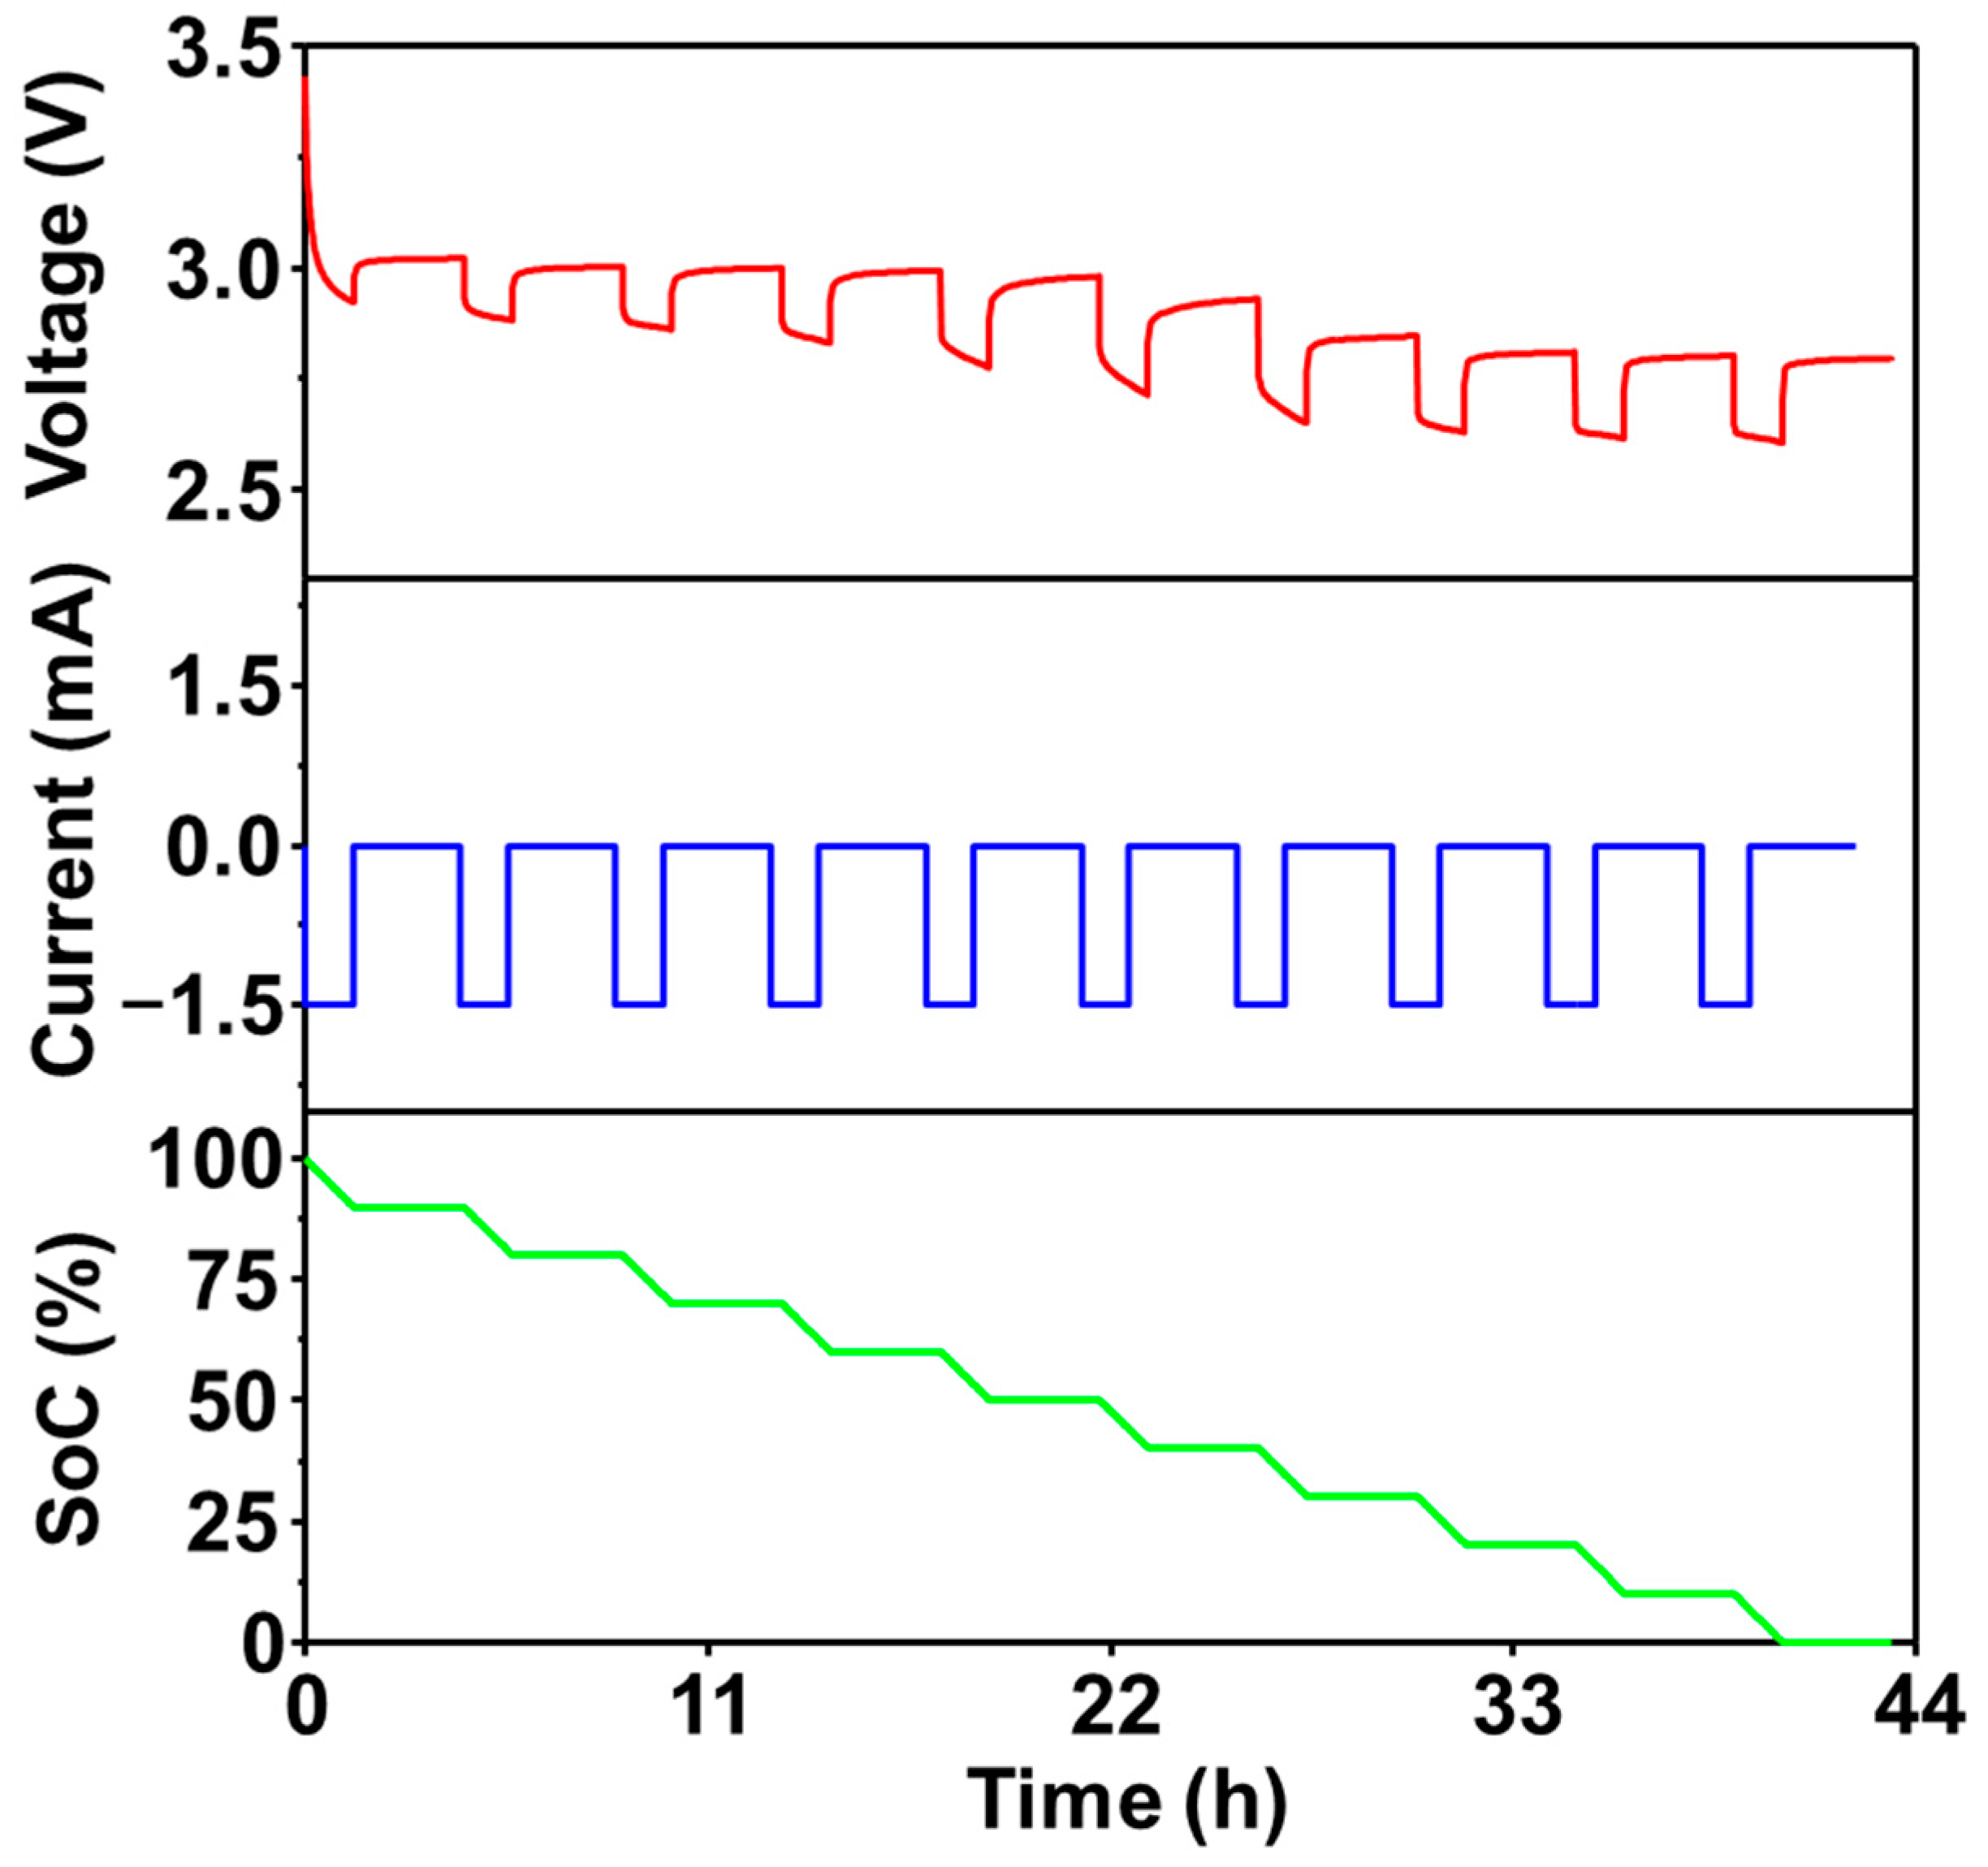
The galvanostatic intermittent titration technique, or the GITT, is one of the most widely used in the time domain and consists of applying a train of controlled continuous current pulses to discharge a cell, in such a way that each current pulse decreases a percentage of the state of charge (Figure 3).
The duration of the discharge pulses (tp) is calculated by using Expression (2), as indicated in [34,35,36,37],
t p = Δ SoC · Q n I b · 100 ,
where Ib is the discharge current of each pulse, Qn is the nominal capacity, and ΔSoC is the percentage of the state of charge to vary with each pulse.
Although Ib should typically be about 0.2 C [34,37], in this case, the cell is discharged at the maximum current, according to the specifications given in Table 1. The nominal capacity is obtained from the cell data sheet, amounting to 20 mAh. The value of ∆SoC is set considering that, the lower the percentage, the higher the resolution obtained from the voltage curve, and, therefore, the lower the error after implementing the Thevenin model. In this case, ∆SoC is set to 10%, reducing the SoC value from 100% (fully charged cell) to 0% (fully discharged cell), as shown in Figure 3. According to these guidelines, the duration of the calculated discharge current pulse time is 1.33 h.

2.4.2. Electrochemical Impedance Spectroscopy (EIS)

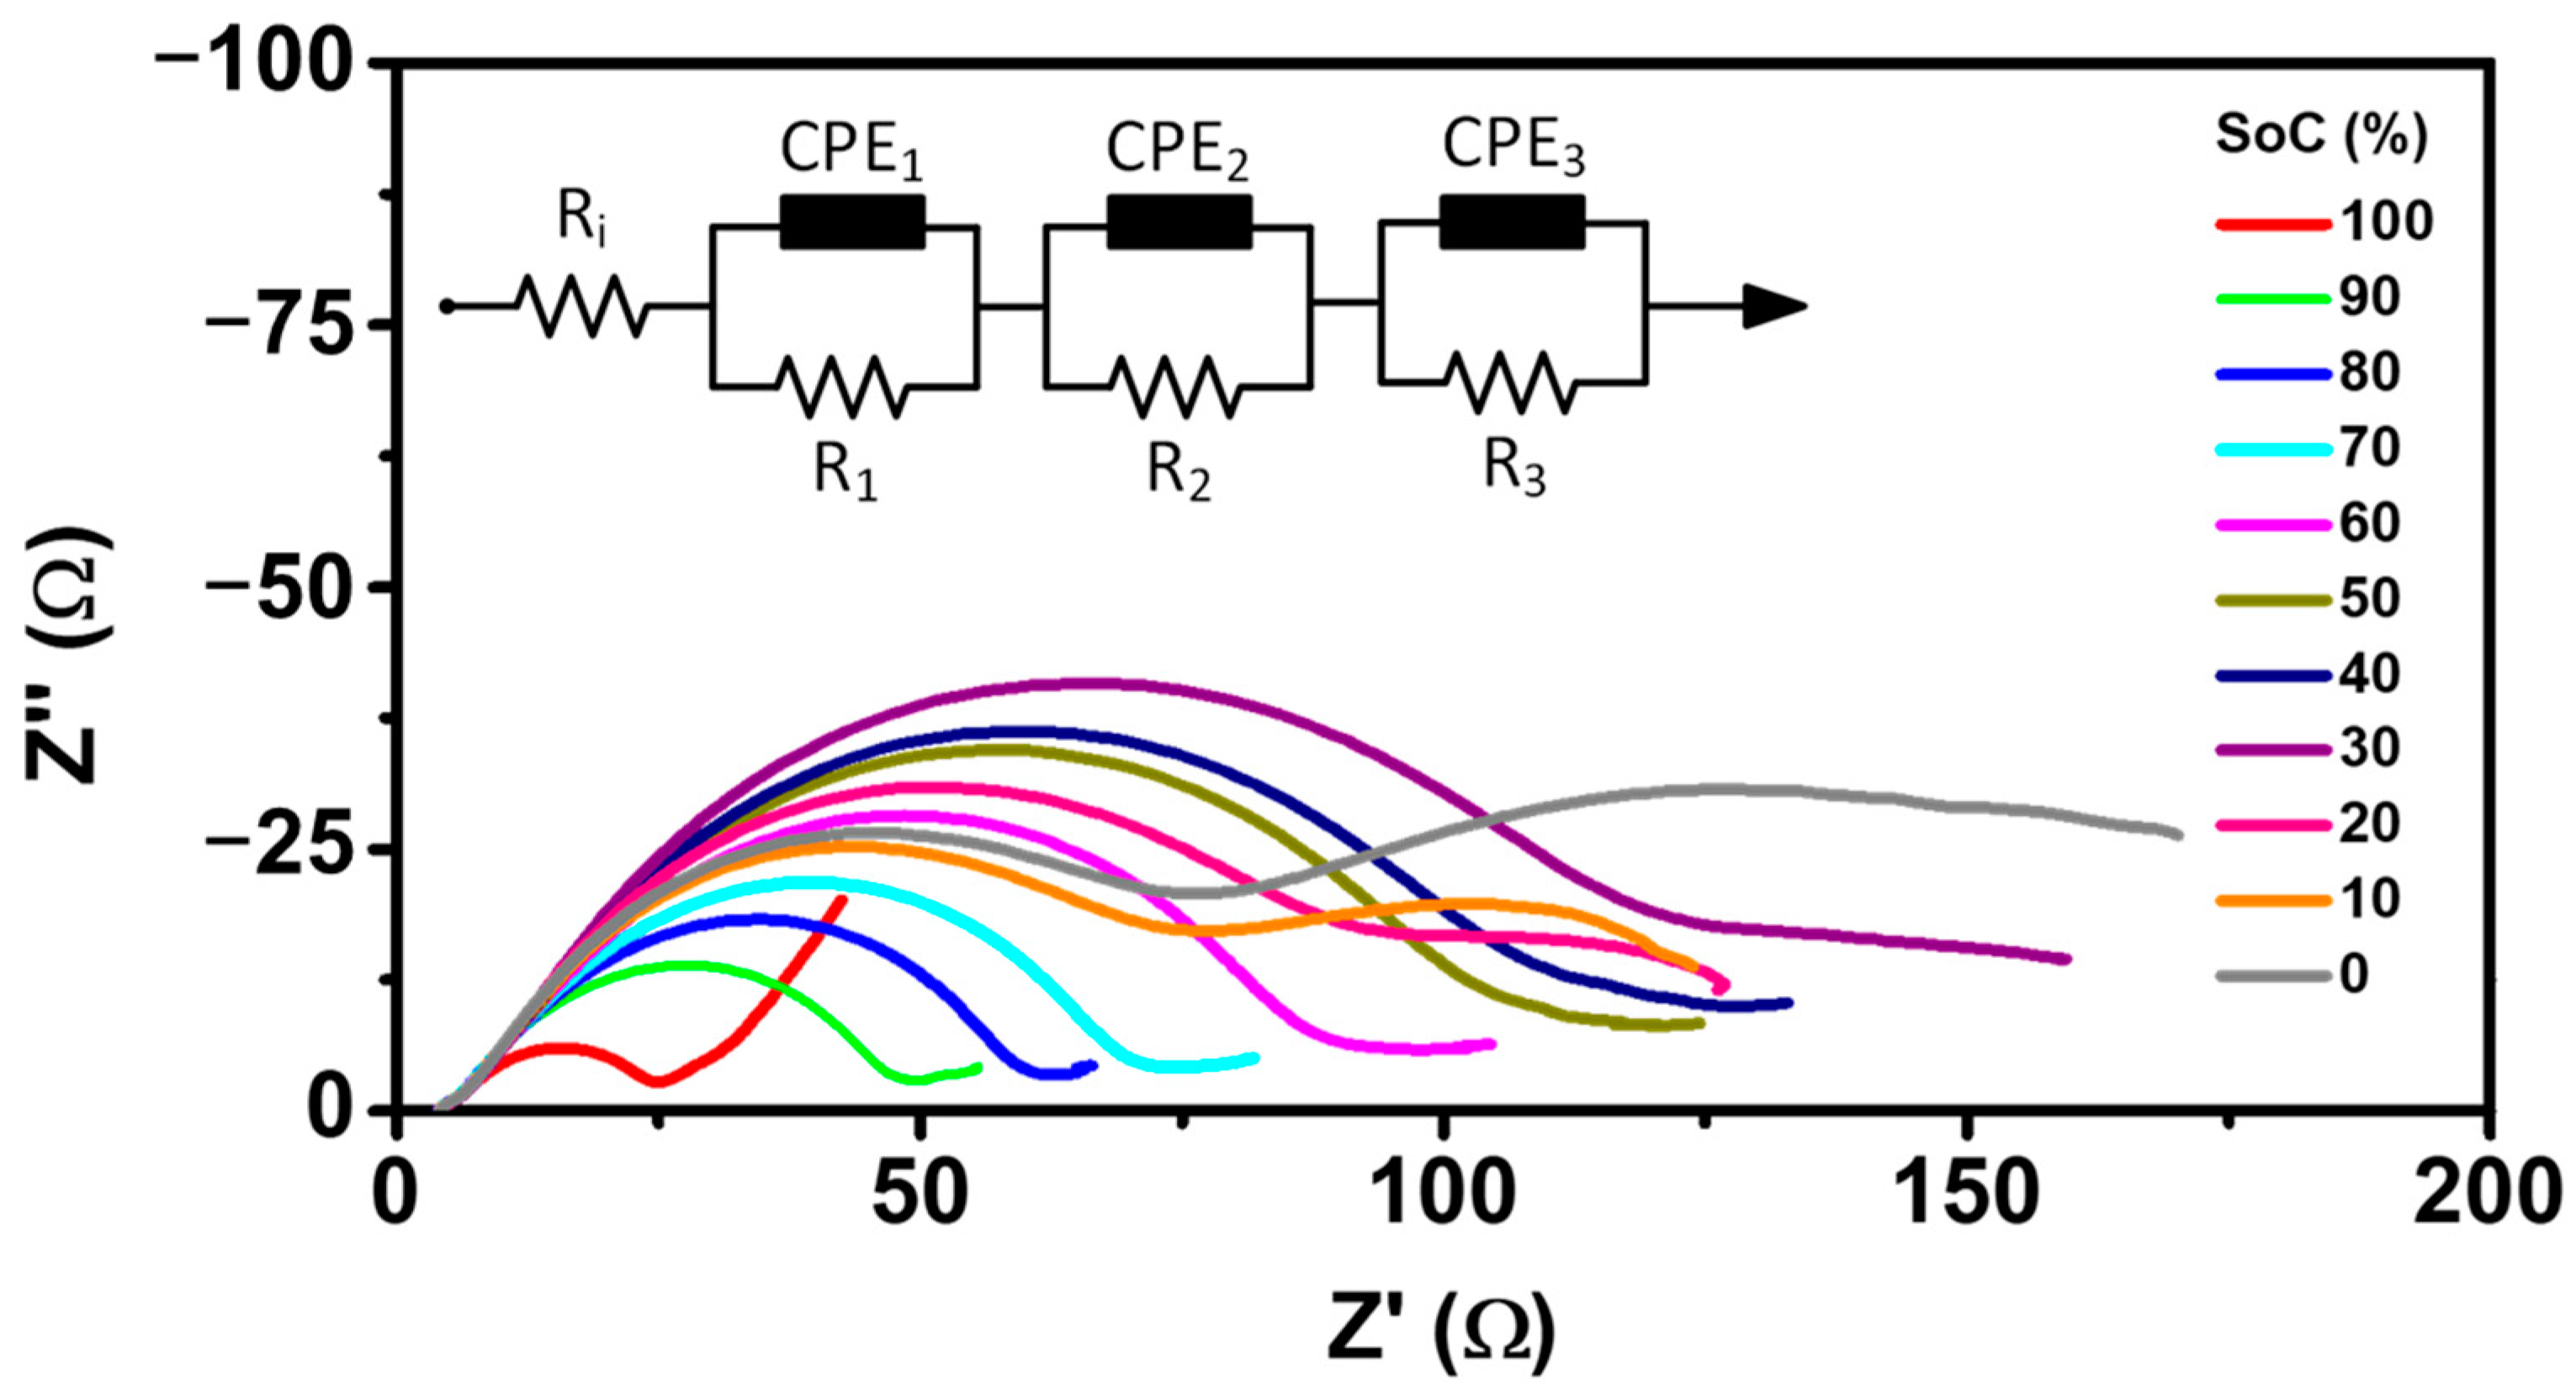
To enrich the electrochemical study, the cells are also investigated in the frequency domain by using electrochemical impedance spectroscopy (EIS) with a BioLogic (Seyssinet-Pariset, France) VMP3 Multichannel Potentiostat. In this sense, taking advantage of the GITT, impedance measurements are performed at the instant before the cell starts discharging and the voltage reaches a steady state (purple dots in Figure S2). Each measurement corresponds to the SoC value obtained as it decreases by 10% in each pulse. Figure 4 presents the results of the EIS measurements carried out over the whole SoC range (from 100% to 0% SoC), where four different regions, related to different processes, can be distinguished in the impedance spectra (Figure S3). The first region is located at the intersection with the real impedance axis (x-axis), corresponding to the internal resistance of the cell (Ri); the second region is represented by a small semicircle, related to the electrode–electrolyte interface and the emergence of the SEI (solid–electrolyte interface); the third region is defined by a larger semicircle and is related to the charge transfer processes and double-layer capacitance; and finally, the fourth region, at low frequencies, corresponds to the diffusion processes [12,22,38,39]. Normally, the last semicircle is represented by a Warburg resistor in most models for Li batteries. However, in this case, the more complex behavior of the Li-V2O5 cell is best reproduced when a constant phase element (CPE) is used.
According to the EIS data obtained (Figure 4), the intersection with the x-axis in the high-frequency zone does not vary significantly (region 1 in Figure S3), suggesting that the internal resistance only slightly increases as the SoC decreases. Only negligible variations are observed regarding the small semicircle at high frequencies (region 2 in Figure S3), suggesting a stable electrode–electrolyte interface. The main differences in the spectra are seen in regions 3 and 4. Regarding region 3, the semicircle shifts to the right and increases in diameter as the SoC decreases, whereas the semicircle in region 4 not only shifts to the right, but also increases in size and begins to become better defined as the SoC decreases. These two semicircles could be associated with the processes of charge transfer and the diffusional effects of the lithium-ion on the host material, respectively. Thus, it can be inferred that a decrease in the state of charge produces an increase in the impedance in the cell, hindering the intercalation and diffusion phenomena of the lithium battery. Although the spectra corresponding to the SoC from 20% to 0% clearly present the four regions mentioned above, there is not a clear trend. This could be associated with the low charge in the battery, being outside of the limits recommended by the manufacturer, who suggests cycling from 20% to 80% of the SoC. A different trend can also be observed in the semicircle at low frequencies when the cell is fully charged (100% SoC), as is observed in Figure S13. The steep slope of almost 45° may suggest that the cathode material has all vacancies free, favoring lithium diffusion [12,38,39].

2.5. Identification and Estimation of Parameters

2.5.1. Galvanostatic Intermittent Titration Technique (GITT)

The cell discharge curve (Figure 3) shows the voltage relaxation processes once the discharge current is no longer applied, resulting in a pulsed discharge curve. The changes experienced by the voltage amplitude can be attributed to the slope and plateau changes observed in the charge and discharge curves previously observed in Figure 1A. This dynamic voltage response allows for the identification and estimation of the elements of the equivalent electrical circuit according to the Thevenin models (Figure 2) by using general-purpose software tools, such as MATLAB®/Simulink (R2022b).
The procedure performed is depicted in Figure S14 and consists of: (1) obtaining the identification data, in this case, the pulsed current and voltage curve of the cycled cell using the GITT; (2) implementing the equivalent electrical circuits of the conventional Thevenin and SoC-dependent models in Simulink; (3) importing the identification data to the implemented models and choosing the parameters to be estimated, that is, the circuit elements whose value needs to be known; and finally (4) calculating the error. As previously shown in Figure S2, the experimental voltage curve presents three zones where different amplitudes are exhibited. Therefore, to reproduce such dynamic behavior more accurately, electrical circuits are implemented by using three RC grids. These amplitude changes can be attributed to the phase transitions experienced by the cathode material, which cause the voltage curve to exhibit two plateaus (Figure 1A).
After applying the identification and estimation process, the values of the electrical circuit elements used to implement the conventional model and SoC-dependent model are shown in Table 2. While the conventional model uses only one value to reproduce the cell behavior in each state of charge, the SoC-dependent model uses one value for the SoC using a lookup table (LUT). In general, the values obtained by both methods are in the same order of magnitude, with some differences mainly observed in the capacitance. Nevertheless, since the SoC-dependent model gives place to one value for each element corresponding to each SoC, a higher accuracy would be expected while modeling the battery and, therefore, a reduced error.

2.5.2. Electrochemical Impedance Spectroscopy (EIS)

From the EIS data, analogous to the time-domain electrical model (Figure 2), the behavior of the cell in the frequency domain is modeled by obtaining an equivalent electrical circuit. As can be seen in the inset of Figure 4, the three RC elements are maintained, in which the capacitors used in the time domain are replaced by constant phase elements (CPE) in the frequency domain [40].
In this case, modeling in the frequency domain is carried out by using the ZView® software (4.0C). The adjustments made are shown in the Supplementary Materials from Figures S3–S13, while the estimated values for the electrical circuits are given in Table 3. It is worth mentioning that the values of the equivalent capacitors to the CPEs are calculated, since, in order to obtain a similar electrical circuit and compare the curves obtained from it with the experimental curves obtained from the VL2020 cell, it is necessary that the elements of the model are in the time domain.
In general, the values obtained by both methods are in the same order of magnitude. The main differences are observed in the case of the third RC grid (R3 and C3), where a significant increase in values is observed when using the conventional model.

3. Results and Discussion

The modeling of Li-V2O5 batteries, characterized by both conventional dynamic behavior due to changes in the current profiles and complex chemical behavior due to phase transition processes, reflected as two plateaus in the charge and discharge curves (Figure 1), is carried out using the GITT and EIS technique, similar to how conventional lithium-ion battery modeling is performed, which exhibits a single plateau in the charge/discharge curves. The electrical model obtained facilitates the implementation and future integration of Li-V2O5 batteries into end-use applications where they are required. This is different from the existing literature, which focuses on obtaining analytical models to study thermodynamic and kinetic properties through intercalation mechanisms in V2O5 electrodes [41,42,43].

3.1. Thevenin Models and Galvanostatic Intermittent Titration Technique

Figure 5 shows the experimental pulsed discharge curve obtained by cycling the Li-battery and that simulated by the Thevenin models, together with the difference between both curves represented as the relative error. A clear difference is observed between the curves in the conventional Thevenin model, especially in the abrupt voltage changes, which means that this model is not able to faithfully reproduce the dynamic behavior of the cell, leading to an error in the range of about ±0.6 V (Figure S15).
On the other hand, the SoC-dependent Thevenin model presents a more accurate approximation of the experimental behavior, with only negligible differences and an error of about ±0.2 V (Figure S15). Although the difference between the relative errors of the two models does not seem to be significant, in terms of the relative error, a percentage error with respect to the real cell voltage value of 16% is obtained with the conventional model (Figure 5A) vs. the 6% obtained for the SoC-dependent model (Figure 5B).
In general, the maximum acceptable error limit for a model is about 10% [44,45,46,47,48], with the SoC-dependent model having this limit. Moreover, this model can better represent the dynamic behavior of the cell, which is very important when reproducing current profiles, since the energy demand of the cell will not always be the same.
The main merits of the electric model obtained through the GITT include providing detailed information about phase transition processes, offering a comprehensive profile of the Li-V2O5 battery’s response to different currents and states of charge, and preventing overheating during testing. It also allows for the development of an adaptable and versatile procedure that can be applied to different types of batteries and under a variety of conditions, depending on their integration into the final applications. However, drawbacks include a prolonged testing time, requirements for specialized equipment, and sensitivity to temperature, which affects the accuracy of the results.

3.2. Thevenin Models and Electrochemical Impedance Spectroscopy

To compare the results of the GITT and EIS measurements, the values obtained in Table 3 from the impedance spectra are replaced in the equivalent electrical circuits considered in Simulink and the pulsating voltage curve is simulated. In the conventional Thevenin model, which does not depend on the SoC of the cell, the values of the circuit elements are calculated by averaging them all, whereas in the SoC-dependent Thevenin model, an LUT (lookup table) is used to represent the variability of the values of the electrical circuit elements with the SoC.
The simulation results show that both models tend to follow the pulsating trend of the voltage curve, but neither are able to faithfully reproduce the abrupt voltage changes. Hence, the dynamic behavior of the cell cannot be accurately reproduced by using this approach. Figure 5C shows how the conventional model follows the voltage more accurately during discharging, while Figure 5D shows how the SoC-dependent model tends to follow the voltage more accurately when the cell is at rest.
The error percentage achieved with the conventional model (16%) is twice the value obtained with the SoC-dependent model (6%), and, as mentioned before, is far from the error considered as acceptable (10%) for a model to be reliable [44,45,46,47,48]. Consequently, the SoC-dependent Thevenin equivalent electrical circuit offers a better fitting. In terms of the absolute error (Figure S15), the difference between the two models is quite small, with 0.6 V obtained with the conventional model and 0.2 V with the SoC-dependent model.
The electric model obtained through EIS provides a comprehensive understanding of the electrochemical properties of Li-V2O5 batteries, facilitating their accurate modeling. It allows for real-time data collection without interrupting the battery operation and covers a wide range of frequencies to obtain a detailed electrochemical response. However, challenges include interpreting complex data, requirements for specialized equipment, and sensitivity to experimental conditions that can lead to variability, which affects the accuracy of the results.
When comparing the GITT and EIS method, the advantage of the GITT in reliably and accurately reproducing the behavior of Li-V2O5 batteries is revealed, with an acceptable error margin of less than 10%, which falls within battery modeling standards [44,45,46,47,48]. The electrical model obtained in the time domain through the GITT is direct, simple, precise, reproducible, reliable, and robust, facilitating the integration of Li-V2O5 batteries into their final applications where required. In contrast, the EIS technique provides a model in the frequency domain, which may lack reproducibility due to the high sensitivity of the technique to changes in the test parameters or conditions. Additionally, it requires the transformation of the model into the time domain to allow for the practical implementation and integration of Li-V2O5 batteries into their final applications, making it less suitable for the direct acquisition of the battery model.

4. Conclusions

The modeling and simulation of Li-batteries with complex electrochemical behavior was successfully accomplished by applying two complementary techniques: galvanostatic intermittent titration (GITT) and electrochemical impedance spectroscopy (EIS). In both cases, the equivalent electrical circuit was obtained by using two approaches, the conventional Thevenin model and SoC-dependent Thevenin model. The obtained results and subsequent error analysis demonstrated that the model estimated by the GITT better met all the criteria required to represent, with confidence and a high accuracy, the dynamic behavior of the cell, especially abrupt voltage changes. The model had a fairly linear error of 6% (±0.2 V) and a high accuracy when comparing the voltage curve simulated by the electrical circuit implemented in Simulink and the experimental curve obtained by cycling the cell. It also better fit the pulsating trend of the real voltage curve compared to the model based on the application of electrochemical impedance spectroscopy.
Despite the complexity associated with unconventional charge/discharge curves, which Li-V2O5 cell exhibit, showing two plateaus associated with the different phase transitions experienced by the cathode material, the systematic methodology proposed allows for accurately reproducing this dynamic electrochemical behavior. It was, thus, demonstrated that the galvanostatic intermittent titration technique allows for finding the electrical model of a cell quickly and reliably, even when it presents complex dynamic behavior. This is contrary to the impedance spectroscopy technique, which requires a longer analysis time, since it makes it necessary to fit each impedance spectrum to an equivalent electrical circuit in the frequency domain in order to obtain similar results when compared to the SoC-dependent Thevenin electrical model parameterized by the GITT.
Further work is ongoing in order to extrapolate the proposed methodology to more complex systems based on new electrode materials for solid-state batteries, including those based on the electrochemistry of sodium, paving the way for the next generation of all-solid-state post-lithium batteries [49,50,51].

Supplementary Materials

The following supporting information can be downloaded at: https://www.mdpi.com/article/10.3390/batteries10060172/s1, Figure S1: Electrochemical performance of the cell at different C-rates: (A) galvanostatic charge/discharge curves experimentally obtained and (B) polarization voltage difference vs C-rate; Figure S2: Voltage curve obtained when discharging the cell with the galvanostatic intermittent titration technique; Figures S3–S13: Impedance measurements from 0% to 100% of SoC, respectively, and fitting by the equivalent electrical circuit in the frequency domain: Nyquist plot of the complex impedance (left) and Bode plot of the modulus and phase of the impedance (right); Figure S14: Schematic of the procedure followed to estimate the elements of the equivalent electrical circuit by using the conventional and the SoC-dependent Thevenin models; and Figure S15: Comparison of pulse voltage discharge curve and absolute error between Thevenin models using the GITT and the EIS technique to model the VL2020 cell.

Author Contributions

Conceptualization and methodology, J.N.-B., C.M.-C. and A.V.; software, J.N.-B.; validation, J.N.-B.; formal analysis, J.N.-B.; investigation, J.N.-B., C.M.-C. and A.V.; resources, J.N.-B., C.M.-C. and A.V.; data curation, J.N.-B., C.M.-C. and A.V.; writing—original draft preparation, J.N.-B.; writing—review and editing, C.M.-C. and A.V.; visualization, J.N.-B., C.M.-C. and A.V.; supervision, C.M.-C. and A.V.; project administration, C.M.-C. and A.V.; funding acquisition, C.M.-C. and A.V. All authors have read and agreed to the published version of the manuscript.

Funding

The authors would like to thank the Agencia Española de Investigación/Fondo Europeo de Desarrollo Regional (FEDER/UE) MCIN/AEI/10.13039/501100011033 (projects PID2019–106662RBC43 and PID2022-140373OB-I00). This work has also been supported by the regional government of Madrid through two projects: DROMADER-CM (Y2020/NMT6584) and the multiannual agreement with UC3M (“Fostering Young Doctors Research”), CIRENAICA-CM-UC3M.

Data Availability Statement

Most of the outcomes of the computations are already given in the manuscript and Supporting Information with appropriate reports. In case of any special data, the authors can be contacted.

Conflicts of Interest

The authors declare no conflicts of interest. The funders had no role in the design of the study; in the collection, analyses, or interpretation of data; in the writing of the manuscript; or in the decision to publish the results.

References

  1. Islam, S.M.; Nayar, C.V.; Abu-Siada, A.; Hasan, M.M. Power Electronics for Renewable Energy Sources. In Power Electronics Handbook; Elsevier: Amsterdam, The Netherlands, 2018; pp. 783–827. [Google Scholar]
  2. Schipper, F.; Aurbach, D. A Brief Review: Past, Present and Future of Lithium Ion Batteries 1. Russ. J. Electrochem. 2016, 52, 1229–1258. [Google Scholar] [CrossRef]
  3. Wild, M.; O’Neill, L.; Zhang, T.; Purkayastha, R.; Minton, G.; Marinescu, M.; Offer, G.J. Lithium Sulfur Batteries, a Mechanistic Review. Energy Environ. Sci. 2015, 8, 3477–3494. [Google Scholar] [CrossRef]
  4. Skundin, A.M.; Kulova, T.L.; Yaroslavtsev, A.B. Sodium-Ion Batteries (a Review). Russ. J. Electrochem. 2018, 54, 131–174. [Google Scholar] [CrossRef]
  5. Yue, Y.; Liang, H. Micro- and Nano-Structured Vanadium Pentoxide (V2O5) for Electrodes of Lithium-Ion Batteries. Adv. Energy Mater. 2017, 7, 1–32. [Google Scholar] [CrossRef]
  6. Zhao, B.; Nisula, M.; Dhara, A.; Henderick, L.; Mattelaer, F.; Dendooven, J.; Detavernier, C. Atomic Layer Deposition of Indium-Tin-Oxide as Multifunctional Coatings on V2O5 Thin-Film Model Electrode for Lithium-Ion Batteries. Adv. Mater. Interfaces 2020, 7, 2001022. [Google Scholar] [CrossRef]
  7. Saha, A.K.; Gupta, P.S.; Rahaman, H. Doped Vanadium Oxides as Host Materials for Lithium Intercalation. J. Electrochem. Soc. 2023, 98, 1355. [Google Scholar]
  8. Ahmed, R.; El Sayed, M.; Arasaratnam, I.; Tjong, J.; Habibi, S. Reduced-Order Electrochemical Model Parameters Identification and SOC Estimation for Healthy and Aged Li-Ion Batteries Part I: Parameterization Model Development for Healthy Batteries. IEEE J. Emerg. Sel. Top. Power Electron. 2014, 2, 659–677. [Google Scholar] [CrossRef]
  9. Lehtola, T.A.; Zahedi, A. Electric Vehicle Battery Cell Cycle Aging in Vehicle to Grid Operations: A Review. IEEE J. Emerg. Sel. Top. Power Electron. 2021, 9, 423–437. [Google Scholar] [CrossRef]
  10. Nitesh, K.A.; Ravichandra. A Study on Battery Controller Design for the Estimation of State of Charge (SoC) in Battery Management System for Electric Vehicle (EV)/Hybrid EV (HEV). SN Comput. Sci. 2021, 2, 197. [Google Scholar] [CrossRef]
  11. Boulmrharj, S.; Ouladsine, R.; NaitMalek, Y.; Bakhouya, M.; Zine-dine, K.; Khaidar, M.; Siniti, M. Online Battery State-of-Charge Estimation Methods in Micro-Grid Systems. J. Energy Storage 2020, 30, 101518. [Google Scholar] [CrossRef]
  12. Degla, A.; Chikh, M.; Mahrane, A.; Hadj Arab, A. Improved Lithium-Ion Battery Model for Photovoltaic Applications Based on Comparative Analysis and Experimental Tests. Int. J. Energy Res. 2022, 46, 10965–10988. [Google Scholar] [CrossRef]
  13. Aydin, A.Ö.; Zajonz, F.; Günther, T.; Dermenci, K.B.; Berecibar, M.; Urrutia, L. Lithium-Ion Battery Manufacturing: Industrial View on Processing Challenges, Possible Solutions and Recent Advances. Batteries 2023, 9, 555. [Google Scholar] [CrossRef]
  14. Guo, Z.; Qiu, X.; Hou, G.; Liaw, B.Y.; Zhang, C. State of Health Estimation for Lithium Ion Batteries Based on Charging Curves. J. Power Sources 2014, 249, 457–462. [Google Scholar] [CrossRef]
  15. Silva, D.; Multiscale Modelling, C.; Zaghib, K.; Song, S.-W.; Ali, M.A.; Da Silva, C.M.; Amon, C.H. Multiscale Modelling Methodologies of Lithium-Ion Battery Aging: A Review of Most Recent Developments. Batteries 2023, 9, 434. [Google Scholar] [CrossRef]
  16. Cocciantelli, J.M.; Ménétrier, M.; Delmas, C.; Doumerc, J.P.; Pouchard, M.; Broussely, M.; Labat, J. On the δ → γ Irreversible Transformation in Li//V2O5 Secondary Batteries. Solid State Ion. 1995, 78, 143–150. [Google Scholar] [CrossRef]
  17. Zhou, L.; Lai, X.; Li, B.; Yao, Y.; Yuan, M.; Weng, J.; Zheng, Y. State Estimation Models of Lithium-Ion Batteries for Battery Management System: Status, Challenges, and Future Trends. Batteries 2023, 9, 131. [Google Scholar] [CrossRef]
  18. Li, F.; Zuo, W.; Zhou, K.; Li, Q.; Huang, Y.; Zhang, G. State-of-Charge Estimation of Lithium-Ion Battery Based on Second Order Resistor-Capacitance Circuit-PSO-TCN Model. Energy 2024, 289, 130025. [Google Scholar] [CrossRef]
  19. Yang, Y.; Zhao, L.; Yu, Q.; Liu, S.; Zhou, G.; Shen, W. State of Charge Estimation for Lithium-Ion Batteries Based on Cross-Domain Transfer Learning with Feedback Mechanism. J. Energy Storage 2023, 70, 108037. [Google Scholar] [CrossRef]
  20. Tian, N.; Wang, Y.; Chen, J.; Fang, H. One-Shot Parameter Identification of the Thevenin’s Model for Batteries: Methods and Validation. J. Energy Storage 2020, 29, 101282. [Google Scholar] [CrossRef]
  21. Wang, C.; Xu, M.; Zhang, Q.; Feng, J.; Jiang, R.; Wei, Y.; Liu, Y. Parameters Identification of Thevenin Model for Lithium-Ion Batteries Using Self-Adaptive Particle Swarm Optimization Differential Evolution Algorithm to Estimate State of Charge. J. Energy Storage 2021, 44, 103244. [Google Scholar] [CrossRef]
  22. Stroe, D.I.; Swierczynski, M.; Stan, A.I.; Knap, V.; Teodorescu, R.; Andreasen, S.J. Diagnosis of Lithium-Ion Batteries State-of-Health Based on Electrochemical Impedance Spectroscopy Technique. In Proceedings of the 2014 IEEE Energy Conversion Congress and Exposition, ECCE 2014, Pittsburgh, PA, USA, 14–18 September 2014; pp. 4576–4582. [Google Scholar] [CrossRef]
  23. Schröer, P.; Khoshbakht, E.; Nemeth, T.; Kuipers, M.; Zappen, H.; Sauer, D.U. Adaptive Modeling in the Frequency and Time Domain of High-Power Lithium Titanate Oxide Cells in Battery Management Systems. J. Energy Storage 2020, 32, 101966. [Google Scholar] [CrossRef]
  24. Westerhoff, U.; Kroker, T.; Kurbach, K.; Kurrat, M. Electrochemical Impedance Spectroscopy Based Estimation of the State of Charge of Lithium-Ion Batteries. J. Energy Storage 2016, 8, 244–256. [Google Scholar] [CrossRef]
  25. Li, M.; Wang, L.; Wang, Y.; Chen, X.; Chen, Z. A Framework for States Co-Estimation of Hybrid Energy Storage Systems Based on Fractional-Order Theory. IEEE J. Emerg. Sel. Top. Power Electron. 2023, 11, 224–233. [Google Scholar] [CrossRef]
  26. Zhang, L.; Zhang, J.; Gao, T.; Lyu, L.; Wang, L.; Shi, W.; Jiang, L.; Cai, G. Improved LSTM Based State of Health Estimation Using Random Segments of the Charging Curves for Lithium-Ion Batteries. J. Energy Storage 2023, 74, 109370. [Google Scholar] [CrossRef]
  27. Tremblay, O.; Dessaint, L.A. Experimental Validation of a Battery Dynamic Model for EV Applications. World Electr. Veh. J. 2009, 2, 930–939. [Google Scholar] [CrossRef]
  28. Hussein, A.A.H.; Batarseh, I. An Overview of Generic Battery Models. In Proceedings of the 2011 IEEE Power and Energy Society General Meeting, Detroit, MI, USA, 24–28 July 2011; pp. 1–6. [Google Scholar] [CrossRef]
  29. Ng, K.S.; Moo, C.S.; Chen, Y.P.; Hsieh, Y.C. Enhanced Coulomb Counting Method for Estimating State-of-Charge and State-of-Health of Lithium-Ion Batteries. Appl. Energy 2009, 86, 1506–1511. [Google Scholar] [CrossRef]
  30. He, L.; Guo, D. An Improved Coulomb Counting Approach Based on Numerical Iteration for SOC Estimation with Real-Time Error Correction Ability. IEEE Access 2019, 7, 74274–74282. [Google Scholar] [CrossRef]
  31. Fathoni, G.; Widayat, S.A.; Topan, P.A.; Jalil, A.; Cahyadi, A.I.; Wahyunggoro, O. Comparison of State-of-Charge (SOC) Estimation Performance Based on Three Popular Methods: Coulomb Counting, Open Circuit Voltage, and Kalman Filter. In Proceedings of the 2017 2nd International Conference on Automation, Cognitive Science, Optics, Micro Electro—Mechanical System, and Information Technology (ICACOMIT), Jakarta, Indonesia, 23–24 October 2017; pp. 70–74. [Google Scholar] [CrossRef]
  32. Ahmed, R.; Gazzarri, J.; Onori, S.; Habibi, S.; Jackey, R.; Rzemien, K.; Tjong, J.; Lesage, J. Model-Based Parameter Identification of Healthy and Aged Li-Ion Batteries for Electric Vehicle Applications. SAE Int. J. Altern. Powertrains 2015, 4, 233–247. [Google Scholar] [CrossRef]
  33. Guo, D.; He, L. A Novel Algorithm for SOC Using Simple Iteration and Coulomb Counting Method. In Proceedings of the 2018 IEEE Student Conference on Electric Machines and Systems, Huzhou, China, 14–16 December 2019. [Google Scholar] [CrossRef]
  34. Santiago, H.; Miniguano, M. Modelado e Identificación de Baterías de Ion-Litio y Supercondensadores Para. Su Aplicación al Vehículo Eléctrico. 2019. Available online: https://hdl.handle.net/10016/31517 (accessed on 1 May 2024).
  35. Miniguano, H.; Barrado, A.; Lazaro, A.; Zumel, P.; Fernandez, C. General Parameter Identification Procedure and Comparative Study of Li-Ion Battery Models. IEEE Trans. Veh. Technol. 2020, 69, 235–245. [Google Scholar] [CrossRef]
  36. Miniguano, H.; Raga, C.; Barrado, A.; Lazaro, A.; Zumel, P.; Olias, E. A Comparative Study and Parameterization of Electrical Battery Models Applied to Hybrid Electric Vehicles. In Proceedings of the 2016 International Conference on Electrical Systems for Aircraft, Railway, Ship Propulsion and Road Vehicles & International Transportation Electrification Conference (ESARS-ITEC), Toulouse, France, 2–4 November 2016; pp. 1–6. [Google Scholar]
  37. Patricia, S.; Solís, C. Modelado y Caracterización Funcional En Régimen Dinámico de Sistemas Electroquímicos de Almacenamiento de Energía: Aplicación a Supercondensadores y Baterías de Iones de Litio; Universidad Carlos III de Madrid: Madrid, Spain, 2014. [Google Scholar]
  38. Deleebeeck, L.; Veltzé, S. Electrochemical Impedance Spectroscopy Study of Commercial Li-Ion Phosphate Batteries: A Metrology Perspective. Int. J. Energy Res. 2020, 44, 7158–7182. [Google Scholar] [CrossRef]
  39. Abe, Y.; Hori, N.; Kumagai, S. Electrochemical Impedance Spectroscopy on the Performance Degradation of LiFePO4/Graphite Lithium-Ion Battery Due to Charge-Discharge Cycling under Different C-Rates. Energies 2019, 12, 4507. [Google Scholar] [CrossRef]
  40. Chang, B.Y. Conversion of a Constant Phase Element to an Equivalent Capacitor. J. Electrochem. Sci. Technol. 2020, 11, 318–321. [Google Scholar] [CrossRef]
  41. Wang, C.; Appleby, A.J.; Little, F.E. Low-Temperature Characterization of Lithium-Ion Carbon Anodes via Microperturbation Measurement. J. Electrochem. Soc. 2002, 149, A754. [Google Scholar] [CrossRef]
  42. Lantelme, F.; Mantoux, A.; Groult, H.; Lincot, D. Electrochemical Study of Phase Transition Processes in Lithium Insertion in V2O5 Electrodes. J. Electrochem. Soc. 2003, 150, A1202. [Google Scholar] [CrossRef]
  43. Wang, G.; Cui, X.; Yang, Z.; Liu, J.; Shi, X.; Zhang, Y.; Zhao, Z.; Wang, J.; Song, J.; Wang, X.; et al. Quasi-Solid-State All-V2O5 Battery. Small 2023, 2304786. [Google Scholar] [CrossRef] [PubMed]
  44. Xi, Z.; Wang, R.; Fu, Y.; Mi, C. Accurate and Reliable State of Charge Estimation of Lithium Ion Batteries Using Time-Delayed Recurrent Neural Networks through the Identification of Overexcited Neurons. Appl. Energy 2022, 305, 117962. [Google Scholar] [CrossRef]
  45. Karimi, D.; Behi, H.; Van Mierlo, J.; Berecibar, M. Equivalent Circuit Model for High-Power Lithium-Ion Batteries under High Current Rates, Wide Temperature Range, and Various State of Charges. Batteries 2023, 9, 101. [Google Scholar] [CrossRef]
  46. Suti, A.; Di Rito, G.; Mattei, G. Development and Experimental Validation of Novel Thevenin-Based Hysteretic Models for Li-Po Battery Packs Employed in Fixed-Wing UAVs. Energies 2022, 15, 9249. [Google Scholar] [CrossRef]
  47. Agarwal, V.; Uthaichana, K.; Decarlo, R.A.; Tsoukalas, L.H. Development and Validation of a Battery Model Useful for Discharging and Charging Power Control and Lifetime Estimation. IEEE Trans. Energy Convers. 2010, 25, 821–835. [Google Scholar] [CrossRef]
  48. Energy Storage Research and Development 2013 Progress Report, Sections 4–6|Department of Energy. Available online: https://www.energy.gov/eere/vehicles/articles/energy-storage-research-and-development-2013-progress-report-sections-4-6 (accessed on 6 November 2023).
  49. Martínez-Cisneros, C.S.; Pandit, B.; Antonelli, C.; Sanchez, J.Y.; Levenfeld, B.; Varez, A. Development of Sodium Hybrid Quasi-Solid Electrolytes Based on Porous NASICON and Ionic Liquids. J. Eur. Ceram. Soc. 2021, 41, 7723–7733. [Google Scholar] [CrossRef]
  50. Naranjo-Balseca, J.M.; Martínez-Cisneros, C.S.; Pandit, B.; Várez, A. High Performance NASICON Ceramic Electrolytes Produced by Tape-Casting and Low Temperature Hot-Pressing: Towards Sustainable All-Solid-State Sodium Batteries Operating at Room Temperature. J. Eur. Ceram. Soc. 2023, 43, 4826–4836. [Google Scholar] [CrossRef]
  51. Pandit, B.; Johansen, M.; Andersen, B.P.; Martínez-Cisneros, C.S.; Levenfeld, B.; Ravnsbæk, D.B.; Varez, A. All-Solid-State Sodium-Ion Batteries Operating at Room Temperature Based on NASICON-Type NaTi2(PO4)3 Cathode and Ceramic NASICON Solid Electrolyte: A Complete in Situ Synchrotron X-ray Study. Chem. Eng. J. 2023, 472, 144509. [Google Scholar] [CrossRef]
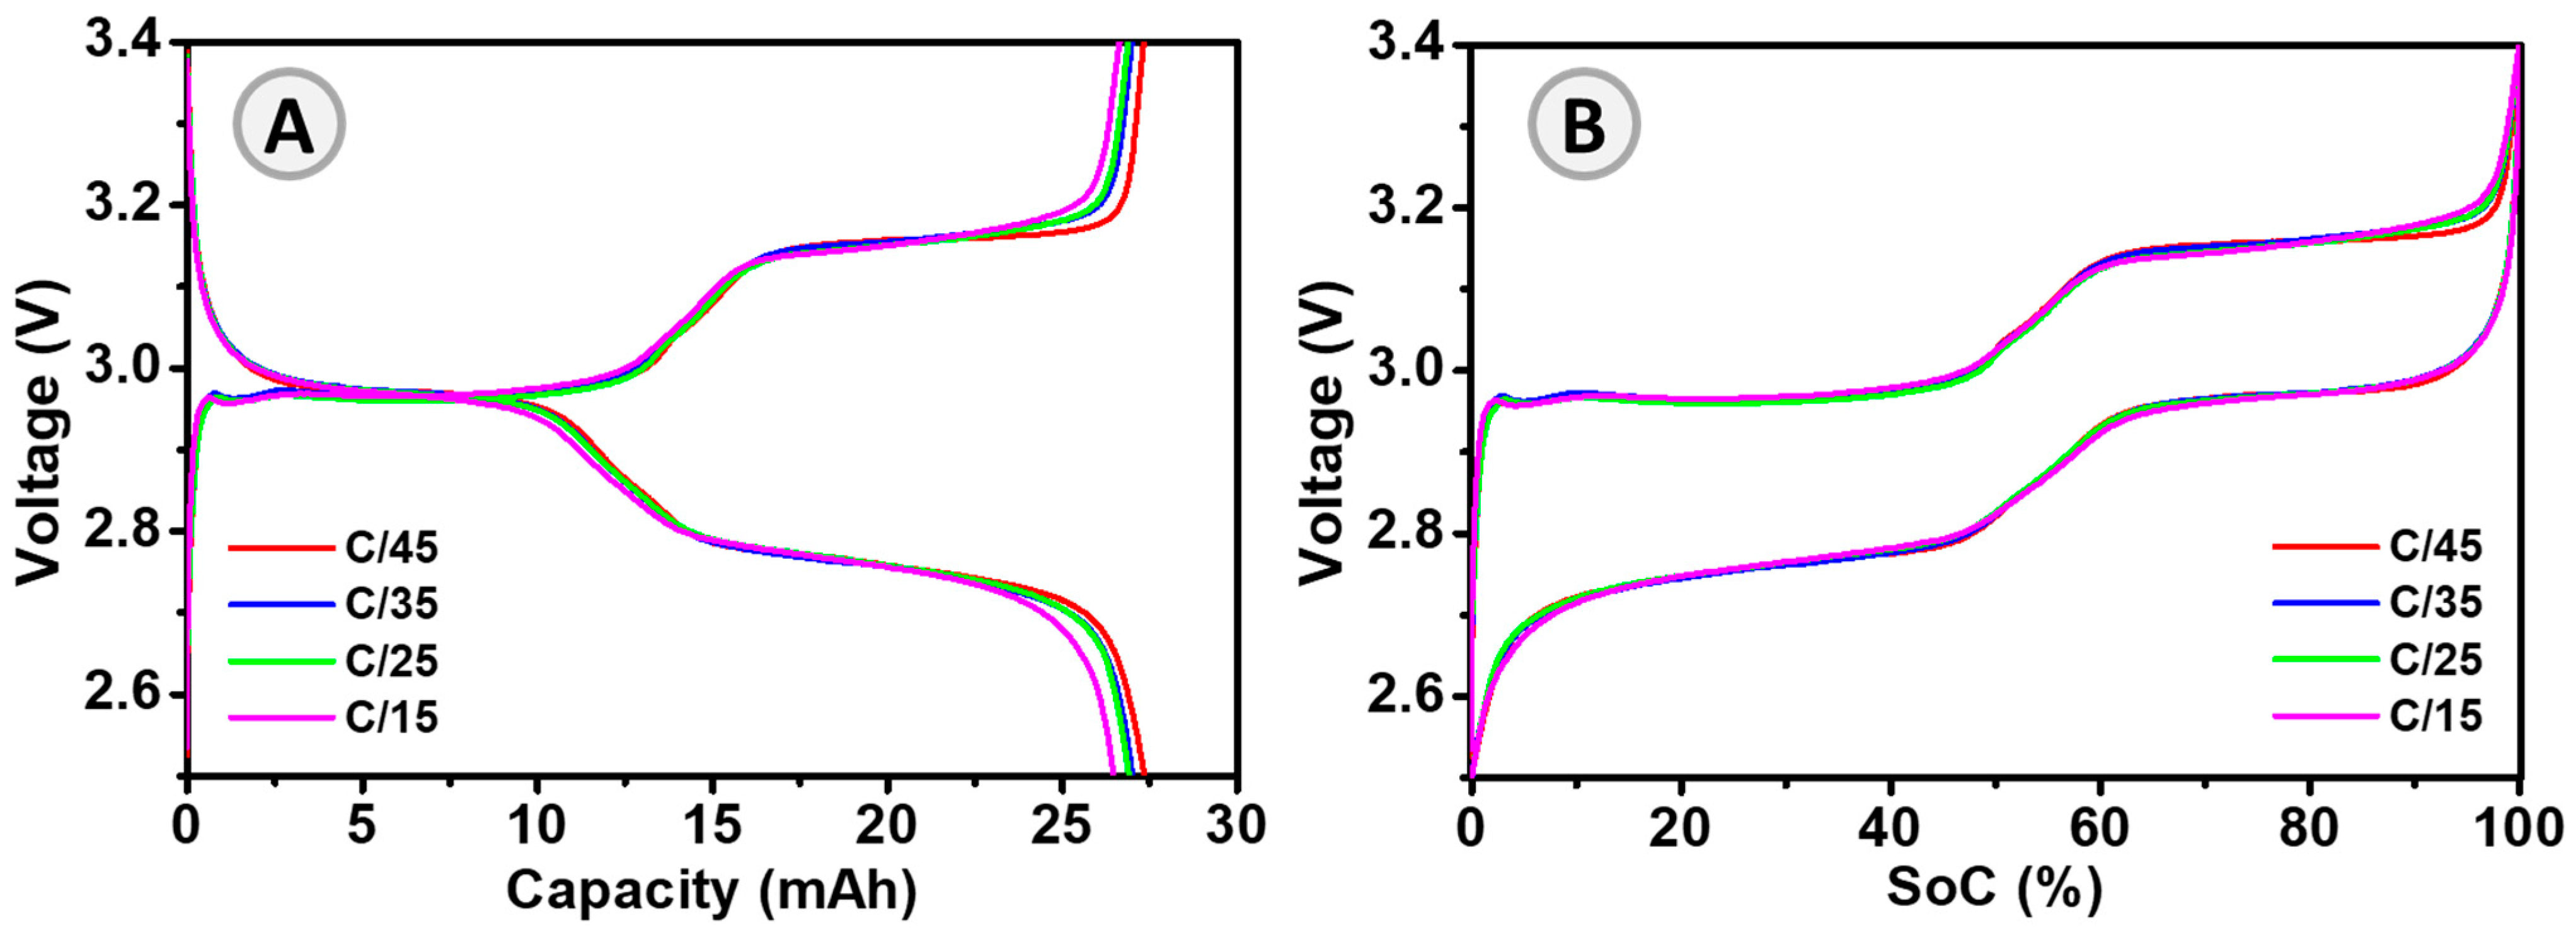
Figure 1. Electrochemical performance of the cell at different C-rates: (A) galvanostatic charge/discharge curves experimentally obtained and (B) state of charge (SoC) at different C-rates estimated from experimental data after applying Equation (1).
Batteries 10 00172 g001
Figure 2. Electrical circuit of the third-order Thevenin model: (A) conventional model and (B) SoC-dependent model.
Batteries 10 00172 g002
Figure 3. Voltage, current, and state of charge curves obtained when applying the GITT to the studied cell.
Batteries 10 00172 g003
Figure 4. Nyquist diagram of the impedance measurements made over the full range of SoCs and equivalent electrical circuits used for modeling in the frequency domain.
Batteries 10 00172 g004
Figure 5. Comparison of pulsed voltage discharge curves obtained by cycling the Li-battery and simulating Thevenin models applying the galvanostatic intermittent titration technique (A,B) and electrochemical impedance spectroscopy (C,D).
Batteries 10 00172 g005
Table 1. VL2020 coin cell technical specifications.
ParameterValue
Nominal Capacity20~22.5 mAh
Nominal Voltage3 V
Open Circuit Voltage (OCV)2.95 V to 3.55 V
Maximum Voltage3.4 V ± 0.15 V
Cut-off Voltage2.5 V
Current Charge to 3 VMaximum 1.5 mA (C/13)
Table 2. Estimated values of the equivalent electrical circuit elements of the conventional and SoC-dependent Thevenin models with GITT.
ParametersConventionalSoC-Dependent Model
0%10%20%30%40%50%60%70%80%90%100%
Ri (Ω)4.24.24.24.24.24.24.24.24.24.04.14.1
R1 (Ω)
C1 (mF)
2.12.32.32.31.52.22.12.31.81.71.81.9
0.20.0470.0520.0460.0730.0450.2860.0460.0700.4480.4270.103
R2 (kΩ)
C2 (mF)
33.30.0270.0280.0270.0330.0300.2500.0670.0670.1050.2540.346
0.20.3460.2540.1050.0670.0670.2550.0300.0330.0270.0280.027
R3 (kΩ)
C3 (mF)
62.20.0750.0720.0690.0860.0900.0860.0700.0530.0510.0560.098
12.813.113.914.49.810.111.113.017.316.116.810.0
Table 3. Estimated values of the equivalent electrical circuit elements of the conventional and SoC-dependent Thevenin models with EIS.
ParametersConventionalSoC-Dependent Model
0%10%20%30%40%50%60%70%80%90%100%
Ri (Ω)4.04.03.94.14.24.24.24.13.93.93.83.9
R1 (Ω)
C1 (mF)
2.21.82.52.52.52.52.52.42.12.11.71.4
13.411.612.997.712.912.912.916.715.515.513.912.5
R2 (kΩ)
C2 (mF)
70.4806278106100928361514219
0.30.30.30.30.30.30.30.30.20.30.30.3
R3 (kΩ)
C3 (mF)
158.582.08065954850745555164492
38.80.313.30.10.30.30.412.458.658.6258.224.3
Disclaimer/Publisher’s Note: The statements, opinions and data contained in all publications are solely those of the individual author(s) and contributor(s) and not of MDPI and/or the editor(s). MDPI and/or the editor(s) disclaim responsibility for any injury to people or property resulting from any ideas, methods, instructions or products referred to in the content.