Article

Characterization of Lithium-Ion Battery Fire Emissions—Part 2: Particle Size Distributions and Emission Factors

by
Matthew Claassen
1,2,
Bjoern Bingham
1,3,
Judith C. Chow
1,
John G. Watson
1,
Pengbo Chu
4,
Yan Wang
2 and
Xiaoliang Wang
1,*
1
Division of Atmospheric Sciences, Desert Research Institute, Reno, NV 89512, USA
2
Department of Mechanical Engineering, University of Nevada, Reno, NV 89557, USA
3
Atmospheric Sciences, Department of Physics, University of Nevada, Reno, NV 89557, USA
4
Department of Mining and Metallurgical Engineering, University of Nevada, Reno, NV 89557, USA
*
Author to whom correspondence should be addressed.
Batteries 2024, 10(10), 366; https://doi.org/10.3390/batteries10100366
Submission received: 24 August 2024 / Revised: 17 September 2024 / Accepted: 15 October 2024 / Published: 16 October 2024
(This article belongs to the Special Issue Thermal Safety of Lithium Ion Batteries)

Abstract

:
The lithium-ion battery (LIB) thermal runaway (TR) emits a wide size range of particles with diverse chemical compositions. When inhaled, these particles can cause serious adverse health effects. This study measured the size distributions of particles with diameters less than 10 µm released throughout the TR-driven combustion of cylindrical lithium iron phosphate (LFP) and pouch-style lithium cobalt oxide (LCO) LIB cells. The chemical composition of fine particles (PM2.5) and some acidic gases were also characterized from filter samples. The emission factors of particle number and mass as well as chemical components were calculated. Particle number concentrations were dominated by those smaller than 500 nm with geometric number mean diameters below 130 nm. Mass concentrations were also dominated by smaller particles, with PM1 particles making up 81–95% of the measured PM10 mass. A significant amount of organic and elemental carbon, phosphate, and fluoride was released as PM2.5 constituents. The emission factor of gaseous hydrogen fluoride was 10–81 mg/Wh, posing the most immediate danger to human health. The tested LFP cells had higher emission factors of particles and HF than the LCO cells.

Graphical Abstract

1. Introduction

Lithium-ion batteries (LIB) can generate significant gaseous and particulate emissions when they experience thermal failure, through venting, thermal runaway (TR), fire, and explosion [1,2]. The detailed characterization of particle size distribution (PSD), chemical composition, emission factor, temporal evolution, and thermal stability is important for LIB safety, including understanding the health effects of inhaled smoke particles, proper personal protection, the mechanisms of fire origination and propagation, fire detection and suppression, post-fire cleanup, and material recycling. For example, recent studies of soot particles from LIB fires show higher toxicity to human cells than wood smoke [3,4]. However, as shown in a recent review [2], few studies have examined particle emissions from LIB fires.
Size distribution is an important parameter that describes the transport behavior, atmospheric residence time, and inhalation risk of particles. LIB TR generates a wide range of particle sizes, varying from several nanometers to several millimeters. Most previous studies have focused on larger particles that settled in the combustion chamber after experiments. Zhang et al. [5] collected particles after burning a nickel manganese cobalt (NMC) LIB cell and separated them by sieving into four size fractions. The mass percentages were 44% for 0–0.85 mm, 36% for 0.85–1.70 mm, 9% for 1.70–2.00 mm, and 11% for 2.00–8.00 mm. Laser diffraction particle sizing showed that the volume distribution had a median diameter of 198 µm for the 0–0.85 mm size fraction. Several other studies focusing on larger particles also showed volume distribution median diameters >100 µm [6,7,8]. Due to their high temperature and large thermal mass, the larger sparking particles may contribute to igniting flammable gases and TR propagation [9]. As they dominate the emitted particle mass, the chemical composition of these larger particles provides useful information about particle origin and TR reactions [5,8,10]. When released into the environment, they may cause air, water, and soil contamination [11,12,13]. However, these particles represent a low inhalation risk to humans as their large size causes them to settle quickly by gravity and makes them unlikely to be inhaled while suspended in air [14].
Particles with aerodynamic diameters less than 10 µm (PM10), 2.5 µm (PM2.5), and even smaller (e.g., ultrafine particles with diameters <100 nm [PM0.1]) can remain suspended in air for longer than larger particles. When inhaled, they will deposit at different locations in the human respiratory track depending on the particle size, causing respiratory, cardiovascular, and other diseases [15]. Very few studies have measured PM10 size distributions from LIB fires. Premnath et al. [16] used an Engine Exhaust Particle Sizer (EEPS) [17,18] to measure particle number concentrations in the size range of 5.6–560 nm in real time from lithium iron phosphate (LFP) and NMC cells undergoing TR. The geometric number mean diameters (GNMD) of the PSDs [19] ranged from 54 to 69 nm with either monomodal or bimodal distributions. The emission rate varied from 1.6 × 10¹⁵ to 2.1 × 10¹⁷ particles/hour, 5–6 orders of magnitude higher than modern heavy-duty diesel engines. While the tests evaluated the effects of the TR triggering mechanism (nail penetration vs. overcharging) and LIB chemistry (LFP vs. NMC), the number of tests were small, and the influence of the cell’s state of charge (SOC) was not examined. Goupil et al. [20] measured PSDs from an NMC cell fire using a scanning mobility particle sizer (SMPS; 17.5–532.8 nm) and an optical particle spectrometer (250 nm–32 µm). The number distributions were bimodal, with one peak below 50 nm and one centered around 125 nm, while the mass distribution had a peak around 10 µm. The slow SMPS scan time (76 s) may cause inaccuracy in the PSD, and the conversion from optical to aerodynamic diameter is affected by the particle’s optical properties, morphology, and density [21,22]. Several other studies have estimated PSDs from image analysis [2,11]. However, this method is prone to multiple artifacts, such as particle loss during collection and sample preparation, a compromise between field of view and size resolution, and potential overlaps between particles [23].
Emission factors (EFs) are commonly used in air quality management to estimate pollutant emissions based on emission activities [24]. Because the total emission amount depends on LIB SOCs and the number of LIBs burned, the proper activity metric for estimating LIB fire emissions is the total energy capacity of the LIB cells burned [25]. Therefore, the particle number EFs are expressed in particles/Wh (watt–hours), and the size-segregated PM mass and PM2.5 constituent EFs are expressed in mg/Wh. EFs in these units are easier to use for estimating the total emissions than the emission rates in particles/hour reported by Premnath et al. [16]. To our knowledge, no studies have reported EFs of LIB fire particle chemical constituents.
In companion with the particle chemical characteristics presented by Claassen et al. [26], the objectives of this paper are to: (1) characterize the size distribution of particles in the diameter range of 6 nm–10 µm; (2) quantify the EFs of particle number, particle mass, and PM2.5 constituents emitted from LIB combustion; and (3) evaluate the dependence of PSDs and EFs on cell type and SOC.

2. Materials and Methods

The experiments and data analysis have been described in the companion paper [26] and only a brief description is provided here. Two commonly used LIB types were tested: a cylindrical, 18650-style, LFP cell and a pouch-style lithium cobalt oxide (LCO) cell [27,28]. Each cell type was tested at five SOC levels with three to six tests per SOC. The cells used for these tests were purchased shortly before the experimental campaign and were received at proper storage voltages. It was found that the LFP cells only vented at 0% and 30% SOCs, flamed at 50% and 75% SOCs, and had either venting or flaming at 100% SOCs. In contrast, LCO tests flamed at all SOCs [26]. While these two cell types will be referred to by their cell chemistry (LFP vs. LCO), they also differ in form-factor and casing, both of which can affect emissions. However, this study did not attempt to isolate the effects of these factors. The LIB combustion tests were conducted inside an ~8 m3 burn chamber [29]. The exhaust flow rate (Q) was set to ~3300 L/min, as determined by thermal anemometer measurements in the exhaust duct [30]. Before each test, the chosen LIB cell was charged to the desired SOC by a programable charger. The cell was then placed in a ceramic crucible and heated to failure by an electric hot plate. A type K thermocouple was used to measure external cell and flame temperatures.
A sample of LIB combustion emissions was extracted from the chamber exhaust vent and directed to a suite of particle analyzers and the filter sampling system. Real-time particle mass concentrations were measured by two DustTrak DRX (TSI Inc., Shoreview, MN, USA) aerosol monitors in five size fractions (i.e., PM1, PM2.5, PM4, PM10, and PM15) [21,22]. The DustTraks were placed before and after sample line dilution to determine the dilution factors.
Finer resolution PSDs in the range of 6 nm–10 µm were measured every second by an electrical low-pressure impactor (ELPI+; Dekati Ltd., Kangasala, Finland) [31,32,33,34] which was placed on a diluted sample line to prevent impactor overloading. In an ELPI+, particles are first introduced into a unipolar diffusion charger to achieve a stable charge distribution, and then are collected on 13 stages of electrically conducting cascade impactors and a final filter, depending on their aerodynamic diameters. The electrical charges carried by the deposited particles are measured as current by sensitive electrometers. An inversion algorithm is used to convert the 14-channel electric current data to particle number distributions with up to 500 bins. In this study, the particle number distributions were converted to mass distributions by assuming spherical particle shape and a density of 1 g/cm3. The high-resolution data were integrated over the size fractions of <0.1 µm (PM0.1), 0.1–1 µm (PM0.1–1), 1–2.5 µm (PM1–2.5), and 2.5–10 µm (PM2.5–10). There are multiple potential artifacts (e.g., deposition of smaller particles at upper stages, size-dependent particle density, and image current) that could lead to errors in the mass concentration calculation [35]. Therefore, the ELPI PM2.5 mass was normalized by gravimetric PM2.5 mass to account for these artifacts.
Two filter channels were used to collect PM2.5 and acidic gases for analysis of mass by gravimetry, ions and acidic gases by ion chromatography (IC), organic and elemental carbon (OC and EC) by thermal/optical analysis, and elements by x-ray fluorescence (XRF) and inductively coupled plasma mass spectrometry (ICP-MS) [24,36]. The backup potassium hydroxide (KOH)-impregnated cellulose-fiber filters behind the Teflon-membrane front filters were analyzed for acidic gases, including hydrogen fluoride (HF), hydrochloric acid (HCl), nitric acid (HNO3), and sulfuric acid (H2SO4) as their corresponding ions (i.e., F, Cl, NO3, and SO42−) by IC [37,38].
Emission factors (EFi in particles/Wh for particle number and mg/Wh for mass) were calculated for each species i by Equation (1):
E F i = C i × Q × t / E
where Ci (in particles/m3 for number and mg/m3 for mass) is the mean stack concentration for species i, Q (in m3/s) is the mean stack exhaust flow rate, Δt (in s) is the sampling duration, and E (in Wh) is the nominal LIB cell energy capacity.

3. Results

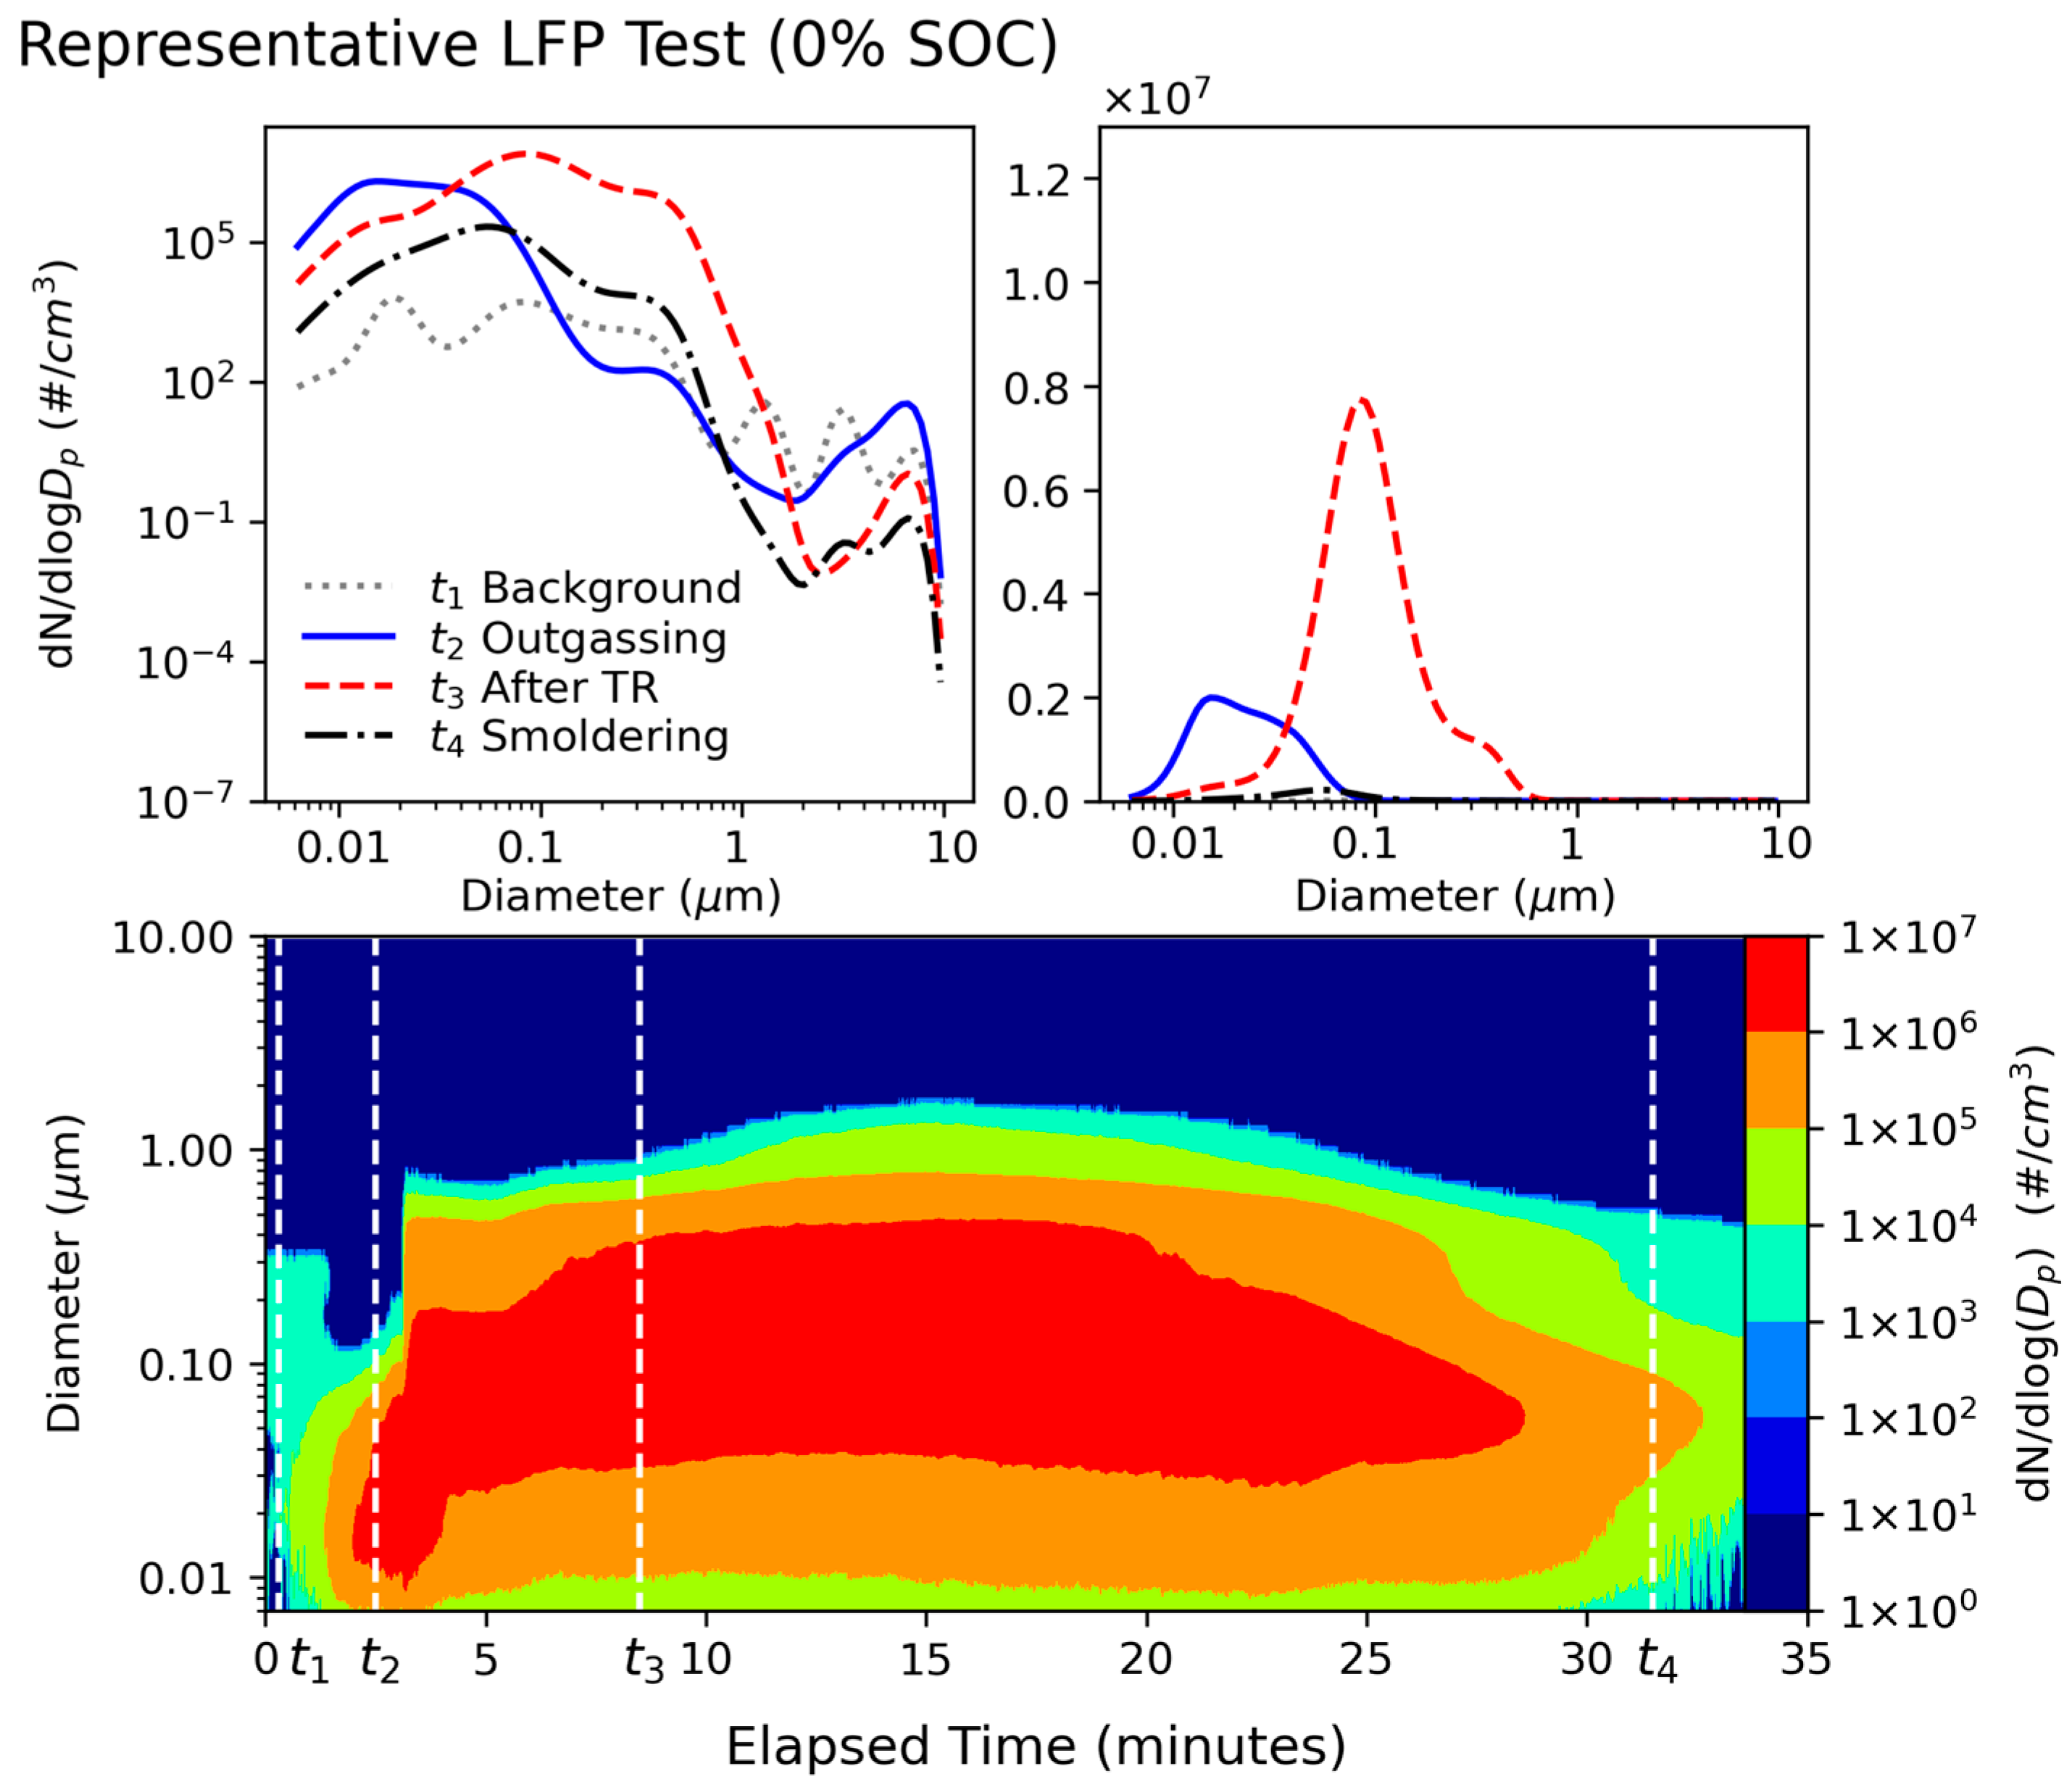
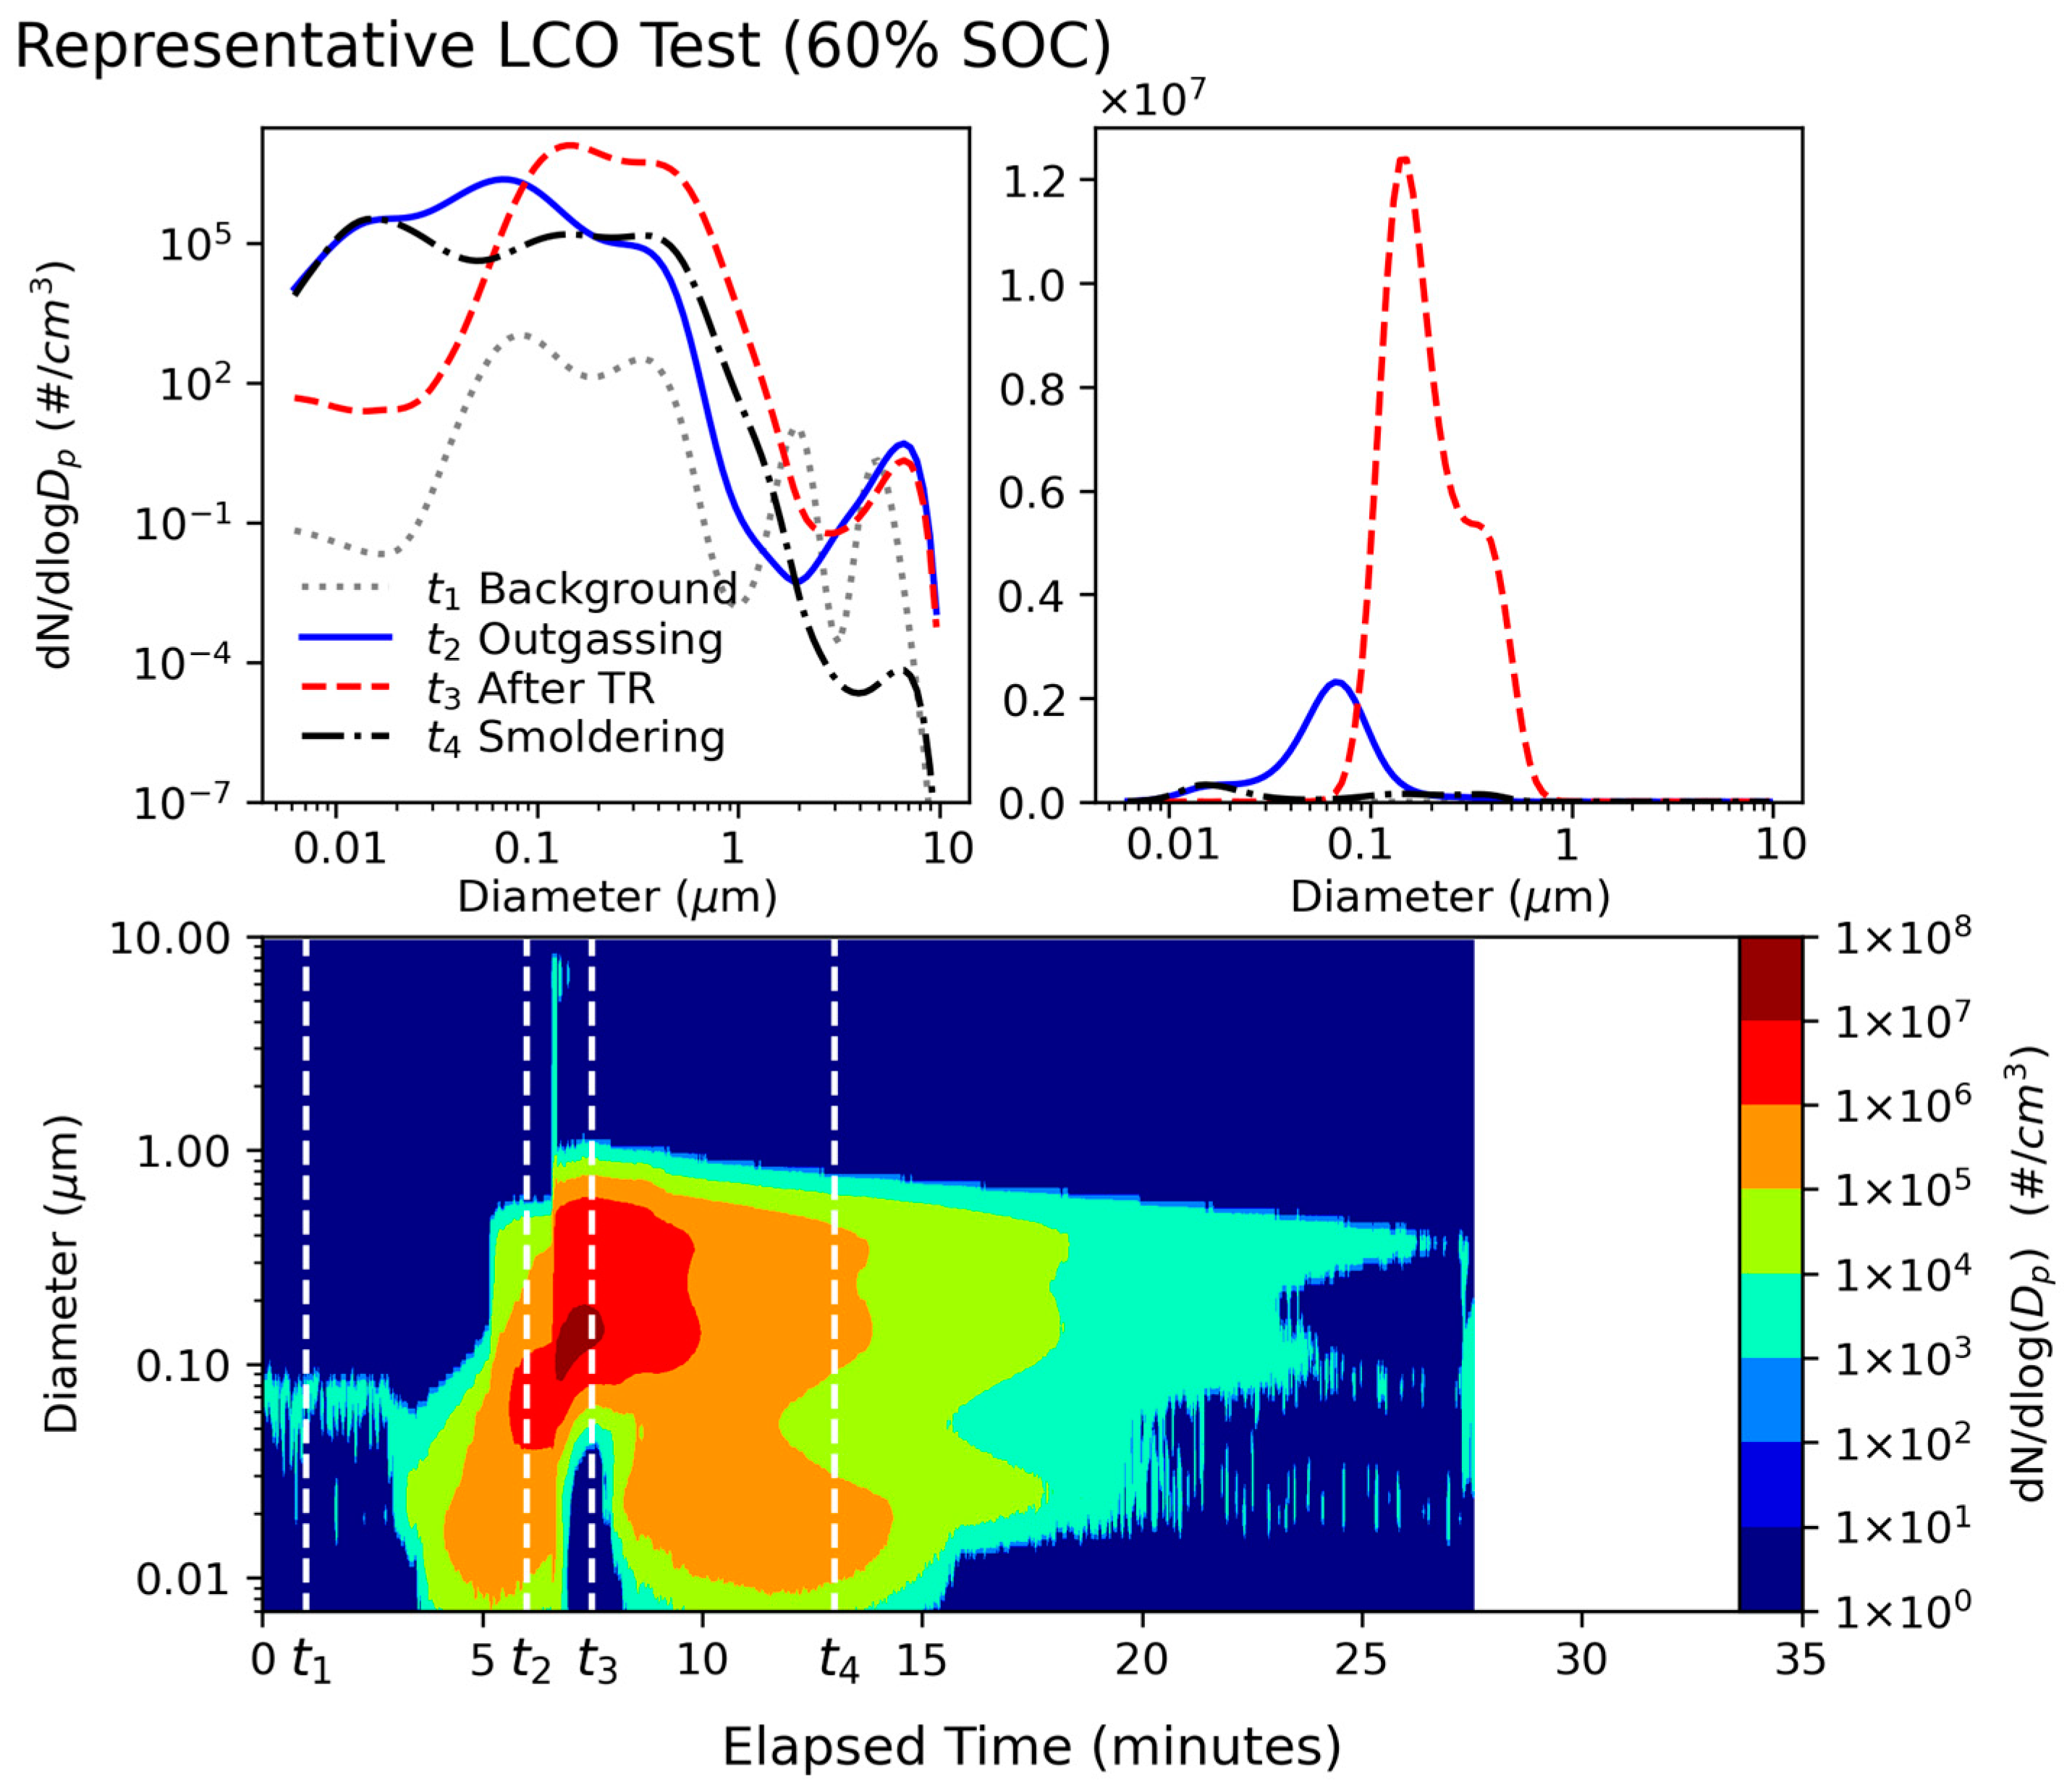
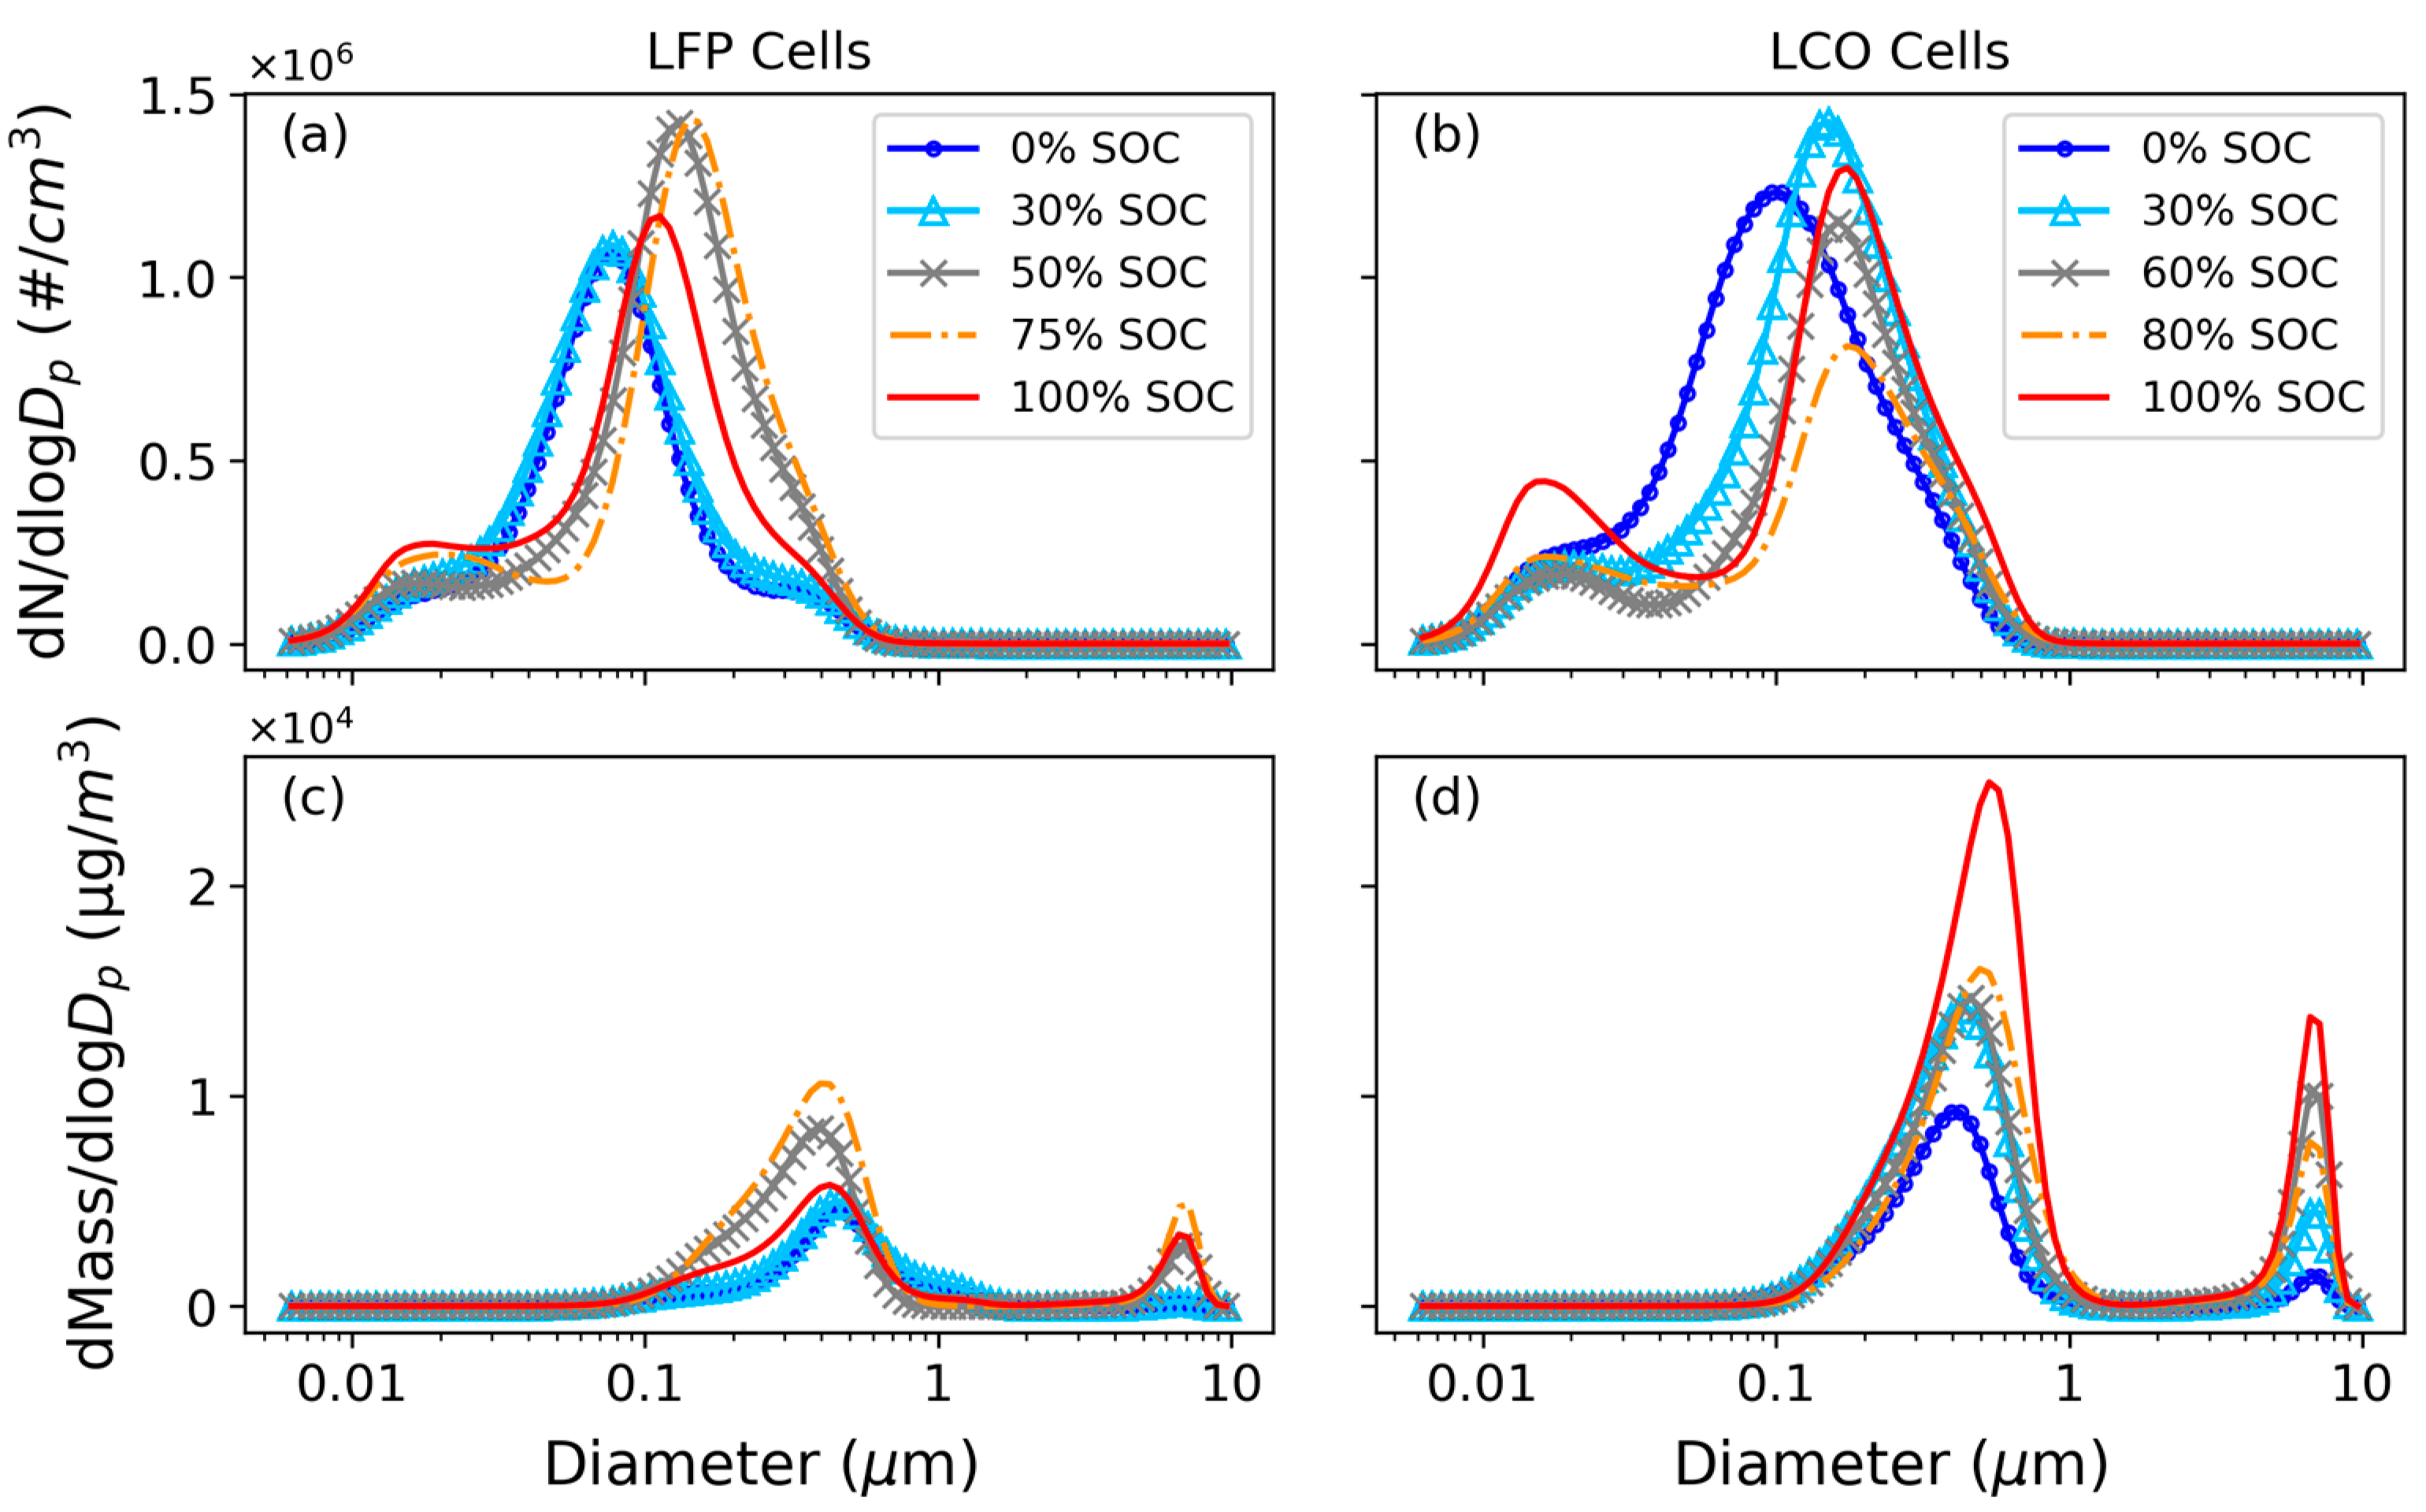
3.1. Particle Size Distributions

Figure 1 shows the heat maps of PSD evolution for the representative tests for each cell type and SOC. The y-axis represents particle aerodynamic diameter (Dp), and the coloring represents particle number concentration normalized by the size bin width (dlog (Dp)). While most particles had diameters below 500 nm, significant variations in PSD evolution were seen. Low SOC (0 and 30%) LFP tests in this study, which had no flaming combustion, emitted high concentrations of particles over a wide size range, but concentrations never exceeded 107 particles/cm3. These emissions occurred for a long period of time, with maximum concentrations above 105 particles/cm3 for over 30 min for both low SOCs.
Particle emissions for other LFP SOCs and LCO tests reached peak concentrations above 107 particles/cm3, but concentrations above 105 particles/cm3 only lasted for 10–18 min. A PSD discontinuity is seen in Figure 1 for these tests, occurring between five and ten minutes of elapsed time and representing abrupt concentration increases and particle size changes. This event coincided with visual and temperature-based TR indicators, suggesting it was caused by the onset of TR. A short 5–10 s long emission of coarse particles (up to 10 µm) can be seen to occur simultaneously, likely corresponding to the ejection of spark particles. Maximum particle concentrations occurred just after TR began. This is where most of the particle mass was emitted as particle sizes peaked here as well, with a notable decrease in particles below 50 nm in diameter. After this, peak concentrations and particle sizes decreased gradually, often forming a bimodal pattern of nanoparticles (<100 nm) and larger particles between 100 nm and 1 μm.
Figure 2 and Figure 3 show individual PSD “snapshots” for a 0% SOC LFP test and a 60% SOC LCO test, each at four time intervals. The 0% SOC LFP test only vented, without flaming combustion, while the 60% LCO test flamed vigorously. A detailed discussion of the observed combustion behavior for all tests can be found in [26]. The intervals include background concentrations (t1), when the test cell is outgassing (t2), after TR (t3), and after combustion is complete and the test cell is smoldering (t4). These time intervals were selected to represent similar combustion stages despite the differences in combustion duration between tests. The GNMDs and geometric number standard deviations (GNSD) were calculated to characterize the PSD at each time interval [19].
The 0% SOC LFP “venting” test and the 60% SOC LCO “flaming” test had similar peak outgassing (t2) concentrations at ~2 × 10⁶ particles/cm3 but the particle diameters were smaller for the venting test, with a GNMD of 22 nm and a GNSD of 1.7. The flaming outgassing concentrations peaked at 59 nm with a GNSD of 1.9. While different cell types are compared here, the intent is to contrast the PSD differences due to the varied combustion behavior of the tests, not to infer differences due to the cell type itself. Concentrations after TR (t3) peaked at four and six times the outgassing concentration for the venting and flaming tests, respectively, with the flaming test PSD being generally larger-sized and narrower. GNMDs at this time were 91 nm and 195 nm for the venting and flaming tests, with GNSDs of 1.9 and 1.6, respectively.
Figure 4a,b show the evolution of PM1, PM2.5, and PM10 for the tests shown in Figure 2 and Figure 3, respectively. PM1 accounted for most of the emission mass. Large spikes of PM10 were observed at the onset of TR, corresponding to the emission of coarse particles (PM2.5–10), as was discussed for Figure 1. Interestingly, small spikes of coarse particles also occurred just before TR and before PM2.5 emissions began. This behavior may be useful for early TR detection by LIB pack monitoring systems. The venting test (Figure 4a) shows PM2.5 mass concentrations rising above PM1 starting when emissions peaked around 15 min of elapsed time and lasting until combustion ended. This behavior occurred for all venting-only tests (LFP tests with 0% and 30% SOCs as well as half of the 100% SOC tests [26]). For tests where flaming occurred, PM1 dominated PM mass emissions outside of TR onset.
Figure 5 shows the average number-based (a and b) and mass-based (c and d) PSDs for each SOC and cell type. The number distributions show a dominant mode centered around 70–140 nm, with additional modes centered around 20 nm and 300 nm. These distributions are similar to those reported by Goupil et al. [20]. For LFP tests, particles were smaller and were released in lower concentrations at low SOCs, increasing in size and concentration at mid-SOCs. Tests with 100% SOC fell in the middle due to having disparate combustion behavior. This is consistent with the combustion behavior of LFP tests: they only vented at 0% and 30% SOCs, intensely flamed at 50% and 75% SOCs, and had more variable combustion at 100% SOCs [26]. Particle sizes also increased with SOC for LCO tests, but there was no consistent dependence of concentrations on SOC, likely because flaming combustion was observed at all SOCs. The mass distributions show that LFP tests with 0% and 30% SOCs only have one mode centered around 460 nm, with elevated concentrations between 1 and 2.5 µm. All other tests had bimodal distributions, with one fine-particle mode centered around 400 nm and a coarse-particle mode centered around 8 µm. This indicates that the coarse particles were generated from flaming rather than cell venting. The coarse particle mode mass increased with SOC for both cell types, being insignificant for low SOC LFP tests. The fine particle mode mass also increased with SOC for LFP tests as the PSD shifted to larger particle sizes. A coarse mode centered around 10 µm was also observed by Goupil et al. [20].
Table 1 shows the GNMD and geometric mass mean diameters (GMMD) [19] for each cell type and SOC. The GNMD varied from 74 to 114 nm for LFP tests and 90 to 130 nm for LCO tests, showing that particles from LCO tests tended to be larger. GMMDs were larger than GNMDs due to mass being proportional to the cube of particle diameter. Interestingly, GNMDs peaked at mid-range SOCs while GMMDs increased with SOC, peaking at 100%. This increase at high SOCs, along with the previously discussed emission of large particles at TR, confirms that PM2.5–10 is generated by the energetic combustion and ejection of material that occurs in a highly charged LIB cell during TR. Premnath et al. [16] found that GNMD and GMMD ranges were 54–69 nm and 97–204 nm for LFP and NMC cells, respectively, at 100% SOCs. These diameters are smaller than those in Table 1, especially for GMMD, which is likely caused by the lower upper size limit of the EEPS (560 nm) [17,18] than the ELPI+ (10 µm).

3.2. Emission Factors (EFs)

EFs for particle number, mass, PM2.5 constituents, and acidic gases are listed in Tables S1–S5. The following sections describe EFs for particle numbers, mass, carbon, PO43−, selected metals and ions, and acidic gases, as well as the relationship between EF and combustion temperature.

3.2.1. EFs for Particle Number and Mass

Figure 6a shows particle number EFs by cell SOC for each size fraction. The EFs for ultrafine particles (PM0.1) ranged between 1.5 × 10¹³ and 3.6 × 10¹³ particles/Wh for LFP tests and 3.2 × 10¹² and 9.6 × 10¹² particles/Wh for LCO tests (Table S1). Total particle numbers decreased with SOC, and LFP tests released several times more particles than LCO tests. PM0.1 and PM0.1–1 together accounted for >99.9% of PM10 numbers, at 42–84% and 16–58% of PM10, respectively. Particles larger than 1 µm had negligible contributions to particle number. PM0.1 tended to make up a higher proportion of PM10 when particle emissions were high. On the other hand, Figure 6b shows PM0.1 made up a much smaller proportion of the PM10 mass due to having very small particle volumes, at 1–8%, while PM0.1–1 dominated the PM10 mass at 77–89% due to their high concentrations. PM1 particles made up 81–95% of the measured PM10 mass, as also shown in Figure 4. Larger particles made up significant portions of PM10 mass despite their low number concentrations, with PM1–2.5 and PM2.5–10 accounting for up to 4% and 18% of PM10 mass, respectively. PM1–2.5 EFs were high for low SOC LFP tests and venting-only 100% SOC LFP tests while all other tests had higher PM2.5–10 EFs instead.

3.2.2. EFs for PM2.5, OC, EC, PO43−, and Toxic Metals

EFs for PM2.5, OC, EC, and PO43− are shown in Figure 7a. EFs for PM2.5 mass were between 35 and 140 mg/Wh. This equates to the emission of 1.4–5.6 g of PM2.5 from the combustion of a standard laptop-sized LIB (40 Wh), or 2.1–8.4 kg of PM2.5 from the combustion of an electric vehicle battery pack (60 kWh) if all cells are burned in a similar way as those in this study.
LFP tests had PM2.5 EFs of 67–140 mg/Wh, with the least mass emitted at 50% SOC and increased variability at 100% SOC. OC EFs were 6–9 mg/Wh for 50–75% SOC and increased to 63–106 mg/Wh otherwise. OC variabilities at 100% SOC were similarly high to PM2.5. Low OC emissions at mid-range SOCs corresponded to high EC emissions for 75% SOC only, where EC EFs spiked from <5 mg/Wh for all other SOCs to 24 mg/Wh. This resulted in total carbon EFs dropping from 109 mg/Wh (0% SOC) to 12 mg/Wh (50% SOC), before increasing back to 68 mg/Wh (100% SOC). PO43− emissions were also significant for mid-range SOCs, at approximately 30 mg/Wh, but only 1–8 mg/Wh otherwise.
LCO tests had more consistent PM2.5 mass EFs of 35–45 mg/Wh, lower than LFP tests by 1.5–3.8 times. EFs for OC, EC, and PO43− had much less dependence on SOC for LCO tests than LFP tests. OC EFs were 3–24 mg/Wh and peaked at 75% SOC, where LFP OC was lowest. EC EFs were 7–16 mg/Wh, higher than those of LFP tests except for at 75%/80% SOC. PO43− EFs were 3–13 mg/Wh with a similar SOC dependance to EC.
Figure 7b shows EFs for four hazardous air pollutant metals [39] and Li. Variability within SOCs was high but several features are notable. LCO tests had Cd, Co, Pb, and Li emissions that increase with SOC, reaching (10 ± 1) × 10−5 mg/Wh for Cd, 0.07 ± 0.01 mg/Wh for Co, (10 ± 2) × 10−4 mg/Wh for Pb, and 0.7 ± 0.2 mg/Wh for Li, all at 100% SOC. All of these elements were near detection limits at low SOCs except for Cd. Only Pb was consistently present for LFP tests at between (30 ± 8) × 10−5 mg/Wh and (9 ± 3) × 10−4 mg/Wh, with no dependence on SOC. Hg and Cd were detected sporadically. EFs for major compositions and elements are summarized in Tables S2 and S5, respectively.

3.2.3. EFs for Anions and Acidic Gases

EFs for acidic gases HF, HCl, HNO3, and H2SO4 and their corresponding particulate anions are shown in Figure 8. These acidic gases are toxic and corrosive and can cause adverse effects on human health and material integrity if not neutralized after emission.
Gaseous EFs were higher than that of particulate emissions (by cell type) for all compounds shown except for NO3, where HNO3 emission was not detected. Gaseous HF and particulate F had the highest EFs for all LIB types and SOCs. Gaseous HF EFs ranged from 39 to 81 mg/Wh for LFP tests and 10 to 14 mg/Wh for LCO tests. Neither cell type showed a relationship between SOC and HF emissions. Particulate F EFs ranged from 0.4 to 3 mg/Wh for LFP tests and 0.3 to 1 mg/Wh for LCO tests. Particulate F had a distinct minimum at 50% SOC for LFP tests, corresponding to the minimum PM2.5 EF (Figure 7a). Gaseous H2SO4 was the second most emitted acidic compound, with much higher gaseous emissions than particulate. Gaseous EFs were 3–12 mg/Wh for LFP tests and 0.6–2 mg/Wh for LCO tests. Unlike gaseous H2SO4 and all other acidic emissions shown, particulate SO42− emissions were much higher for LCO tests than LFP tests, where only trace concentrations were detected. LCO tests had EFs of 0.1–0.4 mg/Wh for most SOCs, but only trace amounts for 60% SOC. Both gaseous and particulate emissions were low for 50/60% SOC, but this was more pronounced for LFP tests. Particle SO42− emissions for LCO tests increased with SOC with the exception of 60% SOC. Gaseous HCl was consistently detected, averaging 0.9 mg/Wh for LFP tests and 0.2 mg/Wh for LCO tests. Particulate Cl was present sporadically for both cell types with EFs of up to 0.4 mg/Wh. Only particulate NO3 was detected at between 0.005 and 0.04 mg/Wh, with higher emissions from LFP tests.
Table 2 compares the gaseous EFs of HF and HCl with the values reported in the literature. LFP HF emissions in this study (39–81 mg/Wh) compared well with the literature values which range at 12–350 mg/Wh. Emissions from LCO tests (10–14 mg/Wh) were lower than the 30–40 mg/Wh found in the literature, but this may be due to the limited number of studies [25,40]. Other cell types were reported to release a comparable 1–200 mg/Wh of HF. HCl emissions were reported by Diaz et al. [40] at 8–125 mg/Wh for LFP and LCO cells, significantly higher than those measured in this study (0.1–1.3 mg/Wh). No published EF values for HNO3 or H2SO4 were found. Acidic gas and particulate ion EFs for all cell types and SOCs are listed in Tables S3 and S4, respectively.

3.2.4. Relationship between Emission Factors and Combustion Temperatures

Figure 9 shows the relationship between the EF and the maximum measured combustion temperature for LFP tests. Cell SOC is also labeled by symbol coloring to show groupings. With the exception of two outlier tests (Tests C1 and C8 in Figure 9a,b), EFs for PM2.5 and OC were found to decrease with increasing combustion temperature. This is expected as higher temperatures indicate more complete combustion that will release more gaseous CO2 instead of carbonaceous particulate. In contrast, PO43− increased with combustion temperatures, indicating more efficient conversion of P-containing electrolyte and cathode materials to particle emissions. Low EC emissions were found at lower combustion temperatures as expected; however, EC was not necessarily higher at high temperatures. Figure 9c shows that the 50% SOC tests had temperatures >600 °C but the EC emissions were comparable to those of low temperature tests. Particulate F and gaseous HF (Figure 9e,h) had the opposite trend, with F decreasing (for SOCs > 30%) and HF increasing with increasing temperature. This is possibly due to more HF remaining in the gas phase at higher temperatures rather than condensing to form particles. Li+ emissions were hardly detected below 600 °C and increased rapidly thereafter, indicating a potential exponential relationship. More tests with temperatures reaching >700 °C are needed to explore this. Figure 9g shows that the part of PM2.5 mass with unidentified composition increased with temperature, a correlation that could help determine what additional components (e.g., unmeasured phosphorous compounds) [26] need to be analyzed for.

3.3. Cell Mass Losses

Each cell was weighed before and after combustion to determine the cell mass that was lost. LFP cells lost 2.2–2.4 g/Wh during combustion for all except 50% SOC, which lost noticeably less at 1.8–2 g/Wh. LCO cells lost roughly half the mass per Wh of cell capacity at 0.95–1.2 g/Wh. As shown in Table S6, this equates to a loss of ~20% of the cell mass for both cell types. However, only approximately 0.6–1.2% of the total cell mass, or 3–6% of the lost cell mass, was emitted as PM2.5 that reached the filter assemblies. The proportion of lost cell mass that was emitted as PM2.5 was highest for low SOC LFP tests, where 5–6% was converted to PM2.5. All other SOC groups averaged 3–4%. By subtraction, this means that 94–97% of the lost mass, or roughly 16–22% of total cell mass, was emitted as either settleable PM or as gas emissions. As shown in Table S6, cell mass losses from previous studies range from 15% to 60%, with settleable particle mass accounting for 5–50% of the original cell mass, depending on the cell chemistry, casing, and SOCs [5,6,10,47]. Even though PM2.5 only accounted for a small fraction of the total PM mass emitted from LIB fires, it accounts for most of the particle numbers that can be inhaled by humans and presents great health risks.

4. Discussion and Conclusions

This study conducted a detailed characterization of the size distribution of particles with diameter less than 10 µm emitted from LIB fires and determined EFs for size-segregated particle number, particle mass, and PM2.5 chemical constituents. The analysis covered two cell types at a range of SOCs. While emissions may vary significantly depending on the specific cell types or LIB pack sizes, the cells tested represent two common cell chemistries and form-factors, in terms of both cell construction and energy capacity, that are used widely in modern LIB applications. As such, the findings offer valuable insights into the characteristics of emission from LIB combustion. The key conclusions are as follows:
(1)
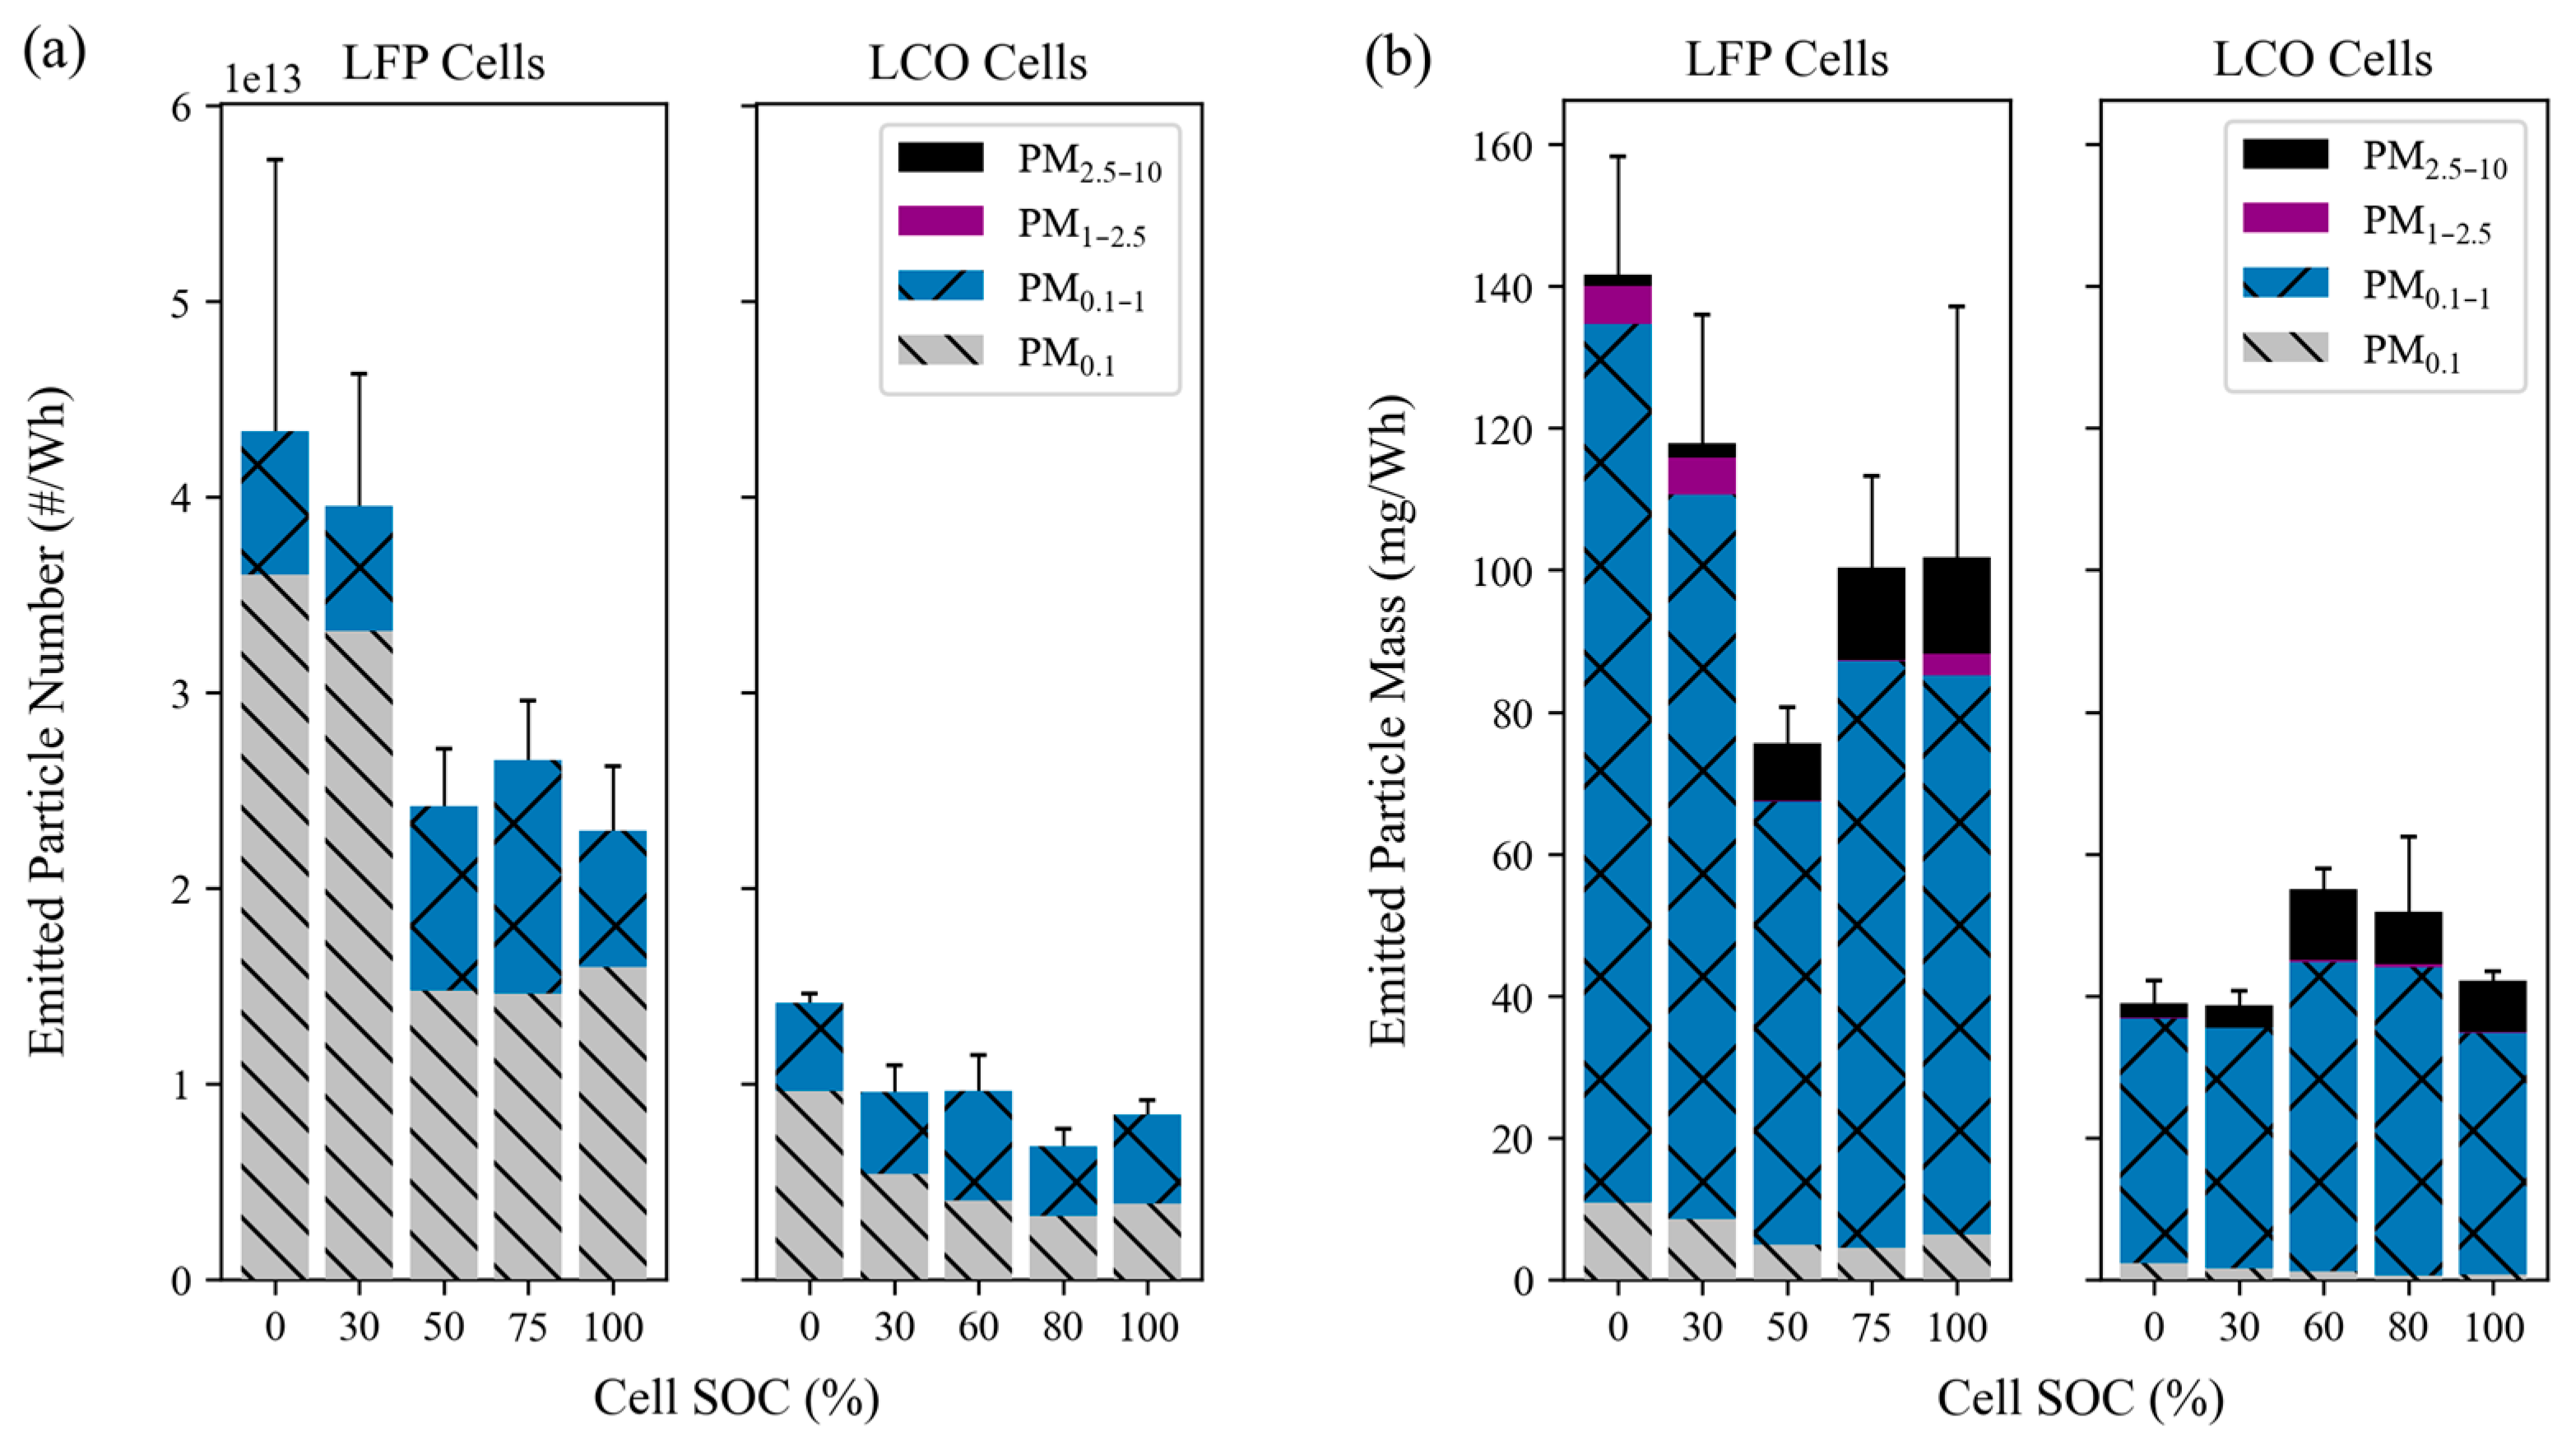
LIB fires emit high concentrations of fine and ultrafine particles. The particle number distributions showed a dominant mode centered around 100 nm, with additional modes centered around 20 nm and 300 nm. The particle mass distributions showed that the venting-only LFP tests in this study with 0% and 30% SOCs had one mode centered around 460 nm, while all other tests had bimodal distributions, with one fine particle mode centered around 400 nm and a coarse particle mode centered around 8 µm. PM0.1 and PM0.1–1 together accounted for >99.9% of PM10 numbers, while PM0.1–1 dominated the PM10 mass at 77–89%. Super-micron particles have non-negligible mass contributions, with PM1–2.5 and PM2.5–10 accounting for up to 4% and 18% of PM10 mass, respectively. PM1–2.5 was emitted during cell venting, after TR and when flaming did not occur, while PM2.5–10 was emitted just before and during TR onset for all tests.
(2)
Venting-only combustion (LFP tests at 0% SOC, 30% SOC, and some at 100% SOC) showed smooth evolution of PSDs, while the onset of TR caused a discontinuity in particle size distribution by increasing both mode diameter and concentration and releasing coarse mode particles (1–10 µm). Particles from LCO tests in this study (GNMD 90–130 nm; GMMD 387–673 nm) were generally larger than those from LFP tests (GNMD 74–114 nm; GMMD 415–568 nm). The GMMD increased with SOC.
(3)
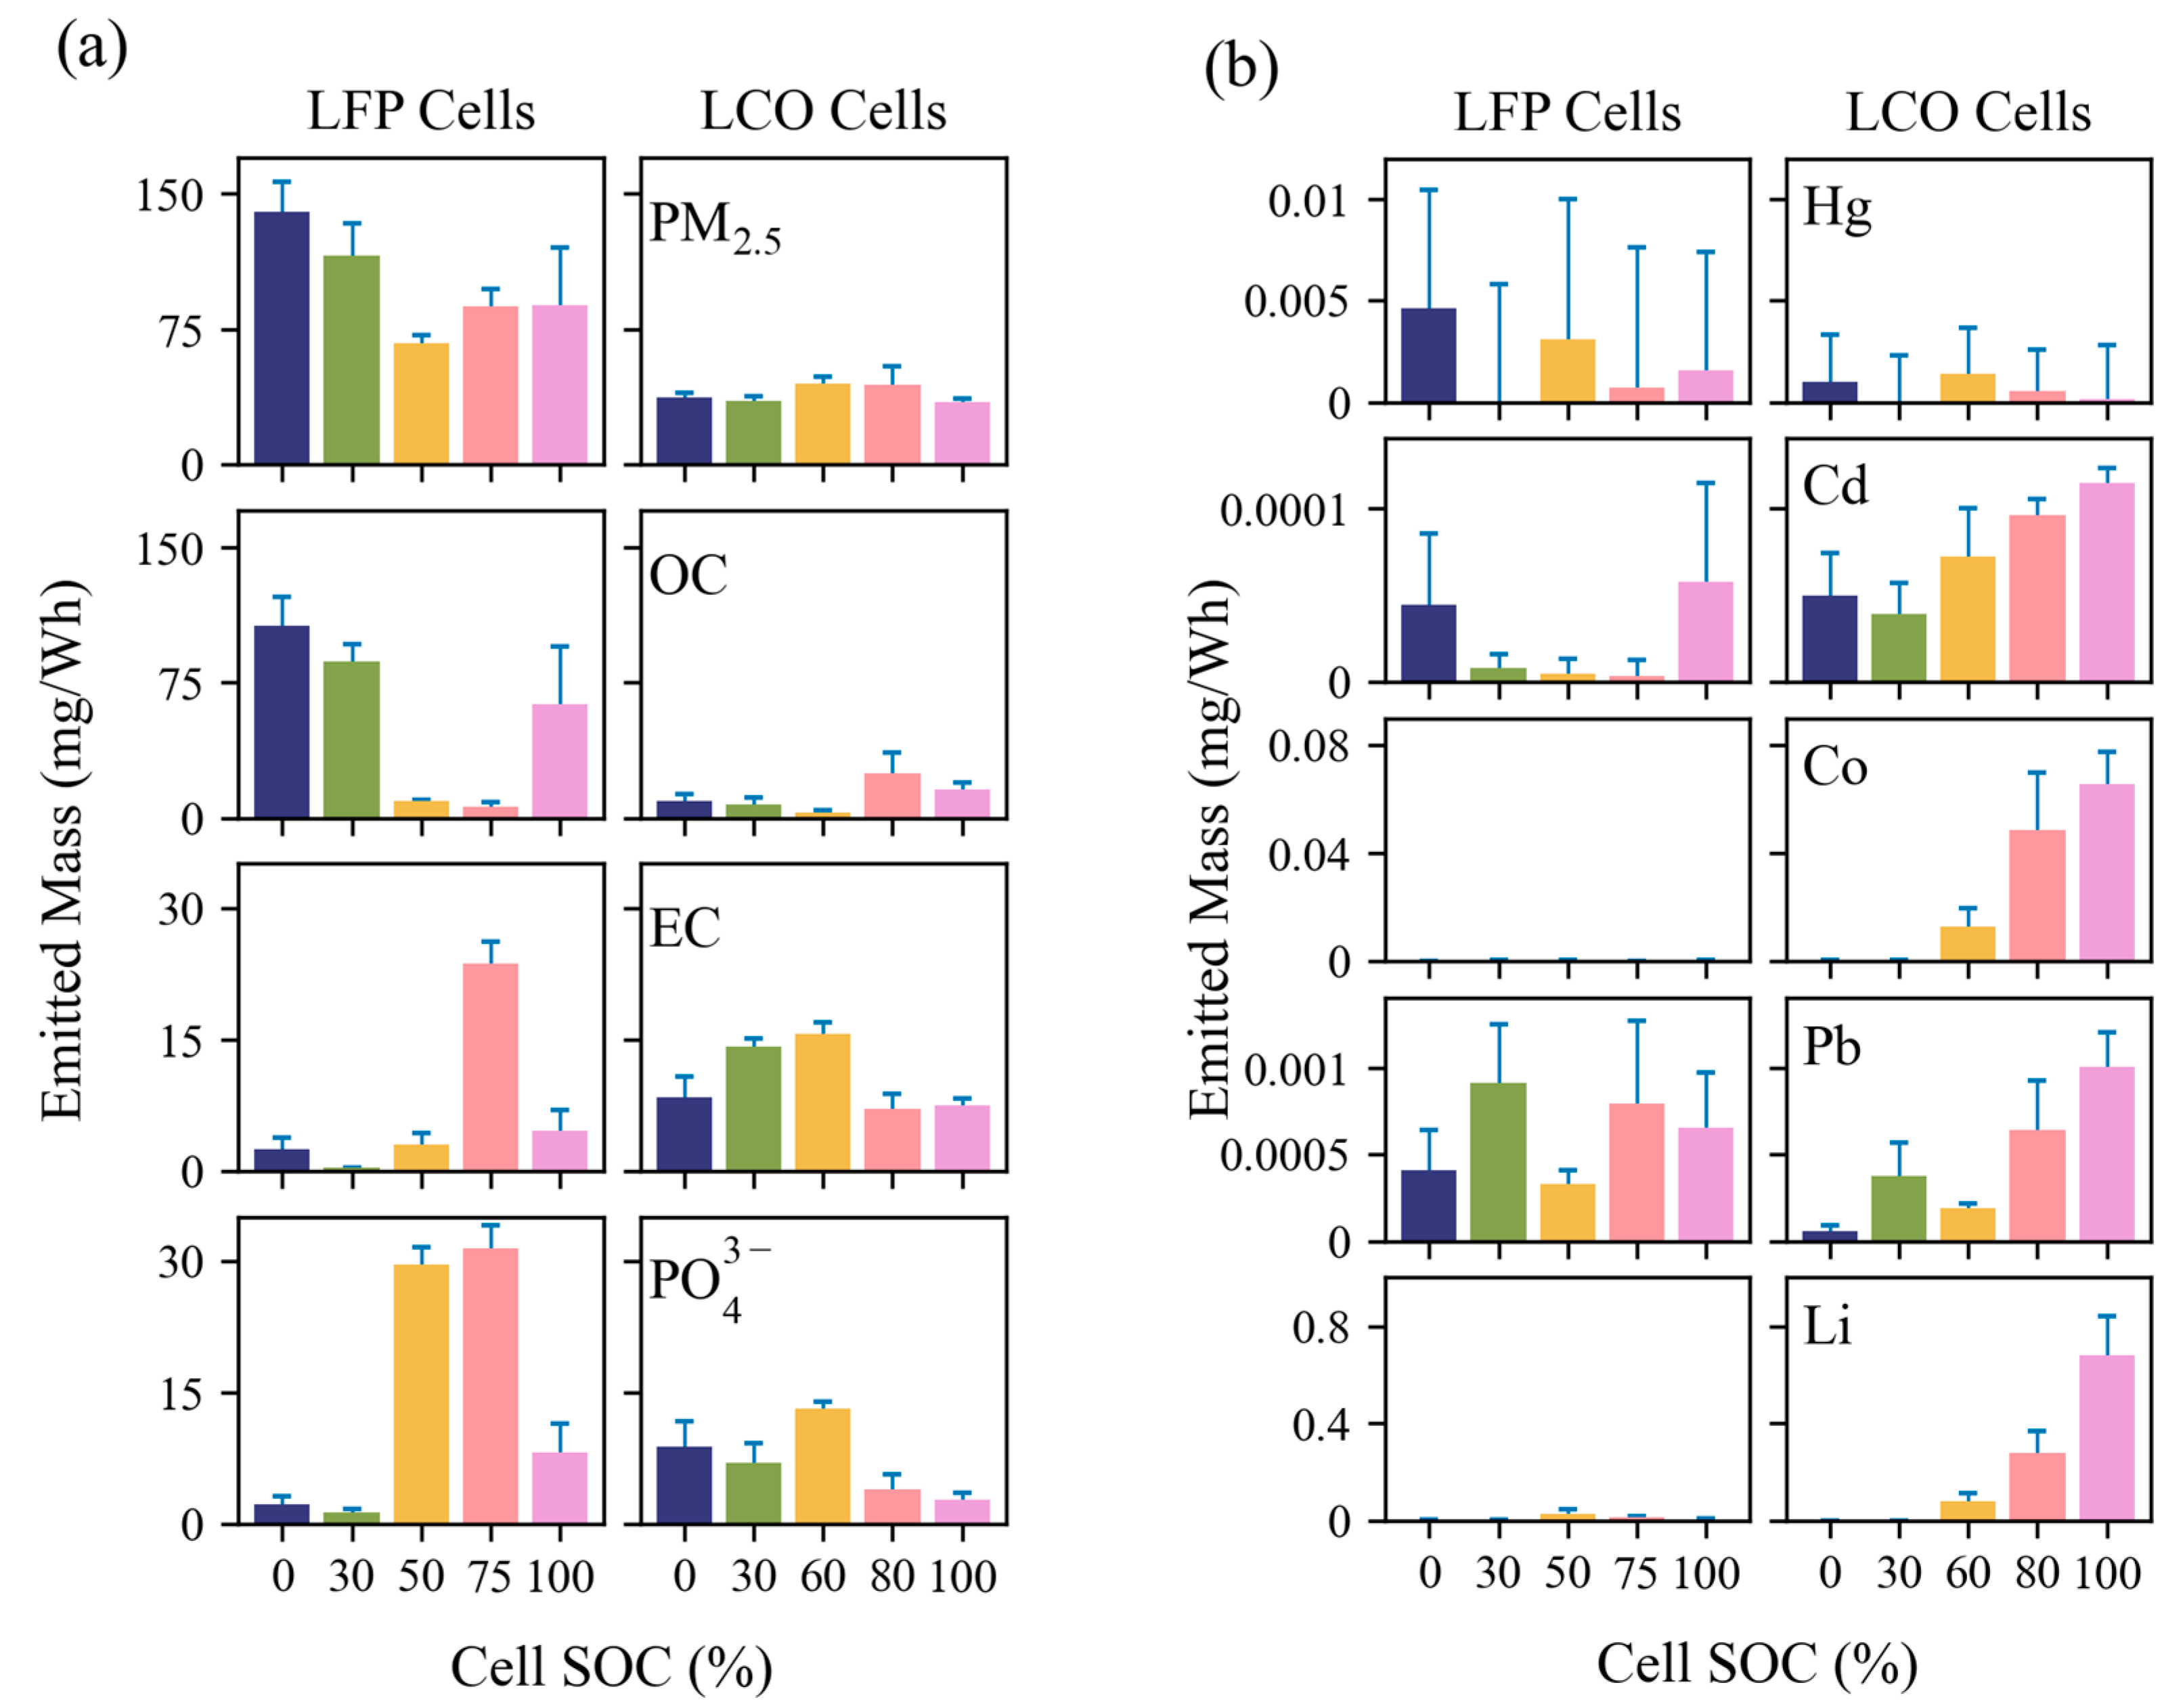
LFP tests had higher EFs for particle number and mass than LCO tests. The EFs for ultrafine particles (PM0.1) ranged from 1.5 × 10¹³ to 3.6 × 10¹³ particles/Wh for LFP and 3.2 × 10¹² to 9.6 × 10¹² particles/Wh for LCO tests. LFP tests had PM2.5 EFs between 67 and 140 mg/Wh with more variability at different SOCs, whereas LCO tests had lower and more consistent PM2.5 mass EFs between 35 and 45 mg/Wh. Even though PM2.5 only accounted for 0.25–1.5% of the total cell mass and a small fraction of total PM mass emitted from LIB fires, it accounts for the most particle numbers that can be inhaled by humans and presents great health risks.
(4)
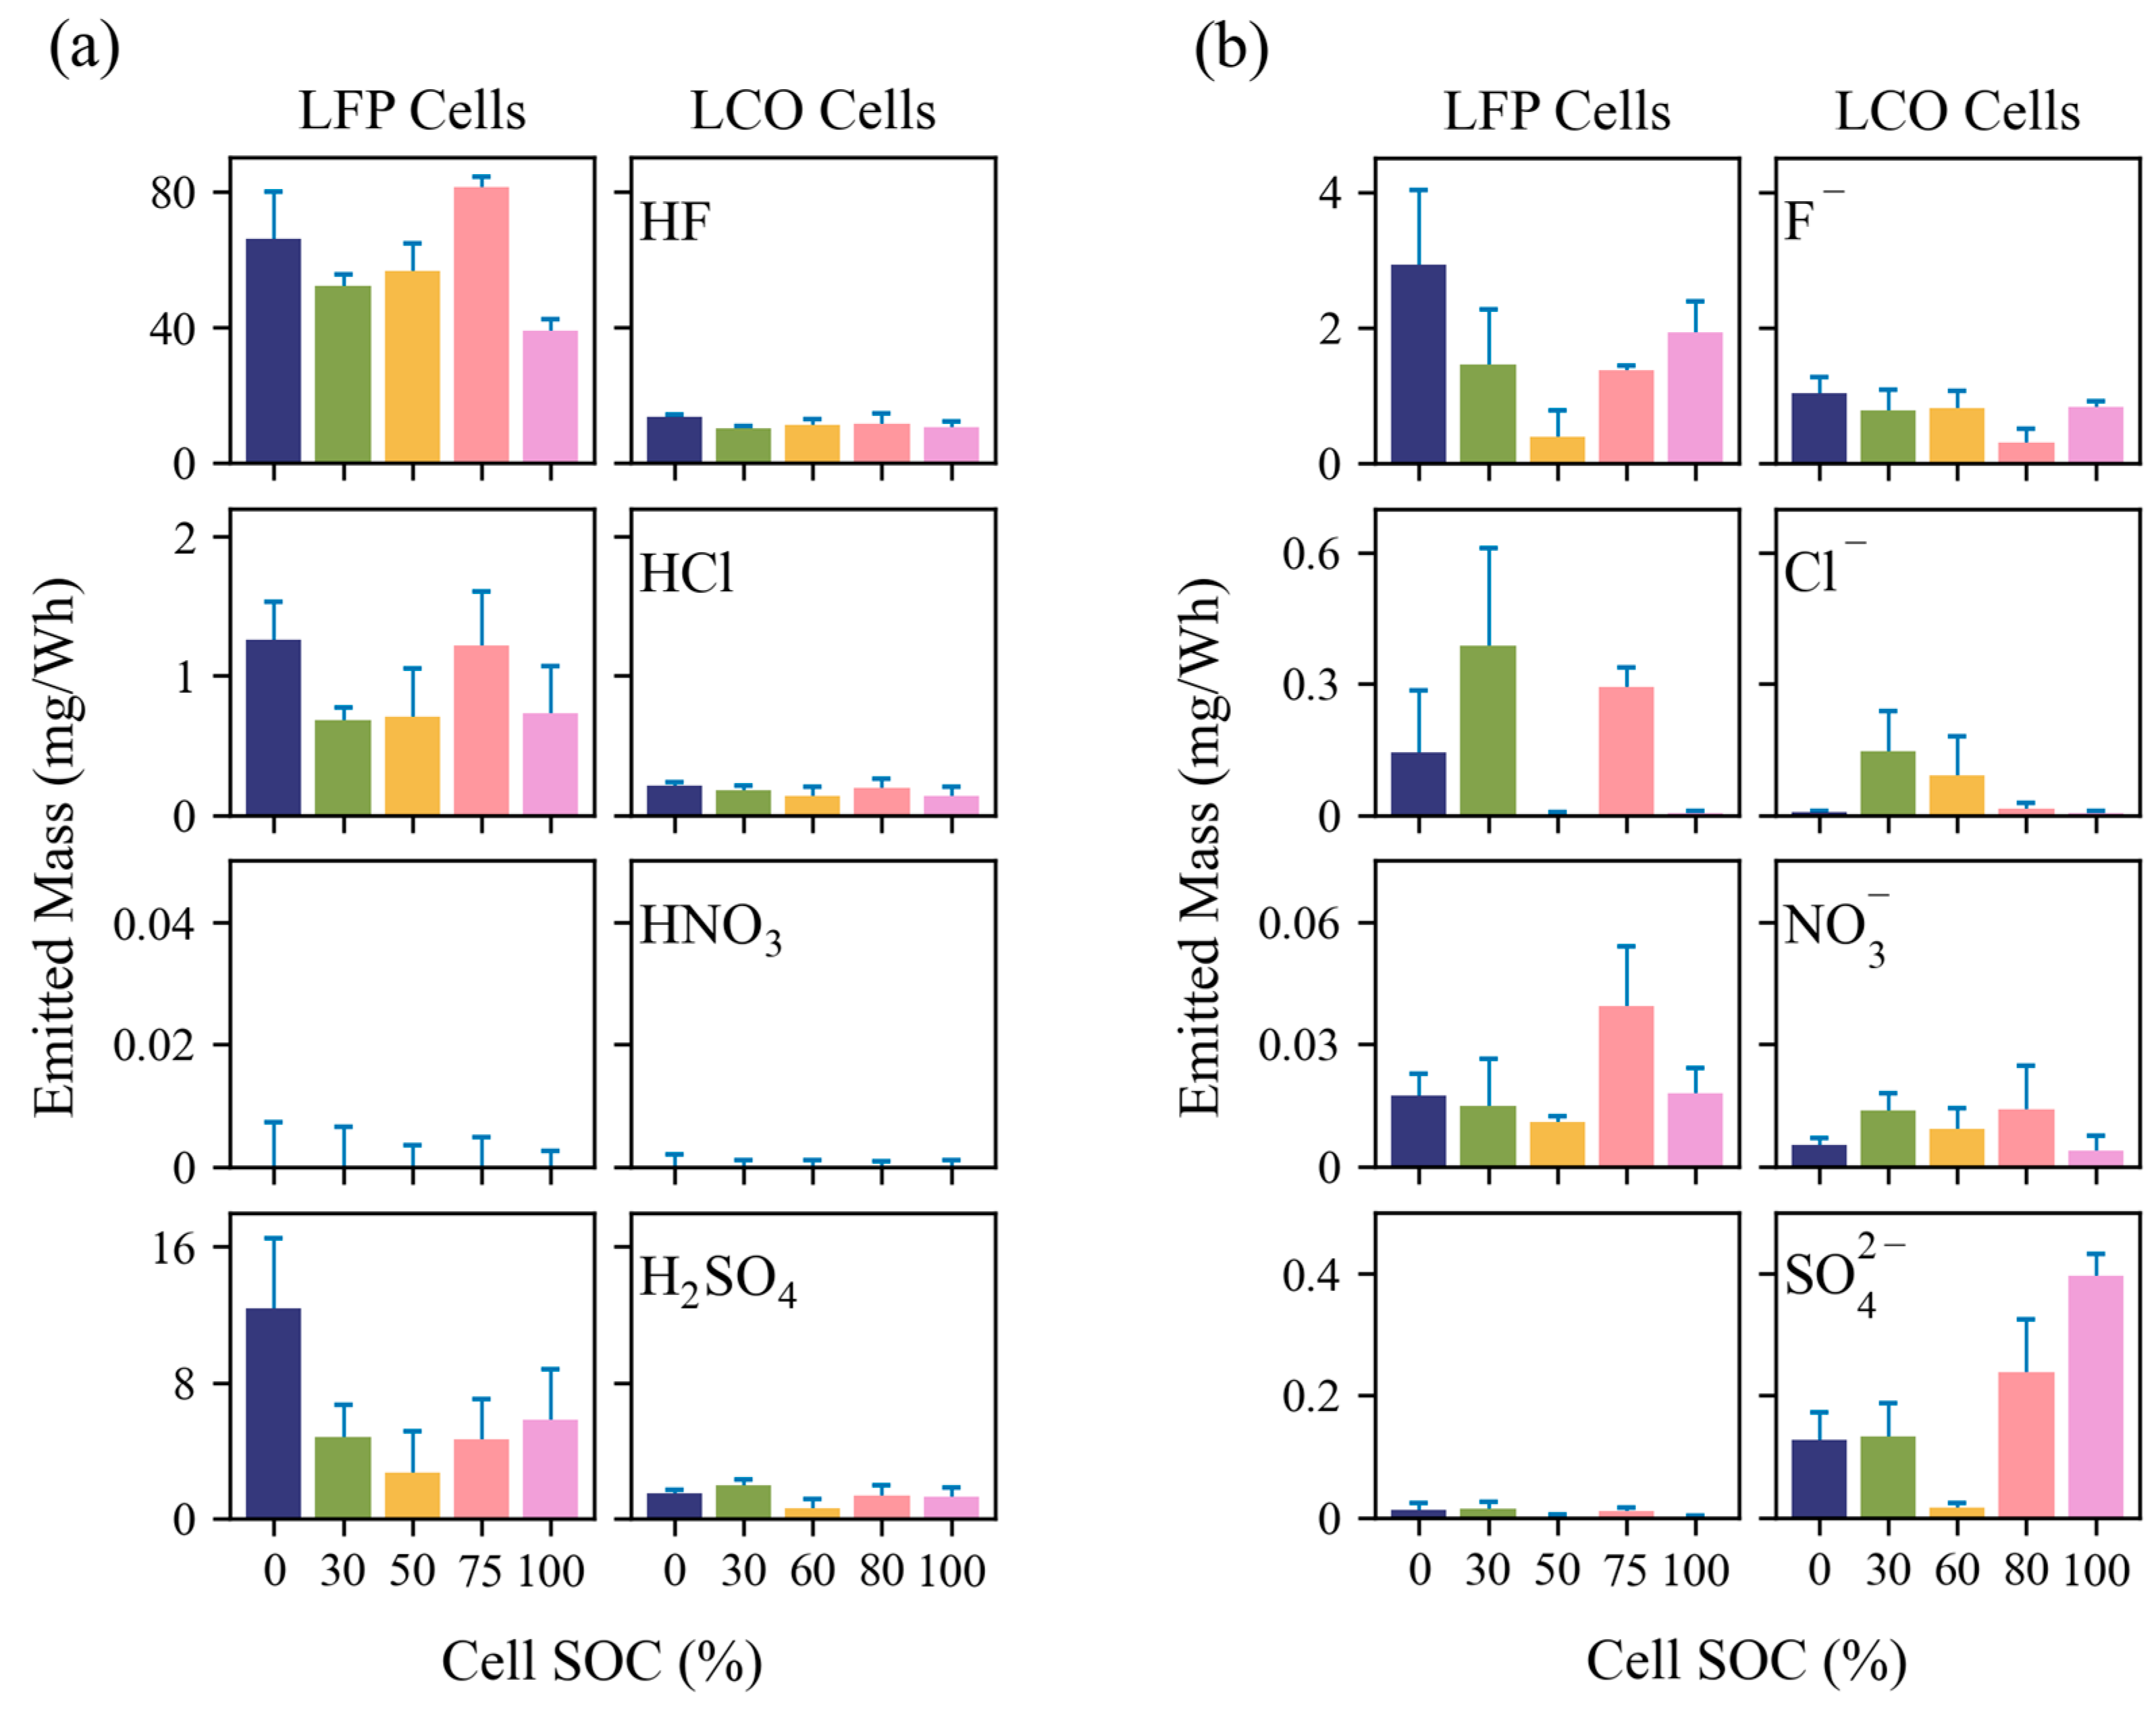
LIB fires emit acidic gases, such as HF, HCl, and H2SO4. Gaseous HF ranged from 39 to 81 mg/Wh for LFP tests and 10 to 14 mg/Wh for LCO tests. These toxic and corrosive gases may represent great hazards to people and properties.
(5)
Emissions are highly dependent on cell type, SOC, and combustion temperatures. The emitted PM2.5 mass can depend on cell SOC by a factor of two, while the emitted OC, EC, and PO43− can differ by a factor of 10 or more. PO43− increased with combustion temperature, particularly when it reached >500 °C. Toxic metal emissions increased with SOC, but only for LCO tests, with no trend for LFP tests. Acidic gas emissions depended primarily on cell type, indicating that cell design is crucial to lowering emissions of HF and other corrosive compounds. The emission dependence on LIB cell properties should be considered when evaluating the overall hazard that each LIB pack presents. For example, while LFP cells are known to be more thermally stable, results from this study show that they may release more HF and can generate higher particulate concentrations than LCO cells.
The emissions documented here have implications for health and safety as well as environmental contamination. Considering that modern LIB packs can contain hundreds to millions of Wh of energy capacity, the effects of significant emissions of volatile organics, ultrafine and fine particles, hazardous metals, and acidic compounds must be taken into consideration when responding to and cleaning up after LIB fires.
LIB fires are becoming more common as LIB use expands. The combustion process can occur quickly and without warning, limiting the effectiveness of fire suppression. Therefore, a detailed understanding of the resulting emissions is imperative to allow for effective fire response and cleanup. This paper has detailed the expected fine particulate emissions in a way that allows extrapolation to any size LIB pack if the burned LIB energy capacity is known. This resource will allow first responders, LIB manufacturers, and responsible authorities to plan for and respond to LIB fires.

Supplementary Materials

The following supporting information can be downloaded at: https://www.mdpi.com/article/10.3390/batteries10100366/s1, Table S1. EFs for four size fractions in particles/Wh and mg/Wh for particle number and particle mass, respectively; Table S2. EFs in mg/Wh for PM2.5 chemical constituents; Table S3. EFs in mg/Wh for acidic gases for all cell types and SOCs; Table S4. EFs in mg/Wh for particulate anions and cations for all cell types and SOCs; Table S5. EFs in mg/Wh for elements for all cell types and SOCs; Table S6. A comparison of cell mass loss rates to the literature values [5,6,10,47].

Author Contributions

Conceptualization, X.W.; Methodology, M.C. and X.W.; Software, M.C.; Validation, M.C. and X.W.; Formal Analysis, M.C.; Investigation, M.C., B.B., and X.W.; Resources, X.W.; Data Curation, M.C.; Writing—Original Draft Preparation, M.C. and X.W.; Writing—Review and Editing, X.W., J.C.C., J.G.W., P.C., and Y.W.; Visualization, M.C.; Supervision, X.W. and Y.W.; Project Administration, X.W.; Funding Acquisition, X.W. All authors have read and agreed to the published version of the manuscript.

Funding

This research was funded by the U.S. National Aeronautics and Space Administration’s Established Program to Stimulate Competitive Research, CAN Grant No. 80NSSC19M0152, and Nevada Space Grant No. 80NSSC20M0043 22–24.

Data Availability Statement

The raw data supporting the conclusions of this article will be made available by the authors on request. The calculated emission factors for all measured species are included in the Supplementary Materials.

Acknowledgments

The authors thank Hans Moosmüller for the use of the burn chamber where experiments were performed and DRI personnel for support and filter analysis.

Conflicts of Interest

The authors declare no conflicts of interest.

Abbreviations

∆tsampling duration
Cconcentration
Cdcadmium
Clchloride
Cocobalt
Dpparticle diameter
Ebattery cell energy capacity
ECelemental carbon
EEPSengine exhaust particle sizer
EFemission factor
ELPIelectrical low-pressure impactor
Ffluoride
GMMDgeometric mass mean diameter: mean diameter of a particle mass distribution in logarithmic scale
GNMDgeometric number mean diameter: mean diameter of a particle number distribution in logarithmic scale
GNSDgeometric number standard deviation: standard deviation of a particle number distribution in logarithmic scale
HClhydrochloric acid
Hgmercury
HFhydrofluoric acid
HNO3nitric acid
H2SO4sulfuric acid
ICion chromatography
ICP-MSinductively coupled plasma mass spectrometry
KOHpotassium hydroxide
LCOlithium cobalt oxide
Lilithium
Li+lithium ion
LIBlithium-ion battery
LFPlithium iron phosphate
NMCnickel manganese cobalt
NO3nitrate
OCorganic carbon
Pphosphorus
Pblead
PMparticulate matter
PMxparticles with aerodynamic diameters ≤x µm
PO43−phosphate
PSDparticle size distribution
Qflow rate
SMPSscanning mobility particle sizer
SO42−sulfate
SOCstate of charge
TRthermal runaway
Whwatt hours
XRFX-ray fluorescence

References

  1. Bugryniec, P.J.; Resendiz, E.G.; Nwophoke, S.M.; Khanna, S.; James, C.; Brown, S.F. Review of gas emissions from lithium-ion battery thermal runaway failure—Considering toxic and flammable compounds. J. Energy Storage 2024, 87, 111288. [Google Scholar] [CrossRef]
  2. Li, W.; Xue, Y.; Feng, X.; Rao, S.; Zhang, T.; Gao, Z.; Guo, Y.; Zhou, H.; Zhao, H.; Song, Z.; et al. Characteristics of particle emissions from lithium-ion batteries during thermal runaway: A review. J. Energy Storage 2024, 78, 109980. [Google Scholar] [CrossRef]
  3. Xu, Y.; Wang, Y.; Chen, X.; Pang, K.; Deng, B.; Han, Z.; Shao, J.; Qian, K.; Chen, D. Thermal runaway and soot production of lithium-ion batteries: Implications for safety and environmental concerns. Appl. Therm. Eng. 2024, 248, 123193. [Google Scholar] [CrossRef]
  4. Xu, Y.; Wang, Y.; Chen, D. Soot formation and its hazards in battery thermal runaway. J. Aerosol Sci. 2024, 181, 106420. [Google Scholar] [CrossRef]
  5. Zhang, Y.; Wang, H.; Li, W.; Li, C.; Ouyang, M. Size distribution and elemental composition of vent particles from abused prismatic Ni-rich automotive lithium-ion batteries. J. Energy Storage 2019, 26, 100991. [Google Scholar] [CrossRef]
  6. Zhang, Y.; Wang, H.; Li, W.; Li, C. Quantitative identification of emissions from abused prismatic Ni-rich lithium-ion batteries. eTransportation 2019, 2, 100031. [Google Scholar] [CrossRef]
  7. Wang, H.; Zhang, Y.; Li, W.; Li, C.; Ouyang, M. Particles released by abused prismatic Ni-rich automotive lithium-ion batteries. WSEAS Trans. Syst. Control 2020, 15, 30–38. [Google Scholar] [CrossRef]
  8. Wang, H.; Wang, Q.; Jin, C.; Xu, C.; Zhao, Y.; Li, Y.; Zhong, C.; Feng, X. Detailed characterization of particle emissions due to thermal failure of batteries with different cathodes. J. Hazard. Mater. 2023, 458, 131646. [Google Scholar] [CrossRef]
  9. Wang, G.; Kong, D.; Ping, P.; Wen, J.; He, X.; Zhao, H.; He, X.; Peng, R.; Zhang, Y.; Dai, X. Revealing particle venting of lithium-ion batteries during thermal runaway: A multi-scale model toward multiphase process. eTransportation 2023, 16, 100237. [Google Scholar] [CrossRef]
  10. Essl, C.; Golubkov, A.W.; Gasser, E.; Nachtnebel, M.; Zankel, A.; Ewert, E.; Fuchs, A. Comprehensive Hazard Analysis of Failing Automotive Lithium-Ion Batteries in Overtemperature Experiments. Batteries 2020, 6, 30. [Google Scholar] [CrossRef]
  11. Yang, Y.; Fang, D.; Maleki, A.; Kohzadi, S.; Liu, Y.; Chen, Y.; Liu, R.; Gao, G.; Zhi, J. Characterization of Thermal-Runaway Particles from Lithium Nickel Manganese Cobalt Oxide Batteries and Their Biotoxicity Analysis. ACS Appl. Energy Mater. 2021, 4, 10713–10720. [Google Scholar] [CrossRef]
  12. Held, M.; Tuchschmid, M.; Zennegg, M.; Figi, R.; Schreiner, C.; Mellert, L.D.; Welte, U.; Kompatscher, M.; Hermann, M.; Nachef, L. Thermal runaway and fire of electric vehicle lithium-ion battery and contamination of infrastructure facility. Renew. Sustain. Energy Rev. 2022, 165, 112474. [Google Scholar] [CrossRef]
  13. Bordes, A.; Papin, A.; Marlair, G.; Claude, T.; El-Masri, A.; Durussel, T.; Bertrand, J.-P.; Truchot, B.; Lecocq, A. Assessment of Run-Off Waters Resulting from Lithium-Ion Battery Fire-Fighting Operations. Batteries 2024, 10, 118. [Google Scholar] [CrossRef]
  14. ICRP. Human Respiratory Tract Model for Radiological Protection. ICRP Publication 66. Ann. ICRP 24 (1-3). 1994. Available online: https://www.icrp.org/publication.asp?id=icrp%20publication%2066 (accessed on 2 July 2024).
  15. Thangavel, P.; Park, D.; Lee, Y.C. Recent Insights into Particulate Matter (PM(2.5))-Mediated Toxicity in Humans: An Overview. Int. J. Env. Res. Public Health 2022, 19, 7511. [Google Scholar] [CrossRef] [PubMed]
  16. Premnath, V.; Wang, Y.; Wright, N.; Khalek, I.; Uribe, S. Detailed characterization of particle emissions from battery fires. Aerosol Sci. Technol. 2022, 56, 337–354. [Google Scholar] [CrossRef]
  17. Wang, X.L.; Grose, M.A.; Avenido, A.; Stolzenburg, M.R.; Caldow, R.; Osmondson, B.L.; Chow, J.C.; Watson, J.G. Improvement of Engine Exhaust Particle Sizer (EEPS) size distribution measurement—I. Algorithm and applications to compact-shape particles. J. Aerosol Sci. 2016, 92, 95–108. [Google Scholar] [CrossRef]
  18. Wang, X.L.; Grose, M.A.; Caldow, R.; Osmondson, B.L.; Swanson, J.J.; Chow, J.C.; Watson, J.G.; Kittelson, D.B.; Li, Y.; Xue, J.; et al. Improvement of Engine Exhaust Particle Sizer (EEPS) size distribution measurement—II. Engine exhaust particles. J. Aerosol Sci. 2016, 92, 83–94. [Google Scholar] [CrossRef]
  19. Hinds, W.C. Aerosol Technology, Properties, Behavior, and Measurement of Airborne Particles, 2nd ed.; Wiley: Los Angeles, CA, USA, 1999. [Google Scholar]
  20. Goupil, V.; Gaya, C.; Boisard, A.; Robert, E. Effect of the heating rate on the degassing and combustion of cylindrical Li-Ion cells. Fire Saf. J. 2022, 133, 103648. [Google Scholar] [CrossRef]
  21. Wang, X.L.; Chancellor, G.; Evenstad, J.; Farnsworth, J.E.; Hase, A.; Olson, G.M.; Sreenath, A.; Agarwal, J.K. A Novel Optical Instrument for Estimating Size Segregated Aerosol Mass Concentration in Real Time. Aerosol Sci. Technol. 2009, 43, 939–950. [Google Scholar] [CrossRef]
  22. Wang, X.L.; Zhou, H.; Arnott, W.P.; Meyer, M.E.; Taylor, S.; Firouzkouhi, H.; Moosmüller, H.; Chow, J.C.; Watson, J.G. Evaluation of gas and particle sensors for detecting spacecraft-relevant fire emissions. Fire Saf. J. 2020, 113, 102977. [Google Scholar] [CrossRef]
  23. Lee, J.; He, S.; Song, G.; Hogan, C.J. Size distribution monitoring for chemical mechanical polishing slurries: An intercomparison of electron microscopy, dynamic light scattering, and differential mobility analysis. Powder Technol. 2022, 396, 395–405. [Google Scholar] [CrossRef]
  24. Wang, X.L.; Firouzkouhi, H.; Chow, J.C.; Watson, J.G.; Carter, W.; De Vos, A.S. Characterization of gas and particle emissions from open burning of household solid waste from South Africa. Atmos. Chem. Phys. 2023, 23, 8921–8937. [Google Scholar] [CrossRef]
  25. Larsson, F.; Andersson, P.; Blomqvist, P.; Mellander, B.-E. Toxic fluoride gas emissions from lithium-ion battery fires. Sci. Rep. 2017, 7, 10018. [Google Scholar] [CrossRef] [PubMed]
  26. Claassen, M.; Bingham, B.; Chow, J.C.; Watson, J.G.; Wang, Y.; Wang, X. Characterization of Lithium-Ion Battery Fire Emissions—Part 1: Chemical Composition of Fine Particles (PM2. 5). Batteries 2024, 10, 301. [Google Scholar] [CrossRef]
  27. Lithiumwerks. APR18650M1B Nanophosphate® Technology Data Sheet. Austin, Texas. 2023. Available online: https://lithiumwerks.com/products/lithium-ion-18650-cells/ (accessed on 2 July 2024).
  28. AA Portable Power Corp. Model 544792 Polymer Lithium-Ion Battery Data Sheet. Available online: https://www.batteryspace.com/prod-specs/3175.pdf (accessed on 2 July 2024).
  29. Tian, J.; Chow, J.C.; Cao, J.; Han, Y.; Ni, H.; Chen, L.-W.A.; Wang, X.; Huang, R.; Moosmu, H.; Watson, J.G. A biomass combustion chamber: Design, evaluation, and a case study of wheat straw combustion emission tests. Aerosol Air Qual. Res. 2015, 15, 2104–2114. [Google Scholar] [CrossRef]
  30. U.S. EPA. Method 1—Sample and Velocity Traverses for Stationary Sources. Code of Federal Regulations, Title 40, Part 60, Appendix A-1. Available online: https://www.ecfr.gov/current/title-40/chapter-I/subchapter-C/part-60/appendix-Appendix%20A-1%20to%20Part%2060 (accessed on 6 August 2024).
  31. Järvinen, A.; Aitomaa, M.; Rostedt, A.; Keskinen, J.; Yli-Ojanperä, J. Calibration of the new electrical low pressure impactor (ELPI+). J. Aerosol Sci. 2014, 69, 150–159. [Google Scholar] [CrossRef]
  32. Saari, S.; Arffman, A.; Harra, J.; Rönkkö, T.; Keskinen, J. Performance evaluation of the HR-ELPI+ inversion. Aerosol Sci. Technol. 2018, 52, 1037–1047. [Google Scholar] [CrossRef]
  33. Marjamäki, M.; Keskinen, J.; Chen, D.-R.; Pui, D.Y.H. Performance Evaluation of the Electrical Low-Pressure Impactor (ELPI). J. Aerosol Sci. 2000, 31, 249–261. [Google Scholar] [CrossRef]
  34. Keskinen, J.; Pietarinen, K.; Lehtimäki, M. Electrical low pressure impactor. J. Aerosol Sci. 1992, 23, 353–360. [Google Scholar] [CrossRef]
  35. Maricq, M.M.; Podsiadlik, D.H.; Chase, R.E. Size Distributions of Motor Vehicle Exhaust PM: A Comparison Between ELPI and SMPS Measurements. Aerosol Sci. Technol. 2000, 33, 239–260. [Google Scholar] [CrossRef]
  36. Wang, X.; Firouzkouhi, H.; Chow, J.C.; Watson, J.G.; Ho, S.S.H.; Carter, W.; De Vos, A.S. Chemically speciated air pollutant emissions from open burning of household solid waste from South Africa. Atmos. Chem. Phys. 2023, 23, 15375–15393. [Google Scholar] [CrossRef]
  37. Eldering, A.; Solomon, P.A.; Salmon, L.G.; Fall, T.; Cass, G.R. Hydrochloric acid: A regional perspective on concentrations and formation in the atmosphere of Southern California. Atmos. Environ. Part A Gen. Top. 1991, 25, 2091–2102. [Google Scholar] [CrossRef]
  38. Sturges, W.T.; Harrison, R.M. The use of nylon filters to collect HCl: Efficiencies, interferences and ambient concentrations. Atmos. Environ. (1967) 1989, 23, 1987–1996. [Google Scholar] [CrossRef]
  39. U.S. EPA. Initial List of Hazardous Air Pollutants with Modifications; Air Toxics Assessment Group, U.S. Environmental Protection Agency: Research Triangle Park, NC, USA, 2020. Available online: https://www.epa.gov/haps/initial-list-hazardous-air-pollutants-modifications (accessed on 6 August 2024).
  40. Diaz, F.; Wang, Y.; Weyhe, R.; Friedrich, B. Gas generation measurement and evaluation during mechanical processing and thermal treatment of spent Li-ion batteries. Waste Manag. 2019, 84, 102–111. [Google Scholar] [CrossRef]
  41. Andersson, P.; Blomqvist, P.; Lorén, A.; Larsson, F. Investigation of Fire Emissions from Li-Ion Batteries; SP Technical Research Institute of Sweden: Borås, Sweden, 2013. [Google Scholar]
  42. Larsson, F. Lithium-Ion Battery Safety-Assessment by Abuse Testing, Fluoride Gas Emissions and Fire Propagation; Chalmers Tekniska Hogskola: Göteborg, Sweden, 2017. [Google Scholar]
  43. Ribière, P.; Grugeon, S.; Morcrette, M.; Boyanov, S.; Laruelle, S.; Marlair, G. Investigation on the fire-induced hazards of Li-ion battery cells by fire calorimetry. Energy Environ. Sci. 2012, 5, 5271–5280. [Google Scholar] [CrossRef]
  44. Sturk, D.; Rosell, L.; Blomqvist, P.; Ahlberg Tidblad, A. Analysis of li-ion battery gases vented in an inert atmosphere thermal test chamber. Batteries 2019, 5, 61. [Google Scholar] [CrossRef]
  45. Bordes, A.; Marlair, G.; Zantman, A.; Herreyre, S.; Papin, A.; Desprez, P.; Lecocq, A. New insight on the risk profile pertaining to lithium-ion batteries under thermal runaway as affected by system modularity and subsequent oxidation regime. J. Energy Storage 2022, 52, 104790. [Google Scholar] [CrossRef]
  46. Willstrand, O.; Pushp, M.; Andersson, P.; Brandell, D. Impact of different Li-ion cell test conditions on thermal runaway characteristics and gas release measurements. J. Energy Storage 2023, 68, 107785. [Google Scholar] [CrossRef]
  47. Koch, S.; Fill, A.; Birke, K.P. Comprehensive gas analysis on large scale automotive lithium-ion cells in thermal runaway. J. Power Sources 2018, 398, 106–112. [Google Scholar] [CrossRef]
Figure 1. Particle number distribution heatmaps for representative LFP and LCO tests at each SOC.
Batteries 10 00366 g001
Figure 2. Particle number distribution snapshots (left: log scale and right: linear scale) and heatmap (bottom) for a representative 0% SOC LFP test. GNMDs for t1–4 are 59 nm, 22 nm, 91 nm, and 49 nm, respectively.
Batteries 10 00366 g002
Figure 3. Particle number distribution snapshots (left: log scale and right: linear scale) and heatmap (bottom) for a representative 60% SOC LCO test. GNMDs for t1–4 are 117 nm, 59 nm, 195 nm, and 52 nm, respectively.
Batteries 10 00366 g003
Figure 4. Mass concentrations of PM1, PM2.5, and PM10 for the representative tests: (a) LFP at 0% SOC and (b) LCO at 60% SOC (same as those in Figure 2 and Figure 3). The coarse particles (PM2.5–10) are released predominantly during TR.
Batteries 10 00366 g004
Figure 5. Particle number (top panels) and mass (bottom panels) distributions for LFP (a,c) and LCO (b,d) tests. An outlier was removed from some SOC groups to better show the prevailing trends.
Batteries 10 00366 g005
Figure 6. Emission factors for (a) particle number and (b) particle mass by size fraction for LFP and LCO tests. Error bars represent the total PM10 standard error (including all smaller particle sizes) and are symmetric.
Batteries 10 00366 g006
Figure 7. Emission factors for (a) PM2.5 mass, OC, EC, and PO43− and (b) selected metals. The error bars represent the larger of the propagated analytical uncertainty or the standard error within each SOC and are symmetric.
Batteries 10 00366 g007
Figure 8. Emission factors for (a) selected acidic gases and (b) corresponding particulate anions. The error bars represent the larger of the propagated analytical uncertainty or the standard error within each SOC and are symmetric.
Batteries 10 00366 g008
Figure 9. Relationship between EFs and maximum detected combustion temperature for LFP tests. LCO tests showed little correlation, possibly due to poor temperature measurement, and are not shown.
Batteries 10 00366 g009
Table 1. Average and range (in parentheses) of geometric number mean diameters (GNMD) and geometric mass mean diameters (GMMD) for each SOC and cell type.
Cell TypeSOC (%)GNMD (nm)GMMD (nm)
LFP074 (72–77) 415 (409–424)
3074 (72–77) 426 (403–453)
50110 (109–111) 425 (415–435)
75114 (106–129) 479 (434–530)
10084 (71–93) 568 (536–611)
LCO090 (78–102) 387 (371–405)
30120 (111–137) 474 (470–477)
60130 (128–132) 663 (553–751)
80118 (109–128) 673 (651–704)
100116 (96–129) 668 (602–778)
Table 2. Comparison of gaseous emissions of HF and HCl to the literature sources, grouped by cell chemistry. EFs for HNO3 and H2SO4 were not found in the literature.
SourceCell TypeHF (mg/Wh)HCl (mg/Wh)
This studyLFP39–810.7–1.3
[40]LFP350125
[25]LFP12–24
[41]LFP40–125
This studyLCO10–140.14–0.21
[40]LCO308
[25]LCO30–40
[42]Unknown20–200
[43]LMO40–70
[44]NMC/LFP23–36
[45]NMC1–10
[46]NMC4.2
Disclaimer/Publisher’s Note: The statements, opinions and data contained in all publications are solely those of the individual author(s) and contributor(s) and not of MDPI and/or the editor(s). MDPI and/or the editor(s) disclaim responsibility for any injury to people or property resulting from any ideas, methods, instructions or products referred to in the content.

