Article

Quantifying Lithium-Ion Battery Rate Capacity, Electrode Structuring, and Transport Phenomena Using E-I Measurements

Department of Energy and Process Engineering, Faculty of Engineering, Norwegian University of Science and Technology (NTNU), 7034 Trondheim, Norway
*
Author to whom correspondence should be addressed.
Batteries 2024, 10(10), 364; https://doi.org/10.3390/batteries10100364
Submission received: 23 August 2024 / Revised: 18 September 2024 / Accepted: 9 October 2024 / Published: 15 October 2024

Abstract

:
The specific energy of lithium-ion batteries (LIBs) can be enhanced through various approaches, one of which is increasing the proportion of active materials by thickening the electrodes. However, this typically leads to the battery having lower performance at a high cycling rate, a phenomenon commonly known as rate capacity retention. One solution to this is perforating the electrode, by creating channels or corrugations in the active electrode material, either as holes or as channels. This is known to reduce the rate capacity retention effect, but in order to engineer this better, a simplified transport process analysis needs to be established. In this paper, we propose a classic electrochemical analysis based on voltage–charge cycling measurements in order to obtain a classical mass transport coefficient, h m , that is further used as a main indicator for electrode design quality assessment. We also demonstrate theoretically and experimentally how the mass transfer coefficient, h m , can be determined and how it changes as the electrode layer thickness increases, with and without electrode corrugations.

Graphical Abstract

1. Introduction

Energy storage through electrochemical methods is crucial in the shift from a fossil-based to a renewable energy economy. For the immense roll-out of storage capacity needed, the two dominating technologies are based on hydrogen and lithium-ion batteries (LIBs) [1].
LIBs have been a commercially promising and influential technology both for stationary short-term storage as well as for automotive applications for decades, partly because of their compatibility with existing infrastructure. Moreover, the technology has been commercially available for several decades, albeit mostly for electronic devices [2].
In transitioning from electronic power devices into automotive and stationary storage applications, requirements for increased specific energy and the increased utilisation of active materials in LIBs have risen. These improvements help reduce the cost as well as the vehicle range, and there are a couple of main paths in LIB manufacturing that aid this. It can be said that increasing the fraction of active material for cells is the key, and increasing this fraction can be achieved by several means [3].
Increasing the fraction of active materials was initially performed by increasing the cell size in terms of the Ah capacity of pouch cells (10–60 Ah), followed by prismatic cells (50–300 Ah). As such, the portion of surface material (container) was fractionally reduced. A second step was to increase the electrode thickness, so that the portion of current collectors, electrolyte, and separator was fractionally lowered [1]. Beyond this, ensuring that the active material remains active was achieved by pre-lithiation. Pre-lithiation in simple terms means adding lithium metal to the anode side during cell manufacturing, so that when the solid electrolyte interface (SEI) layer forms and grows, lithium from the cathode and electrolyte is not immobilised. The loss of lithium inventory related to SEI evolution and growth is commonly known as LLI [4], and pre-lithiation largely prevents this.
Initially, when the second distinct consumption of LIBs increased, it was for use as batteries for handheld power tools. For these, there was a need for batteries that could discharge quickly or supply high power. This was achieved by having thinner electrodes, as they perform better than thicker ones [5]. However, high power with thin electrodes comes at the expense of specific energy, and when achieving higher specific energy by increasing the electrode thickness, the power capability, especially during discharge, is reduced [6]. In this trade off, several researchers have looked into the porosity of the electrodes and have tried to develop structures and gradients of porosity [7]. These efforts can be divided into two geometric approaches: in-plane porosity changes and through-plane porosity changes. In-plane in this context means changing the density or porosity through the length or width of the electrode, whereas through-plane in this context refers to changing the porosity throughout the thickness of the layer, e.g., adding a dense layer near the current collector and a less dense layer on top.
Ye et al. [8] analytically investigated the effect of a hierarchical cuboid electrode structure on the energy density of an LIB graphite electrode. The results indicated that applying the structure can enhance the energy density, and the improvement becomes more pronounced for thicker electrodes.
Li et al. [9] compared the effect of simple electrolyte channels on the performance of the battery with a conventional uniform electrode using a numerical method. The effect of the electrode structure was examined for different electrode thicknesses. The results showed that the channelled electrode structure yielded a less specific capacity drop with the increase in the thickness. Also, the solid and electrolyte phase concentration gradients were lower for the structured electrode, indicating a more efficient material utilisation.
Using an electrochemical model, Gao et al. [10] analysed the effect of a tapered electrolyte channel design. The proposed electrode structure resulted in reduced mechanical stress. Also, the results indicated that the channel structure has a significant impact on the performance of the battery, and optimising the structure of the channels leads to improved specific energy, specific power, and specific capacity.
Kraft et al. [11] investigated the effect of laser-structured graphite anodes through a modelling approach. The model was validated against the experimental results of a graphite/NMC111 coin cell. The introduction of the structures reduced the overpotential, leading to a higher deliverable discharge capacity. Also, the charging time was reduced at high C-rates while the anode potential was increased, which meant a lower risk of lithium plating.
Chen et al. [12] introduced laser-structured holes through the thickness of the graphite anode. The experimental results indicated a higher capacity retention over 100 cycles when fast charging was performed. The structure was further analysed through a continuum modelling approach. Modelling results showed a reduced Li + concentration gradient and an extended duration before reaching zero potential in the anode. This means that there is a lower probability of lithium plating occurrence in structured electrodes. In another study, Goel et al. [13] optimised the channel size and spacing between the channels in a cylindrical hole structure. The results indicated that for a specific C-rate, there is an optimum spacing between the holes that yields a maximum capacity.
Sui et al. [14] analysed the effect of a through-plane vasculature electrolyte channels. Electrodes with a vertical channel and two-branched and four-branched vasculature structures were compared with the homogenous electrode. The results showed that all electrodes with channel structures improved charging capacity and Li+ concentration; however, the four-branched structure showed a superior performance compared to the others. Miyamoto et al. [15] studied the effect of randomly generated interdigitated structures for an LMO/graphite micro-battery. The results of the optimisation indicated that more complicated structures have the potential to increase the energy density at moderate and high C-rates, compared to simple interdigitated structures.
Wang et al. [16] fabricated patterned electrode structures using the 3D printing method. Three different electrode structures including grid, concentric rings and line patterns were tested. The results showed a higher and more stable areal capacity for all the 3D patterned electrodes, with the line pattern demonstrating better performance among the other electrode structures.
Hu et al. [17] fabricated a structured LiMn 1 x Fe x PO 4 cathode with the 3D printing technique. In comparison to the conventional electrodes, the 3D-printed cathodes exhibited a lower capacity drop when discharged at C-rates between 1C and 100C. Also, the capacity retention was improved when cycled at 10C and 20C after 1000 cycles.
Plateau et al. [18] fabricated structured electrodes using a patterned blade. The structures were applied to both the cathode and anode and an interdigitated coin cell was manufactured. The structure of the electrodes facilitated fast ion transport, resulting in a high areal capacity for electrodes with a high mass loading. The electrode structures also reduced mechanical stress, leading to less crack and defect generation during cycling.
Jang et al. [19] examined the effect of 3D electrode structures on the electrochemical properties for pore-structured graphite electrodes. The results showed that rate capability and cycle life of the electrodes were improved due to their improved wetting ability and shortened ionic diffusion pathways.
Tran et al. [20] examined the effect of laser structuring on the electrochemical performance of an NMC811 cathode. The 3D electrode structuring improved the rate capability of the electrode. The diffusivity of Li+ ions was also examined using cyclic voltammetry and electrochemical impedance spectroscopy. The transport of lithium improved significantly when the structuring of the electrodes was performed.
Some studies focused on the vertically aligned channels inspired by wood structures to reduce tortuosity. Lu et al. [21] fabricated an LCO cathode with such a structure. The results showed higher electronic and ionic conductivity, higher areal capacity, and better cyclic stability than conventional electrodes. Chen et al. [22] fabricated a wood-inspired carbon framework, filled with a lithium iron phosphate material. The proposed structure exhibited higher areal capacity, lower overpotential, better cyclic stability, and less mechanical deformation.
Keilhofer et al. [23] manufactured structured electrodes using mechanical embossing in a high-throughput roll-to-roll process. Mechanical structuring was examined due to the active material loss and low process rates of laser ablation. The results showed increased discharge capability at medium C-rates in rate capability tests.
Bryntesen et al. compared laser and mechanical structuring on the surface of PVDF/NMP-based cathodes, using lignin as a binder [24,25]. While laser structuring produces structures with higher precision, the mechanical process of corrugating cathodes demonstrated significant advantages. Notably, it showed no material waste and no formation of surface residues, highlighting the efficiency of this method. Furthermore, the electrochemical performance of different mechanical corrugation patterns was investigated on lignin/water-based cathodes. The corrugation process using large line structures with blades on the electrode surface exhibited superior discharge capacity at high C-rates compared to the stamp-like structuring wafer method. Cathodes fabricated with mechanically corrugated lines were found to be more reproducible and mechanically stable [24]. Another advantage of the mechanical corrugation over laser ablation method is that in a real factory, removing dust from welds and, consequently, dust from laser ablation increase the energy requirement of the manufacturing process [26,27]. Generally, one can also argue that mechanical corrugations, as a material displacement technique, has better material utilisation than laser ablation, which is a material removal technique, and particularly if the corrugations were to become very dense. Still, laser ablation is a very useful tool for experimental research and therefore not less important.
Park et al. [28] fabricated laser-structured NMC cathodes of varying thicknesses, between 100 and 210 μ m, with uniformly spaced micro-grooves and compared them to unstructured electrodes used in the industry. The results showed that the specific energy of thickly and densely structured electrodes at 0.5C was approximately double compared to those of thin, unstructured electrodes, while rate capability remained largely unchanged. The thicker laser-structured electrodes had a better rate performance at 1C than the unstructured electrode. The increase in power and energy densities of the structured electrode was due to the improvement of lithium-ion diffusivity and cell polarisation. In another paper, Park et al. [29] examined the effects of laser structuring parameters, groove pitch and depth, on the fundamental the characteristics of an LIB electrode, namely interfacial area, internal resistances, material loss and electrochemical performance. LiNi 0.5 Co 0.2 Mn 0.3 O 2 cathodes were laser-structured with varying groove depths and pitches, resulting in a material loss of 5% to 14% and an increase of 140% to 260% in the interfacial area between the electrode surface and the electrolyte. The importance of groove depth and pitch with regard to the electrochemical performance of the structured electrode varies with the C-rate. At low C-rates, the groove pitch had a larger impact on electrochemical performance, whereas at high C-rate, the groove depth was more important.
Berhe et al. [30] investigated the wettability and electrochemical performance of laser-structured LiFePO4 electrodes. The LiFePO4 electrodes were structured in a grid pattern with variable laser power to provide different aspect ratios. The wetting property was examined using spread area, wetting time and contact angle as the main variables. The results showed improved wettability for structured electrodes, with a higher aspect ratio leading to improved wettability. The results also showed a slight increase in rate capability for the structured electrodes when compared with the unstructured electrodes. Another study on laser-structured LiFePO4 electrodes by Park and Lee [31] investigated the morphological variation of grooves in the laser structuring of electrodes to assess advantageous parameters to minimise active material removal while achieving a suitable aspect ratio. The results show that applying multi-pass with low fluence is advantageous in laser structuring for achieving high aspect ratios with minimum active material removal.
To summarise these studies, it is clear that corrugations or porosity variations hold benign effects in LIB manufacturing and that there remains a desire for an increased specific energy of cells and, thereby, systems. From these studies, it is not clear what the mechanisms behind an increased performance due to corrugations are caused by, other than that they are very beneficial. In order to understand these mechanisms better, there is a need to establish engineering tools using E-I data to compare these studies. The scope of this paper is to use the mass transfer coefficient and establish the viability of this method. In subsequent studies, it will be natural to compare the mass transfer coefficient as a function of electrode thickness, corrugation type, corrugation density and more electrode design indicators with an aim to understand the scientific and engineering possibilities in this type of battery manufacturing. In order to better compare data, there is a need to report on an engineering metric that is general, and the effective mass transfer coefficient, h m , as that in this paper is one such metric.
Another summarising and prospective remark is in relation to the different methods for making corrugations in electrodes. When studying various types of corrugations and the opportunities they hold, using different tools is meaningful, while taking into account scaling and cost implications. Laser ablation, for example, has benefits in its precision and flexibility, but can be said to be inconvenient in commercial manufacturing as it removes active material (resource utilisation) and also increases the amount of dust in the manufacturing facility (operation, cost and battery quality implications). On the other hand, mechanical corrugation can be included in commercial manufacturing by adding corrugation rollers between the die casting and the drying units during the electrode manufacturing process. In a scientific and research context, mechanical corrugation tools are likely less precise than laser ablation; however, it offers an important link between the two approaches when discussing the scalability of excellence in science versus practical manufacturing.
There is little doubt that corrugations and porosity changes in-plane and through-plane in electrodes have benign effects at high-discharge-rate conditions, particularly when away from a high state of charge (SOC), and this can be studied via electrochemical impedance spectroscopy (EIS). However, there is a need for quantifying this effect by numbers that can easily be applied in engineering models as well as those based on voltage–current (E-I) measurements. This paper proposes and demonstrates that such a quantitative method can be applied alongside the necessary theory and experiments for validation. Moreover, focus is placed on thicker electrodes, which typically come at the expense of a reduced rate capacity. Mass transfer properties via in-plane density configurations where we make lines with the absence of electrodes (also called corrugations) are also studied through experimental efforts.

2. Theory and Analysis Approach

First, we provide the theoretical framework in terms of thermodynamic and kinetic expressions, and next, the understanding of measured data. The theory and extensions of the framework are based on Burheim [1].

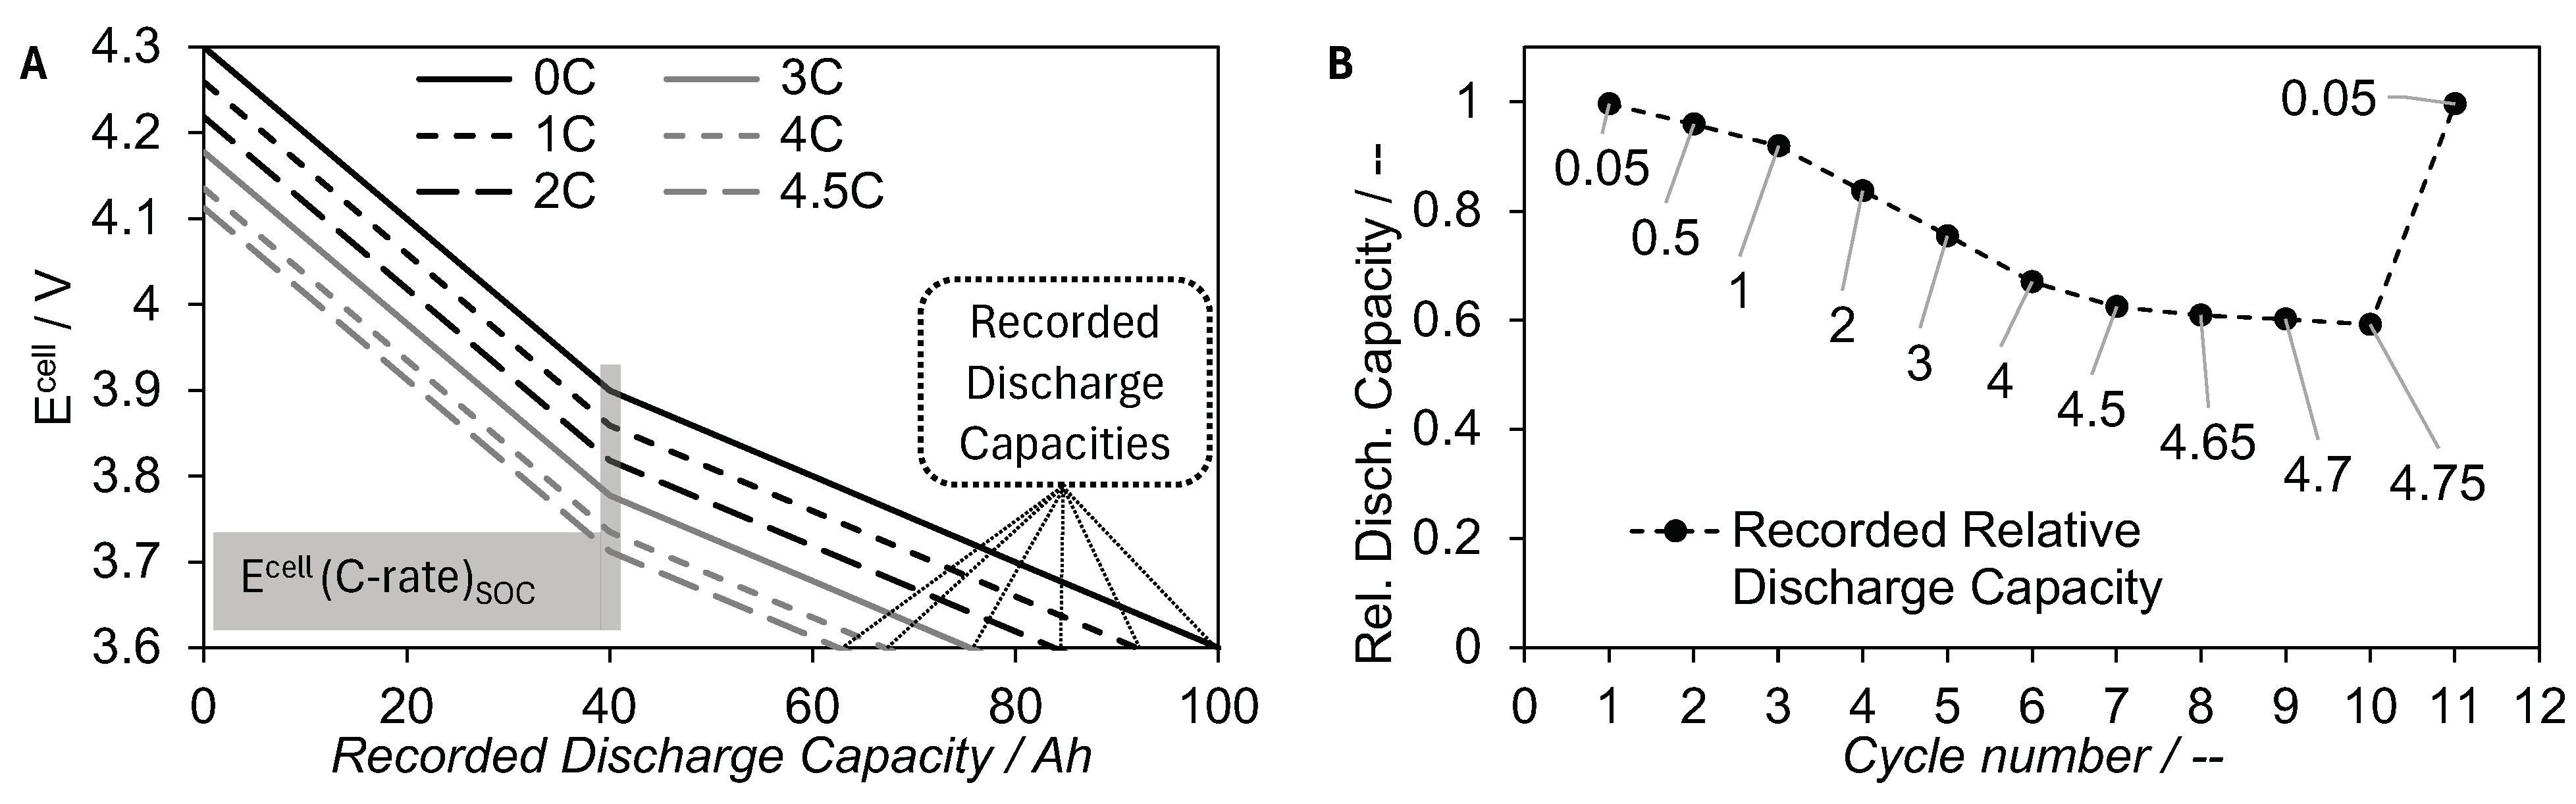
2.1. Rate Capacity Retention

When cycling batteries, it is common to fully charge the batteries up to their nominal voltage, typically 4.3 V for NMC111-graphite cells. Next, one starts cycling the batteries at low C-rates by discharging the batteries to a lower limit at a constant current, typically 3.6 V. The battery is then charged at constant current up to the higher voltage limit and kept there while the current gradually decreases until the current is zero. This procedure is often referred to as constant current–constant voltage (CCCV) cycling. The CCCV cycling is usually performed by gradually increasing the CC value, and in this way, one can investigate the performance of batteries and gauge how well they perform during intensive cycling. When discharging at constant current and charging by applying CCCV, the term CC-CCCV cycling is often used.
During the CC-CCCV cycling, as the C-rate increases, the current also increases. As the current increases, so do the voltage losses of the battery. This leads to the battery needing a lower end voltage to fully discharge during constant current discharge. As the CCCV voltage protocol operates within the open circuit battery voltage window, the discharge process is interrupted as the current increases, leading to a smaller amount of charge being released, and thus, a smaller amount of charge or capacity is recorded. This is illustrated with a simplified model in Figure 1. In Figure 1A, one can see results from a simplified model of the voltage available at different C-rates when a battery is discharged under CC conditions of a voltage window of 3.6–4.3 V. As the C-rate is intensified, the available voltage is lowered. When the lower voltage limit is reached, the current changes direction and the charging process initiates. Looking at where the cell voltage crosses the lower voltage of 3.6 V, one can see the recorded discharge capacity of the battery.
After having obtained the recorded discharge capacity, it is common to plot this as a function of the cycle number and somehow indicate the C-rates of the different data points. For the simplified model presented here, this is presented in Figure 1B. Because we shall compare batteries with very different specific capacities, we have presented the relative capacity, i.e., the recorded capacity at any C-rate divided by the capacity at infinitely long discharging rates—also known as the reversible voltage, E r e v . In Figure 1B, one can see that the capacity is reduced as the C-rate is increased. This phenomenon is what we and others often refer to as rate capacity retention.
In order to reduce the rate capacity retention, one must first understand its nature, and in doing so, one must study the cell voltage at fixed discharge conditions. State of charge (SOC) is a term that can define how much of the available charge is available at a given C-rate, either relative to the charge available at reversible conditions (here termed nominal SOC), or it can refer to how much charge is available relative to the amount of charge available at the C-rate of interest (here termed dynamic SOC). In the following analysis, we practice the use of nominal SOC. In the analysis that follows, we also extract cell potentials at constant nominal SOC, as is indicated by the greyed area of Figure 1B. Extracting datasets at a defined nominal SOC is the premise of the following analysis, and is also exemplified in the following sections.

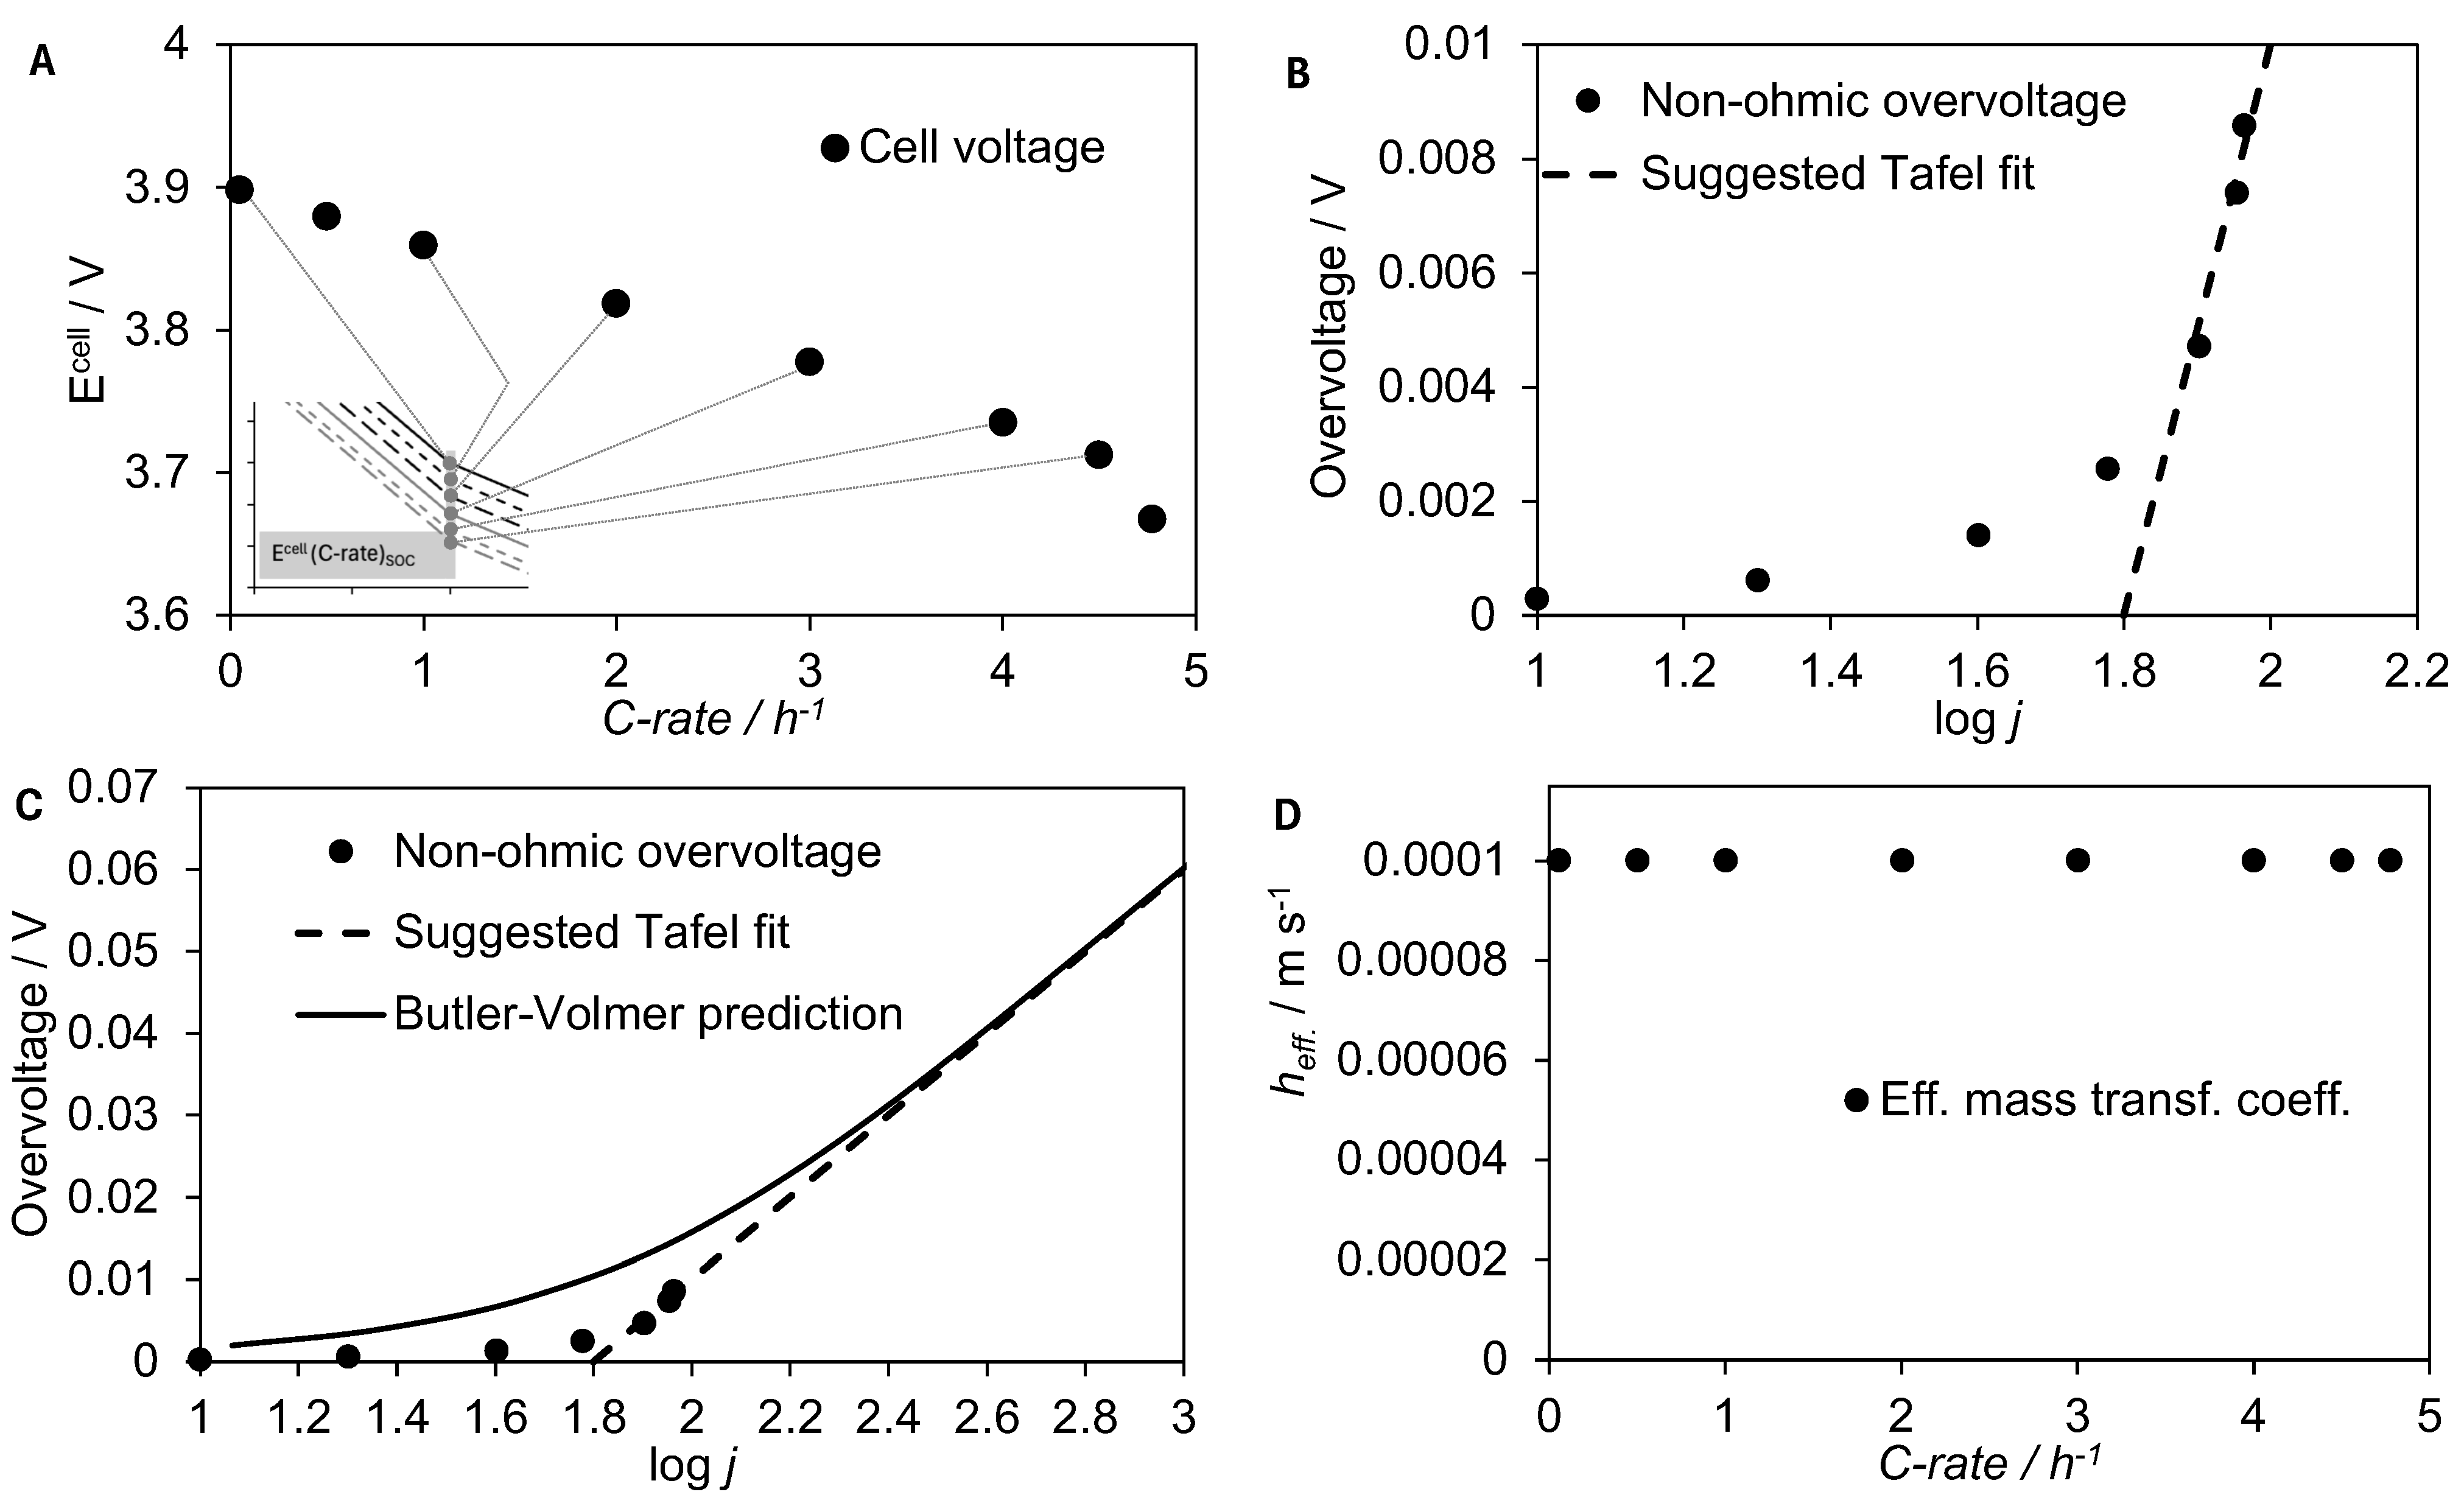
2.2. Framework for Mass Transfer Coefficient Determination

During the cycling of a lithium-ion battery (LIB), the reversible potential, E r e v , will change with the state of charge (SOC) as the chemical potentials of the electrode reaction constituents change. At any given rate and SOC, the measured cell potential, E c e l l , is obtained as
E c e l l = E r e v ± r j ± η c . t . ± η c o n c . { Charging : + Discharging :
where r is the specific resistance, j is the cross-sectional current density, η c . t . is the reaction overpotential as described by the Butler–Volmer equation, and η c o n c . is the concentration overpotential arising from concentration gradients across the electrolyte phase. The sign of the current density here is positive for both charging and discharging.
The charge transfer overpotential is typically described by the Butler–Volmer (BV) equation:
j = j 0 exp α z F R T η c . t . exp ( 1 α ) z F R T η c . t .
where R is the ideal gas constant, T is absolute temperature, F is the Faraday constant, z = 1 is the number of electrons exchanged in the electrode reaction, j 0 is the exchange current density, and α is the electrode reaction symmetry coefficient. The BV equation can be simplified at high current densities where the rightmost exponential term of Equation (2) becomes negligible. This simplification is commonly known as the Tafel equation:
η c . t . = a + b log j
where a and b are coefficients related to the exchange current density and the symmetry coefficient, respectively. Note the shift to a base 10 logarithm in Equation (3). In the battery voltage analysis herein, the voltage and current density were not well described by the Tafel behaviour.
It follows, as we shall see in Section 2.3, that if the obtained Tafel coefficients of Equation (3) and the corresponding BV equation, Equation (2), both do not overlay the measured data points, then the overpotential cannot be attributed to charge transfer.
Regardless of the existence of a significant charge transfer overpotential, there may also be a concentration polarisation overpotential. In its simplest form, this can be described by the reversible potential change at the surface due to the change in salt concentration on one electrode, c 1 , relative to the concentration at the surface of the other electrode, c 2 . The overpotential is well explained by the MacInnes equation [32], which takes into account non-idealities of the electrolyte mixture and the effect of solvent polarisation. For the sake of a simplified mass transfer coefficient analysis, we shall ignore non-idealities and solvent effects, such that the concentration overpotential is described by
η c o n c . = ( 1 t L i ) R T F ln c 1 c 2
where t L i is the transport number of lithium ions, and the ohmic contribution has been moved to Equation (1).
The transport of ions in the electrolyte phase occurs by both diffusion and migration superimposed. In this description, migration is any transport of ions associated with a net transfer of electrons in the external circuit, and diffusion is any transport without a net transfer of electrons [32]. Instead, we shall derive the empirical mass transfer coefficient by approximating that any movement of an ion is due to diffusion, and that any diffusion leads to a net transfer of electrons in the external circuit. Ignoring non-idealities and solvent effects, this means that
t L i j F = J L i = D L i δ ( c 2 c 1 ) = c 2 D L i δ 1 c 1 c 2
where J L i is the molar flux of lithium ions, D L i is the diffusion coefficient of the lithium salt used in the LIB, and δ is the distance between the electrodes. By combining Equation (5) with Equation (4), and by combining δ and D L i into an effective mass transfer coefficient, h m , we obtain
h m = A j F 1 c 1 c 2 = A j F 1 exp ( 1 t L i ) F R T η c o n c . = c 2 A D L i t L i δ
where A is the cross-sectional area. So far, we have defined the expressions needed for determining the effective mass transfer coefficient, and in the following section, we shall describe the approach for obtaining this mass transfer coefficient.

2.3. Distinguishing Non-Ohmic Overpotential Contributions

The objective of this paper is to obtain effective mass transfer coefficients as a tool for the quantitative assessment of electrode architectures. This analysis requires determining the size and relevance of the ohmic ( r j ) and the charge transfer ( η c . t . ) overpotentials.
Looking at the cell potential as a function of C-rate, we can typically see the ohmic voltage region as well as the reversible voltage. We can see this by comparing the voltages after a given charge is passed. Because of the rate capacity retention, we cannot use the relative C-rate as described by the voltage, but we must instead use the charge passed defined by the open circuit voltage, and thereby, the open circuit SOC (the nominal SOC).
In order to explain the method as it will later be applied, we have provided a theoretical dataset in Figure 2. This dataset should be seen as ideal, as in reality and, particularly, at higher currents or C-rates, there is much more noise. Nevertheless, this example is highly representative of the measurements we have obtained in this study.
First, the measured cell voltages are interpolated so as to obtain voltage values at consistent nominal capacity values for all C-rates. Then, E c e l l is plotted as a function of C-rate, as shown in Figure 2A. The measurements below 50 % of the maximum current density are then fitted to a regression curve of the following form:
E c e l l = E r e v + r j
where E r e v is used as a regression coefficient corresponding to the E c e l l value when j = 0 , and the slope of the curve, r, corresponds to the cell resistance. By extracting the ohmic resistance from the linear domain and subtracting the reversible voltage and the ohmic contribution from the cell voltage, we obtain the data points in Figure 2B. Fitting the linear higher overpotentials to the Tafel one, Equation (3), we obtain the a- and b-coefficients that can be used in Equation (2). This is then shown in Figure 2C. It should now be visible that the overpotential cannot be linked to the charge transfer overpotential as the potential values would have had to be much higher. In this example, we therefore consider the non-ohmic overpotential to be solely related to the concentration overpotential. Furthermore, the curve fitting of the non-ohmic overpotential with both Equation (2) (or Equation (3)) and Equation (6) simultaneously also showed that either Equation (2) or Equation (3) was not adequate for describing the overpotential. By employing Equation (6), we obtain the effective mass transfer coefficients similarly to that shown in Figure 2D.
Having determined effective mass transfer coefficients for the different electrode configurations in this study, we can continue to discuss their impact and how to optimise the design of electrodes with respect to having high specific capacity (mAh/g) at higher rates—both for the electrodes themselves and for assembled cells. There will be a trade off between corrugations (material removal) and rate capacity, and understanding this is a goal in the continuation of this study.

3. Experimental Section

To investigate rate capacity retention and effective mass transfer coefficients in this study, three different electrode configurations were manufactured. One electrode configuration had no corrugations, whereas the other two electrode configurations had corrugations. This section describes the production processes and the tools used to manufacture the different electrode configurations.

3.1. Cathode Composition

All the cathodes produced consisted of a slurry of active material, conductive additive, binder and solvent. The active material in the produced cathodes was lithium nickel manganese cobalt oxide (NMC111), where 1:1:1 was the stoichiometric ratio of the three transition metals (Ni, Mn, and Co). The conductive additive used was carbon black. The solvent used was distilled water. The binder used was lignin, which is a non-toxic and cheaper alternative to PVDF (polyvinylidene fluoride), with a higher electrical conductivity than the PVDF used in commercial applications [33]. Lignin is a common waste by-product from the pulp and paper industry that can be derived from numerous sources with different pretreatment options [34,35,36,37]. Bresser et al. [38] examined the advantages of water-soluble binders, such as lignin, as promising alternative binders for sustainable electrochemical energy storage. The chemicals used to manufacture the cathodes are listed in Table 1. The theoretical composition of the cathode was designed to be 90:5:5 wt%, consisting of 90% NMC111, 5% lignin/water solution, and 5% carbon black by weight.

3.2. Production Process

The production process starts with mixing the binder and solvent solution, the conductive carbon black additive, and the active material to turn the slurry into one homogeneous paste. The slurry consisted of 0.04889 g of the lignin and water solution, 0.0444 g of carbon black, 0.800 g of NMC111, and 0.4444 g of distilled water to achieve a powder-to-liquid ratio of 1:1. The mixing of the slurry consisted of two rounds of mixing with three cycles of 10 min, for a total of 30 min, at different mixing speeds. Once a cycle was finished, the next cycle would start immediately until all the cycles had been run. The first cycle was set to run for 10 min at 1000 revolutions per minute (rpm). The second cycle was set to run for 10 min at 2000 rpm. The last cycle was set to run for 10 min at 1000 rpm. This was performed using a Thinky (THINKY ARE-250l) mixer.
Following the mixing of the slurry, the next step is the coating and drying process. The coating and drying process was performed on a tape caster with heating and vacuum control. The coating process started with placing the current collector sheet on the tape caster while turning on both the vacuum and heating. A sheet of aluminium foil, with a layer of carbon black on top of it for added adhesive strength, was used as the current collector. The vacuum allowed the current collector sheet to stick to the tape caster. Once the tape caster warmed up, the slurry was coated onto the current collector with the desired thickness. A doctor blade with an adjustable gap was used to select the desired thickness. A picture of the blades on top of the electrode on the electrode caster is shown in Figure 3.
Structuring was performed as the electrode dried. A mechanical structuring tool was used to create the corrugations. In this study, two different structuring tools were used, metal structuring blades (MBs) and ceramic structuring blades (CBs), which had different dimensions. The next step in the process was drying, which involved placing the electrode in a vacuum oven to remove any excess water on the surface of the electrode. The electrode was then dried at 50 degrees Celsius for a minimum of 12 h in a vacuum.
Once the electrodes have dried, calendaring is performed until the film reaches the desired thickness, based on an ideal porosity of around 30%. Once the desired porosity is achieved, the electrodes are cut out using a hand-held disk cutter with a circumference of 15 mm. The thickness of the cut electrodes is measured, and then they are weighed to determine the mass of each electrode. These measurements are used to calculate the porosity and specific capacity.
Scanning Electron Microscopy (SEM) was used to assess whether the structured electrodes had sufficient corrugations and were ready for assembly. The electrode samples were subject to an acceleration voltage of 13 kV and the working distances were set to between 10 and 20 mm. The surfaces of the electrodes were inspected at different magnifications to assess the structural integrity of the corrugations. Once the samples had been inspected and approved, they could be assembled into cells. For this investigation, an SEM Apreo model from the manufacturer FEI was used.
Cell assembly took place in a glovebox, Mbraun Labmaster Pro SP, filled with argon gas and had an oxygen- and water-controlled atmosphere, with an ideal oxygen content of less than 0.1 ppm and an ideal water content of less than 0.1 ppm. The cell assembly consisted of the following equipment: cathode, spacer, O-rings, anode (lithium metal), separator, electrolyte and containing caps. O-rings and spacers were used to ensure a tight fit. The electrolyte used was a 1:1:1 EC:DMC:DEC mixture with 1 M LiPF6 and 40 μ L of this electrolyte was used during assembly. The electrolyte was added in two stages to maximise wetting throughout the cell. The separator was made of polypropylene and polyethylene, and the model type was Celegard 2320.

3.3. Characterisation

After cell assembly, the cycling process could begin. Wetting time for the cells was generally 7 days to keep it as consistent as possible, although some residual wetting during the first cycles was inevitable. The two main methods of characterisation used during cycling were galvanostatic charge and discharge (GCD), and constant current–constant voltage (CCCV). The main purpose of the GCD cycling was to analyse the rate performance of the different cells. The main purpose of the CCCV cycling was to improve cycling stability at high C-rates since the mass transport cycling schedules used included high C-rates.
The cycling schedule used to obtain cell performance data started with four formation cycles at 0.05C and then gradually increased up to 5C in small increments for 38 cycles. The emphasis of the cycling schedule was on high C-rates, so the incremental C-rate increase became smaller after 4C. These data could then be used to determine the different electrodes’ capacity retention characteristics and effective mass transfer coefficients. The cells were charged to 4.3 V and discharged to 3 V. CCCV was used during charging and CC was used during discharge. the cells were cycled between 3 V and 4.3 V.

4. Results and Discussion

As mentioned in Section 3.2, three electrode configurations were used to analyse rate capacity retention and effective mass transfer coefficient of electrodes with and without corrugations. The first electrode configuration consisted of electrodes without any corrugations (Plain). The second electrode configuration consisted of electrodes with line corrugations made using a ceramic blade structuring tool, denoted as (CB or Ceramic) in this analysis. The third and last electrode configuration consisted of electrodes with line corrugations made using a metal blade structuring tool, denoted as (MB or Steel) in this analysis. These three electrode configurations were also compared at three different thicknesses. The electrodes denoted as 100 μ m thick electrodes in this analysis ranged in thickness from 97 μ m to 104 μ m. For the purpose of this analysis, they are all labelled as 100 μ m thick electrodes. Similarly, the electrodes denoted as 150 μ m thick electrodes in this analysis ranged in thickness from 141 μ m to 158 μ m. For the purpose of this analysis, they are all labelled as 150 μ m thick electrodes. Also, electrodes around 50 μ m were made. However, these electrodes were so thin, that there was no recorded effect in relation to non-ohmic overpotential; therefore, these results are not discussed further in this paper.

4.1. SEM

Figure 4 shows the surface of an unstructured and of a structured electrode at different magnifications. The SEM image clearly shows the indentations made by the structuring tool. The depth of the corrugations were quite uniform but the width of the indentations ranged from 25 μ m to 32 μ m. As can be seen from the image, the corrugation was not completely uniform throughout. These were only microscopic variations and not enough to cause a marked difference in rate capacity retention or mass transfer results when testing similar cells.

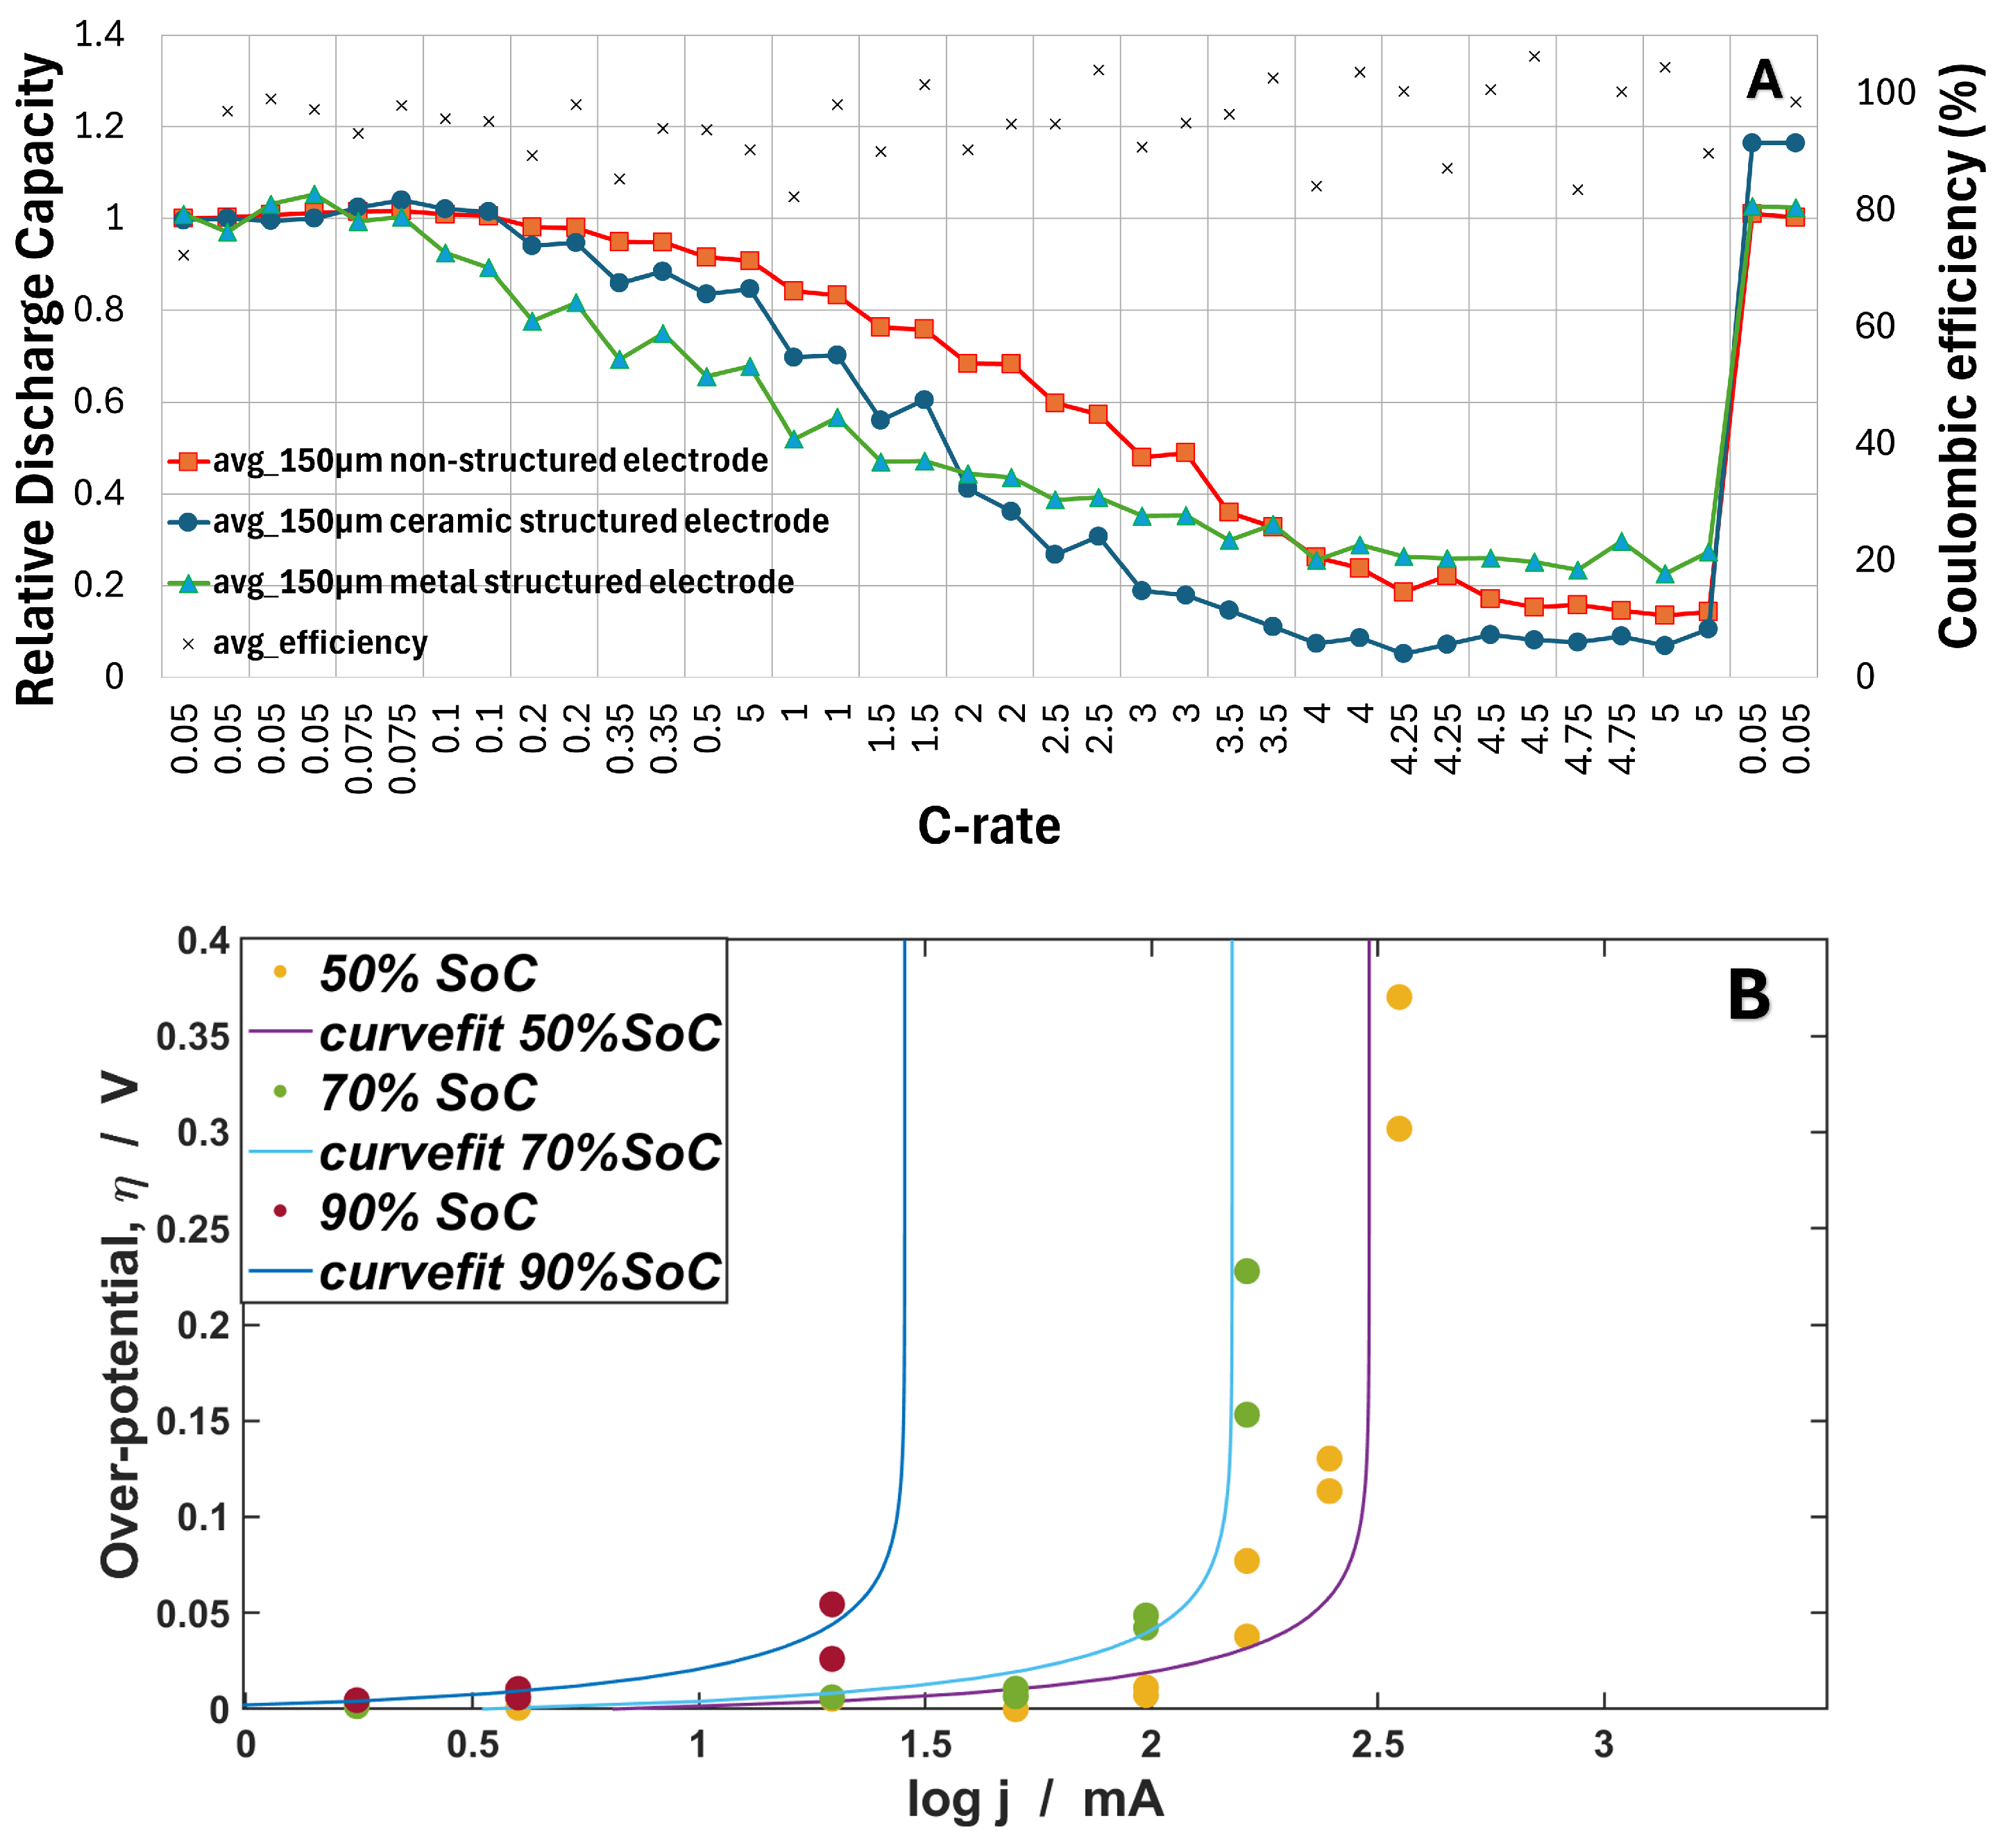
4.2. Rate Capacity Retention Analysis

Clear trends can be observed when comparing the structured electrodes to the unstructured ones in Figure 5 and Figure 6. The structured electrodes showed a significant improvement in rate capacity retention at high C-rates. The thinner structured electrodes showed a slight improvement in rate capacity retention at C-rates ranging from 1C to 3C, whereas the thicker structured electrodes showed a slight decrease in rate capacity retention at the aforementioned medium C-rates.
A potential effect of imperfect mechanical structuring is that it could lead to the excessive removal of the active material by penetrating through the whole electrode, even completely through to the current collector in some areas. This is supported by the data when comparing the thinner with the thicker electrodes, and can be seen on some of the thinner electrodes. The thicker structured electrodes do not have the same decrease in capacity retention at low C-rates, which could indicate potentially more active material was removed.
Another interesting takeaway is the apparent higher fluctuation in values for the structured electrodes. A likely reason for this could be the lack of uniformity in the structures. Some electrodes will have had more uniform structures facilitating faster lithium-ion transport, whereas some other electrodes will have had less uniform structures causing a larger variation in results compared to the unstructured electrodes.
As described in Section 2.2, the effective mass transport coefficient is found at the limiting current density, when the concentration at the surface is zero. Figure B in Figure 5 and Figure 6 shows the concentration overpotential plotted against the current density for the relevant SOCs. The curve fits of the data in these figures illustrate how to find the concentration overpotentials for the electrodes.
As observed in Figure 5 and Figure 6, the coulombic efficiency sometimes exceeds 100%. This is a consequence of cycling and switching C-rates. As the cycle charges and discharges and the available capacity changes (due to rate capacity retention) and these numbers are compared (charging at low C-rate and discharging at consequently higher C-rate or vice versa), the coulombic efficiency fluctuates around 100%, overall having an average coulombic efficiency of 100%. Moreover, one can also see that the coulombic efficiency increases as the battery cylces. This is an effect from wetting, leading to lowered ohmic resistance, and therefore more charge being exchanged within the cycling window, as is shown in Figure 1.
Figure 5 and Figure 6 also show that at a lower SOC, the cell potential reaches the lower cycle window potential. Due to the discharge method, CC discharge, the (re-)charging values are not practical to obtain and compare as there has not been a rest by CV discharge and thus the concentration distributions around the electrodes are very unstable. This would also lead to the capacity retention phenomenon being non-existent.

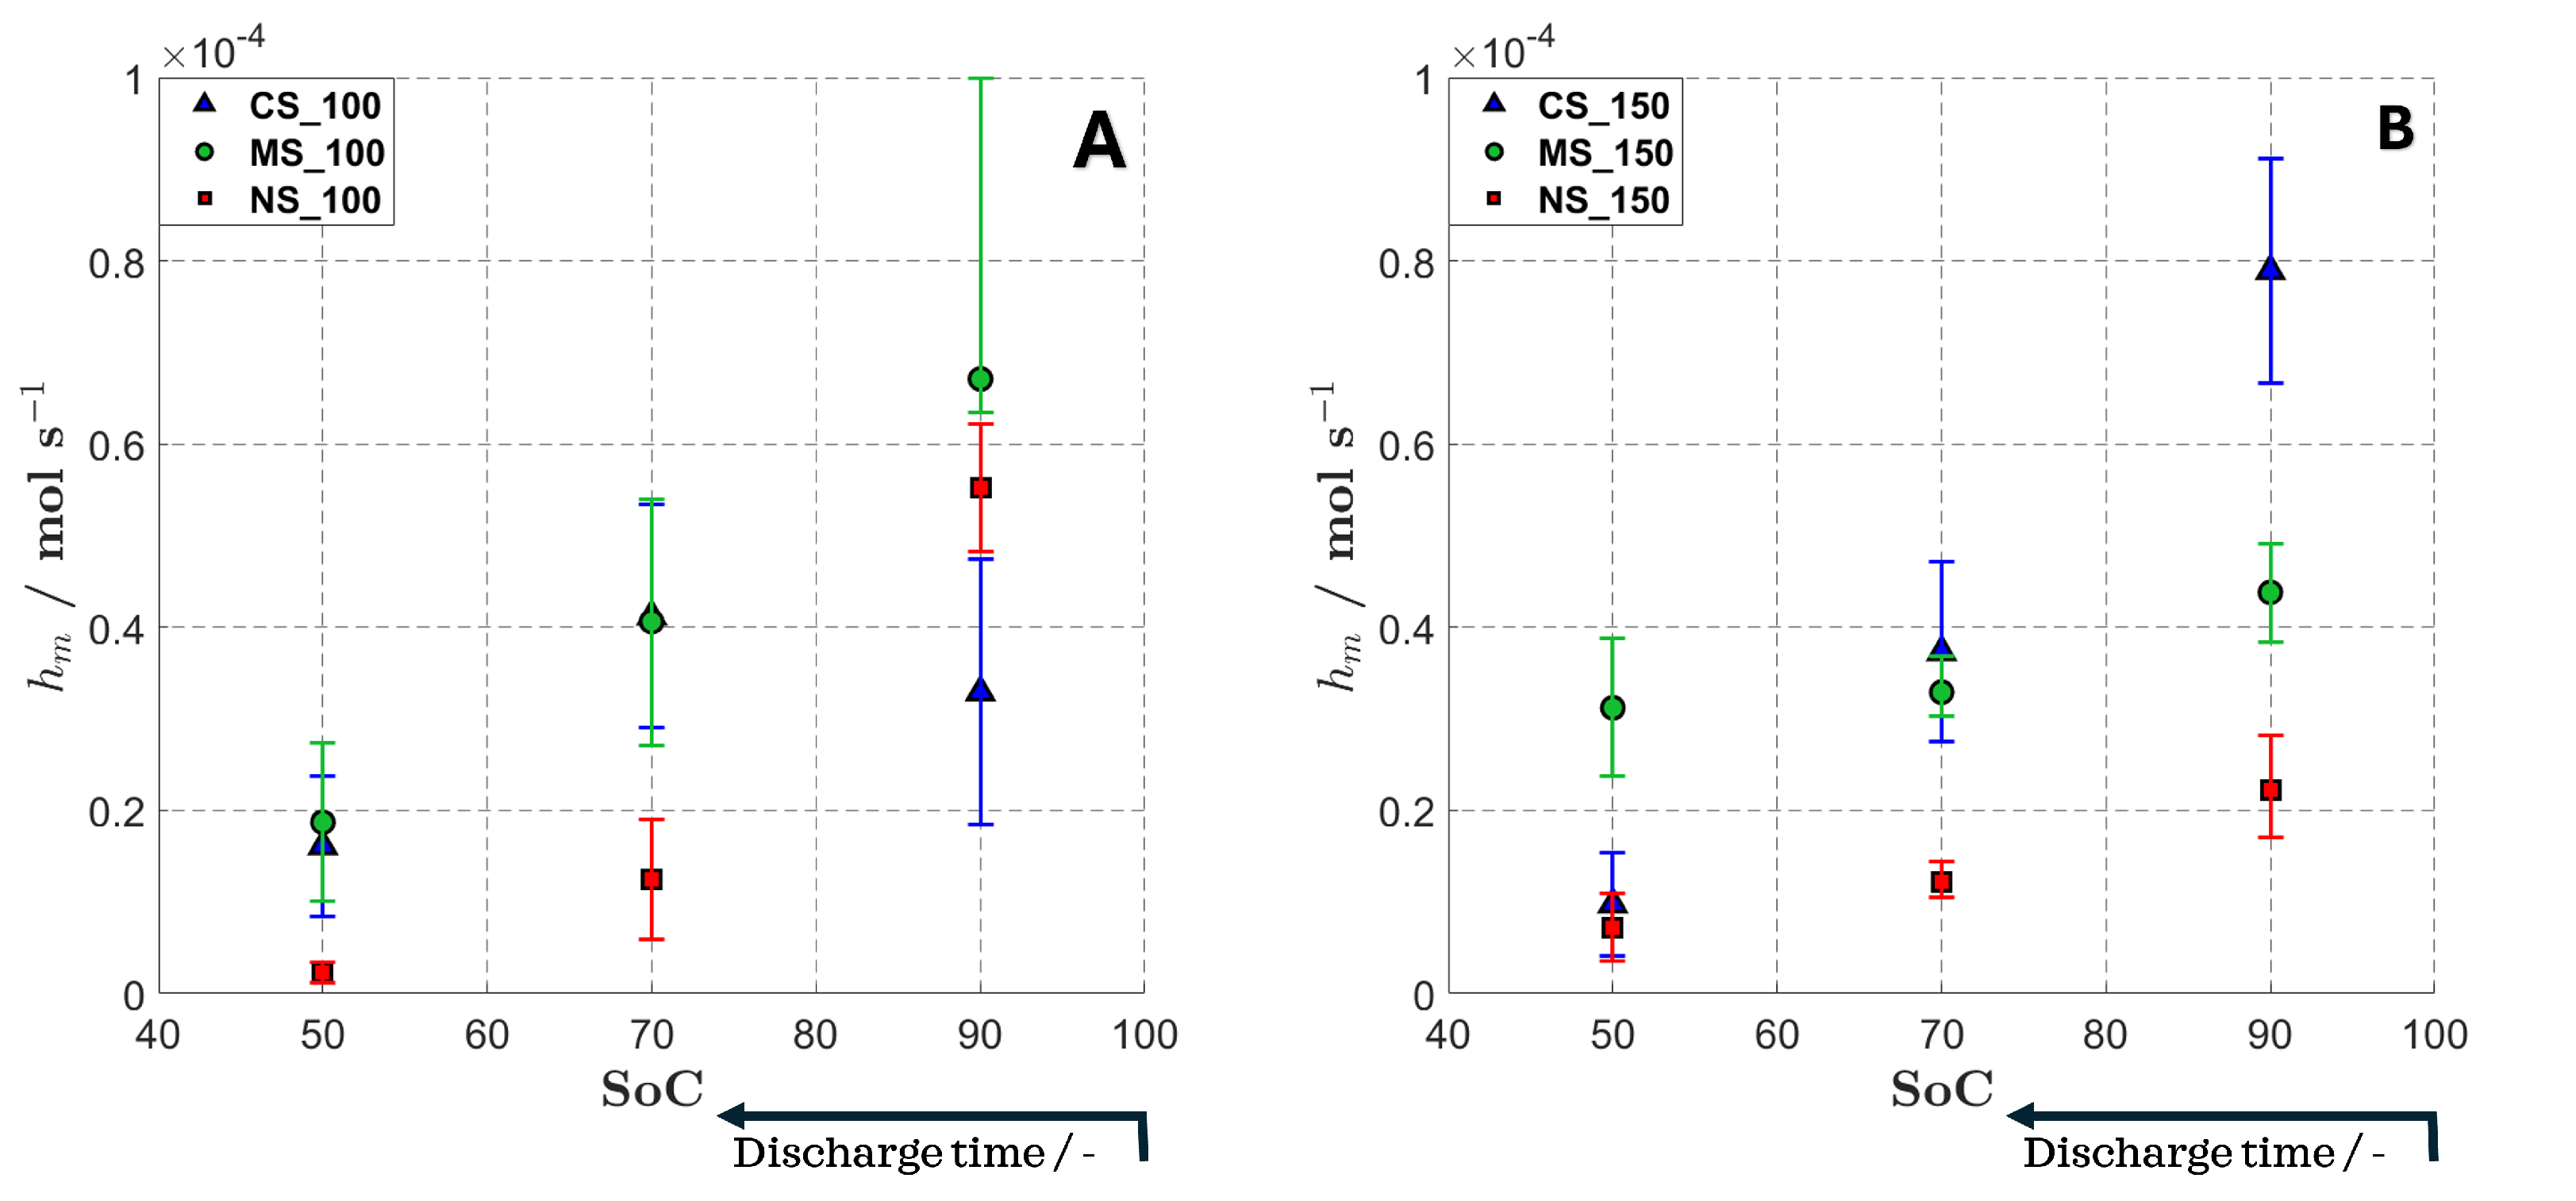
4.3. Effective Mass Transfer Coefficient Analysis

The following analysis presents the effective mass transfer coefficient, h m , at various states of charge for 100 μ m and 150 μ m thick electrodes. The SOCs used in this analysis were 50, 70 and 90 percent. These SOCs provide an adequate spread of the values of h m to observe the change in the effective mass transfer coefficient under the discharge of a battery.
As the SOC increases, h m increases; this is shown in Figure 7. At higher SOCs, there is generally more uncertainty in h m , which is shown by the larger error bars. This uncertainty is most likely due to increased noise as stationary diffusion regions have not yet developed. The red squares in Figure 7 show the results of the baseline electrode configuration without corrugations. These results are used as the baseline to compare against the structured electrodes of a similar thickness and observe the effect of corrugations on the effective mass transfer coefficients. Table 2 shows an overview of the effective mass transfer coefficients for the different electrode configurations.
Table 2 shows that the effective mass transfer coefficient is higher for the corrugated electrodes (blue triangles and green circles) than the unstructured electrode of the same thickness (red squares). These results correlate with the theory that corrugations and surface structures cause faster lithium-ion transportation and increased diffusivity, which corresponds to a higher effective mass transfer coefficient. The outlier here is the effective mass transfer coefficient at 90% SOC for the electrode of 100 μ m thickness with corrugations made with the ceramic structuring tool. The h m is lower than the corresponding value for the unstructured electrode of a similar thickness.
As a final remark to this study and the referenced works, it is important to note that the batteries and electrodes tested have only been been exposed to a few dozen charge–discharge cycles, meaning that the studies do not address how they perform after significant degradation. This represents an important opportunity for this field, as one needs to understand if the corrugations themselves sustain over hundreds of cycles, and also how discharge rate capability changes when, for example, batteries undergo electrolyte dry-out and loss of lithium inventory (LLI).

5. Conclusions

In this paper, we show how the rate capacity retention during discharge relates to mass transfer by diffusion. We show how this can be used in engineering models, using Fick’s first law of diffusion and Faraday’s law, to establish a system-specific effective mass transfer coefficient, h m .
Experimentally, we show how this effective mass transfer coefficient increases by creating corrugations or less porous regions in the electrode and that the corrugations impede the rate capacity retention effect, allowing for a higher capacity at fast discharge rates.
The effect of the corrugation inducing an increased effective mass transfer coefficient, h m , is not always visible, especially at a higher SOC. At a higher SOC and high C-rate, where the h m is determined, the time since starting the cycle is very short. Therefore, the diffusion regime has not yet developed to a stationary condition. As such, the mass transfer coefficient appears inconsistent. This is important to be aware of, as it shows a weakness of the proposed method; one must ensure that stationary diffusion conditions are established, and possibly wait to retrieve data that reach SOC levels lower than most certainly 90%. Here, we include data from a SOC of 90% to demonstrate that higher SOC levels, where stationary diffusion limitations are not yet established, should be avoided when using the proposed method.

Author Contributions

Conceptualisation, R.N.D., S.B.B.S., M.N.A., E.R.E., J.J.L. and O.B.; methodology, R.N.D., S.B.B.S. and O.B.; software, R.N.D. and S.B.B.S.; validation, R.N.D., S.B.B.S. and O.B.; formal analysis, R.N.D., S.B.B.S. and O.B.; investigation, R.N.D., S.B.B.S., M.N.A., E.R.E., J.J.L. and O.B.; data curation, R.N.D. and E.R.E.; writing—original draft preparation, R.N.D., S.B.B.S., M.N.A., E.R.E., J.J.L. and O.B.; writing—review and editing, R.N.D., S.B.B.S., M.N.A., E.R.E., J.J.L. and O.B.; visualisation, R.N.D. and O.B.; supervision, S.B.B.S., E.R.E. and O.B.; project administration, O.B.; funding acquisition, O.B. All authors have read and agreed to the published version of the manuscript.

Funding

This research was funded by the Research Council of Norway, grant number 324077.

Data Availability Statement

The original contributions presented in the study are included in the article, further inquiries can be directed to the corresponding author.

Acknowledgments

The authors would like to acknowledge the help of Anders Nielsen in obtaining experimental results for this work.

Conflicts of Interest

The authors declare no conflicts of interests.

References

  1. Burheim, O. Engineering Energy Storage, 1st ed.; Academic Press: Cambridge, MA, USA, 2017. [Google Scholar]
  2. Orangi, S.; Manjong, N.; Clos, D.P.; Usai, L.; Burheim, O.S.; Strømman, A.H. Historical and prospective lithium-ion battery cost trajectories from a bottom-up production modeling perspective. J. Energy Storage 2024, 76, 109800. [Google Scholar] [CrossRef]
  3. Orangi, S.; Manjong, N.B.; Clos, D.P.; Burheim, O.S.; Strømman, A.H. A Bottom-Up Framework to Investigate Environmental and Techno-Economic Aspects of Lithium-Ion Batteries: A Case Study of Conventional vs. Pre-Lithiated Lithium-Ion Battery Cells. J. Clean. Prod. 2024, 478, 143934. [Google Scholar] [CrossRef]
  4. Spitthoff, L.; Shearing, P.R.; Burheim, O.S. Temperature, Ageing and Thermal Management of Lithium-Ion Batteries. Energies 2021, 14, 1248. [Google Scholar] [CrossRef]
  5. Singh, M.; Kaiser, J.; Hahn, H. Thick Electrodes for High Energy Lithium Ion Batteries. J. Electrochem. Soc. 2015, 162, A1196. [Google Scholar] [CrossRef]
  6. Xie, W.; Zhang, Z.; Gao, X. Understanding the limitations of thick electrodes on the rate capability of high-energy density lithium-ion batteries. Electrochim. Acta 2024, 493, 144396. [Google Scholar] [CrossRef]
  7. Zhu, P.; Slater, P.R.; Kendrick, E. Insights into architecture, design and manufacture of electrodes for lithium-ion batteries. Mater. Des. 2022, 223, 111208. [Google Scholar] [CrossRef]
  8. Ye, G.; Tong, W.; Liu, X.; Song, X.; Zhou, J.; Zhou, X. An analytical method for the optimization of pore network in lithium-ion battery electrodes. Chem. Eng. Res. Des. 2019, 149, 226–234. [Google Scholar] [CrossRef]
  9. Li, J.; Liang, X.; Panat, R.; Park, J. Enhanced battery performance through three-dimensional structured electrodes: Experimental and modeling study. J. Electrochem. Soc. 2018, 165, A3566. [Google Scholar] [CrossRef]
  10. Gao, T.; Lu, W. Physical model and machine learning enabled electrolyte channel design for fast charging. J. Electrochem. Soc. 2020, 167, 110519. [Google Scholar] [CrossRef]
  11. Kraft, L.; Habedank, J.B.; Frank, A.; Rheinfeld, A.; Jossen, A. Modeling and simulation of pore morphology modifications using laser-structured graphite anodes in lithium-ion batteries. J. Electrochem. Soc. 2020, 167, 013506. [Google Scholar] [CrossRef]
  12. Chen, K.H.; Namkoong, M.J.; Goel, V.; Yang, C.; Kazemiabnavi, S.; Mortuza, S.; Kazyak, E.; Mazumder, J.; Thornton, K.; Sakamoto, J.; et al. Efficient fast-charging of lithium-ion batteries enabled by laser-patterned three-dimensional graphite anode architectures. J. Power Sources 2020, 471, 228475. [Google Scholar] [CrossRef]
  13. Goel, V.; Chen, K.H.; Dasgupta, N.P.; Thornton, K. Optimization of laser-patterned electrode architectures for fast charging of Li-ion batteries using simulations parameterized by machine learning. Energy Storage Mater. 2023, 57, 44–58. [Google Scholar] [CrossRef]
  14. Sui, C.; Li, Y.Y.; Li, X.; Higueros, G.; Wang, K.; Xie, W.; Hsu, P.C. Bio-Inspired Computational Design of Vascularized Electrodes for High-Performance Fast-Charging Batteries Optimized by Deep Learning. Adv. Energy Mater. 2022, 12, 2103044. [Google Scholar] [CrossRef]
  15. Miyamoto, K.; Broderick, S.; Rajan, K. Three-dimensional microbattery design via an automatic geometry generator and machine-learning-based performance simulator. Cell Rep. Phys. Sci. 2021, 2, 100504. [Google Scholar] [CrossRef]
  16. Wang, J.; Sun, Q.; Gao, X.; Wang, C.; Li, W.; Holness, F.B.; Zheng, M.; Li, R.; Price, A.D.; Sun, X.; et al. Toward high areal energy and power density electrode for Li-ion batteries via optimized 3D printing approach. ACS Appl. Mater. Interfaces 2018, 10, 39794–39801. [Google Scholar] [CrossRef]
  17. Hu, J.; Jiang, Y.; Cui, S.; Duan, Y.; Liu, T.; Guo, H.; Lin, L.; Lin, Y.; Zheng, J.; Amine, K.; et al. 3D-printed cathodes of LiMn1-xFexPO4 nanocrystals achieve both ultrahigh rate and high capacity for advanced lithium-ion battery. Adv. Energy Mater. 2016, 6, 1600856. [Google Scholar] [CrossRef]
  18. Plateau, T.P.; Pham, H.; Zhu, Y.; Leu, M.; Park, J. Enabling Ultrathick Electrodes via a Microcasting Process for High Energy and Power Density Lithium-Ion Batteries. Adv. Energy Mater. 2022, 12, 2201353. [Google Scholar] [CrossRef]
  19. Jang, D.; Suh, S.; Yoon, H.; Kim, J.; Kim, H.; Baek, J.; Kim, H.J. Enhancing rate capability of graphite anodes for lithium-ion batteries by pore-structuring. Appl. Surf. Sci. Adv. 2021, 6, 100168. [Google Scholar] [CrossRef]
  20. Tran, M.X.; Smyrek, P.; Park, J.; Pfleging, W.; Lee, J.K. Ultrafast-Laser Micro-Structuring of LiNi0.8Mn0.1Co0.1O2 Cathode for High-Rate Capability of Three-Dimensional Li-ion Batteries. Nanomaterials 2022, 12, 3897. [Google Scholar] [CrossRef]
  21. Lu, L.L.; Lu, Y.Y.; Xiao, Z.J.; Zhang, T.W.; Zhou, F.; Ma, T.; Ni, Y.; Yao, H.B.; Yu, S.H.; Cui, Y. Wood-inspired high-performance ultrathick bulk battery electrodes. Adv. Mater. 2018, 30, 1706745. [Google Scholar] [CrossRef]
  22. Chen, C.; Zhang, Y.; Li, Y.; Kuang, Y.; Song, J.; Luo, W.; Wang, Y.; Yao, Y.; Pastel, G.; Xie, J.; et al. Highly conductive, lightweight, low-tortuosity carbon frameworks as ultrathick 3D current collectors. Adv. Energy Mater. 2017, 7, 1700595. [Google Scholar] [CrossRef]
  23. Keilhofer, J.; Schaffranka, L.W.F.; Wuttke, A.; Günter, F.J.; Hille, L.; Dorau, F.A.; Daub, R. Mechanical Structuring of Lithium-Ion Battery Electrodes Using an Embossing Roller. Energy Technol. 2023, 11, 2200869. [Google Scholar] [CrossRef]
  24. Bryntesen, S.N.; Finne, P.H.; Svensson, A.M.; Shearing, P.R.; Tolstik, N.; Sorokina, I.T.; Vinje, J.; Lamb, J.J.; Burheim, O.S. Structured aqueous processed lignin-based NMC cathodes for energy-dense LIBs with improved rate capability. J. Mater. Chem. A 2023, 11, 6483–6502. [Google Scholar] [CrossRef]
  25. Bryntesen, S.N.; Tolstorebrov, I.; Svensson, A.M.; Shearing, P.; Lamb, J.J.; Burheim, O.S. Introducing lignin as a binder material for the aqueous production of NMC111 cathodes for Li-ion batteries. Mater. Adv. 2023, 4, 523–541. [Google Scholar] [CrossRef]
  26. Vogt, M.; Buchholz, C.; Thiede, S.; Herrmann, C. Energy efficiency of Heating, Ventilation and Air Conditioning systems in production environments through model-predictive control schemes: The case of battery production. J. Clean. Prod. 2022, 350, 131354. [Google Scholar] [CrossRef]
  27. Vogt, M.; Dér, A.; Khalid, U.; Cerdas, F.; Herrmann, C. Model-based planning of technical building services and process chains for battery cell production. J. Clean. Prod. 2022, 370, 133512. [Google Scholar] [CrossRef]
  28. Park, J.; Hyeon, S.; Jeong, S.; Kim, H.J. Performance enhancement of Li-ion battery by laser structuring of thick electrode with low porosity. J. Ind. Eng. Chem. 2019, 70, 178–185. [Google Scholar] [CrossRef]
  29. Park, J.; Song, H.; Jang, I.; Lee, J.; Um, J.; Bae, S.g.; Kim, J.; Jeong, S.; Kim, H.J. Three-dimensionalization via control of laser-structuring parameters for high energy and high power lithium-ion battery under various operating conditions. J. Energy Chem. 2022, 64, 93–102. [Google Scholar] [CrossRef]
  30. Gebrekiros Berhe, M.; Oh, H.G.; Park, S.K.; Mondal, M.; Lee, D. Effect of laser-induced groove morphology on the wettability and performance of Lithium-ion batteries. Mater. Des. 2023, 231, 112020. [Google Scholar] [CrossRef]
  31. Park, D.; Lee, D. Effect of Fluence and Multi-Pass on Groove Morphology and Process Efficiency of Laser Structuring for 3D Electrodes of Lithium-Ion Batteries. Materials 2021, 14, 1283. [Google Scholar] [CrossRef]
  32. Jung, T.; Wang, A.A.; Monroe, C.W. Overpotential from Cosolvent Imbalance in Battery Electrolytes: LiPF6 in EMC:EC. ACS Omega 2023, 8, 21133–21144. [Google Scholar] [CrossRef]
  33. Kane, S.; Ulrich, R.; Harrington, A.; Stadie, N.P.; Ryan, C. Physical and chemical mechanisms that influence the electrical conductivity of lignin-derived biochar. Carbon Trends 2021, 5, 100088. [Google Scholar] [CrossRef]
  34. Chakar, F.S.; Ragauskas, A.J. Review of current and future softwood kraft lignin process chemistry. Ind. Crops Prod. 2004, 20, 131–141. [Google Scholar] [CrossRef]
  35. Thakur, V.K.; Thakur, M.K.; Raghavan, P.; Kessler, M.R. Progress in Green Polymer Composites from Lignin for Multifunctional Applications: A Review. ACS Sustain. Chem. Eng. 2014, 2, 1072–1092. [Google Scholar] [CrossRef]
  36. Kai, D.; Tan, M.J.; Chee, P.L.; Chua, Y.K.; Yap, Y.L.; Loh, X.J. Towards lignin-based functional materials in a sustainable world. Green Chem. 2016, 18, 1175–1200. [Google Scholar] [CrossRef]
  37. Doherty, W.O.S.; Mousavioun, P.; Fellows, C.M. Value-adding to cellulosic ethanol: Lignin polymers. Ind. Crops Prod. 2011, 33, 259–276. [Google Scholar] [CrossRef]
  38. Bresser, D.; Buchholz, D.; Moretti, A.; Varzi, A.; Passerini, S. Alternative binders for sustainable electrochemical energy storage—The transition to aqueous electrode processing and bio-derived polymers. Energy Environ. Sci. 2018, 11, 3096–3127. [Google Scholar] [CrossRef]
Figure 1. Sketches of the recorded potential as a function of discharged capacity during discharge (A), and the recorded relative capacity as a function of cycle number (B). Figure (B) shows relative nominal discharge capacity on the y-axis, the measurement number on the x-axis, and has the different C-rates indicated on each measurement point.
Batteries 10 00364 g001
Figure 2. The method applied in this study, showing cell potential as a function of C-rate (A), the measured non-ohmic overpotential as a function of the logarithm of the current density alongside a possible Tafel fit (B), the inclusion of the BV and Tafel overpotentials showing that the overpotential is not charge-transfer-related (C), and finally, the assessed effective mass transfer coefficient for every rate (D).
Batteries 10 00364 g002
Figure 3. Image showing the structuring tools used during the coating process.
Batteries 10 00364 g003
Figure 4. The figures above are three images of an electrode surface. Figure (A) shows an SEM image of an unstructured electrode surface taken at 120-times magnification with an acceleration voltage of 13 kV. Figure (B) shows an SEM image of a structured electrode surface taken at 150-times magnification with an acceleration voltage of 13 kV. Figure (C) shows an SEM image of a structured electrode surface taken at 350-times magnification with an acceleration voltage of 13 kV.
Batteries 10 00364 g004
Figure 5. Figure (A) shows relative discharge capacity and coulombic efficiency against C-rate of the different electrode configurations of 100 μ m thick electrodes. The unstructured electrodes are denoted by a red square. The electrodes with line corrugations made by the ceramic blade structuring tool are denoted by a blue triangle. The electrodes with line corrugations made by the metal blade structuring tool are denoted by a green circle. Figure (B) shows how the overpotentials are found at the limiting current density for different SOCs.
Batteries 10 00364 g005
Figure 6. Figure (A) shows relative discharge capacity and coulombic efficiency against C-rate of the different electrode configurations of 150 μ m thick electrodes. The unstructured (NS) electrodes are denoted by a red square. The electrodes with line corrugations made by the ceramic blade structuring tool (CS) are denoted by a blue triangle. The electrodes with line corrugations made by the metal blade structuring tool (MS) are denoted by a green circle. Figure (B) shows how the overpotentials are found at the limiting current density for different SOCs.
Batteries 10 00364 g006
Figure 7. Figure (A) displays the effective mass transfer coefficient plotted against the state of charge for electrodes of 100 μ m thickness. Figure (B) displays the effective mass transfer coefficient plotted against the state of charge for electrodes of 150 μ m thickness. Each figure consists of three electrode configurations with different colours and symbols. The unstructured electrodes (NS) are denoted by a red square. The electrodes with line corrugations made by the ceramic blade structuring tool (CS) are denoted by a blue triangle. The electrodes with line corrugations made by the metal blade structuring tool (MS) are denoted by a green circle.
Batteries 10 00364 g007
Table 1. Chemicals used during cathode production.
ChemicalStateFunctionSupplierDensity
NMC111PowderActive materialTargray2.3
Carbon blackPowderConductive additiveImerys1.9
LigninPowderBinderSigma Aldrich1.3
Distillied waterLiquidSolvent--
Lignin + waterMixture---
Table 2. Overview of obtained mass transfer coefficients.
Configuration100 μm150 μm
SOC/%507090507090
h P l a i n / 10 5 mol s 1 0.12–0.340.59–1.904.82–6.220.35–1.091.05–1.441.71–2.82
h C e r a m i c / 10 5 mol s 1 0.89–2.382.91–5.341.84–4.740.41–1.542.75–4.716.68–9.12
h S t e e l / 10 5 mol s 1 1.01–2.742.71–5.416.30–9.962.37–3.883.03–3.683.84–4.43
Disclaimer/Publisher’s Note: The statements, opinions and data contained in all publications are solely those of the individual author(s) and contributor(s) and not of MDPI and/or the editor(s). MDPI and/or the editor(s) disclaim responsibility for any injury to people or property resulting from any ideas, methods, instructions or products referred to in the content.

