1. Introduction
With the over-reliance on fossil fuels, environmental issues have become increasingly severe, resulting in rising emissions of pollutants and global temperatures [
1]. To address these challenges, electric vehicles (EVs) have emerged as a sustainable alternative, gaining widespread attention [
2]. Countries such as China, the United States, Norway, and Germany are actively promoting the adoption of EVs to alleviate environmental stress and foster the development of clean energy and green transportation [
3].
Battery technology is a core component of modern energy systems, playing a critical role in EVs and renewable energy storage [
4]. Lithium-ion batteries (LIBs), known for their high energy density, lightweight design, and long lifespan, have driven large-scale innovation and application of renewable energy in recent years [
5]. As transportation electrification accelerates, EVs are primary beneficiaries of LIB technology, marking a significant transition towards sustainable mobility [
6]. However, the continuous operation of LIBs leads to gradual and irreversible performance degradation, mainly due to fluctuations in temperature, charge/discharge rates, and extreme environmental conditions [
7]. This degradation is characterized by irregular capacity decline, presenting challenges in evaluating the battery’s state of health (SOH), a critical metric for assessing battery safety and performance [
8]. Accurate SOH assessment not only enhances operational efficiency but also significantly reduces maintenance costs, making it a vital direction for sustainable battery technology development [
9]. The accurate estimation of SOH is crucial for practical applications, as it directly impacts the energy storage levels and driving range of EVs. When the SOH does not meet operational requirements, timely battery replacement and recycling of retired battery packs can reduce resource consumption, energy use, and pollution emissions [
10]. To this end, researchers have explored various SOH estimation methods to meet the needs of different applications. These methods can be categorized based on their technical principles into direct measurement techniques, model-based approaches, and data-driven methods [
11].
1.1. Direct Measurement Techniques
Direct measurement techniques assess the SOH of batteries through the physical examination of battery components. Among these, electrochemical impedance spectroscopy (EIS) is a widely used method known for its high accuracy, although it can be time-consuming and invasive. Research has shown that EIS can significantly enhance diagnostic accuracy for LIBs. For instance, Galatro et al. [
12] validated the performance and degradation data of lithium iron phosphate and nickel manganese cobalt (NMC) batteries, demonstrating good consistency between predicted and actual capacity decay. The modified single-particle model (MSPM), proposed by Galatro et al., couples an electrochemical reduced-order model with EIS as a performance degradation model. Their verification results show that the root mean square error (RMSE) of the aging component ranged between 1.4% and 6.8%, highlighting the crucial role of EIS in analyzing battery health in depth. Similarly, Pang et al. [
13] proposed a method based on the ratio between the real part of the Nyquist plot zero-crossing and the real part of the low-frequency bend of the Nyquist plot, which was verified through various battery experiments. The results showed an average relative error of 4.46%. These direct measurement methods are simple in principle but come with higher measurement costs, and offline measurement methods face difficulties in real-time tracking of battery health status. Pang et al.’s EIS-based method using parameter nSOH estimation can estimate battery SOH with minimal error by disregarding changes in the battery’s state of charge under certain conditions, showing great potential for practical SOH estimation. Furthermore, scholars [
14] have reviewed the principles and applications of EIS, focusing on its use in diagnosing battery SOH. These studies indicate that despite its complexity, EIS offers significant advantages in accurately diagnosing battery health.
1.2. Model-Based Methods
Model-based methods, such as equivalent circuit models and incremental capacity analysis (ICA), provide estimates of battery SOH by balancing accuracy and computational efficiency, making them suitable for real-time applications. Research indicates that these models perform excellently in SOH estimation. Shehla et al. [
15] proposed a lithium-ion battery SOH estimation method based on the 2-RC model, capable of capturing battery degradation over time and temperature changes with high accuracy and generality. Compared to other models, the 2-RC model, which is based on the Thevenin equivalent electrical circuit (EEC) and incorporates the Arrhenius equation, better captures battery dynamics while significantly reducing computational cost and RMSE. For the Center for Advanced Life Cycle Engineering (CALCE) dataset, the RMSE of the test data was 0.0535 and 0.0722. Additionally, Zexin Huang et al. [
16] introduced an adaptive piecewise equivalent circuit model (PECM) combined with an extended Kalman filter (EKF), achieving estimation errors of less than 2%. Schaltz et al. [
17] demonstrated the feasibility of the ICA method in real electric vehicle (EV) applications, with SOH estimation RMSEs of 1.33% for NMC and 2.92% for lithium manganese oxide (LMO) battery types. Shaofei Qu et al. [
18] proposed a fast and efficient online estimation method for lithium-ion battery SOH based on ICA, which uses the relationship between SOH and the voltage-capacity difference (dQ/dV) under different states of charge (SOC). The method achieved an estimation error within 5%, with an average absolute error of 1.08%. Furthermore, ICA has shown excellent performance in monitoring battery health. For instance, Schaltz et al. [
17] explored the feasibility of ICA in EVs, demonstrating its efficiency and accuracy in estimating the health state of LIBs. Qu et al. [
18] proposed a rapid and efficient online SOH estimation method for lithium batteries using ICA, employing the dQ/dV curve during the charging process, significantly reducing estimation time and achieving high-precision real-time health state monitoring. These studies suggest that despite the need for extensive calibration, model-based methods remain highly effective in practical applications.
1.3. Data-Driven Methods
Data-driven methods leverage machine learning algorithms to predict the health state of batteries from large datasets. Due to their adaptability and ability to handle complex nonlinear patterns, these methods have gained increasing attention. Research shows that data-driven methods excel in battery health state estimation. For example, Li et al. [
19] proposed an aging feature extraction method based on an electrochemical model (EM) to estimate the SOH of LIBs. This method combines the internal health features (IHFs) of the EM with multi-stage external health features (EHFs) extracted from voltage-temperature curves, utilizing machine learning algorithms to construct a data-driven SOH estimation model. It effectively enhances estimation accuracy across different application scenarios. In another approach, Li Xining et al. used the IHF and EHF of batteries to train data-driven models in different application scenarios, applying various machine learning algorithms to build SOH estimation models. Their results showed that using the random forest (RF) machine learning algorithm, the RMSE of online SOH estimation with IHF was 0.20%. Khaleghi Sahar et al. [
20] proposed a prognostics and health management (PHM) method that can estimate the SOH of untrained battery cells, with a maximum RMSE of 0.61. Kara et al. [
21] employed the convolutional neural network (CNN)–long short-term memory (LSTM) method to predict battery data from the National Aeronautics and Space Administration (NASA), and achieved an RMSE of 0.93%. These data-driven methods generally require a large amount of data to support the model and result in relatively high accuracy, but they also demand substantial computational power. Another study [
20] introduced a novel lithium-ion battery health management approach that estimates SOH and predicts remaining useful life (RUL) based on health indicators (HIs) extracted from partial charging voltage curves. This method has been validated to accurately estimate the SOH of previously unseen new batteries (with a maximum error of 0.61) and predict RUL (with a maximum error of 110 cycles), demonstrating high precision, generality, and potential for online management. Kara [
21] combined CNN, LSTM, and classical neural networks into a hybrid deep neural network for RUL prediction. This approach extracts spatiotemporal relationships from multivariate time series data and captures nonlinear features, enabling more accurate RUL predictions and highlighting its effectiveness in handling complex battery data. These studies indicate that although data-driven methods require large amounts of high-quality data to ensure reliability, they offer significant advantages in processing complex data and improving predictive accuracy.
Based on the overview of battery SOH research methods, direct measurement techniques such as EIS are recognized for their high accuracy but are limited in rapid application due to their time-consuming and invasive nature. Model-based methods, particularly the ICA, are valued for balancing accuracy and computational efficiency in real-time applications. ICA efficiently evaluates battery SOH by analyzing dQ/dV curves during the charging process, demonstrating high effectiveness and broad applicability. While this method requires adaptation to environmental conditions such as temperature and charging rates and demands high-quality data, its rapid response capability makes it highly promising for practical applications. In contrast, data-driven methods can handle complex nonlinear data and provide high-precision predictions, but they rely heavily on large training datasets and have lower model interpretability.
In industrial applications, ICA stands out by analyzing the relationship between voltage and capacity increments during battery charge–discharge cycles. Its development focuses on enhancing robustness to environmental changes and reducing dependence on high-quality data. The implementation of ICA involves high computational complexity and resource demands, which can be challenging in real-time or resource-constrained environments. To improve its practicality, regular model calibration and updates are necessary to accommodate parameter drift over long-term use, optimize data collection and processing methods, and reduce computational burdens through algorithmic improvements.
This study aims to improve the stability and accuracy of ICA in evaluating battery SOH. Addressing the sensitivity of traditional ICA to data fluctuations, this paper proposes a new strategy by redefining the selection criteria for influencing factors. By analyzing the relationship between capacity increments (dQ) and voltage changes (dV) during charging and discharging, we extract key feature points and curve characteristics. This approach not only reduces dependency on computational resources but also enhances the precision of battery health assessments. In doing so, the research extends the applicability of ICA and provides a more efficient and practical technique for optimizing battery management systems and predicting battery lifespan, offering significant research value and practical relevance.
1.4. Organization and Structure
The remaining sections of this paper are structured as follows.
Section 2 describes the data used and the relevant analysis methods.
Section 3 then presents preliminary trends and analysis.
Section 4 focuses on simplifying health features and analyzing charge and discharge conditions. In
Section 5, the construction of rules and validation of models are detailed, and the validation process for building models is outlined, with the results being compared to assess their accuracy and relative error.
Section 6 further discusses the feasibility and necessity of impedance secondary correction as a means of improving model prediction. In addition, the capacity rules are further verified, and the results are compared with the current mainstream methods. Finally,
Section 7 summarizes the paper.
3. Preliminary Trends and Analysis
Figure 2a,b show the variations in charging current and terminal voltage over time for battery #5 under different cycles. The analysis of these graphs reveals significant performance degradation characteristics after multiple charge–discharge cycles. As the cycle number increases, the battery reaches the maximum charging voltage of 4.2 V earlier during the constant current charging phase, resulting in a significant reduction of this phase. This phenomenon is mainly due to increased internal resistance, which reduces the battery’s ability to accept current in the constant current phase. Additionally, the effective charging capacity decreases, requiring less time to reach the cutoff voltage. During the constant voltage charging phase, the current gradually decreases; however, due to reduced electrochemical activity and increased internal loss caused by aging, this phase becomes longer. This indicates a slower rate of charge absorption, necessitating more time to complete charging, highlighting the degradation in the battery’s chemical and physical properties.
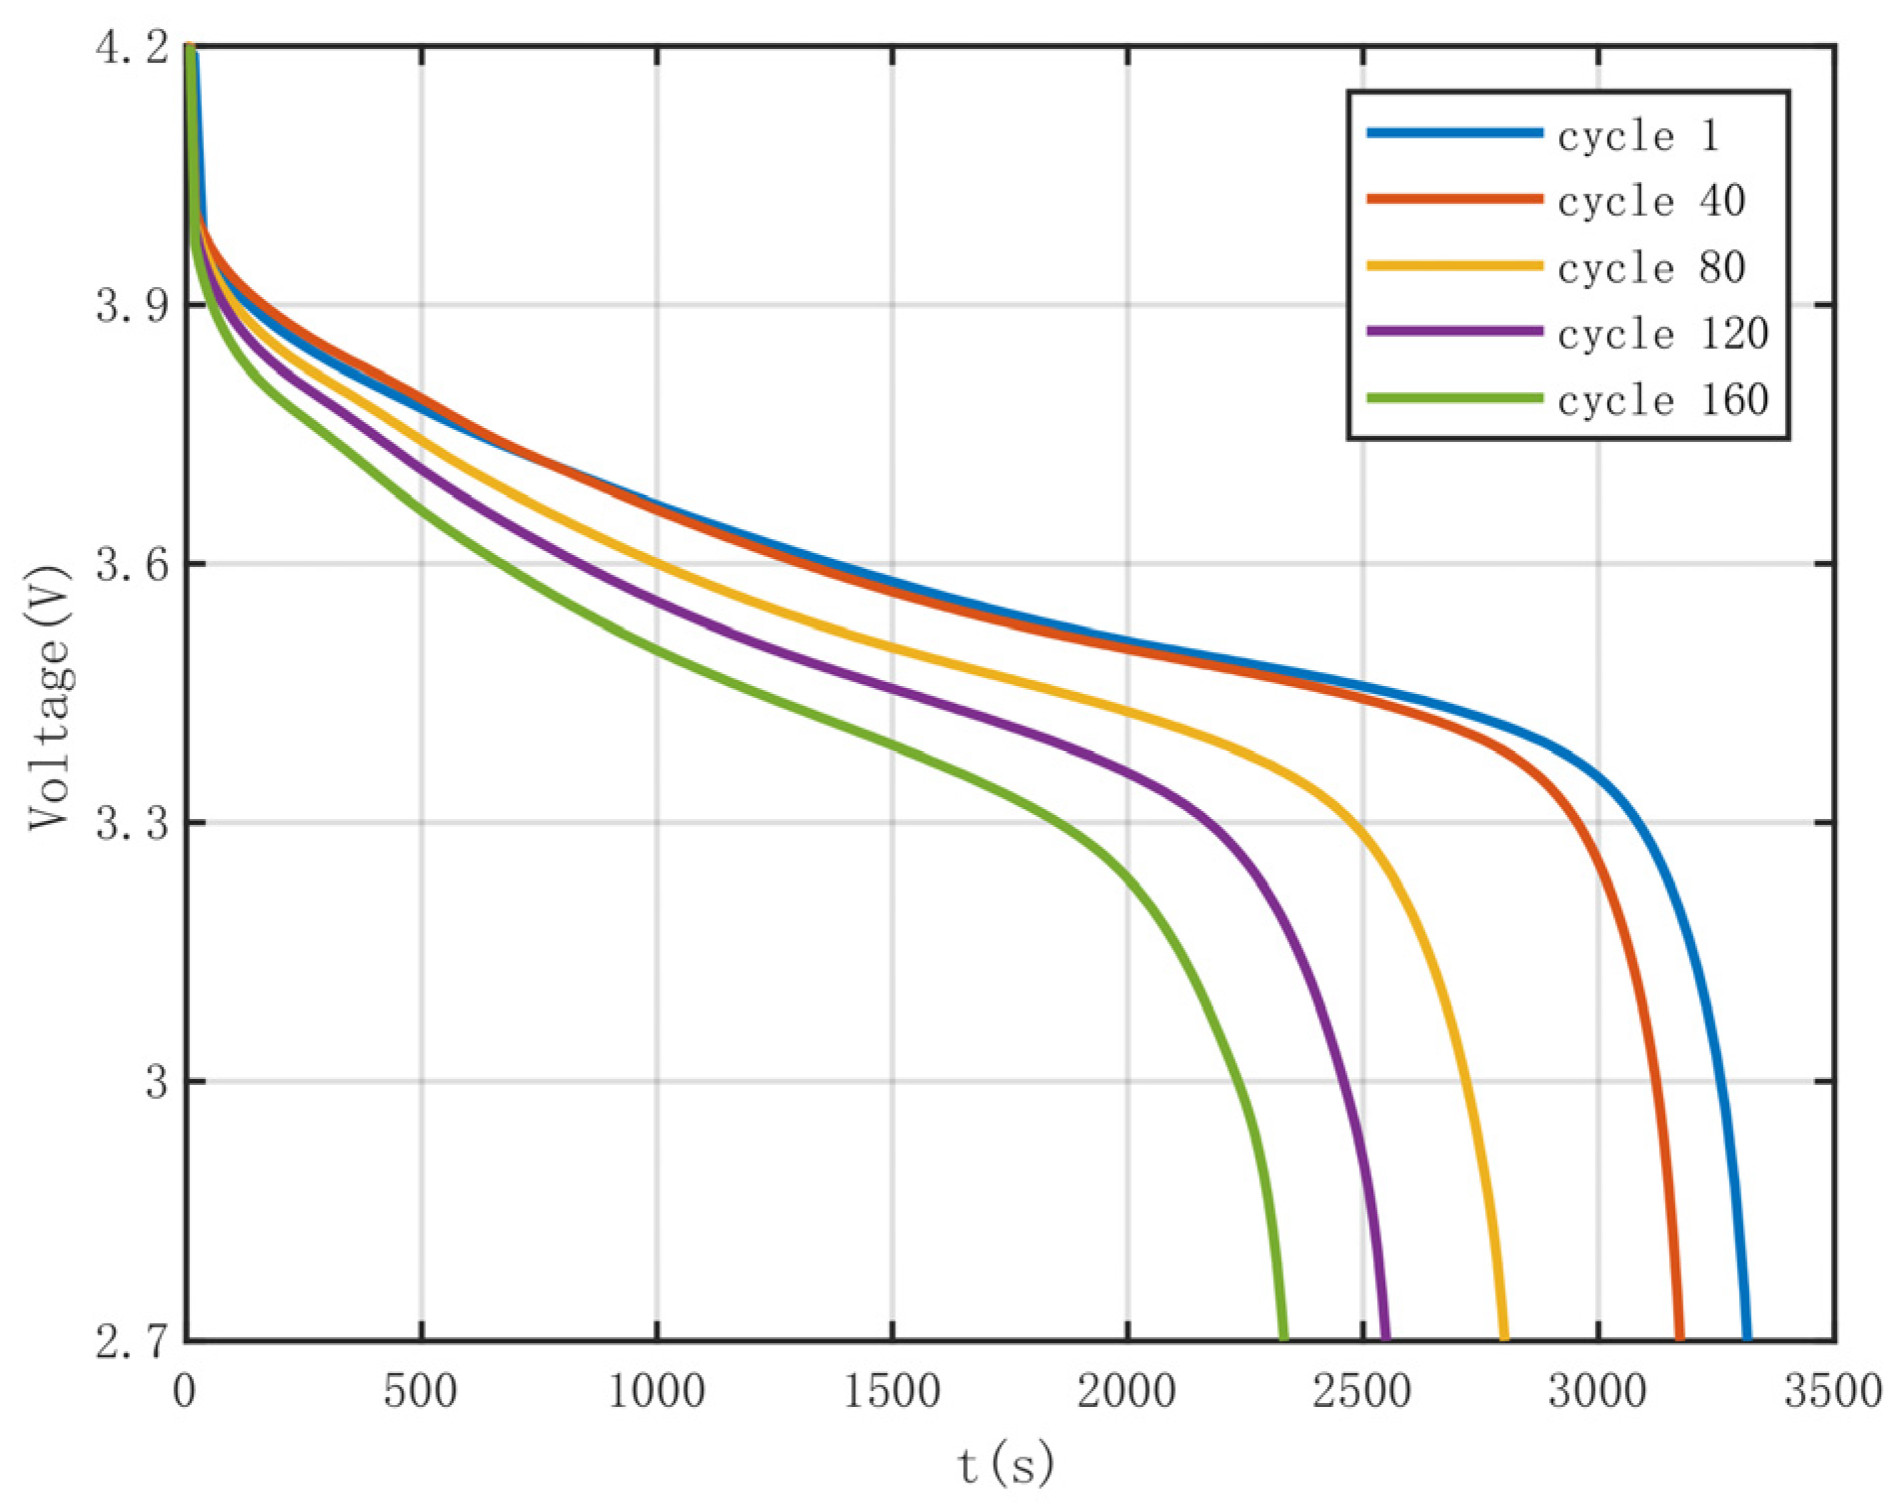
Figure 3 presents the variations in discharge terminal voltage over time for battery #5 under different cycles. It shows that as the cycle number increases, the terminal voltage drops to 2.7 V earlier, reflecting the performance degradation of the battery. This is primarily driven by several factors: first, capacity fade reduces the ability to store and release energy, causing voltage to drop quickly during discharge; second, increased internal resistance, particularly due to elevated electrolyte interface impedance and reduced electrolyte conductivity, results in a more pronounced voltage drop during discharge; third, the exacerbation of polarization effects, including electrochemical and concentration polarization, accelerates the voltage decline; finally, physical and chemical changes in the electrochemically active materials weaken the efficiency of the electrochemical reactions.
Figure 4a,b depict the relationship between terminal voltage and charged–discharged capacity under different cycles. The data show that significant changes in charge occur in the 3.8–4.2 V range, while the discharge capacity varies greatly in the 3.2–4.0 V range. This indicates substantial behavioral changes in the battery near the end of charging. As the cycle number increases, the actual capacity reduction leads to a decrease in the amount of charge that can be stored. This is mainly due to several factors: capacity degradation from active material loss and electrolyte decomposition, increased internal resistance that limits the charging rate at high voltages, and exacerbated polarization effects, which reduce charging efficiency at high voltages.
Figure 5a illustrates the IC curve during the charging process for battery #5. In this analysis, the voltage reference sequence starts at 3.4 V and ends at 4.2 V, with a voltage interval of 10 mV.
Figure 5b shows the IC curve for the discharge process, where the voltage reference sequence starts at 2.7 V and ends at 4.2 V, with a voltage interval of 30 mV.
The reasons for selecting voltage intervals of 10 mV for charging and 30 mV for discharging are as follows: as depicted in
Figure 6, during the 10th cycle, IC curves were plotted using voltage intervals of 5 mV, 10 mV, and 30 mV for charging, and 15 mV, 30 mV, and 50 mV for discharging. It can be observed that smaller voltage intervals introduce significant noise in the IC curves, while larger intervals, although smoother, may result in loss of detail. To balance noise reduction and feature retention, 10 mV and 30 mV were chosen as the voltage intervals for the charging and discharging processes, respectively.
Since the method for plotting IC curves involves a smoothing process similar to filtering, the window size should not be too large to ensure adequate resolution for observing subtle changes in battery performance. As shown in
Figure 7, increasing the window size can cause the filtered curve to lose features and deviate from the original data trajectory, introducing additional bias. Therefore, to accurately reflect battery performance, the window size parameter, M, is set to 3.
Figure 8a illustrates the variation trends of HI during the charging lifecycle of the battery. Three specific voltage ranges were selected for analysis: 3.8–4.1 V, 3.8–3.9 V, and 3.9–4.1 V, which form the basis for constructing three HI indicators: HIcharge1, HIcharge2, and HIcharge3. Correspondingly,
Figure 8b presents the variation trends of HI during the discharging lifecycle. The selected voltage ranges for this phase were 3.21–3.99 V, 3.21–3.69 V, and 3.69–3.99 V, from which three HI indicators were derived: HIdischarge1, HIdischarge2, and HIdischarge3. These indicators correspond to the respective voltage intervals, providing specific quantifiable standards for assessing battery health status.
As shown in
Figure 8a, during the charging phase, the voltage range for HIcharge2 corresponds to the region of Peak I. Its rate of change differs significantly before and after cycle 80 because the IC curve’s Peak I gradually diminishes during this period, resulting in reduced area change, which subsequently lowers the HIcharge2 rate of change. The voltage range for HIcharge3 corresponds to Peak II. In the IC curve, during the early cycles, Peak II only experiences a decrease in peak value, while in later cycles, it exhibits both peak value reduction and peak shift (which typically reflects increased battery impedance). This results in minimal area change for Peak II in the early cycles, thus rendering HIcharge3 relatively flat initially. The voltage range for HIcharge1 encompasses both Peaks I and II, combining the characteristics of HIcharge2 and HIcharge3, leading to a relatively stable change in HIcharge1 during the early cycles, an increased rate of change in the mid-cycles, and a reduced rate of change in the later cycles.
As illustrated in
Figure 8b, during the discharging phase, HI1, HI2, and HI3 all show initially gradual changes, with their rates of change becoming more stable and slightly increasing in the mid-to-late cycles. This is because the initial overlap of curves in the early cycles results in minimal area change, leading to a lower rate of change in HI. However, as the curves overlap less and show a clear decline in the mid-to-late cycles, the rate of change in HI increases compared to the early half. Specifically for HI2, in its voltage range, the curve at low voltage shows an increase with more cycles, which partially counteracts the decrease in area (though this is not dominant, as the overall trend is still downward). This results in a slightly lower rate of change in HI2 compared to HI3 in the mid-to-late cycles, although this distinction might not be very pronounced in
Figure 8b.
The methodology outlined in this paper can be briefly illustrated by the flowchart in
Figure 9. For both the charging and discharging phases, the reference voltage sequence’s starting and ending voltages were determined based on the variation range of the terminal voltage. The voltage interval was adjusted accordingly, followed by smoothing the curve using the moving average filtering method to complete the IC curve plot. Based on the IC curve analysis and the relationship between the charge/discharge quantity and terminal voltage, suitable integration intervals were selected to construct the three different HI zones.
The research plan is outlined as follows, in
Figure 9: Initially, the study analyzes the relationship curves between HI and battery capacity, using the Pearson correlation coefficient to verify the reliability of their linear relationship. To simplify the analysis, the HI1 sequence is selected as the representative feature indicator. Subsequently, the simplified HI sequence is weighted based on the actual charging and discharging ratios, producing a weighted HI sequence that better reflects real-world conditions. This weighted HI sequence is then thoroughly examined to explore its relationships with cycle count, capacity, and SOH in order to develop a generalizable mathematical model. The study assesses SOH using three different approaches and verifies their accuracy. Additionally, the feasibility and necessity of impedance correction for reducing errors are investigated to enhance prediction accuracy. Finally, the research analyzes and compares the error performance of different methods. This research plan aims to provide a systematic approach to improving the precision and reliability of battery health assessment.
4. Simplification of Health Features and Analysis of Charge and Discharge Conditions
4.1. Simplification of Health Features
To further explore the correlation between health features and battery capacity, the study plots the relationship between health features and actual battery capacity during charge and discharge cycles, as shown in
Figure 10. The figure reveals an approximately linear correlation between the extracted health features and battery capacity. This data analysis allows for a deeper discussion of the effectiveness of health feature parameters in predicting battery remaining life and health status and how these parameters can improve the accuracy and reliability of battery management systems in practical applications. These findings provide robust data support and theoretical foundations for our research.
To quantify the relationship between health features and battery capacity, Pearson correlation analysis was applied to the health feature sequences constructed during the charge and discharge processes. As shown in
Table 1, the Pearson coefficients for health indicators HI1, HI2, and HI3 during charging were 0.9968, 0.9828, and 0.9942, respectively. During discharging, these coefficients were 0.9999, 0.9987, and 0.9988, respectively. Given the high correlation shown by the health feature sequences constructed across three different voltage ranges, it is particularly noteworthy that health features in broader voltage ranges (such as those of HI1) demonstrate a wider range of variation, encapsulating richer battery information without increasing data processing complexity. Therefore, to reduce data dimensionality and identify key variables affecting health status, it is concluded that the HI1 indicator effectively reflects the changes in actual battery capacity.
4.2. Analysis of Charge and Discharge Conditions
When analyzing battery HI for EVs, it is necessary to consider that vehicles undergo both stationary charging and driving discharge phases, with the driving discharge phase also involving energy recovery through regenerative braking systems. Therefore, it is essential to assign different weights to the health feature sequences of the charging and discharging phases. According to the 2023 China New Energy Vehicle Big Data Research Report [
29], household cars have an average of 21.7 driving days per month and an average daily driving time of 2.2 h. The weekly charging frequency is 1.9 times, with fast charging accounting for 37.9%. Assuming each fast charge lasts 1 h and each slow charge lasts 10 h, the total weekly charging time is 12.52 h. Calculated over four weeks per month, the total charging time is 50.08 h, while the total monthly driving time is 47.74 h. Therefore, the proportion of time spent in the charging phase is approximately 0.51, while the discharging phase accounts for approximately 0.49.
Further analysis using New European Driving Cycle (NEDC) dynamic driving condition test data for EVs [
30] estimates that the regenerative braking phase accounts for approximately 17% of the total driving phase. Consequently, for household EVs, the weighted proportion for the charging phase is 0.5933, and the weighted proportion for the discharging phase (excluding regenerative braking) is 0.4067.
Ultimately, this weighting method establishes a comprehensive health indicator sequence that considers both charging and discharging phases, expressed as
This weighted approach reflects the evaluation of battery health status in actual use, aligning more closely with the daily operation of EVs and the actual load conditions of the battery.
The study uses 18650-type NCA batteries from the NASA dataset, with the charging phase lasting approximately 10,000 s and the discharging phase about 3500 s. Although this duration is relatively short compared to modern battery operation cycles, the charging process closely mirrors commonly used charging methods, including constant current and constant voltage phases. Since this phased charging pattern aligns with real-world conditions, the method still effectively reflects the actual charging and discharging processes of current batteries, despite the shorter durations. Moreover, by extracting health feature sequences during charging and discharging and adjusting them based on real-world charge–discharge ratios, the method’s broader applicability is ensured.
For discharging, the study is based on a fixed discharge current to validate the method’s feasibility and accuracy under constant current conditions. However, recognizing that discharge currents vary dynamically in real-world applications, this study proposes strategies to adapt to such variations by optimizing the algorithm. For instance, statistical analysis can be employed to filter out extreme outliers and use the weighted average as the input discharge current. Additionally, adjusting the extraction of health features based on real-time current data can more accurately reflect the battery’s actual operating conditions. With proper calibration and optimization, this method can be effectively adapted to different discharge current conditions in future applications.
Regarding variations in charging current, this study is based on consistent charging current conditions, and the corresponding health features are extracted. In real-world scenarios, different charging currents can impact the battery’s health state. Therefore, by adjusting the parameters of the IC method, the approach can be adapted to account for such variations. A systematic study of battery behavior under different current conditions can reveal the relationship between charging current and health features, allowing the IC method to be flexibly adjusted to maintain prediction accuracy under varying charging current conditions.
5. Construction of Rules and Verification of Models
5.1. Construction of Rules
To verify the universality of the obtained health indicator (HI) sequence, an in-depth analysis was conducted using the charging and discharging data for battery #5. This analysis focused on the intrinsic relationships between the HI sequence (i.e., the HI weighted by charging and discharging proportions, hereafter referred to as “initial total HI”) and cycle count, capacity, and SOH. The goal was to construct an accurate mathematical model or empirical formula to represent these relationships.
5.1.1. Analysis of HI and Cycle Count
To eliminate the potential influence of different cutoff voltages on HI calculation, the initial total HI sequence was normalized by dividing it by the difference between its upper and lower cutoff voltages. Despite the batteries having the same nominal capacity and using the same EOL standard, their actual capacity ranges differed, leading to variations in HI ranges. Therefore, to ensure the constructed model’s universality, the normalized HI sequence was further relatively normalized by dividing each by the difference between their initial and final values. The resulting relationship between the processed HI and cycle count is shown in
Figure 11.
5.1.2. Analysis of HI and Capacity
To investigate whether the correlation between HI and capacity is general and systematic, the relationship between the initial total HI and capacity for different batteries was plotted, as shown in
Figure 12. In this dataset, the charging phase was processed similarly, with data5 and data6 undergoing 4 A discharges while the others used 2 A discharges. It can be observed that under the same experimental conditions, the relationship between HI and capacity for different batteries shows high consistency, albeit within different ranges. Thus, it is feasible to directly fit a curve to serve as a mathematical model or rule for the relationship between HI and capacity.
Among the 2 A discharge datasets, data1, data3, and data4 exhibit higher consistency, whereas data2 and data7 deviate slightly, possibly due to differences in internal resistance leading to battery variations. Under the same experimental conditions, different batteries demonstrate a similar functional relationship between HI and capacity. To construct a rule relating battery health status and capacity, a linear fit was performed on the HI and capacity data for battery #5 using the polyfit function. The fitting result is shown in
Figure 13, with the derived function expressed as follows:
The goodness-of-fit metrics are presented in
Table 2. These metrics indicate that the model possesses high predictive accuracy and explanatory power. Specifically, a smaller SSE implies lower model error, an R-square close to 1 indicates that the model explains most of the variability in the data, and the adjusted R-square accounts for the number of independent variables, ensuring the reliability of the model fit. A low RMSE further confirms the model’s predictive precision. Based on these goodness-of-fit indicators, it can be concluded that the model has an excellent fit and predictive accuracy.
5.1.3. Analysis of HI and SOH
To examine whether the correlation between HI and SOH exhibits generality and regularity, the relationship between the initial total HI and SOH for different batteries was plotted, as shown in
Figure 14. The charging phase underwent the same processing across the dataset, with data5 and data6 subjected to 4 A discharges while the others experienced 2 A discharges. It is evident that, under identical experimental conditions, the relationship between HI and SOH for different batteries shows a high degree of overlap, albeit with variations in range. This observation supports the potential for directly fitting a curve to serve as a mathematical model or rule for the relationship between HI and SOH.
Under consistent experimental conditions, the relationship between HI and SOH for different batteries also demonstrates similar functional relationships. To establish a rule connecting battery health status and SOH, a linear fit was performed on the HI and SOH data for battery #5. The fitting result is depicted in
Figure 15, with the derived function expressed as follows:
The goodness-of-fit metrics are presented in
Table 3. Based on these goodness-of-fit indicators, it can be concluded that the model exhibits an excellent fit and predictive accuracy.
5.2. Verification of Models
5.2.1. Estimation Using the Cycle Rule
To ensure consistent normalization across different batteries, the same starting voltage, ending voltage, voltage interval, moving window size, and area integration interval as those used for battery #5 were applied when calculating other batteries. Given the high cutoff voltage of battery #5 (2.7 V), it is reasonable to select voltages above the lower cutoff voltage of other batteries as the standard for choosing starting and ending voltages.
For the input prediction data, the same standardization and relative standardization processes used for battery #5 were applied. Since the initial cycle capacity during the experiment was not the rated capacity and varied among batteries, the difference in capacity between the input data and the reference data after standardization and relative standardization of the first cycle was used as a correction value. This allowed for the estimation of cycle number, capacity, and SOH, with results for battery #7 shown in
Figure 16a–c.
Analysis of
Figure 5a indicates that during cycles 60 to 80, the I peak gradually disappears. The HIcharge2, which includes only the HI changes associated with the I peak, shows a significant difference in the rate of change before and after cycle 80. This can lead to varying degrees of relative error in the initial estimation across different cycle number intervals. To address this, a second estimation may be considered to optimize results and reduce relative error. As shown in
Figure 16a, the initial cycle exhibits a large deviation due to the slow rate of capacity decay, while the HI fluctuates significantly over a short range. Mid-cycle predictions show good accuracy, but deviations increase in later cycles due to the rising cycle number and the appearance of sharp peaks, leading to fluctuations in the predicted values.
5.2.2. Estimation Using the Capacity Rule
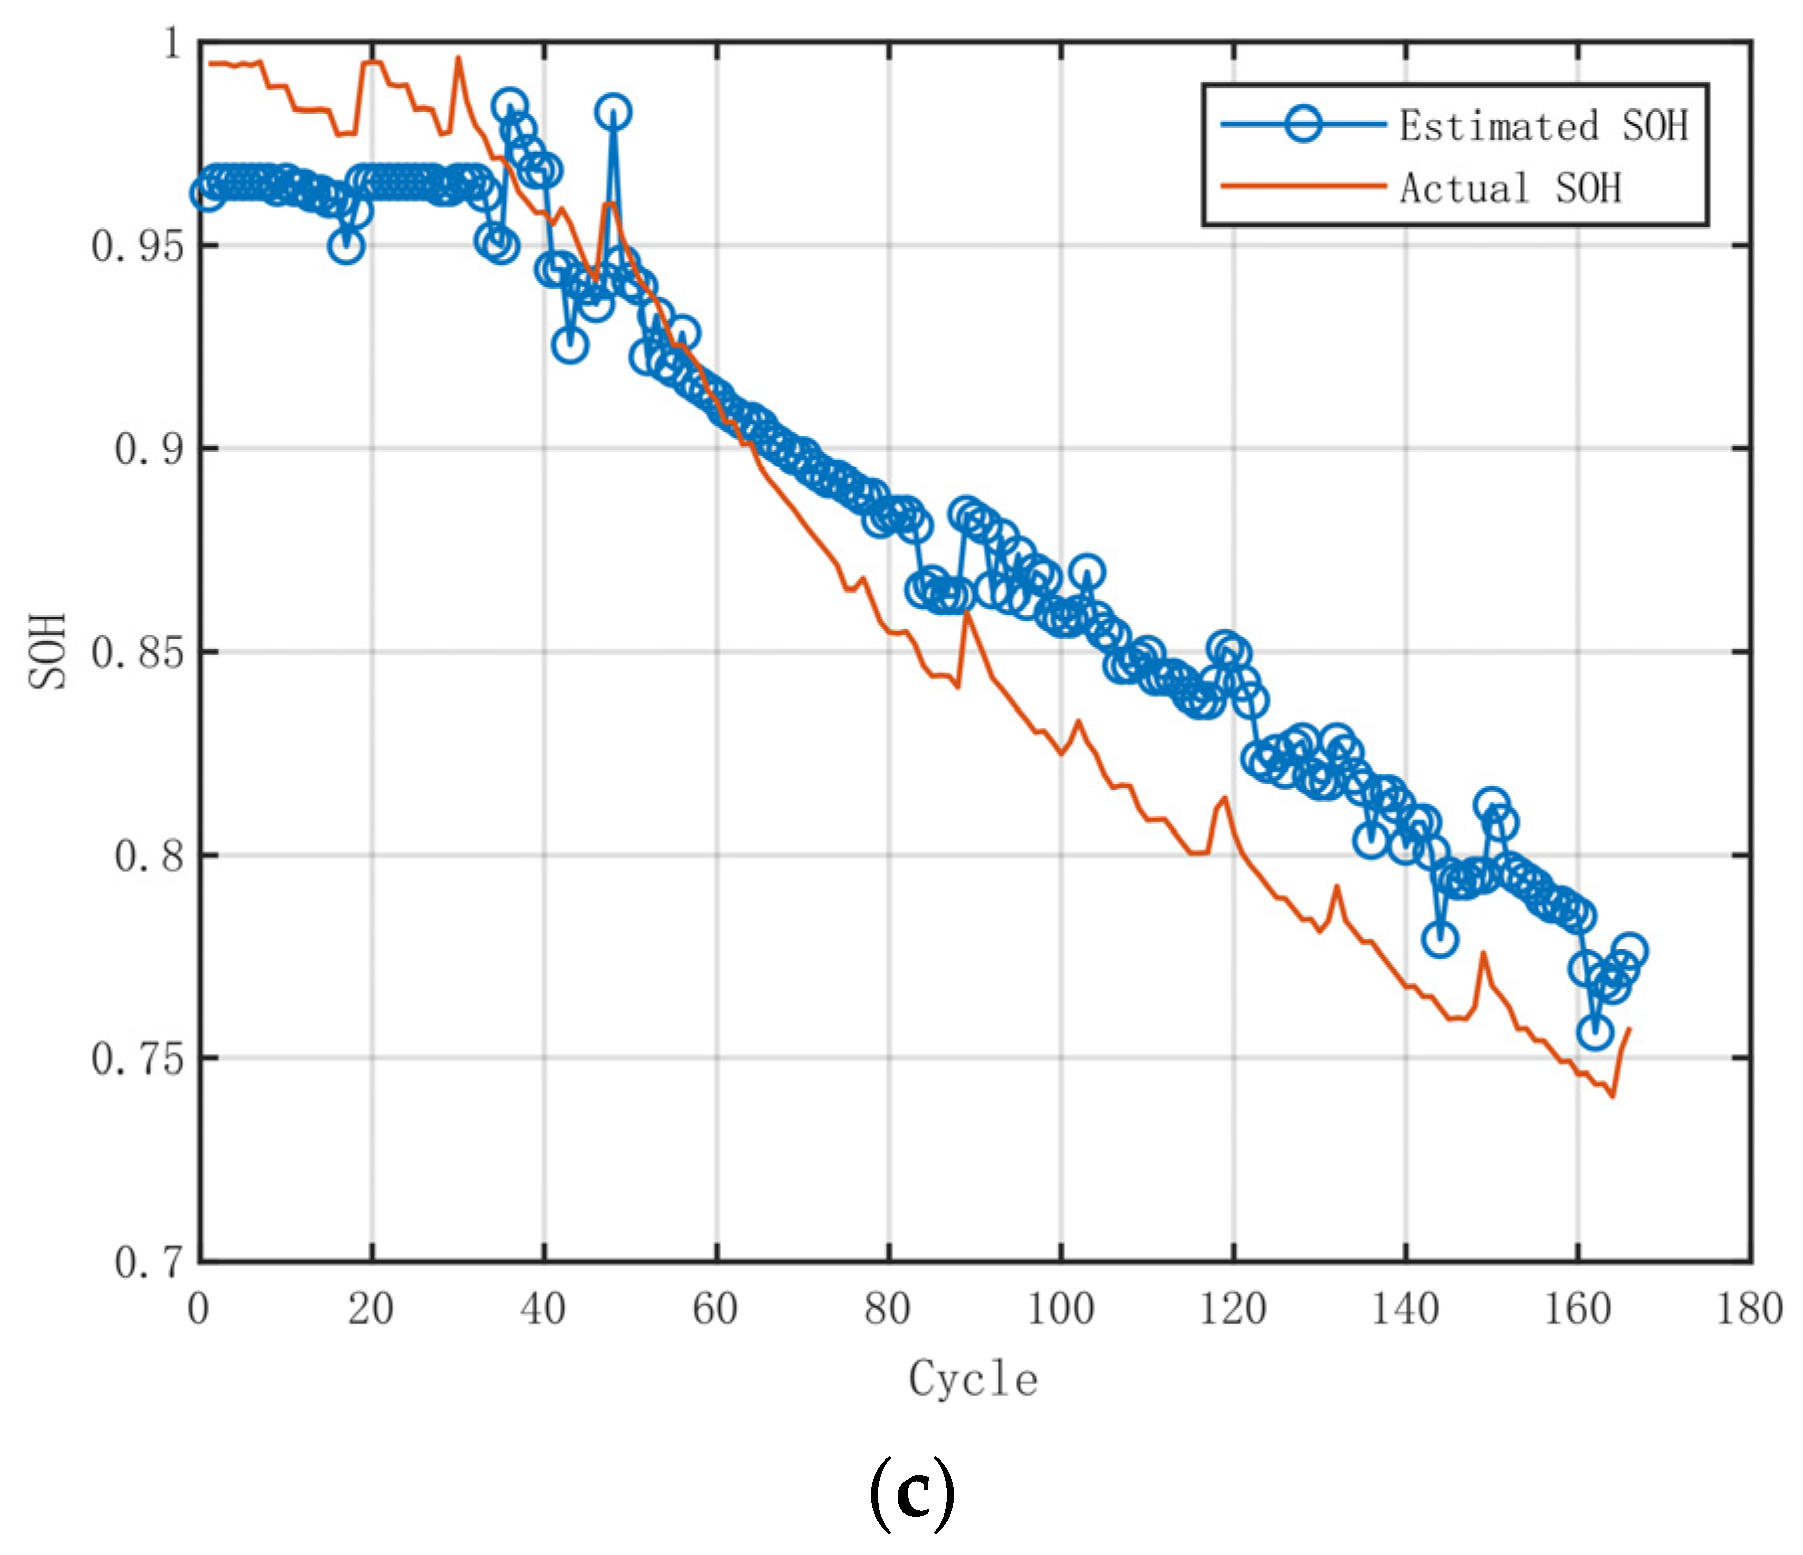
Using the derived capacity rule from battery #5, the capacity and SOH of battery #7 were estimated, with results displayed in
Figure 17a,b. The estimated values show good overall consistency with the actual values, particularly during the mid and late cycle stages, indicating that the fitting model accurately captures the battery’s capacity degradation trend. However, some deviation is observed in the early cycles, likely due to the slower initial capacity decay rate and significant fluctuations in HI over a short interval, which increases the error. Overall, the model effectively estimates the actual battery capacity in most cases, confirming the reliability and accuracy of the health feature extraction and fitting methods.
5.2.3. Estimation Using the SOH Rule
Using the derived SOH rule from battery #5, the SOH of battery #7 was estimated, as shown in
Figure 18. The estimation demonstrates good accuracy in the early cycles, with increased error in the mid-cycles, and stabilizes in the later cycles. Overall, the model’s performance indicates its potential for effectively estimating SOH, although further refinement may be needed to address mid-cycle discrepancies.
5.3. Results Comparison and Relative Error Analysis
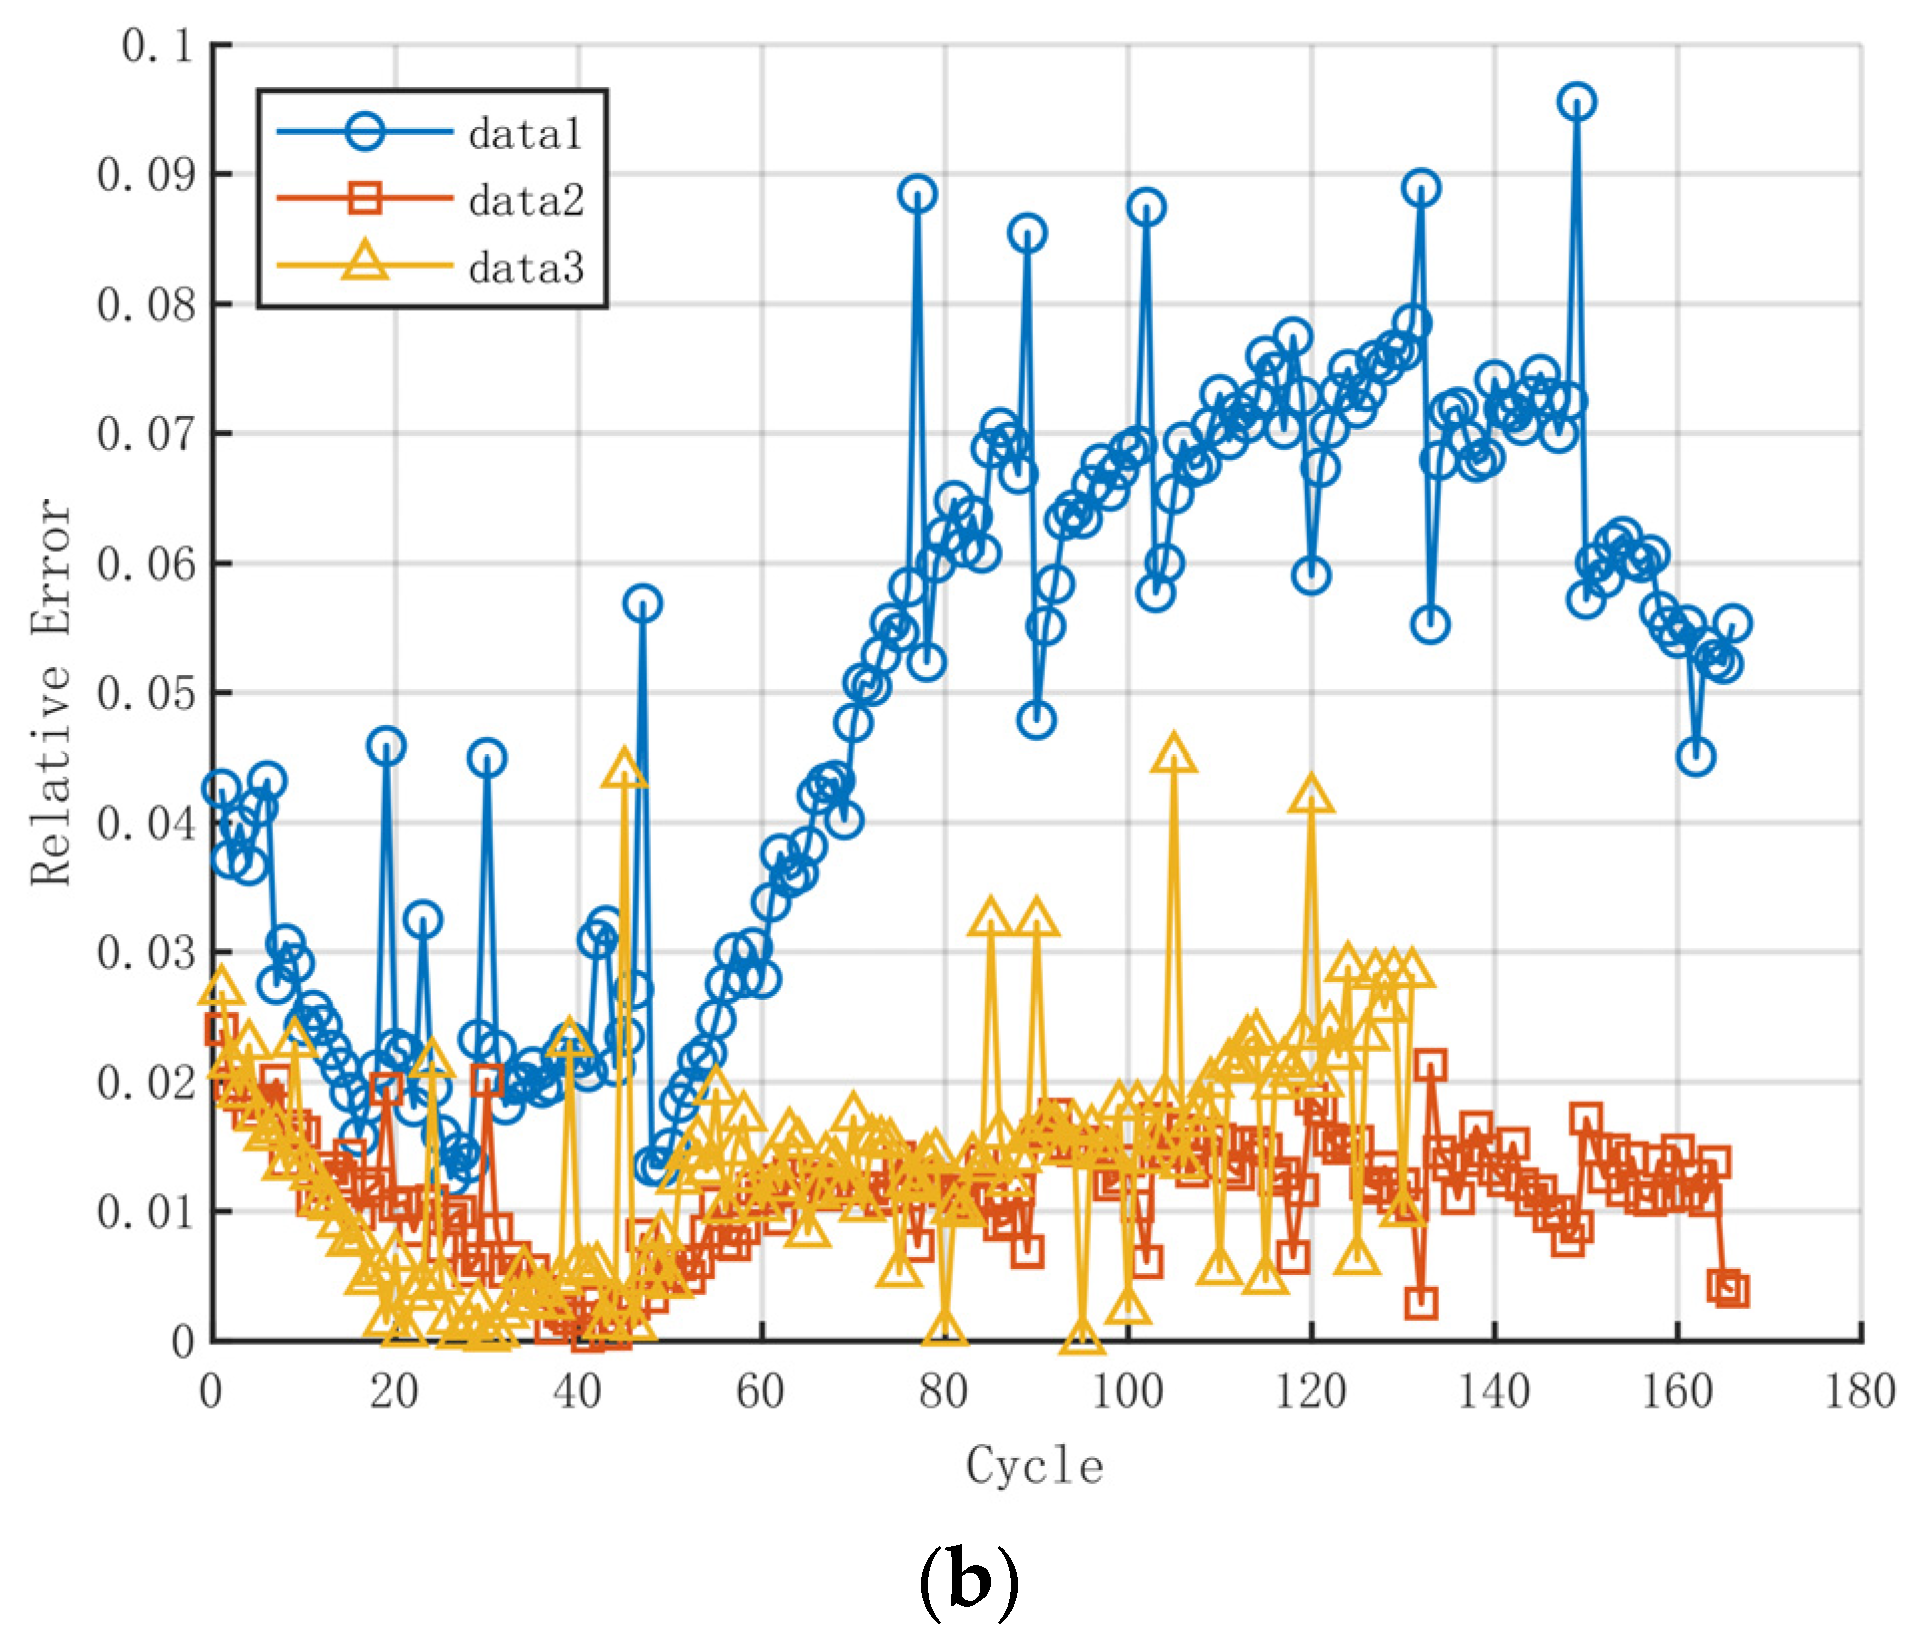
To visually evaluate and compare the differences among the three estimation methods, after applying smoothing (window size = 3), the relationship between relative error and cycle number is illustrated in
Figure 19. The analysis reveals the following:
Estimation Using Cycle Rule: This method exhibits significant fluctuations in relative error between consecutive cycles, indicating its sensitivity to short-term SOH changes and its potential inability to consistently capture the continuous trend of SOH. Generally, the relative error decreases initially, then increases to a certain level, followed by fluctuations.
Estimation Using Capacity Rule: Compared to the cycle rule, the capacity rule shows a smoother error variation trend. The relative error decreases initially and, although it increases slightly afterward, it stabilizes within a certain range with smaller fluctuations than the cycle rule. This indicates better stability and accuracy in long-term predictions.
Estimation Using SOH Rule: This method shows a pattern of gradually increasing relative error to a certain point, after which it fluctuates within a range. While the SOH rule can capture the overall trend of SOH changes, it may have some discrepancies in predicting specific values, especially in higher cycle numbers.
In comparison, the estimation of SOH using the capacity rule results in smaller relative errors, indicating higher accuracy and reliability in SOH estimation. In contrast, the cycle rule shows larger relative errors, suggesting potential shortcomings in precision. Among the three methods, the capacity rule performs the best in estimating SOH, with smaller relative errors and better long-term stability. Although the cycle rule might offer some value in certain contexts, its large error fluctuations and instability limit its reliability in practical applications. The SOH rule, while capable of reflecting overall SOH trends, may not be the best choice when high precision is required due to its potential for specific value discrepancies. Therefore, in scenarios where precise evaluation of battery health status is critical, the capacity rule is recommended for SOH estimation. It can be observed that, regardless of the method used, the presence of peaks in the later cycles leads to occasional significant jumps in the relative error.
Figure 20 shows a bar chart of the average relative error for different methods, indicating that the average relative error for predicting SOH using the capacity rule is significantly lower than that of the other two methods. This discrepancy arises because the cycle rule predicts cycle numbers and the transition from cycle numbers to capacity involves linear approximation calculations. Since capacity degradation is not simply linear, this results in a larger relative error.
The capacity rule is derived from the curve fitted between the HI and capacity, whereas the SOH rule is based on the curve fitted between HI and SOH. The correlation between HI and capacity is generally more direct than between HI and SOH. Furthermore, in practical experiments, the initial capacity is not necessarily the rated capacity, leading to errors in the capacity-to-SOH conversion. As a result, predictions based on the SOH rule exhibit a larger relative error than those based on the capacity rule.
Explaining the error from capacity to SOH from the perspective of real-world vehicle SOH estimation, the error in initial capacity is a major factor contributing to prediction errors. Typically, during vehicle operation, the initial capacity of the battery does not necessarily match its rated capacity but varies according to usage conditions. This inconsistency in initial capacity introduces errors when predicting SOH from capacity. For example, if a given rated capacity is used as a standard, differences in the initial capacities of various batteries may indicate that they are at different cycle stages. To standardize cycle numbers, the capacity from the initial experimental dataset needs to be used as the actual capacity for subsequent calculations. If there is significant error in the initial dataset, inaccurate data should be discarded to ensure the accuracy of further calculations. Essentially, only the capacity data from the initial dataset are used, while the second dataset serves as the first cycle data for ongoing calculations. Thus, in real-world vehicle SOH estimation, it is crucial to account for variations in initial capacity to reduce error during the capacity-to-SOH conversion process.
The analysis demonstrates that the capacity rule exhibits a distinct advantage in predicting SOH, with a relative error significantly lower than the other two methods. This advantage primarily arises because the capacity rule utilizes the high correlation between HI and capacity for predictions, whereas the cycle rule and SOH rule introduce larger errors due to their inherent limitations. Understanding and accounting for variations in initial capacity are crucial for improving the accuracy of SOH predictions.
7. Conclusions
This study addresses the critical challenge of accurately predicting the SOH of LIBs, essential for efficient battery system operation and management. It introduces a simplified method to analyze the correlation between health features and battery capacity, demonstrating effectiveness in predicting capacity during charge and discharge cycles. A weighted health indicator sequence is established, accurately reflecting real-world electric vehicle conditions, including charging, discharging, and regenerative braking. The study constructs mathematical models linking HI with cycle count, capacity, and SOH, achieving high predictive accuracy. Comparative analysis shows that the capacity rule outperforms other estimation methods in minimizing relative error and maintaining stability. The feasibility of incorporating impedance as an additional input is explored, revealing the potential benefits of dual-input models, despite measurement challenges. The capacity rule’s universality and reliability are validated across various datasets, confirming its applicability for robust SOH prediction.
The AWICM offers significant advantages: it reduces computational overhead, simplifies the estimation process, and facilitates the broader implementation of efficient battery health monitoring technologies. By retaining high estimation accuracy while simplifying the process, this study contributes valuable insights into practical solutions for sustainable energy storage systems, supporting the advancement of sustainable and efficient energy technologies.
Since the research in this paper is based on a certain charging current, there may be some rules that can be constructed for the capacity rules of different charging currents. In addition, temperatures different from room temperature, for example, high-temperature or low-temperature environments, can be used. The capacity rule may also show some regular changes, which will form future research direction.


