Article

Magnetic and Magnetocaloric Properties of Nano- and Polycrystalline Bulk Manganites La0.7Ba(0.3−x)CaxMnO3 (x ≤ 0.25)

1
Faculty of Physics, Babes-Bolyai University, Str. Kogalniceanu 1, 400084 Cluj-Napoca, Romania
2
National Institute for Research and Development of Isotopic and Molecular Technologies, Str. Donath 67–103, 400293 Cluj-Napoca, Romania
*
Authors to whom correspondence should be addressed.
Magnetochemistry 2023, 9(7), 170; https://doi.org/10.3390/magnetochemistry9070170
Submission received: 5 June 2023 / Revised: 25 June 2023 / Accepted: 28 June 2023 / Published: 30 June 2023
(This article belongs to the Special Issue Advances in Functional Materials with Tunable Magnetic Properties)

Abstract

:
Here we report the synthesis and investigation of bulk and nano-sized La0.7Ba0.3−xCaxMnO3 (x = 0, 0.15, 0.2 and 0.25) compounds that are promising candidates for magnetic refrigeration applications. We compare the structural and magnetic properties of bulk and nano-scale polycrystalline La0.7Ba0.3−xCaxMnO3 for potential use in magnetic cooling systems. Solid-state reactions were implemented for bulk materials, while the sol–gel method was used for nano-sized particles. Structurally and morphologically, the samples were investigated by X-ray diffraction (XRD), optical microscopy and transmission electron microscopy (TEM). Oxygen stoichiometry was investigated by iodometry. Bulk compounds exhibit oxygen deficiency, while nano-sized particles show excess oxygen. Critical magnetic behavior was revealed for all samples using the modified Arrott plot (MAP) method and confirmed by the Kouvel–Fisher (KF) method. The bulk polycrystalline compound behavior was better described by the tricritical field model, while the nanocrystalline samples were governed by the mean-field model. Resistivity in bulk material showed a peak at a temperature Tp1 attributed to grain boundary conditions and at Tp2 associated with a Curie temperature of Tc. Parent polycrystalline sample La0.7Ba0.3MnO3 has Tc at 340 K. Substitution of x = 0.15 of Ca brings Tc to 308 K, and x = 0.2 brings it to 279 K. Nanocrystalline samples exhibit a very wide effective temperature range in the magnetocaloric effect, up to 100 K. Bulk compounds exhibit a high and sharp peak in magnetic entropy change, up to 7 J/kgK at 4 T at Tc for x = 0.25. To compare the magnetocaloric performances of the studied compounds, both relative cooling power (RCP) and temperature-averaged entropy change (TEC) figures of merit were used. RCP is comparable for bulk polycrystalline and nano-sized samples of the same substitution level, while TEC shows a large difference between the two systems. The combination of bulk and nanocrystalline materials can contribute to the effectiveness and improvement of magnetocaloric materials.

1. Introduction

Magnetism is not just a metaphor for love used by poets. As it turns out, magnetism can also help levitate trains [1] full of men hurrying to their daily lives. It can also help create numerous devices that help them communicate. But laws of physics cause the same devices to overheat, putting limits on our desire for unlimited communications and information. Men have tried to cope with the problem, some with liquids and some with gases, but efficiency was not very high and was even harmful to the environment [1]. In recent years, scientific “eyes” have turned back to this mysterious quality called magnetism. Through methodical investigation, safe and efficient materials have revealed their potential [2].
In the last couple of decades, manganites of the type A1−xBxMnO3 (where A is a trivalent rare earth cation and B is a divalent alkaline earth cation) have garnered attention for their high magnetic entropy change at Tc (when magnetic field intensity is changed) as well as for their colossal magnetoresistance (CMR) [3].
Compounds such as La1−xSrxMnO3 and Pr1−xBaxMnO3 [4,5] have exhibited large magnetic entropy changes, which are achieved by doping divalent Sr and Ba in place of trivalent La and Pr. Such actions create a mismatch in neighboring orbitals of manganese (Mn). This Mn3+-O-Mn4+ arrangement allows for ferromagnetic behavior in a process called “double exchange” [6,7]. The best ratio of doping is found to be about x = 0.3 of Mn4+ ions; a lower amount does not result in strong ferromagnetism, and doping closer to 0.5 can result in an anti-ferromagnetic change ordered state [7]. Further addition of divalent but different-sized atoms to the structure will change the structure’s shape and volume, leading to changes in properties such as Tc [7,8]. In addition, changing materials from bulk to nanocrystalline states can greatly affect properties such as magnetic behavior. Furthermore, the size of the nano-particles can affect the same properties [9], which opens many more avenues for research.
In this paper, we investigate the magnetic and electrical properties along with the critical behavior of bulk and nano-sized La0.7Ba0.3−xCaxMnO3 (x = 0.15, 0.2 and 0.25). Interesting and sometimes promising research conducted recently [9,10,11,12] on similar compounds showing high values in magnetization, CMR and magnetocaloric effect calls for further investigation in the search for possible improvements. While the parent samples La0.7Ba0.3MnO3 exhibit Tc at 340 K and 263 K for bulk and nano-particle samples, respectively, the substitution of smaller calcium (Ca) atoms in place of barium (Ba) leads to increased disorder and smaller cell volume, resulting in lower values of Tc (which can be of interest for technical applications, such as magnetic refrigeration). Both systems were investigated by XRD analysis, and they were found to show a change in symmetry from the Rhombohedral (R-3c) to the Orthorhombic (pbnm) group for x = 0.25. Critical magnetic behavior was found to be closer to the tricritical mean-field model for bulk samples and the mean-field model for the nano-particles. Bulk samples exhibit a high magnetic entropy change ΔSM for all samples at Tc. Nano-particles span a wide range of effective temperatures for ΔSM (up to 100 K). All bulk samples exhibit transition temperatures near room temperature, with x = 0.2 being the closest at 279 K.
This paper is organized as follows: in Section 2, we describe the precursors, equipment and preparation methods, as well as all the characterization methods we used from structural, morphological, oxygen stoichiometric, electrical, and magnetic perspectives. In Section 3, we present the results of our investigation and analysis of data, and we discuss the critical behavior and electrical and magnetic properties of our samples. In the end, we summarize our results in Section 4.

2. Materials and Methods

2.1. Materials

Precursors for bulk materials, bought from Alfa Aesar (Heysham, UK), consist of oxides La2O3 (99.9%), MnO2 (99.9%), and carbonates BaCO3 (99.9%) and CaCO3 (99.99%).
Precursors for nanocrystalline samples: nitrates La2(NO3)3·6H2O, Ca(NO3)2·4H2O, Ba(NO3)2, Mn(NO3)2·6H2O

2.2. Preparation

All bulk samples were prepared by conventional solid-state reactions. Precursors were mixed by hand in an agate mortar for 3 h and calcinated for 24 h in the air at 1100 °C. Next, the samples were pressed into pellets at 3 tons and sintered at 1350 °C for 30 h.
Nano-sized samples were prepared using the sol–gel method. Precursors were mixed in 150 mL of pure water (18.2 MΩ × cm at 25 °C) for 45–60 min at 60 °C. About 10 g of sucrose was added, and the solution was mixed further for 45 min. This allowed positive ions to attach themselves to the sucrose chain. Next, the mixture was cooled, and 2 g of pectin was added in order to expand the xerogel. It was stirred for 20 min. The final mixture was dried in the air at 200 °C for 24 h and burned in the oven at 1000 °C for 2 h.

2.3. Structural Characterization

Samples were structurally categorized using X-ray diffraction (XRD). Data from XRD was analyzed by the FULLPROF Rietveld refinement technique. Optical microscopy was used on bulk samples to determine grain size, and transmission electron microscopy (TEM) was used to determine the size of nano-sized particles. In addition, the Williamson–Hall method was used to confirm and compare the experimental results.
Oxygen stoichiometry was determined by iodometric analytical titration. In iodometry, a small amount of the sample is placed in hydrochloric (HCl) acid, in which Mn+ reacts with ions of Cl to produce Cl2. The Cl2 is then pushed by an inert gas into another vessel containing potassium iodide (KI). The resulting iodine molecules in the solution are titrated with sodium thiosulfate. Then, the ratio of Mn3+ and Mn4+ is calculated through balanced chemical equations [13].

2.4. Electrical and Magnetic Properties

Electrical properties of the bulk samples were determined using the four-point technique in a cryogen-free superconducting setup. Four-point chips, which measure voltage and current separately, were placed in a temperature range of between 10 K and 290 K in applied magnetic fields of up to 7 T and recorded the resistance of the samples.
Magnetic measurements were made using a Vibrating Sample Magnetometer (VSM) in the range of 4–300 K and in magnetic fields of up to 4 T.

3. Results

3.1. Structural Analysis

Figure 1 presents stacked XRD patterns and Rietveld refinement results for both systems. Visual inspection of the graphs shows single-phase samples and wider peaks for nanocrystalline samples. A gradual shift to the right with an increasing level of substitution, except for x = 0.25, which shifts slightly to the left, can be observed more clearly in the Supplementary Materials in the XRD graphs. This is indicative of possible diminishing cell dimensions and a change in symmetry for x = 0.25 [14].
Rietveld refinement analysis confirms the Rhombohedral (R-3c) no. 167 space group for the parent and all samples with x = 0.15, 0.2. Compounds with x = 0.25 for bulk and nano-sized systems belong to the Orthorhombic (pbnm) no. 62 space group. Lattice parameters and cell volume diminish with increased substitution as a result of smaller Ca2+ ions having a smaller crystal radius (1.26 Å) than Ba2+ ions (1.56 Å). This changes the Mn-O-Mn angle and Mn-O bond length, creating distortion in the Mn-O octahedral [7,15]. The results are presented in Table 1, Table 2 and Table 3. A figure in the Supplementary Materials illustrated a sudden change in cell parameter and cell volume for x = 0.25.
A useful parameter for understanding the stability of perovskite structures is the Goldschmidt tolerance factor. It was calculated using the following relationship [16]:
t = R A + R 0 2 R B + R 0
where RA is the radius of the A cation, RB is the radius of the B cation, and R0 is the radius of the anion.
Smaller radii of Ca ions cause the tolerance factor to diminish slightly with each additional substitution, as seen in Table 2, but all samples fall within Rhombohedral/Orthorhombic limits of 0.7–0.96 [17]. Bond length plays a major role in “double exchange” [7], and as can be seen in Table 2 and Table 3, it shortens for samples in the Rhombohedral group before changing into the Orthorhombic space group.
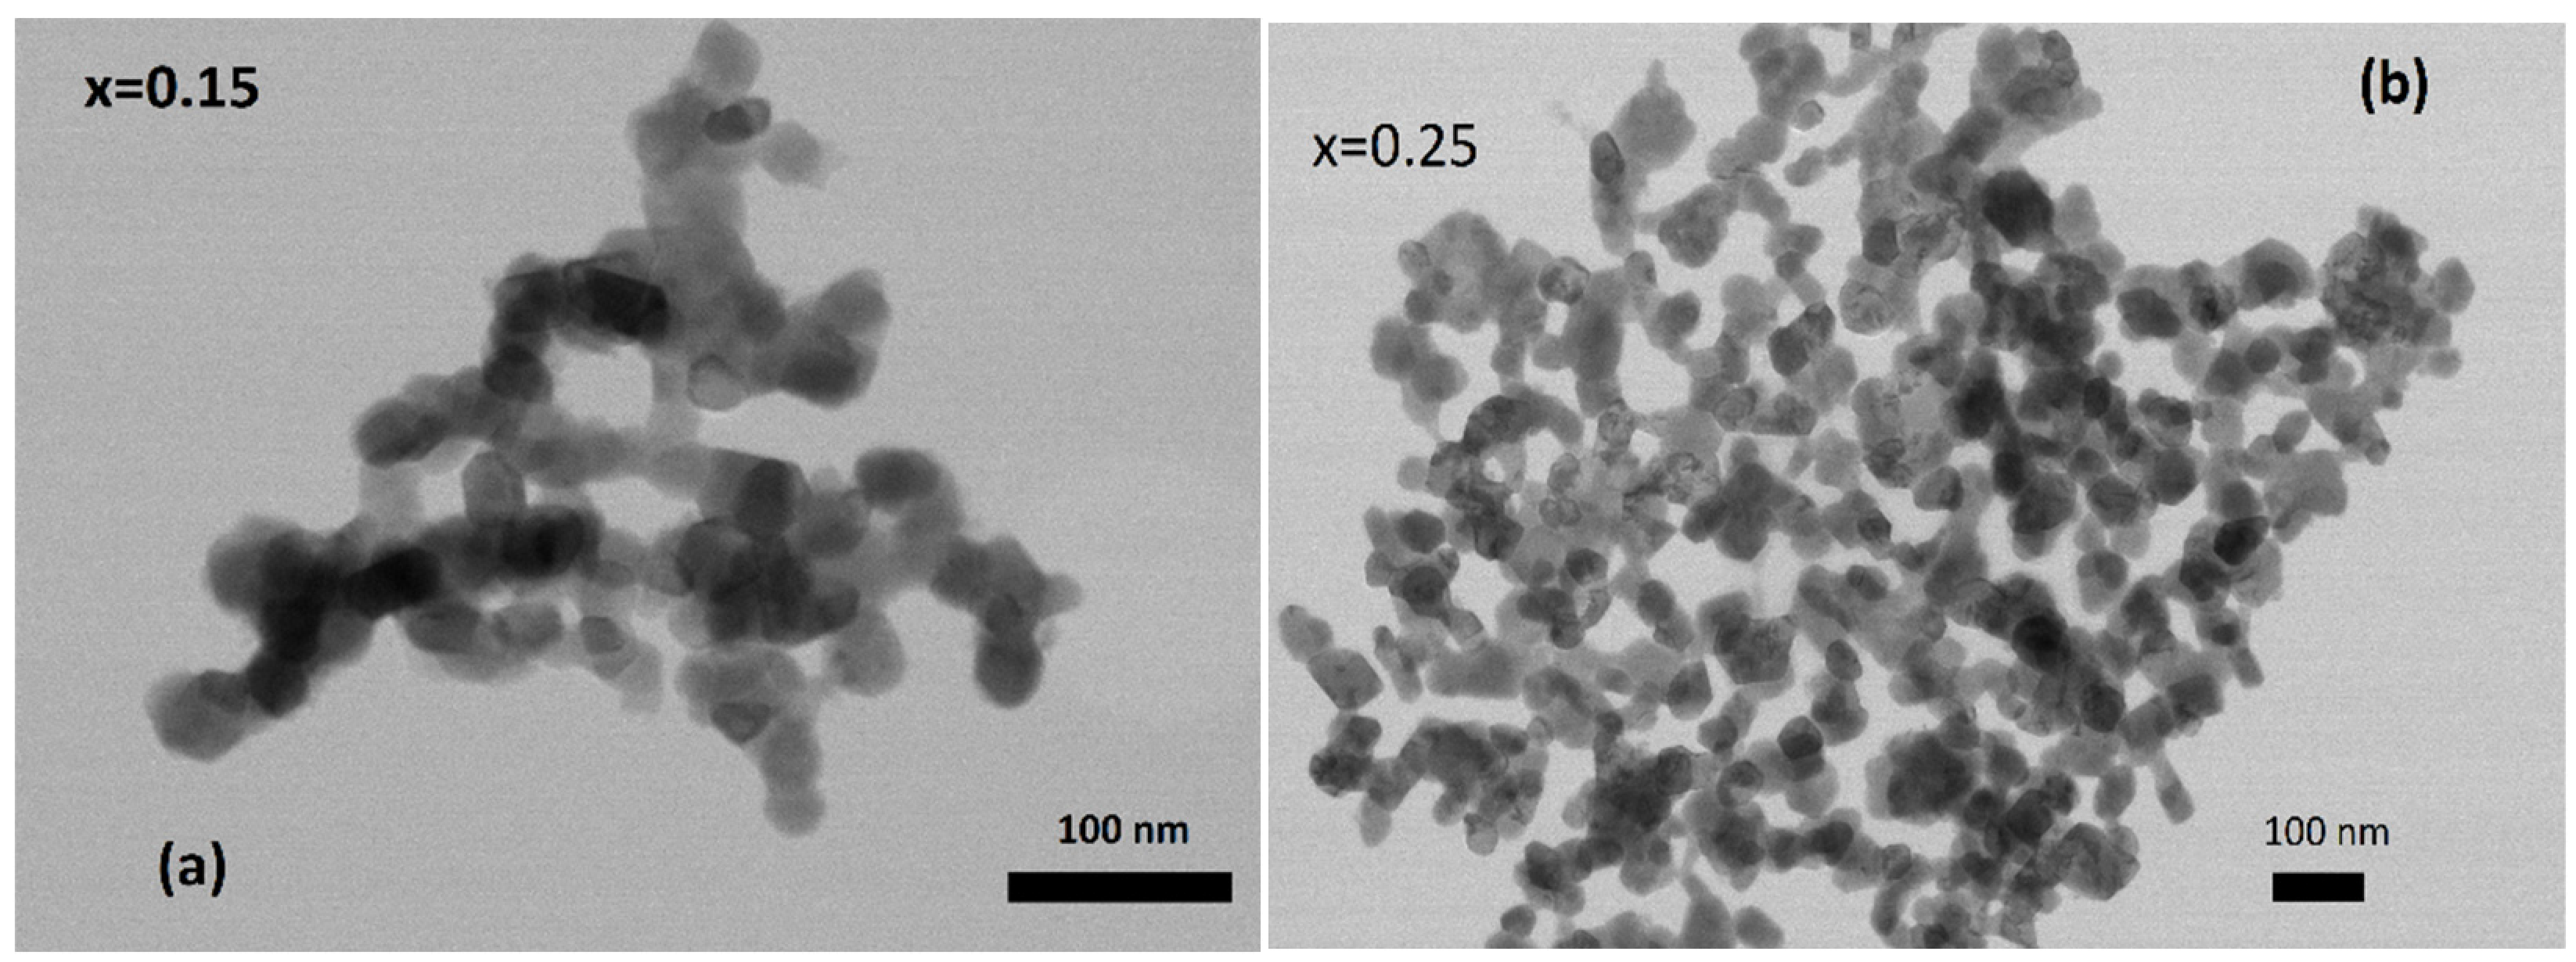
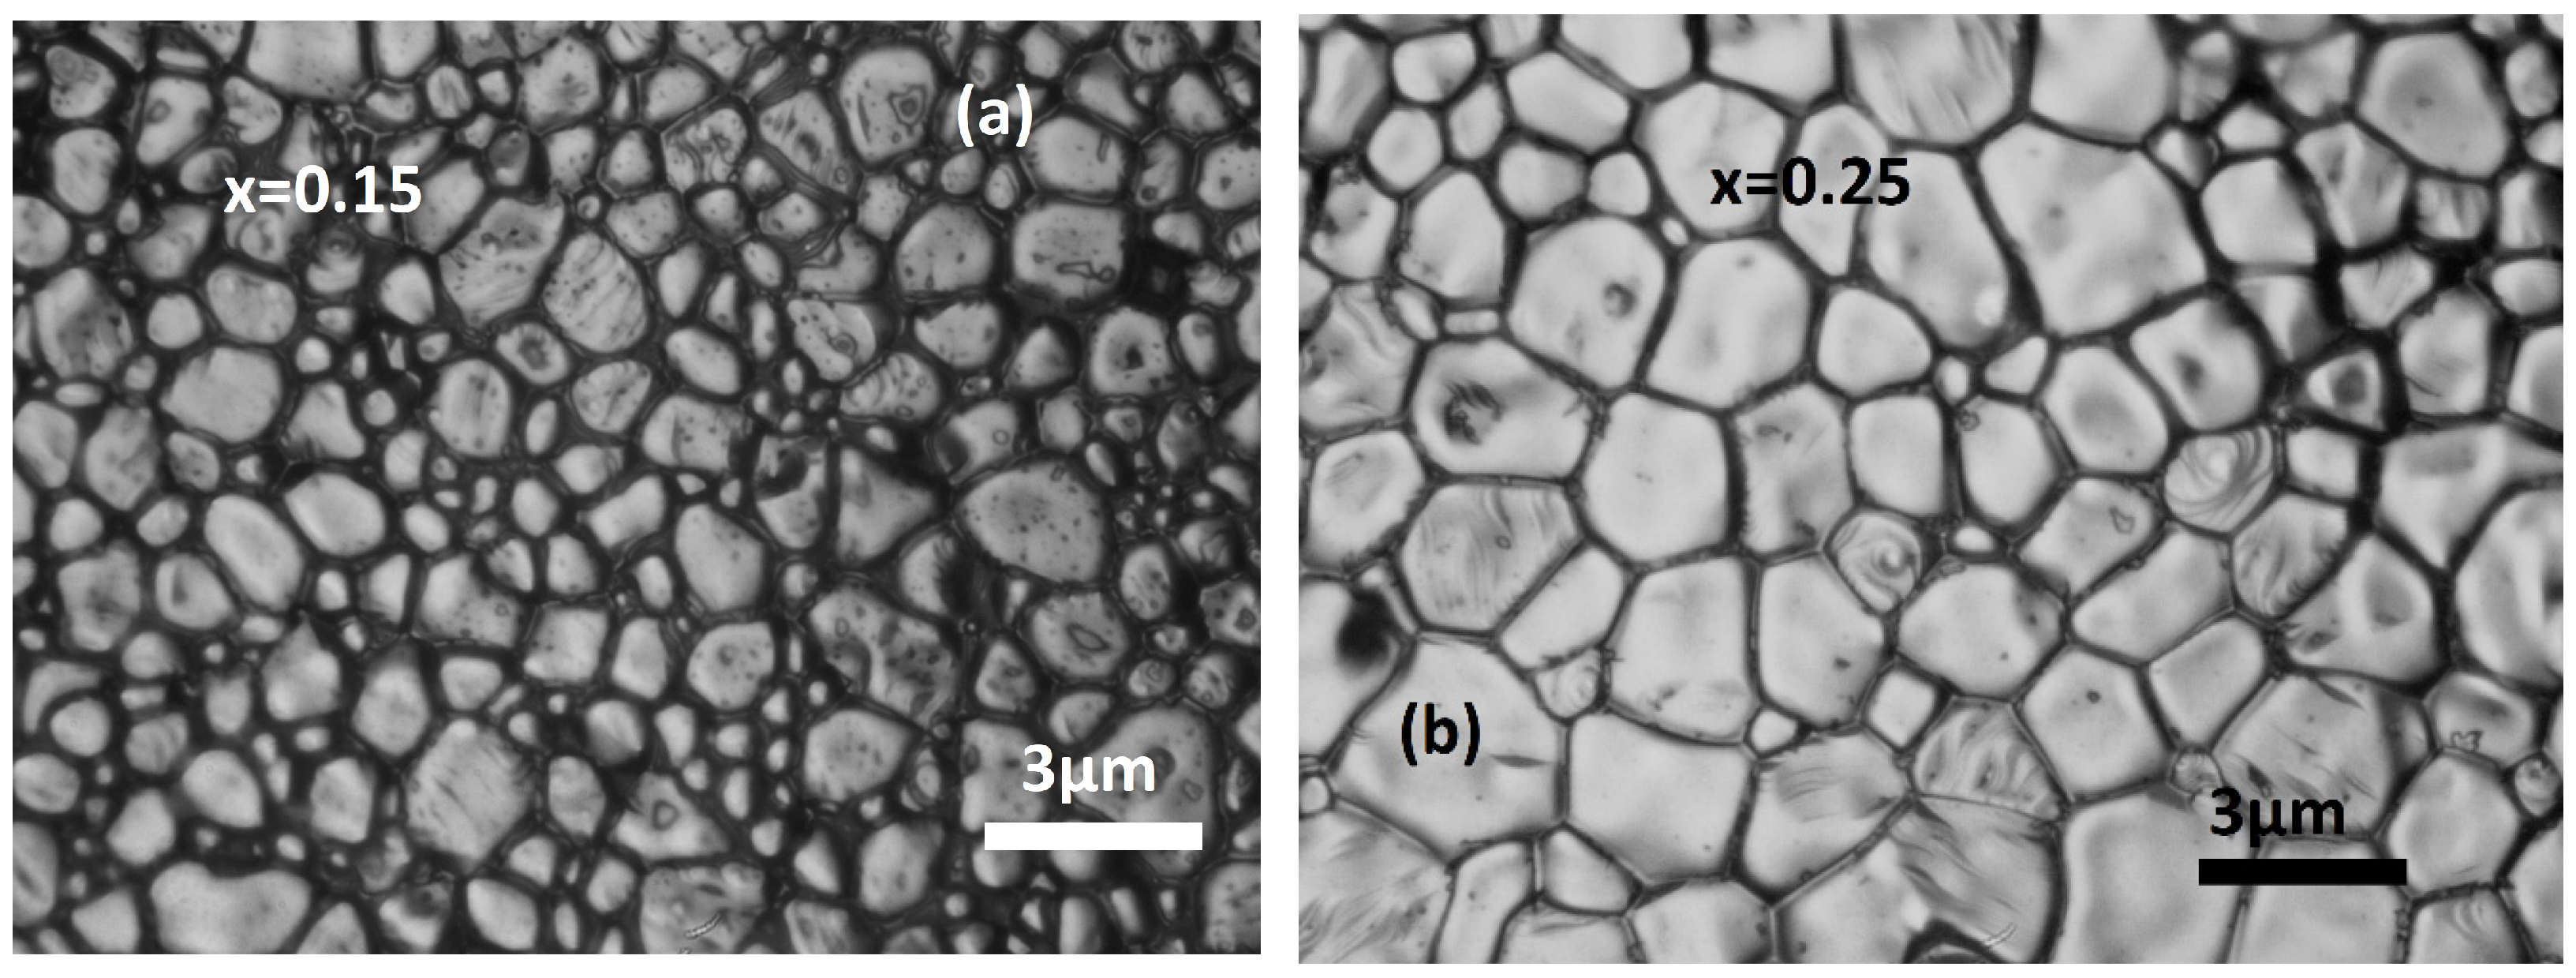
The Williamson–Hall (W–H) method is widely used for approximating crystallite size. Compared to the Scherrer method, it accounts for strain and is thus closer to real values [18]. Table 2 includes calculated values for nanocrystalline samples using the W–H method and results from Rietveld refinement analysis compared to values of particle sizes taken from TEM. It can be observed that TEM revealed a range of particle sizes of 30–60 nm, which is closer to W–H values. Selected TEM pictures are presented in Figure 2. Previous work has shown similar results for nanocrystalline samples made via the sol–gel method [19]. Results for the bulk samples, presented in Table 3, show a different correlation. Calculated values from Rietveld analysis are closer to values procured by optical microscopy, which show average grain sizes of 0.9–1.5 μm. Examples of grain sized can be seen in Figure 3. This discrepancy between calculated and experimental values can be attributed to a single grain containing many crystallites.

3.2. Oxygen Content

The preparation method can affect the properties of the samples. In particular, it can cause accidental vacancies in the A-site occupancy and oxygen deficiency or excess. While the former is beyond the scope of this experiment and cannot be quantified, the latter is easily investigated with relatively inexpensive methods.
Iodometric titration was implemented in calculating the oxygen content of all samples. Iodometry is a comparatively accessible and reliable method of determining oxygen content in manganites [13,20]. It consists of measuring the ratio of Mn3+ to Mn4+ by dissolving an amount of the sample in hydrochloric acid. The resulting ratio of 1/2Cl2 and Cl2 is sent into another vessel to react with potassium iodine (KI), which is then titrated with sodium thiosulfate [13]. In this experiment, all bulk compounds reveal oxygen deficiency. For example, a sample with an average of 78% Mn3+, as is the case for bulk x = 0.15, results in an average oxygen content of O2.96 in the range of 2.95–2.97. This can be attributed to the lack of oxygen flow during calcination. These results would affect the ratio of Mn3+/Mn4+, thus changing the magnetic and electrical properties of the studied compounds [20].
Interestingly, all nano-sized samples showed an excess of oxygen. For example, a sample with 67% Mn3+ results in O3.02, as with x = 0.15. Such an outcome should be attributed to the high surface-to-volume ratio of the particles. We suggest that, at the surface, broken bonds of positive ions would attract an excess of oxygen atoms. These results would increase Mn4+ and lower the magnetic and electrical properties of the compounds.
Standard deviation and relative standard deviation fall within acceptable deviations from the “mean”. A maximum of 4% relative standard deviation shows reliable conclusions. All results are presented in Table 4.

3.3. Electrical Measurements

The investigation of electrical behavior was carried out by the cryogenic four-point probe method. Magnetoresistivity (MR) was calculated using the following formula [21].
MR% = [(ρ(H) − ρ(0))/ρ(0)] × 100,
where ρ(H) and ρ(0) are resistivities in an external magnetic field and in its absence, respectively.
Figure 4 shows graphs of the samples with Ca substitution, and it can be observed that all three plots exhibit a peak at Tp1 at about 226–230 K. This value, being far away from Tc for all samples, can be attributed to grain boundary conditions [21,22,23], where substitution of smaller Ca ions results in increased disorder, which tends to shift toward the boundaries in order to conserve energy [24,25]. According to previous works [26,27], the parent compound does not exhibit such a peak; hence, it can be concluded that the effect is mainly the result of substitution. Additionally, there is another peak at Tp2 for the sample with x = 0.25, most pronounced at 0 T. It becomes smaller at 1 T and almost disappears at 2 T. This peak should be attributed to the ferromagnetic–paramagnetic transition at Tc. The sample with x = 0.2 exhibits an increase in resistivity at about 280 K for 0 T, but the peak resides beyond the experiment’s temperature range.
Attention should be paid to the behavior of resistivity at low temperatures. A minimum is observed at around 30 K. The upturn in resistivity at temperatures below the minima is a consequence of both intrinsic (intragrain) effects and extrinsic grain boundary scattering/tunneling effects [25].
No new features are expected in ρ(T) curves when the measurements are conducted above 2 T. In higher applied magnetic fields, the order of the manganese spin ions increases and the magnitude of the resistivity decreases, in agreement with the double exchange theory [3,7]. In addition, the position of the peaks of the ρ(T) curves shifts to slightly higher temperatures. The behavior of the electrical resistance R (as well as magnetoresistance MR) with increasing magnetic fields, up to 7 T, is typical for polycrystalline CMR manganites [7], and some examples (for x = 0.15, 0.2 and 0.25) are displayed in Figure S3 (Supplementary Materials). At low temperatures, a sharp drop in resistance in low magnetic fields (below 50 mT) and a nearly linear dependence of R in higher magnetic fields can be seen. The maximum value of this decrease takes place at the lowest temperature (10 K), while in the case of intrinsic magnetoresistance, it was found to have a maximum close to the Curie temperature and small values at low temperatures [7]. The low-field magnetic behavior of MR in polycrystalline CMR manganites was attributed to the spin-polarized tunneling between misaligned neighboring grains [7,16]. For the high-field magnetoresistance, the alignment of spins from a disordered region close to the grain boundaries seems to be responsible [7,16].
Plots of resistance R vs. applied field H, presented in Supplementary Materials in Figure S3, reveal a smooth drop in R with the application of a magnetic field. Isothermal lines at 200 K, 250 K and 270 K, where grain boundary conditions play a leading role, show a steeper slope over higher values of the magnetic field [7].
The magnetoresistivity is negative, where the application of an external field lowers the resistance, for all the investigated samples. An interesting observation to be made is the comparison between magnetoresistivity at Tp and at 10 K, where resistivity takes an upturn. While the values of MR at Tp1 are varied, magnetoresistivity at 10 K is relatively constant and is higher than at any other temperature point. This suggests the addition of an effect of spin-polarized electron tunneling/scattering between domains [28]. This can be observed in the MR vs. T graphs available in Supplementary Materials, Figure S4. MR is highest at low temperatures for all samples and shows a dramatic jump at around Tc for x = 0.25. All of the above, including plots of R vs. H and MR vs. T, show Colossal Magnetoresistance (CMR) and its dominance by the grain boundaries. Values for Tp and MR are presented in Table 5 (MR for x = 0.25 at Tp2 is shown in the brackets).

3.4. Magnetic Properties

Ferromagnetic–paramagnetic transition was observed in all samples by studying their magnetization behavior in an external field of 0.05 T in the temperature range of 4–360 K. Plots of selected zero-field cooled/field cooled (ZFC–FC) data are presented in Figure 5. Tc was estimated by taking a derivative of magnetization vs. temperature, with the inflection point representing Tc, as shown in the insets of the graphs.
A lower Curie temperature caused by the introduction of Ca ions is observed for all samples. Bulk compounds with x = 0.2 and 0.15 exhibit Tc close to room temperature at 279 K and 308 K, respectively. The parent nano-sample exhibits Tc = 263 K [26]. Nanocrystalline samples reveal lower Curie temperatures relative to their bulk counterparts. This is explained by the size of the particles and defects on the surface, including broken chemical bonds. In addition, canting of spins on the surface leads to reduced magnetic moments [29,30]. The slope of plots of magnetization vs. temperature (M vs. T) for nano-sized samples is lower than those for bulk samples. This is attributed to the distribution of nano-sizes in the compounds, which will result in a distribution of Curie temperatures and consequently a broadening of the magnetic phase transition. Particles of different sizes will change phase at different temperatures. In general, bulk samples have higher magnetization values, while nano-particles have a wide range of magnetic phase transitions.
The Banerjee criterion is a convenient guide for determining the order of a phase transition. It states that the positive slope of the Arrott plot (M2 vs. H/M) represents a second-order magnetic phase transition and the negative slope represents a first-order transition [31]. We constructed Arrott plots for all samples and confirmed second-order transitions for most of the samples. An interesting observation is to be made with the x = 0.25 bulk sample, which exhibits a negative slope in the initial part of the plot for temperatures above Tc (Figure 6), suggesting the existence of a first-order transition. Selected graphs are shown in Figure 6.
Landau’s mean-field theory [32] describes Gibbs free energy around a critical point and is defined as:
G (T,M) = GO + MH + aM2 + bM4 +…,
where a and b are coefficients that depend on temperature. Minimizing Gibbs free energy with respect to magnetization leads to an equation relating the Arrott plot axis:
H/M = 2a + 4bM2,
According to mean field theory, the isotherm lines (M2 vs. H/M), if correct, are parallel and straight [33], but that is not observed in Arrott plots for our samples. The problem lies in the inexactness of the critical exponents [34]. Observation of Arrott plots for nanocrystalline samples suggests exponents close to mean field theory, while the curvature of the plots for bulk samples suggests one of the other models. An exponent β relates to spontaneous magnetization below Tc and, in mean field theory, has a value of ½, while an exponent γ is related to the inverse of susceptibility χ above Tc and has a value of one. An additional exponent, δ = 3, relates magnetization to the external field at Tc [35].
These relations can be generalized around the critical point as follows [34]:
MS(T) = M0 (−ε)β, T < TC,
χ 1 T = h 0 M 0 ε γ ,   T > T C
M = D0H1), T = TC,
where ε is the reduced temperature (TTc)/Tc and M0, h0/M0, and D are critical amplitudes.
The values of the exponents describe the range of the interactions and are related to the exchange interaction J(r), spin, and system dimensionality [36,37]. According to renormalization group theory [30], J(r) = 1/rd+σ (d—dimensionality of the system; σ—range of interaction) [36]. For σ greater than 2, the 3D Heisenberg model is valid: β = 0.355, γ = 1.366 and δ = 4.8. For σ < 3/2, the mean-field theory of long-range interaction is valid. Additionally, for the tricritical point, the critical exponents are universal: β = 0.25, γ = 1 and δ = 5 [7], and set a boundary between two different ranges of order phase transitions.
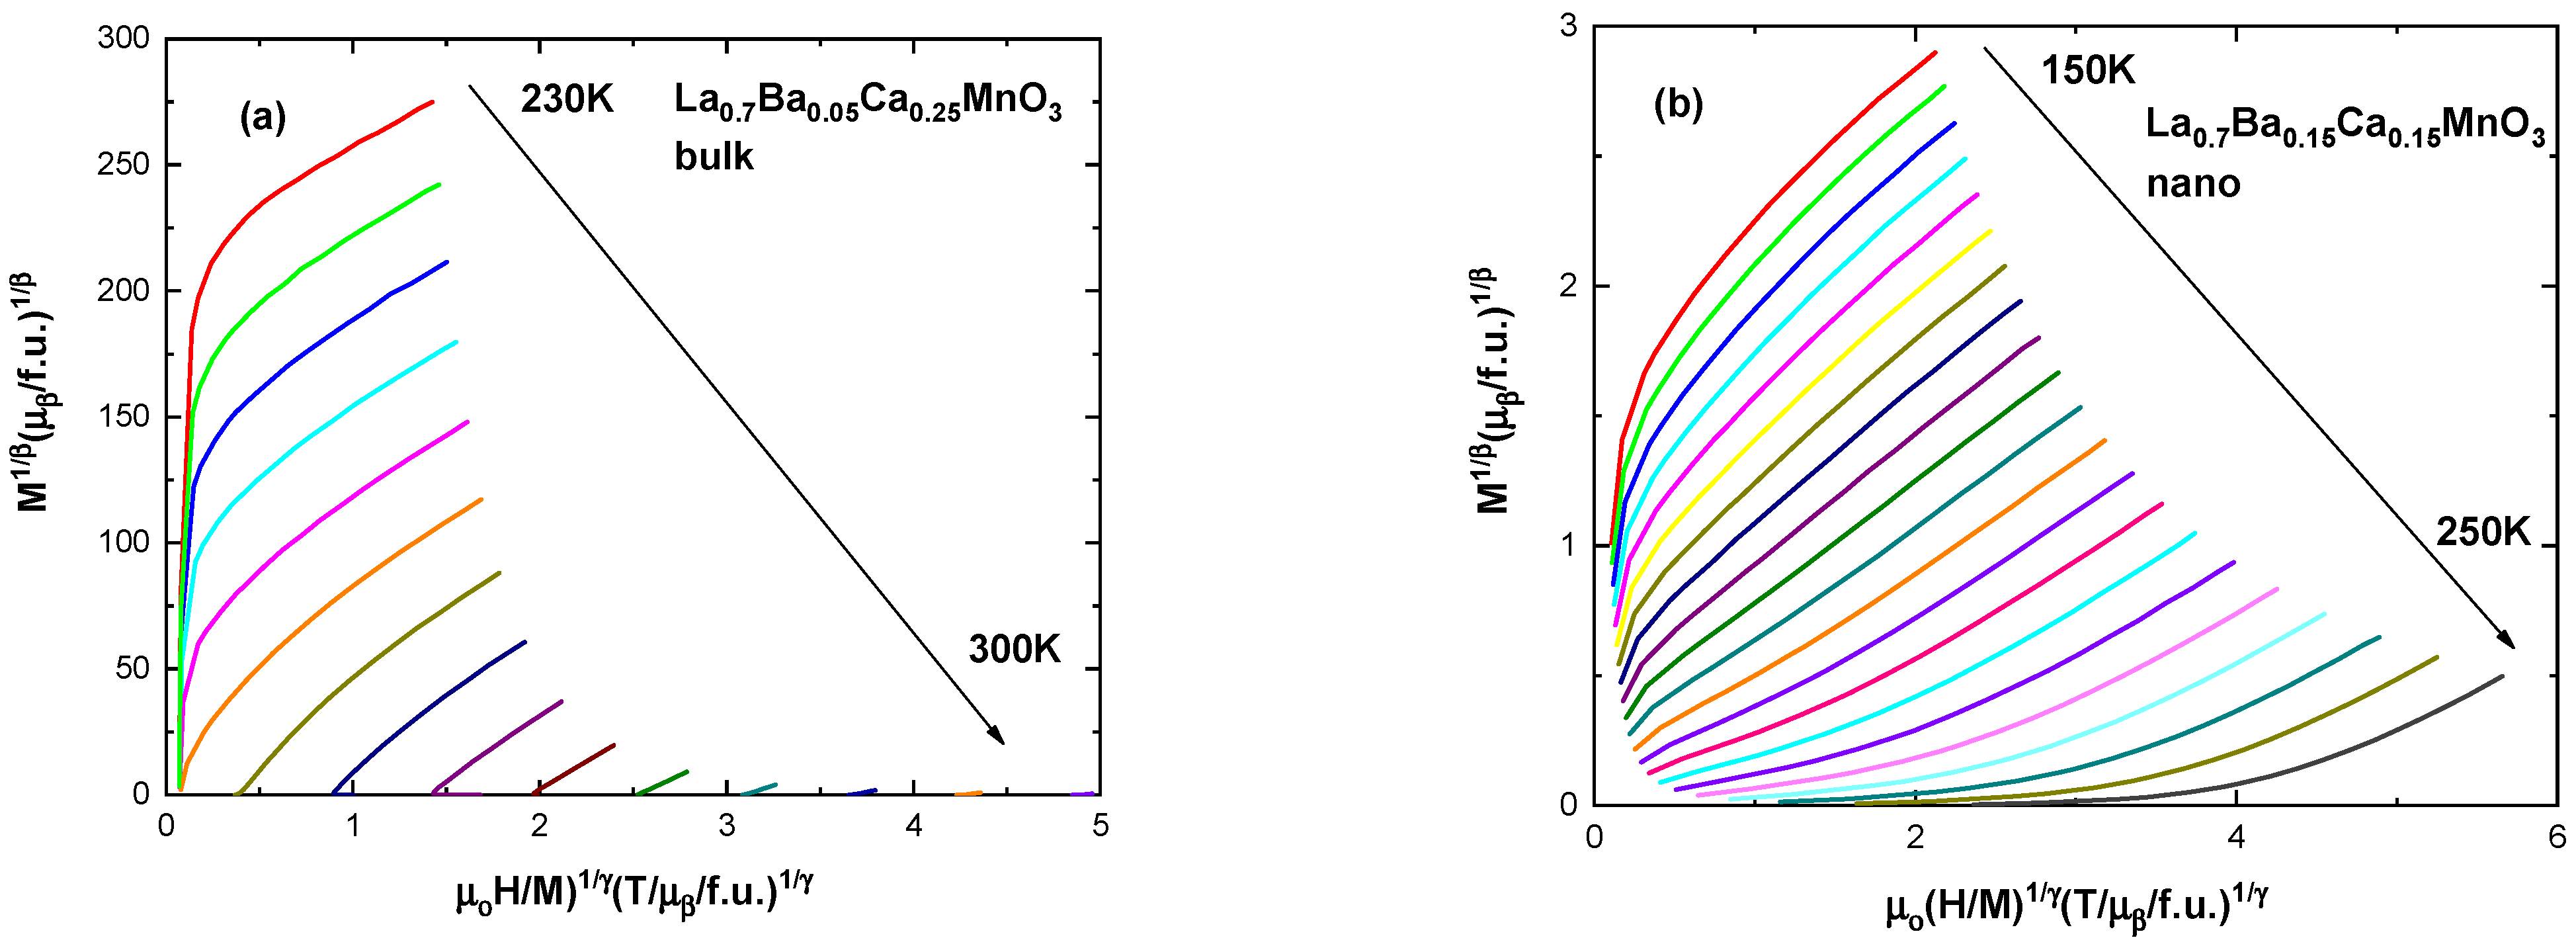
There are several different methods for calculating critical exponents. In this work, we used the modified Arrott plot (MAP) method, and to confirm the results of MAP, we applied the Kouvel–Fisher (KF) method. The construction of a modified Arrott plot is an iterative method [34]. The first stage includes the construction of an Arrott–Noakes plot (M1/β vs. μ0H/M1/γ) by approaching Tc on both sides with straight lines that cross the axis at the appropriate values. The second stage requires finding intercepts of isotherms. Below Tc, on the ordinate, find values of Ms and above Tc, on the abscissa, find values of χ0−1. Finally, these are plotted against temperature and fitted for Equations (5) and (6). Iteration of these steps, until results stabilize, provides the true critical exponents. The Widom scaling relation β + γ = β δ [5] gives the value of δ. The full results of MAP are presented in Table 6.
Interestingly, it can be observed that bulk samples are governed by the tricritical mean-field model. The sample with x = 0.25 has exponents furthest from theoretical values at β = 0.187, γ = 0.949 and δ = 6.075. Its MAP is presented in Figure 7a. All nanocrystalline samples are represented by the mean-field model, as observation of Arrott plots had predicted. A selected MAP of a nanocrystalline sample is shown in Figure 7b.
To confirm the results obtained from the MAP method, the Kouvel–Fisher (KF) method was implemented, as it is a reliable tool for determining critical exponents [38,39,40]. KF is also an iterative method. It requires the construction of an Arrott–Noakes plot and finding the intercepts on the ordinate and abscissa. Finally, these values are used in the following equations [38,40]:
Ms {dMs/dT}−1 = (TTc)/β,
χ0−1 {d χ0−1/dT}−1 = (TTc)/γ,
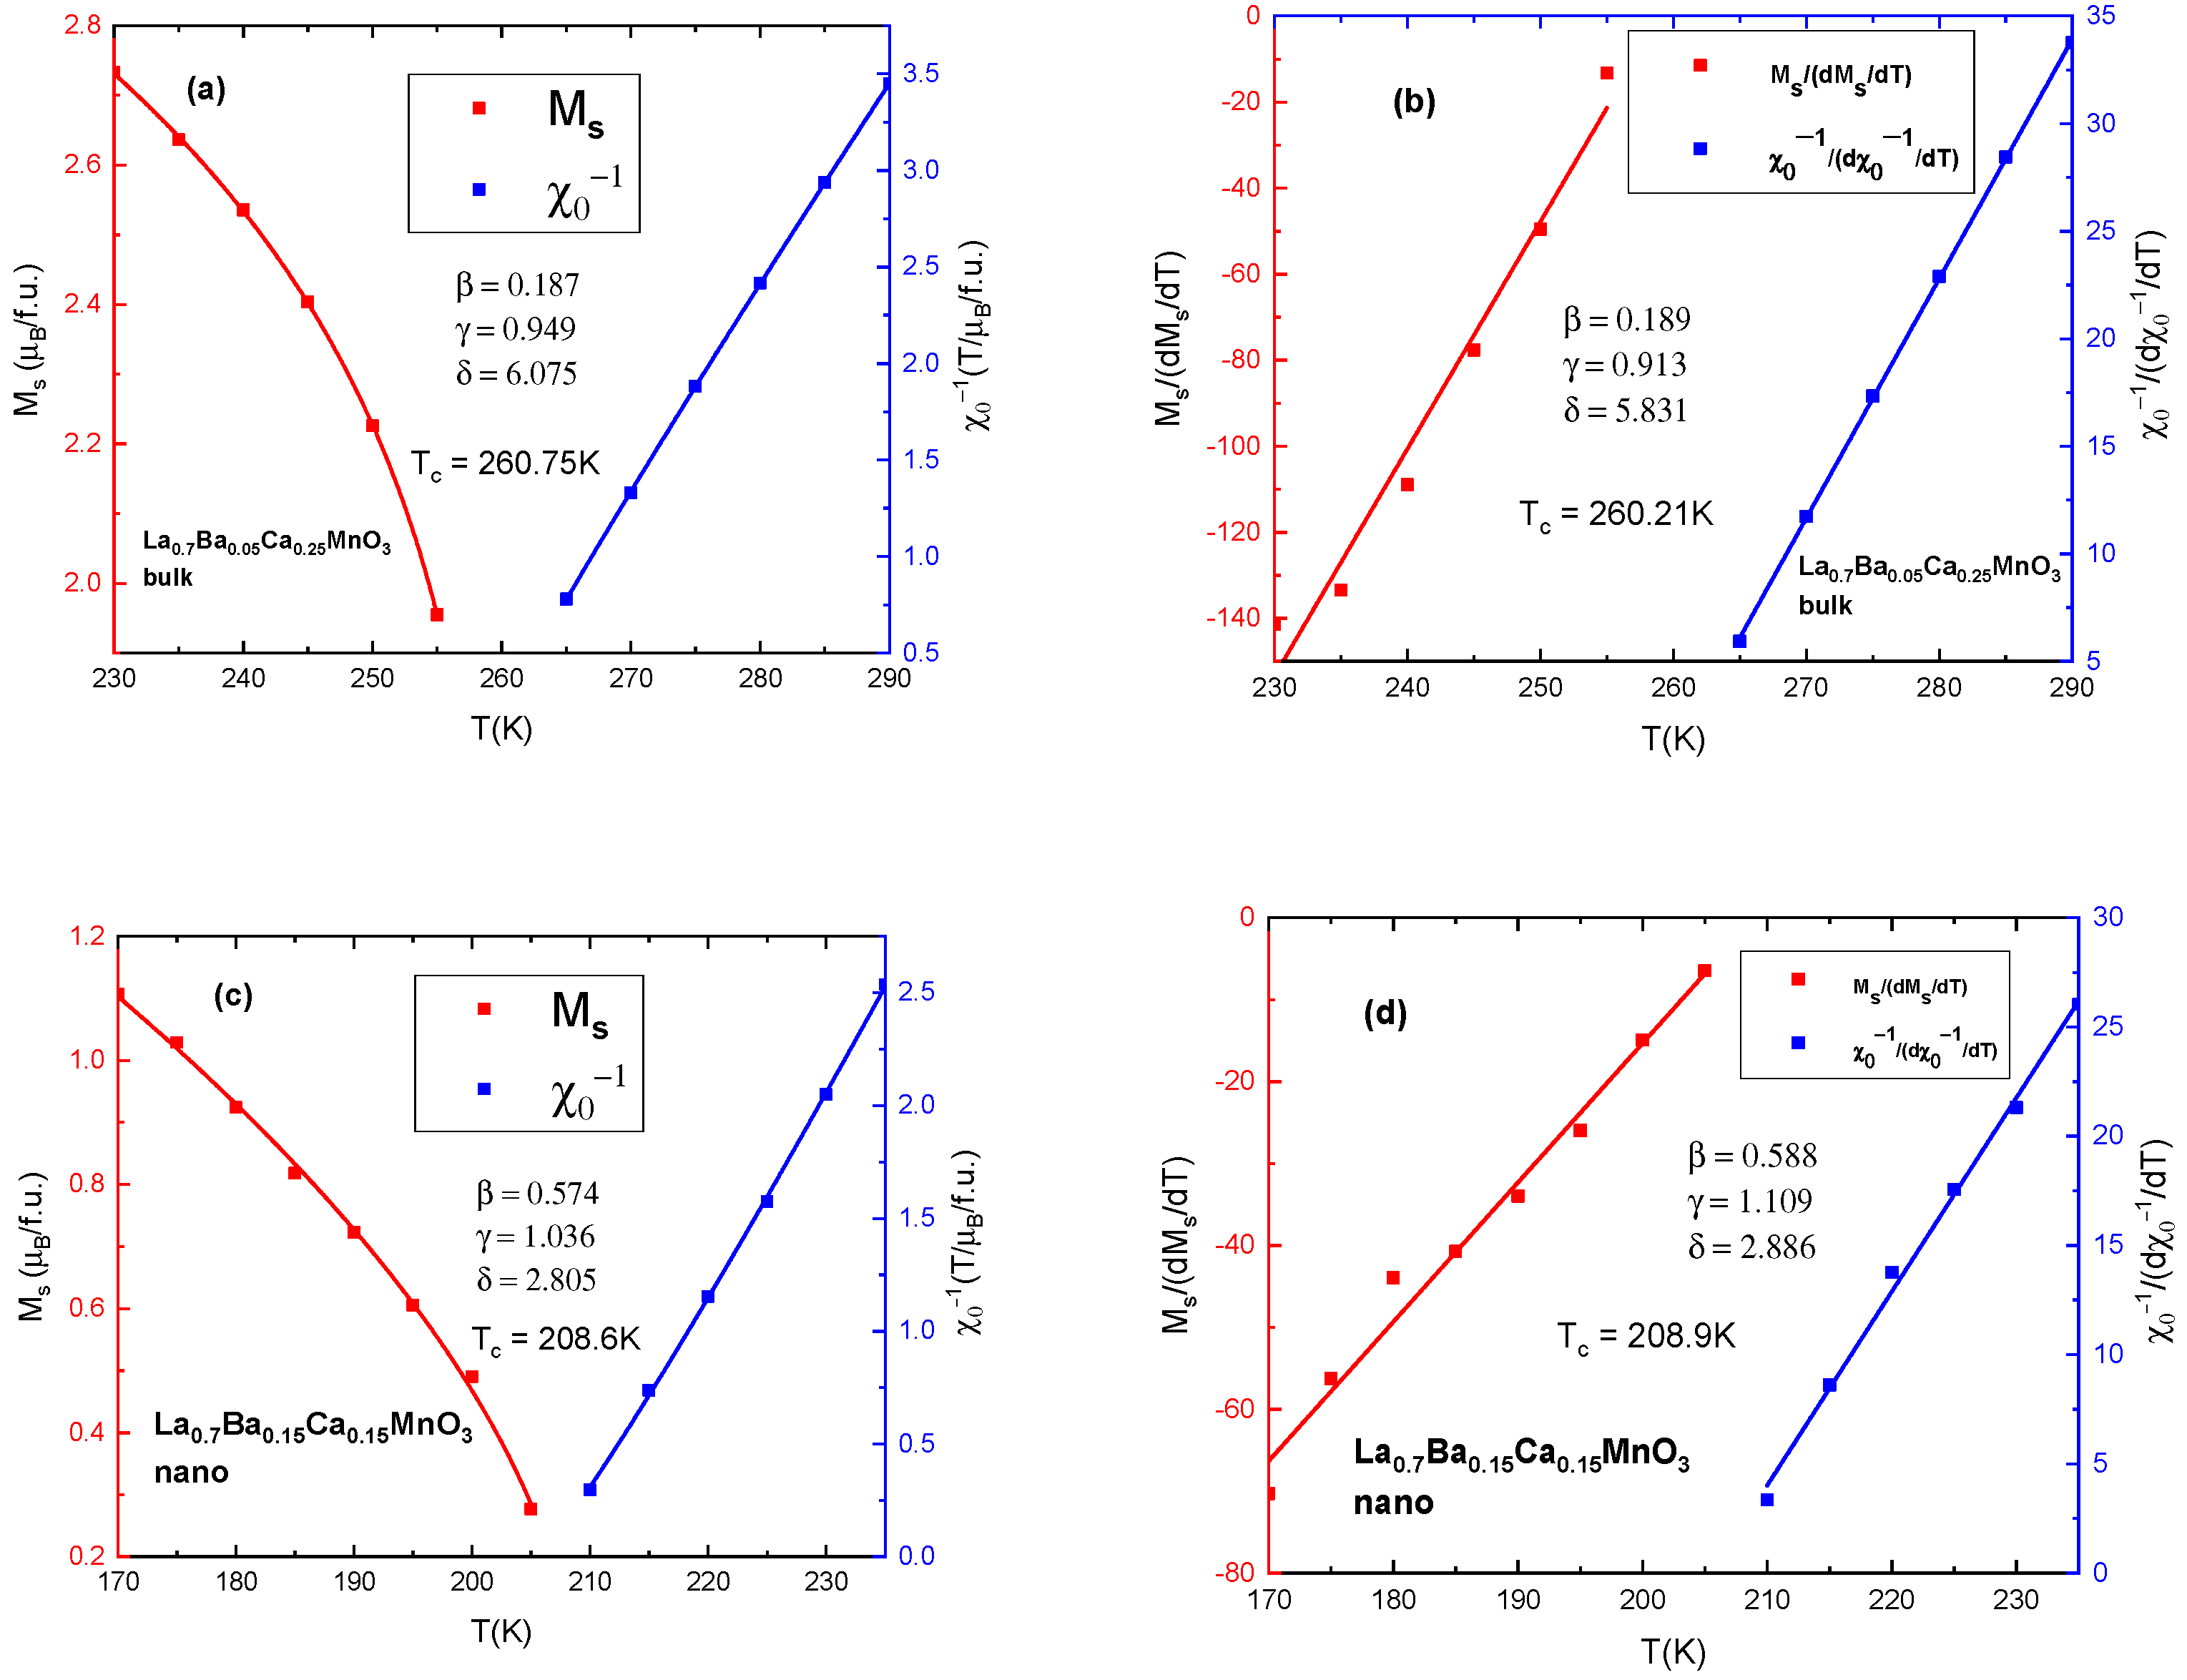
The plot of Ms {dMs/dT}−1 vs. T should be a straight line, and its slope is 1/β, while the intercept gives the Tc. The same logic follows the plot of χ0−1 {d χ0−1/dT}−1 vs. T, which gives a slope equal to 1/γ. Figure 8 shows the comparison between MAP and KF results for two of the samples. It can be seen from Figure 8b that the results from KF are close to the results from MAP for bulk sample x = 0.25 in Figure 8a, thus confirming the tricritical field model assumption. Similarly, the KF result for nano-sized particles x = 0.15 in Figure 8d exhibits exponents that also fall within the mean-field model, as do the results from MAP for x = 0.15 in Figure 8c.
Hysteresis loops measured at 4 K show very narrow coercive fields for all samples. A compound with x = 0.15 exhibits the largest coercive field of 150 Oe in bulk. The largest nano-sized sample coercivity is 710 Oe for x = 0.25. Generally, nano-sized multi-domain particles produce a larger coercive field. If nano-particles were to be made smaller, their field would increase until single domain size. It becomes zero in the superparamagnetic state [41].
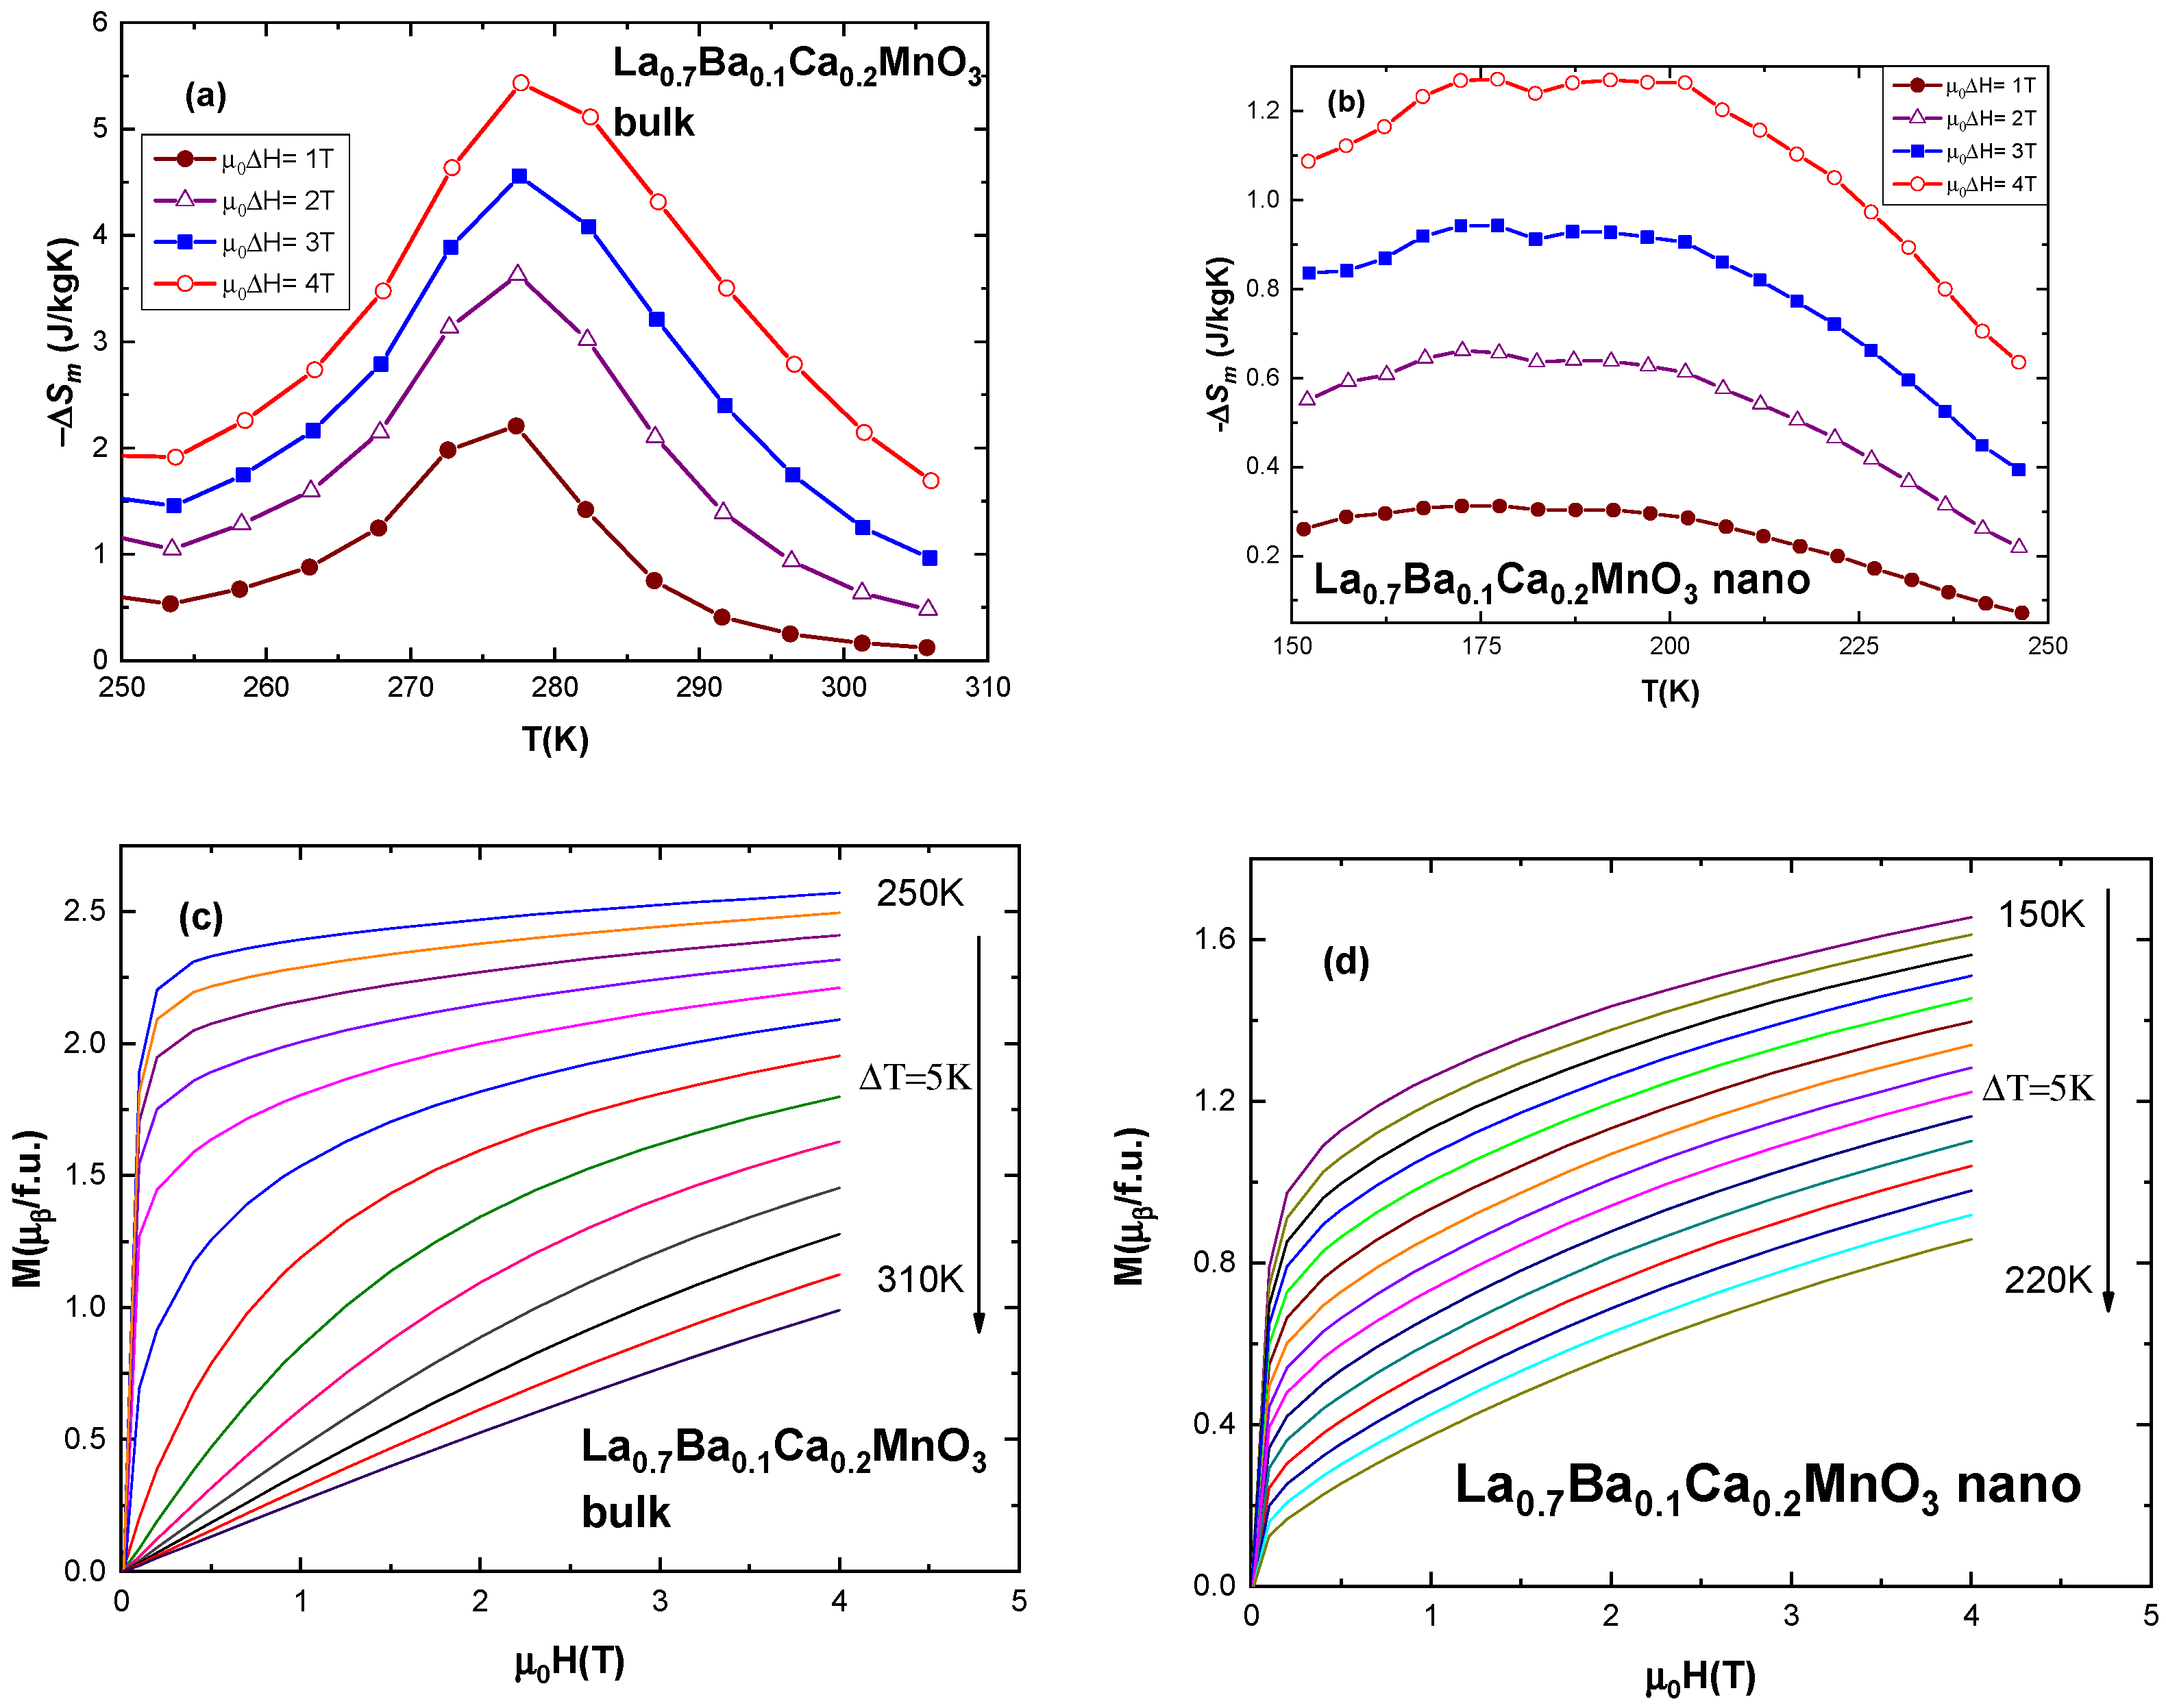
Magnetic entropy change was calculated from magnetization M0H,T) isotherm data at external fields of 1 T, 2 T, 3 T and 4 T using the following formula [42,43]:
Δ S m ( T , H 0 ) = S m ( T , H 0 ) S m ( T , 0 ) = 1 Δ T 0 H 0 M ( T + Δ T , H ) M ( T , H ) d H
Furthermore, we constructed plots of −ΔSm vs. T (temperature) in order to better estimate the magnetocaloric effect. Selected samples are shown in Figure 9.
Although relative cooling power RCP should be taken with “a pinch of salt” [44], it has been a widely used reference for the applicability of the material. It is calculated from the combination of the highest entropy change and its temperature range applicability [43,45]:
R C P S = Δ S m m a x T , H × δ T F W H M
where –ΔSm max is the maximum inverse magnetic entropy change value and δTFWHM is the full width at half maximum of the magnetic entropy curve.
It is noteworthy that both systems show broadly similar values of RCP for samples x = 0.15 and x = 0.2, whose Tc is close to room temperature. All samples show values for entropy change and RCP comparable to or higher than those reported in the literature [45,46,47]. For example, bulk x = 0.2 has an RCP of 41 J/kg at μ0ΔH =1 T, and nano-sized particles have an RCP of 35 J/kg in the same magnetic field variation. Despite the fact that bulk samples usually exhibit a higher maximum entropy change as a result of higher magnetization and a narrower phase transition, nano-sized samples show a wide temperature range phase transition due to size distribution and separation. Bulk sample x = 0.2 has |ΔSM| = 2.29 J/5 556 bkgK, close to Tc but δ T F W H M of only 18 K at μ0ΔH =1 T, while the same nano-sized sample has a temperature range of approximately 100 K and lower |ΔSm|. This can be observed in Figure 9.
In recent events, RCP has been discredited as a reliable figure of merit. RCP overestimates the quality of the materials with a very large δTFWHM and a small entropy change [44,48]. Materials with the same cooling power can behave differently [48,49] when tested in real magnetic refrigerators. Active magnetic regenerative refrigeration (AMRR) systems point to heat capacity, heat conductivity and resistivity, and chemical and mechanical stability as important properties in addition to high magnetic entropy change. A wide temperature range is neglected as a worthwhile figure, and even books on magnetocaloric effects omit δ T F W H M completely [50]. For this purpose, temperature-averaged entropy change (TEC) is seen by many as a more suitable figure-of-merit [51,52]:
T E C = 1 Δ T H C max T m i d Δ T H C 2 T m i d + Δ T H C 2 S d T
Here, ΔTH-C is the temperature span that would be used in a device. We have investigated a temperature range of 5 K to 50 K with a step of 5 K. Tmid is the temperature that maximizes the integration, or, in other words, TEC, for a given temperature span TH-C. Figure 10 presents the values of TEC for polycrystalline and nanocrystalline samples.
Initial observation reveals that the value for TEC for all polycrystalline samples diminishes with increasing temperature span ΔTH-C. This tendency has been reported in previous research [51,52,53] and is expected, as the graphs for magnetic entropy change in bulk have a smooth Gaussian-like distribution. Nano-sized samples, on the other hand, show a small fluctuation around a mean value, which also diminishes, but very slowly, with increasing ΔTH-C. This is explained by the existence of local minima and maxima on the magnetic entropy change graphs. At a second glance, another observation can be made: increasing levels of substitution by Ca ions cause an increase in TEC in polycrystalline samples. The opposite effect is seen for nanocrystalline samples, as seen in Figure 10b; they tend to decrease their value of TEC with increasing substitution due to lowering values of entropy change.
The values of maximum entropy change (ΔSM), RCP, Ms and Hci for both polycrystalline and nanocrystalline samples are presented in Table 7 and Table 8, respectively. It can be seen that the nanocrystalline sample x = 0.25 does not reach magnetic saturation at 4 T.

4. Conclusions

Bulk compounds of La0.7Ba0.3−xCaxMnO3 (0, 0.15, 0.2, 0.25) were prepared by solid-state reactions. Morphology was investigated by optical microscopy and revealed an average grain size of approximately 1000 nm. Nano-sized compounds were synthesized via the sucrose-based sol–gel method. TEM was implemented for size determination, showing an average size of 30–70 nm. Both systems were investigated by Rietveld refinement analysis on XRD patterns. All samples are single-phase. Compounds with a substitution level of x ≤ 0.2 for both systems retain Rhombohedral (R-3c) lattice symmetry. Samples with x = 0.25 change symmetry to Orthorhombic (Pbnm) for bulk and nanocrystalline samples. The bond length of Mn-O progressively diminishes with the addition of Ca. Iodometric analysis showed an oxygen deficiency in bulk material and a slight oxygen excess in nano-sized particles, attributed to surface properties. Derivatives of M(T) curves reveal Tc values: bulk x = 0.15 and x = 0.2 experience close to room temperature ferromagnetic–paramagnetic transitions at 308 K and 279 K, respectively. Nano-sized sample with x = 0.15 drops the Tc of the parent sample (263 K) to 210 K. Very low coercivity was observed in hysteresis loops for all samples. All bulk samples exhibit a metallic–insulator transition at Tp1, attributed to grain size and boundary conditions at around the same temperature (226 K–230 K). A second transition peak at Tp2 was observed for the x = 0.25 sample in μ0H = 0 T. This peak is associated with the magnetic phase transition Tc. Negative magnetoresistance (MR) is observed for all bulk samples. Arrott plots confirm a second-order magnetic phase transition for all samples. Modified Arrott plot MAP analysis revealed the critical exponents for bulk samples to be in the tricritical mean-field model range and in the mean-field model range for nanocrystalline samples. The Kouvel–Fisher method confirmed the results obtained from MAP. Bulk compounds show a sharp magnetic entropy change |ΔSm(μ0H,T)| with high values. Nanocrystalline samples exhibit a lower peak entropy change but a very wide effective temperature range δTfwhm. Relative cooling power (RCP) is comparable for bulk and nano-sized samples with the same substitution level. Temperature-averaged entropy change (TEC) increases with increasing substitution by Ca ions for the bulk samples, with high values of 5 J/kgK (4 T) and 2 J/kgK (1 T) at ΔTH-C = 10 K for the x = 0.15 sample, while they are much lower for the nano-sized samples. TEC values decrease with substitution by Ca ions in nanocrystalline samples but possess respectable values of 1.3 J/KgK (4T) at ΔTH-C = 10 K for the x = 0.15 sample. Further substitution lowers the TEC drastically for nano-sized compounds. Both bulk and nanocrystalline compounds exhibit properties useful for magnetic refrigeration. Polycrystalline bulk samples exhibit higher peak entropy changes and show the room temperature Tc in addition to their CMR. While nanocrystalline samples possess lower values of Tc and lower values of entropy change, they are flexible in application and temperature range. They can be used separately or, possibly, together in multistep refrigeration processes. The flexibility of the use of nanocrystalline samples could be combined with the high entropy change of bulk samples.

Supplementary Materials

The following supporting information can be downloaded at: https://www.mdpi.com/article/10.3390/magnetochemistry9070170/s1, Figure S1: X-ray diffraction patterns for (a) La0.7Ba0.3−xCaxMnO3 polycrystalline bulk samples and (b) La0.7Ba0.3−xCaxMnO3 nano-sized samples; Figure S2: Progression of (a) Lattice parameter (c) vs. Ca level (x) for bulk and nano-samples La0.7Ba(0.3−x)CaxMnO3 (x ≤ 0.25) (b) Cell volume (V) vs. Ca level (x) for bulk and nano-samples La0.7Ba(0.3−x)CaxMnO3 (x ≤ 0.25); Figure S3: Isothermal measurements of resistance R vs. applied magnetic field H at temperature intervals from 10 K to 290 K for bulk samples: (a) x = 0.15; (b) x = 0.2 and (c) x = 0.25; Figure S4: Magnetoresistance MR vs. temperature T graphs for bulk La0.7Ba0.3−xCaxMnO3 samples (a) x = 0.15 (b) x = 0.2 (c) x = 0.25.

Author Contributions

R.A., conceptualization, investigation, methodology, writing—original draft, writing—review and editing, visualization, supervision; E.B., R.H., R.B., G.S. and L.B.-T., methodology, investigation, writing—review and editing; I.G.D., conceptualization, investigation, methodology, visualization, supervision, writing—review and editing. All authors have read and agreed to the published version of the manuscript.

Funding

This research received no external funding.

Institutional Review Board Statement

Not applicable.

Informed Consent Statement

Not applicable.

Data Availability Statement

Data presented in this study are available in this article and Supplementary Materials.

Acknowledgments

The authors acknowledge the Institute of Physics “Ioan Ursu” of the Faculty of Physics at Babes Bolyai University for assistance.

Conflicts of Interest

The authors declare no conflict of interest.

References

  1. Rote, D.M.; Hoffert, M.I.; Caldeira, K. Encyclopedia of Energy: Magnetic Levitation; Climate Change and Energy; Elsevier Science: Amsterdam, The Netherlands, 2004; Volume 1, pp. 359–380, 691–703. [Google Scholar]
  2. Salazar-Munoz, V.E.; Lobo Guerrero, A.; Palomares-Sanchez, S.A. Review of magnetocaloric properties in lanthanum manganites. J. Magn. Magn. Mater. 2022, 562, 169787. [Google Scholar] [CrossRef]
  3. Dagotto, E.; Hotta, T.; Moreo, A. Colossal Magnetoresistant Materials: The Key Role of Phase Separation. Phys. Rep. 2001, 344, 1–153. [Google Scholar] [CrossRef] [Green Version]
  4. Rostamnejadi, A.; Venkatesan, M.; Alaria, J.; Boese, M.; Kameli, P.; Salamati, H.; Coey, J.M.D. Conventional and Inverse Magnetocaloric Effects in La0.45Sr0.55MnO3 Nanoparticles. J. Appl. Phys. 2011, 110, 043905. [Google Scholar] [CrossRef] [Green Version]
  5. Varvescu, A.; Deac, I.G. Critical Magnetic Behavior and Large Magnetocaloric Effect in Pr0.67Ba0.33MnO3 Perovskite Manganite. Phys. B Condens. Matter 2015, 470–471, 96–101. [Google Scholar] [CrossRef]
  6. Pavarini, E.; Koch, E.; Anders, F.; Jarrell, M. Correlated Electrons: From Models to Materials Modeling and Simulation; Forschungszentrum Julich: Aachen, Germany, 2012; Volume 2, pp. 18–21. ISBN 978-3-89336-796-2. [Google Scholar]
  7. Coey, J.M.D.; Viret, M.; Von Molnár, S. Mixed-Valence Manganites. Adv. Phys. 1999, 48, 167–293. [Google Scholar] [CrossRef]
  8. Badea, C.; Tetean, R.; Deac, I.G. Suppression of Charge and Antiferromagnetic Ordering in Ga-doped La0.4Ca0.6MnO3. Rom. J. Phys. 2018, 63, 604. [Google Scholar]
  9. Trukhanov, S.V.; Trukhanov, A.V.; Stepin, S.G.; Szymczak, H.; Botez, C.E. Effect of the size factor on the magnetic properties of manganite La 0.50Ba0.50MnO3. Phys. Solid State 2008, 50, 5. [Google Scholar] [CrossRef]
  10. Trukhanov, S.V.; Trukhanov, A.V.; Botez, C.E.; Szymczak, H. Magnetic properties of the La0.50Ba0.50MnO3 nanomanganites. In Solid State Phenomena; Trans Tech Publications Ltd.: Stafa-Zurich, Switzerland, 2009; Volume 152–153. [Google Scholar] [CrossRef]
  11. Zhao, B.; Hu, X.; Dong, F.; Wang, Y.; Wang, H.; Tan, W.; Huo, D. The Magnetic Properties and Magnetocaloric Effect of Pr0.7Sr0.3MnO3 Thin Film Grown on SrTiO3 Substrate. Materials 2023, 16, 75. [Google Scholar] [CrossRef]
  12. Moutis, N.; Panagiotopoulos, I.; Pissas, M.; Niarchos, D. Structural and magnetic properties of La0.67(BaxCa1−x)0.33MnO3 perovskites (0 < ~x < ~1). Phys. Rev. B 1999, 59, 2. [Google Scholar] [CrossRef]
  13. Tali, R. Determination of Average Oxidation State of Mn in ScMnO3 and CaMnO3 by Using Iodometric Titration. Damascus Univ. J. Basic Sci. 2007, 23, 9–19. [Google Scholar]
  14. Ehsani, M.H.; Kameli, P.; Ghazi, M.E.; Razavi, F.S.; Taheri, M. Tunable magnetic and magnetocaloric properties of La0.6Sr0.4MnO3 nanoparticles. J. Appl. Phys. 2013, 114, 223907. [Google Scholar] [CrossRef]
  15. Raju, K.; Manjunathrao, S.; Venugopal Reddy, P. Correlation between Charge, Spin and Lattice in La-Eu-Sr Manganites. J. Low Temp. Phys. 2012, 168, 334–349. [Google Scholar] [CrossRef]
  16. Dagotto, E. Nanoscale Phase Separation and Colossal Magnetoresistance, 1st ed.; Springer Science & Business Media: New York, NY, USA, 2002; pp. 271–284. [Google Scholar]
  17. Rao, C.N.R. Perovskites. In Encyclopedia of Physical Science and Technology; Elsevier: Amsterdam, The Netherlands, 2003; pp. 707–714. [Google Scholar]
  18. Nath, D.; Singh, F.; Das, R. X-Ray Diffraction Analysis by Williamson-Hall, Halder-Wagner and Size-Strain Plot Methods of CdSe Nanoparticles—A Comparative Study. Mater. Chem. Phys. 2020, 239, 2764–2772. [Google Scholar] [CrossRef]
  19. Trukhanov, S.V.; Fedotova, V.V.; Trukhanov, A.V.; Stepin, S.G.; Szymczak, H. Synthesis and structure of nanocrystalline La0.50Ba0.50MnO3. Crystallogr. Rep. 2008, 53, 7. [Google Scholar] [CrossRef]
  20. Licci, F.; Turilli, G.; Ferro, P. Determination of Manganese Valence in Complex La-Mn Perovskites. J. Magn. Magn. Mater. 1996, 164, L268–L272. [Google Scholar] [CrossRef]
  21. Saw, A.K.; Channagoudra, G.; Hunagund, S.; Hadimani, R.L.; Dayal, V. Study of transport, magnetic and magnetocaloric properties in Sr2+ substituted praseodymium manganite. Mater. Res. Express 2020, 7, 016105. [Google Scholar] [CrossRef]
  22. Deac, I.G.; Tetean, R.; Burzo, E. Phase Separation, Transport and Magnetic Properties of La2/3A1/3Mn1−XCoxO3, A = Ca, Sr (0.5 ≤ x ≤ 1). Phys. B Condens. Matter 2008, 403, 1622–1624. [Google Scholar] [CrossRef]
  23. Panwar, N.; Pandya, D.K.; Agarwal, S.K. Magneto-Transport and Magnetization Studies of Pr2/3Ba1/3MnO3:Ag2O Composite Manganites. J. Phys. Condens. Matter 2007, 19, 456224. [Google Scholar] [CrossRef]
  24. Panwar, N.; Pandya, D.K.; Rao, A.; Wu, K.K.; Kaurav, N.; Kuo, Y.K.; Agarwal, S.K. Electrical and Thermal Properties of Pr 2/3(Ba1-XCsx)1/3MnO 3 Manganites. Eur. Phys. J. B 2008, 65, 179–186. [Google Scholar] [CrossRef]
  25. Ibrahim, N.; Rusop, N.A.M.; Rozilah, R.; Asmira, N.; Yahya, A.K. Effect of grain modification on electrical transport properties and electroresistance behavior of Sm0.55Sr0.45MnO3. Int. J. Eng. Technol. 2018, 7, 113–117. [Google Scholar]
  26. Atanasov, R.; Bortnic, R.; Hirian, R.; Covaci, E.; Frentiu, T.; Popa, F.; Deac, I.G. Magnetic and Magnetocaloric Properties of Nano- and Polycrystalline Manganites La(0.7−x)EuxBa0.3MnO3. Materials 2022, 15, 7645. [Google Scholar] [CrossRef] [PubMed]
  27. Brinza, E. Electrical and Magnetocaloric Properties of the La0.7Ba0.3−xCaxMnO3 Compounds. Diploma Thesis, Babes-Bolyai University, Cluj-Napoca, Romania, 2022. [Google Scholar]
  28. Kubo, K.; Ohata, N. A Quantum Theory of Double Exchange. J. Phys. Soc. Jpn. 1972, 33, 21–32. [Google Scholar] [CrossRef]
  29. Arun, B.; Suneesh, M.V.; Vasundhara, M. Comparative Study of Magnetic Ordering and Electrical Transport in Bulk and Nano-Grained Nd0.67Sr0.33MnO3 Manganites. J. Magn. Magn. Mater. 2016, 418, 265–272. [Google Scholar] [CrossRef]
  30. Peters, J.A. Relaxivity of Manganese Ferrite Nanoparticles. Prog. Nucl. Magn. Reson. Spectrosc. 2020, 120, 72–94. [Google Scholar] [CrossRef]
  31. Banerjee, B.K. On a Generalised Approach to First and Second Order Magnetic Transitions. Phys. Lett. 1964, 12, 16–17. [Google Scholar] [CrossRef]
  32. Jeddi, M.; Gharsallah, H.; Bejar, M.; Bekri, M.; Dhahri, E.; Hlil, E.K. Magnetocaloric Study, Critical Behavior and Spontaneous Magnetization Estimation in La0.6Ca0.3Sr0.1MnO3 Perovskite. RSC Adv. 2018, 8, 9430–9439. [Google Scholar] [CrossRef] [Green Version]
  33. Arrott, A. Criterion for Ferromagnetism from Observations of Magnetic Isotherms. Phys. Rev. 1957, 108, 1394–1396. [Google Scholar] [CrossRef]
  34. Arrott, A.; Noakes, J.E. Approximate Equation of State for Nickel Near Its Critical Temperature. Phys. Rev. Lett. 1967, 19, 786–789. [Google Scholar] [CrossRef]
  35. Stanley, H.E. Introduction to Phase Transitions and Critical Phenomena; Oxford University Press: Oxford, UK, 1987; pp. 7–10. [Google Scholar]
  36. Fisher, M.E.; Ma, S.K.; Nickel, B.G. Critical Exponents for Long-Range Interactions. Phys. Rev. Lett. 1972, 29, 917. [Google Scholar] [CrossRef] [Green Version]
  37. Pathria, R.K.; Beale, P.D. Phase Transitions: Criticality, Universality, and Scaling. In Statistical Mechanics; Elsevier: Amsterdam, The Netherlands, 2022; pp. 417–486. [Google Scholar]
  38. Vadnala, S.; Asthana, S. Magnetocaloric effect and critical field analysis in Eu substituted La0.7−xEuxSr0.3MnO3 (x = 0.0, 0.1, 0.2, 0.3) manganites. J. Magn. Magn. Mater. 2018, 446, 68–79. [Google Scholar] [CrossRef]
  39. Kim, D.; Revaz, B.; Zink, B.L.; Hellman, F.; Rhyne, J.J.; Mitchell, J.F. Tri-critical Point and the Doping Dependence of the Order of the Ferromagnetic Phase Transition of La1−xCaxMnO3. Phys. Rev. Lett. 2002, 89, 227202. [Google Scholar] [CrossRef] [PubMed] [Green Version]
  40. Pelka, R.; Konieczny, P.; Fitta, M.; Czapla, M.; Zielinski, P.M.; Balanda, M.; Wasiutynski, T.; Miyazaki, Y.; Inaba, A.; Pinkowicz, D.; et al. Magnetic systems at criticality: Different signatures of scaling. Acta Phys. Pol. 2013, 124, 977. [Google Scholar] [CrossRef]
  41. Majumder, D.D.; Majumder, D.D.; Karan, S. Magnetic Properties of Ceramic Nanocomposites. In Ceramic Nanocomposites; Banerjee, R., Manna, I., Eds.; Woodhead Publishing Series in Composites Science and Engineering; Elsevier: Amsterdam, The Netherlands, 2013; pp. 51–91. [Google Scholar] [CrossRef]
  42. Souca, G.; Iamandi, S.; Mazilu, C.; Dudric, R.; Tetean, R. Magnetocaloric Effect and Magnetic Properties of Pr1−XCexCo3 Compounds. Stud. Univ. Babeș-Bolyai Phys. 2018, 63, 9–18. [Google Scholar] [CrossRef]
  43. Zverev, V.; Tishin, A.M. Magnetocaloric Effect: From Theory to Practice. In Reference Module in Materials Science and Material Engineering; Elsevier: Amsterdam, The Netherlands, 2016; pp. 5035–5041. [Google Scholar] [CrossRef]
  44. Griffith, L.D.; Mudryk, Y.; Slaughter, J.; Pecharsky, V.K. Material-based figure of merit for caloric materials. J. Appl. Phys. 2018, 123, 034902. [Google Scholar] [CrossRef] [Green Version]
  45. Deac, I.G.; Vladescu, A. Magnetic and magnetocaloric properties of Pr1−xSrxCoO3 cobaltites. J. Magn. Magn. Mater. 2014, 365, 1–7. [Google Scholar] [CrossRef]
  46. Naik, V.B.; Barik, S.K.; Mahendiran, R.; Raveau, B. Magnetic and Calorimetric Investigations of Inverse Magnetocaloric Effect in Pr0.46Sr0.54MnO3. Appl. Phys. Lett. 2011, 98, 112506. [Google Scholar] [CrossRef]
  47. Gong, Z.; Xu, W.; Liedienov, N.A.; Butenko, D.S.; Zatovsky, I.V.; Gural’skiy, I.A.; Wei, Z.; Li, Q.; Liu, B.; Batman, Y.A.; et al. Expansion of the multifunctionality in off-stoichiometric manganites using post-annealing and high pressure: Physical and electrochemical studies. Phys Chem. Chem. Phys. 2002, 24, 21872–21885. [Google Scholar] [CrossRef]
  48. Sandeman, K.G. Magnetocaloric materials: The search for new systems. Scr. Mater. 2012, 67, 566–571. [Google Scholar] [CrossRef] [Green Version]
  49. Smith, A.; Bahl, A.C.R.H.; Bjørk, R.; Engelbrecht, K.; Kaspar, K.; Nielsen, K.K.; Pryds, N. Materials challenges for high performance magnetocaloric refrigeration devices. Adv. Energy Mater. 2012, 2, 1288–1318. [Google Scholar] [CrossRef]
  50. Kitanovski, A.; Tusek, J.; Tomc, U.; Plaznik, U.; Ozbolt, M.; Poredos, A. Magentocaloric Energy Conversion: From Theory to Applications, 1st ed.; Springer: New York, NY, USA, 2015. [Google Scholar] [CrossRef]
  51. Mazumdar, D.; Das, K.; Das, I. Study of magnetocaloric effect and critical exponents in polycrystalline La0.4Pr0.3Ba0.3MnO3 compounds. J. Appl. Phys. 2020, 127, 093902. [Google Scholar] [CrossRef]
  52. Wang, C.L.; Liu, J.; Mudryk, Y.; Zhu, Y.J.; Fu Bin Long, Y.; Pecharsky, V.K. Magnetic and magnetocaloric properties of DyCo2Cx alloys. J. Alloys Compd. 2019, 777, 152–156. [Google Scholar] [CrossRef] [Green Version]
  53. Souca, G. Magnetic Properties and Magnetocaloric Effect on Selected Rare Earth-Transition Metal Intermetallic Compounds. Ph. D. Thesis, Babes-Bolyai University, Cluj-Napoca, Romania, 2022; pp. 101–103. [Google Scholar]
  54. Hueso, L.E.; Sande, P.; Miguéns, D.R.; Rivas, J.; Rivadulla, F.; López-Quintela, M.A. Tuning of the magnetocaloric effect in nanoparticles synthesized by sol–gel techniques. J. Appl. Phys. 2002, 91, 9943–9947. [Google Scholar] [CrossRef]
  55. Anis, B.; Tapas, S.; Banerjee, S.; Das, I. Magnetocaloric properties of nanocrystalline Pr0.65(Ca0.6Sr0.4)0.35MnO3. J. Appl. Phys. 2008, 103, 013912. [Google Scholar] [CrossRef]
Figure 1. X-ray diffraction patterns and Rietveld refinement results for (a) La0.7Ba0.3−xCaxMnO3 polycrystalline bulk samples and (b) La0.7Ba0.3−xCaxMnO3 nano-sized samples.
Magnetochemistry 09 00170 g001
Figure 2. Selected TEM pictures for La0.7Ba0.3−xCaxMnO3 nano-sized samples for x = 0.15 (a), x = 0.25 (b).
Magnetochemistry 09 00170 g002
Figure 3. Selected optical microscope pictures for La0.7Ba0.3−x CaxMnO3 bulk samples for (a) x = 0.15, (b) x = 0.25.
Magnetochemistry 09 00170 g003
Figure 4. Graphs of resistivity vs. temperature for bulk samples: (a) x = 0.15, (b) x = 0.2, and (c) x = 0.25.
Magnetochemistry 09 00170 g004
Figure 5. (a) ZFC–FC curves in 0.05 T and derivative of magnetization (in inset) for the bulk sample with x = 0.2; (b) ZFC–FC curves in 0.05 T and derivative (in inset) for the nanocrystalline sample with x = 0.2.
Magnetochemistry 09 00170 g005
Figure 6. Arrott plot (M2 vs. H/M) for (a) the bulk sample with x = 0.25 and for (b) the nanocrystalline sample with x = 0.15.
Magnetochemistry 09 00170 g006
Figure 7. Modified Arrott plots for (a) the bulk sample with x = 0.25 with β = 0.187, γ = 0.949 and δ = 6.075 and for (b) the nanocrystalline sample with x = 0.15 with β = 0.574, γ = 1.036 and δ = 2.805.
Magnetochemistry 09 00170 g007
Figure 8. Calculated values for critical exponents for (a) MAP for the bulk sample with x = 0.25 and (b) KF for the bulk sample with x = 0.25. (c) MAP for the nanocrystalline sample x = 0.15; (d) KF for the nanocrystalline sample x = 0.15.
Magnetochemistry 09 00170 g008
Figure 9. Magnetic entropy change vs. temperature for selected samples: (a) x = 0.2 bulk, and (b) x = 0.2 nanocrystalline sample. Isothermal magnetization curves at fixed temperature intervals for (c) x = 0.2 bulk and (d) x = 0.2 nanocrystalline samples.
Magnetochemistry 09 00170 g009
Figure 10. TEC values for (a) polycrystalline samples in μ0ΔH = 4 T and 1 T, and (b) nanocrystalline samples in μ0ΔH = 4 T and 1 T.
Magnetochemistry 09 00170 g010
Table 1. Calculated lattice parameters, cell volume, goodness of fit and space groups for both systems calculated using Rietveld refinement analysis.
Ca ContentBulk Samples Fit (Χ2)Nanocrystalline SamplesFit (Χ2)Space Group
a (Å)b (Å)c (Å)V (Å3) a (Å)b (Å)c (Å)V (Å3)
X = 05.533(2)5.533(2)13.519(6)358.3(2)1.545.526(3)5.526(3)13.48(12)356.6(5)1.9R-3c
X = 0.155.509(4)5.509(4)13.42(14)352.8(6)1.545.502(9)5.502(9)13.44(27)352.4(9)1.53R-3c
X = 0.25.499(5)5.499(5)13.41(2)351.2(6)1.675.487(8)5.487(8)13.41(24)349.8(9)1.64R-3c
X = 0.255.492(4)5.467(5)7.727(8)232.0(4)1.645.509(3)5.505(2)7.802(3)236.(157)1.68Pbnm
Table 2. Calculated tolerance factors, Mn-O lengths, Mn-O-Mn angle (°) and crystallite sizes for polycrystalline bulk samples using the Williamson–Hall and Rietveld methods, including grain diameters from optical microscopy.
Ca Content (Bulk)t (Tolerance Factor)Mn-O1
(Mn-O2) (Å)
Mn-O1-Mn
(Mn-O2-Mn) (°)
Average Particle Diameter (μm)Williamson–Hall Size (nm)Average Rietveld Size (nm)Strain
x = 0 0.9261.9643 (4)168.36 (3)1.1110.05111.10.0018
x = 0.150.911.9531 (5)169.31 (3)183.1591.180.0019
x = 0.20.9051.9515 (5)168.35 (6)0.962.8189.990.0016
x = 0.250.91.9327 (6) (1.9473 (6))180(168.61 (6))1.5120.95132.450.0019
Table 3. Calculated, Mn-O lengths, Mn-O-Mn angle (°) and crystallite sizes for nanocrystalline samples using the Williamson–Hall and Rietveld methods, including particle diameters from TEM.
Ca Content (Nano)Mn-O1
(Mn-O2) (Å)
Mn-O1-Mn
(Mn-O2-Mn) (°)
Average Particle Diameter (nm)Williamson–Hall Size (nm)Average Rietveld Size (nm)Strain
x = 0 1.9616 (6)168.35 (9)46.636.2318.140.0022
x = 0.151.9687 (4)161.98 (5)35.627.9816.410.0022
x = 0.21.9632 (4)161.98 (8)45.932.6717.650.0019
x = 0.251.9514 (7) (1.9577 (7))180 (168.58 (8))55.454.623.280.0024
Table 4. Average oxygen content calculated using iodometry for bulk and nanocrystalline samples.
Ca contentAverage Mn3+ RatioStandard DeviationRelative Standard Deviation (%)Average Oxygen Content
x = 0 bulk 0.73060.01592.18O2.98±0.02
x = 0.15 bulk0.78170.0151.92O2.96±0.01
x = 0.2 bulk0.76160.03064.01O2.97±0.02
x = 0.25 bulk0.78520.0060.76O2.96±0.01
x = 0 nano 0.68130.00861.26O3.01±0.01
x = 0.15 nano0.67070.01782.65O3.02±0.02
x = 0.2 nano0.67660.0091.33O3.01±0.01
x = 0.25 nano0.66890.02073.09O3.02±0.02
Table 5. Experimental values for La0.7Ba0.3−x CaxMnO3 bulk materials: electrical properties.
Compound (Bulk)Tc (K)Tp1 (K)Tp2 (K)ρpeak (Ωcm)
in 0 T
MRMax (%)
(1 T) at Tp
MRMax (%)
(2 T) at Tp
MRMax (%)
(1 T) at 10K
MRMax (%)
(2 T) at 10K
La0.7Ba0.3MnO3 [21]340295 0.6935.812.927.0332.11
La0.7Ba0.15Ca0.15MnO3308226 0.13410.1819.7225.1232.59
La0.7Ba0.1Ca0.2MnO3279226 0.0733.4212.9923.7830.97
La0.7Ba0.05Ca0.25MnO32612302740.1779.2 (22.04)18.1 (31.94)24.9433.05
Table 6. Critical exponent values for all samples from the modified Arrott plot method.
CompoundγβδTc (K)
x = 0bulk1.0650.2884.69340 [26]
x = 0.15bulk0.9580.2385.025308
x = 0.2bulk0.9790.2454.996279
x = 0.25bulk0.9490.1876.075261
x = 0nano1.8230.4934.698263 [26]
x= 0.15nano1.0360.5742.805210
x = 0.2nano1.0220.5552.838185
x = 0.25nano0.9850.6232.581130
Mean-field model10.53
3D Heisenberg model1.3660.3554.8
Ising model1.240.3254.82
Tricritical mean-field model10.255
Table 7. Experimental values for La0.7Ba0.3−xCaxMnO3 bulk materials: magnetic measurements.
Compound (Bulk)TC (K)MsB/f.u.)Hci (Oe)SM|
(J/kgK)
μ0ΔH = 1 T
SM|
(J/kgK)
μ0ΔH = 4 T
RCP (S)
(J/kg)
μ0ΔH = 1 T
RCP (S)
(J/kg)
μ0ΔH = 4 T
Refs
La0.7Ba0.3MnO33404.042001.333.553.7158.4[26,27]
La0.7Ba0.15Ca0.15MnO33083.6121502.044.3738.74140.43This work
La0.7Ba0.1Ca0.2MnO32793.6761102.295.4341.26184.69This work
La0.7Ba0.05Ca0.25MnO32613.7581003.667.0140.24182.37This work
La0.7Ca0.3MnO3256 1.38 41 [5]
La0.7Sr0.3MnO3365 -4.44 (5 T) 128 (5 T)[5]
La0.6Nd0.1Ca0.3MnO3233 1.95 37 [5]
Gd5Si2Ge2276 -18 (5 T)-535 (5 T)[5]
Gd293 2.8 35 [5]
Table 8. Experimental values for La0.7Ba0.3−xCaxMnO3 nano-sized materials.
Compound (Nano)Tc
(K)
Ms
B/f.u.)
Hci
(Oe)
SM|
(J/kgK)
μ0ΔH = 1 T
SM|
(J/kgK)
μ0ΔH = 4 T
RCP(S)
(J/kg)
μ0ΔH = 1 T
RCP(S)
(J/kg)
μ0ΔH = 4 T
Refs
La0.7Ba0.3MnO32632.7948001.041.37105.4130.1[26,27]
La0.7Ba0.15Ca0.15MnO32102.5473700.331.3133.7144.1This work
La0.7Ba0.1Ca0.2MnO31852.3894400.321.2835.2153.6This work
La0.7Ba0.05Ca0.25MnO3130 7100.050.276.140.5This work
La0.67Ca0.33MnO3260 -0.97 (5 T) 27 (5 T)[54]
Pr0.65(Ca0.6Sr0.4)0.35MnO3220 0.75 21.8 [55]
La0.6Sr0.4MnO3365 1.5 66 [14]
Disclaimer/Publisher’s Note: The statements, opinions and data contained in all publications are solely those of the individual author(s) and contributor(s) and not of MDPI and/or the editor(s). MDPI and/or the editor(s) disclaim responsibility for any injury to people or property resulting from any ideas, methods, instructions or products referred to in the content.