Article

Investigation of Microstructure and Magnetic Properties of CH4 Heat Treated Sr-Hexaferrite Powders during Re-Calcination Process

by
Ramin Dehghan
1,
Seyyed Ali Seyyed Ebrahimi
1,*,
Zahra Lalegani
1 and
Bejan Hamawandi
2,*
1
Advanced Magnetic Materials Research Center, School of Metallurgy and Materials, University of Tehran, Tehran 11155 4563, Iran
2
Department of Applied Physics, KTH Royal Institute of Technology, SE-106 91 Stockholm, Sweden
*
Authors to whom correspondence should be addressed.
Magnetochemistry 2023, 9(4), 103; https://doi.org/10.3390/magnetochemistry9040103
Submission received: 31 January 2023 / Revised: 6 April 2023 / Accepted: 6 April 2023 / Published: 8 April 2023
(This article belongs to the Section Applications of Magnetism and Magnetic Materials)

Abstract

:
The microstructure and magnetic properties of methane (CH4) heat-treated Sr-hexaferrite powders during the re-calcination process were investigated and compared with the magnetic properties of conventionally synthesized Sr-hexaferrite powder. Gradual changes in the magnetic behavior of the produced powder in each re-calcination stage were investigated using magnetization curves obtained from the vibration sample magnetometry (VSM) technique. First, the initial Sr-hexaferrite powder was prepared by the conventional route. Then the powder was heat treated in a dynamic CH4 atmosphere in previously optimized conditions (temperature: 950 °C, gas flow rate:15 cc min−1 and time: 30 min), and finally, re-calcined in various temperatures from 200 to 1200 °C. By investigating the hysteresis loops, we found the transition temperature of soft to hard magnetic behavior to be 700 °C. The maximum ratio Mr/Ms was obtained at temperatures of 800–1100 °C. At 1100 °C, and despite the Sr-hexaferrite single phase, the magnetic behavior showed a multiphase behavior that was demonstrated by a kink in the hysteresis loop. Uniform magnetic behavior was observed only at 900 °C and 1000 °C. Although the ratio Mr/Ms was almost the same at these temperatures, the values of Mr and Ms at 1000 °C were almost double of 900 °C. At 1000 °C, the second quadrant of hysteresis curve had the maximum area. Therefore, 1000 °C was the optimum temperature for re-calcination after CH4 gas heat treatment in the optimized conditions. Due to the presence of a small amount of hematite soft phase at 1000 °C, the most probable reason for the exclusive properties of the optimized product may be the exchange coupling phenomenon between the hard Sr-hexaferrite phase and the impurity of the soft hematite phase.

1. Introduction

The availability of raw materials combined with their low price has made ferrites one of the most popular materials for fabricating permanent magnets. Many studies have shown that the magnetic properties of hexagonal ferrites based on Sr and Ba are mainly influenced by the method of synthesis and composition [1,2]. The main motivation for studying magnetic materials on the nanometer scale is the significant changes that occur in the magnetic properties at this scale. Reducing the size of a magnetic particle to achieve better properties has limitations. Maintaining the magnetic properties of the particle in this condition requires a correct understanding of the magnetic properties of nanoparticles. It is essential to understand the magnetic phenomena in nanoparticles to predict and control the characteristics of produced powder [3,4].
One of the interesting effects of nanoparticles, exchange anisotropy, was first discovered in 1956 by Meiklejohn and Bean [5]. They prepared very small single-domain cobalt particles and partially oxidized them so that each cobalt particle was covered with a layer of CoO. Then, the particles were cooled to 77 K in a strong magnetic field, and at that temperature, their hysteresis curve was shifted and had no symmetry with respect to the coordinate center.
Therefore, it can be said that magnetic exchange interaction is a type of induced magnetic anisotropy that occurs when two magnetic materials with ferromagnetic (FM) and antiferromagnetic (AFM) behaviors are placed next to each other. The origin of the exchange interaction is the coupling between the magnetic moments of two FM and AFM phases in the interface. Above the Néel temperature, all the moments of the AFM material are disordered [5,6,7,8]. Below this temperature, the moments are arranged and the exchange interaction between the moments of the FM phase and the AFM phase leads to a shift along the axis of the magnetic field in the hysteresis curve, which is known as the exchange interaction field [9].
Until the discovery of the exchange anisotropy phenomenon, producing permanent magnets with higher efficiency was mainly limited to the discovery of magnetic materials. However, the magnetic coupling property makes it possible to produce permanent magnets with a higher benefit by combining existing magnetic materials [5]. In an exchange-coupled magnet, the soft and hard magnetic phases in a nanometer scale are coupled with each other by an exchange interaction at the interface in such a way that the edge of the soft magnetic phase becomes hard.
One of the essential approaches in producing high-performance magnets based on magnetic exchange interaction is forming magnetic composite structures. In 1991, Kneller and Hawig [10] proposed the combination of hard and soft magnetic phases to produce a permanent composite magnet. They proposed that the combination of a soft phase with high Ms and a hard phase with high Hc can improve the coercivity and magnetization of the composite. So far, various studies have been conducted on the combination of hard and soft magnetic phases in nanometer size [11,12,13,14,15]. Interfacial exchange interaction in the nanoscale can lead to a product with excellent properties that can be useful for the production of permanent magnets [12].
If, in a binary composite consisting of two hard and soft magnetic materials, two phases form a complete exchange couple, the second quadrant of the magnetization curve will be convex, like a single-phase magnet. However, if the size of soft phase particles is larger, then some internal magnetic moments of the soft phase will be outside the region affected by the interaction and will not be exchange couples with the moments of the adjacent hard phase. In this case, when the demagnetizing field reaches the value of the soft phase reverse field, these uncoupled moments change direction toward the reverse field and cause a sharp drop in magnetization. This causes a concavity in the second quadrant of the magnetization curve [10,16,17].
Some of the parameters affecting the exchange coupling between hard and soft ferrite phases are microstructure, composition, grain size and magnetic interaction strength, all of which can be affected by the synthesis method. Magnetic and structural properties of ferrites can be obtained by optimizing calcination conditions, hard/soft phase ratios and good exchange coupling between hard and soft phases [18,19]. Gas heat treatment and re-calcination (GTR) is a relatively novel route that can improve the magnetic properties of some hard magnetic ceramics, such as strontium (Sr) hexaferrite.
In our previous work [20], the parameters affecting the heat treatment process of Sr-hexaferrite powder under methane-reducing gas followed by re-calcination were investigated and the mechanism of the process was described from the point of view of phase transformations. In the present study, the magnetic properties of the product obtained from the GTR process and the magnetic behavior of the product during the re-calcination process were investigated. Finding optimum conditions based on magnetic properties and analyzing the effect of exchange coupling on increasing the product’s magnetic properties is one of this research’s primary goals. In this article, we have shown that, in the synthesis of strontium hexaferrite nanoparticles, only reaching a single phase cannot guarantee the best magnetic properties, and some soft phase impurity can cause exchange coupling and improve the overall magnetic properties. So far, no study has demonstrated the exchange coupling during the calcination process.

2. Experimental

The processing and re-formation of SrFe12O19 powder was entirely described in our previous article [20]. In summary, the initial SrFe12O19 powder was synthesized conventionally by mixing hematite (α-Fe2O3, Merck KGaA, Darmstadt, Germany) and strontium carbonate (SrCO3, Merck) powders as precursors. The mixture was calcined at 1100 °C for an hour in the air (more details on synthesis of initial powder in supplementary materials), and then, the mixture was CH4 heat treated in a tube furnace with a flow rate of 30 cc min−1 for an hour at different temperatures (450, 550, 650, 750, 850, 950, and 1050 °C). The subsequent re-calcination process was carried out to re-form SrFe12O19 nanopowders by heating to different temperatures (200, 300, 400, 500, 600, 700, 800, 900, 1000, 1100, and 1200 °C). According to our previous work [20], the best conditions for Sr-hexaferrite re-forming by CH4 gas were introduced as temperature: 950 °C, gas flow rate: 15 cc min−1, and time: 30 min.
The magnetic properties of the powdered sample with different calcination temperatures were investigated using VSM technique at ambient temperatures with the maximum applied field of 10 kOe. It should be noted that all Ms were reported for the maximum applied field of 10 kOe. The morphology investigation of produced particles was performed using a field emission scanning electron microscope (FE-SEM) along with elemental analysis (EDS).

3. Results and Discussion

3.1. Magnetic Behavior during the Re-Calcination after Optimized CH4 Gas Heat Treatment

In our previous paper [20], the phase transformation in a GTR process for preparing nanocrystalline Sr-hexaferrite powder using CH4 heat treatment was studied. The process included gaseous heat treatment and subsequent re-calcination. The phases formed at different calcination temperatures obtained by XRD patterns [20] along with their percentages are listed in Table 1. The crystallite sizes of these phases are also shown in Table S1.
The properties of initial Sr-hexaferrite powder sample prepared by the conventional method were investigated and are shown in Figures S1–S3. Figure S3 shows the magnetization curve of the initial Sr-hexaferrite powder. The magnetic properties resulting from this hysteresis curve are 60.88 emu g−1 saturation magnetization, 35.30 emu g−1 remanence, and 3.5 kOe coercivity.
During the gas heat treatment, the samples contain non-magnetic phases such as carbon or iron carbide, which have a negative effect on the magnetic properties. Therefore, the investigation of magnetic properties was started by investigating the magnetic behavior of the powdered sample of Sr-hexaferrite, which has been re-formed by methane gas under the best conditions (temperature: 950 °C, gas flow rate:15 cc min−1 and time: 30 min) [20]. The hysteresis curve of the mentioned sample is shown in Figure 1. 
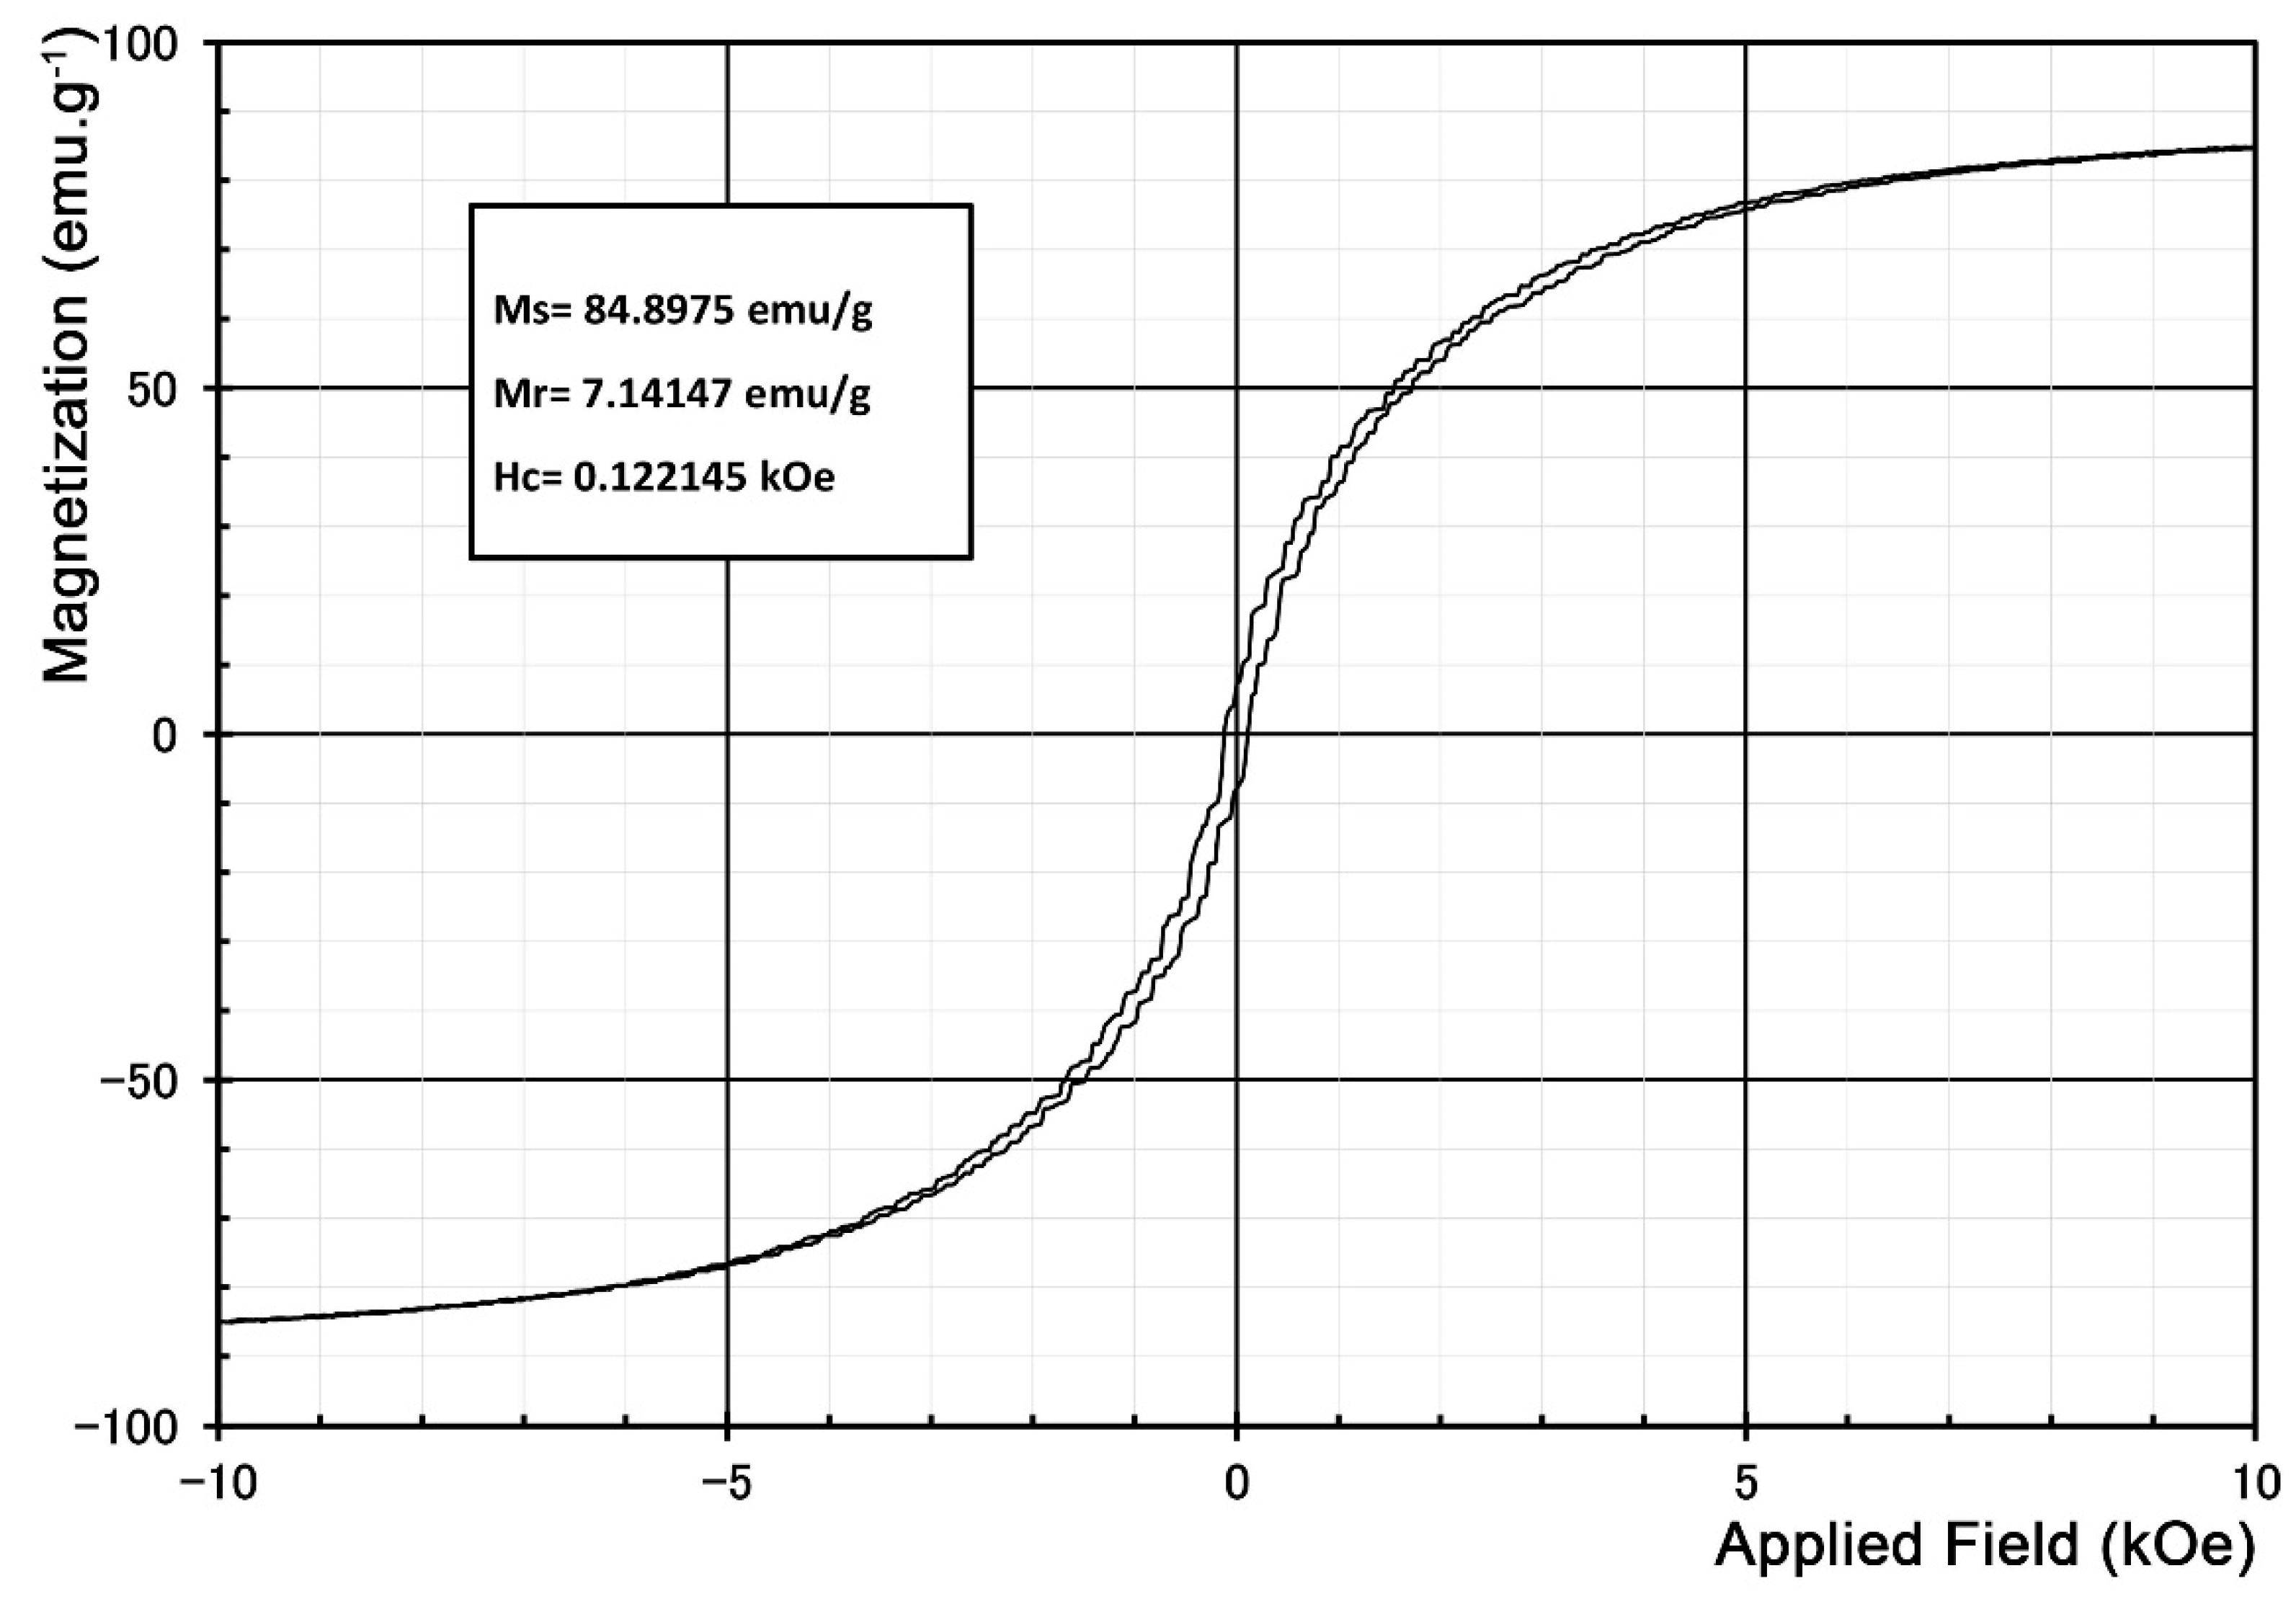
Figure 1 shows the soft magnetic properties of the powder. According to the XRD pattern of this sample (Figure S4), the predominance of the pure iron phase in the composition of this sample could be the reason for such magnetic behavior.
The magnetization curve of the sample reduced under the best conditions and then re-calcined at 200 °C is shown in Figure 2 (also the individual hysteresis curve of this sample is shown in Figure S5). According to Table 1, one hour of calcination at 200 °C does not make any particular phase transformation in this sample. However, it causes a significant increase in the saturation magnetization and a very low decrease in the remanence and coercivity. These changes can be attributed to the effects of diffusive phenomena, such as relaxation and stress relief caused by heat treatment (annealing).
The magnetization curve of the sample reduced under the best conditions and then re-calcined at 500 °C is shown in Figure 2 (the individual hysteresis curve of this sample is shown in Figure S6). At this temperature, the saturation magnetization has decreased (about 65% reduction), the remanence has increased slightly, and the coercivity is still very low. Therefore, this material can be described as a poor soft magnetic material.
Such behavior can be expected after the oxidation of pure iron and the formation of oxides such as hematite. Almost all iron is re-oxidized and converted to hematite up to the calcination temperature of 500 °C. 
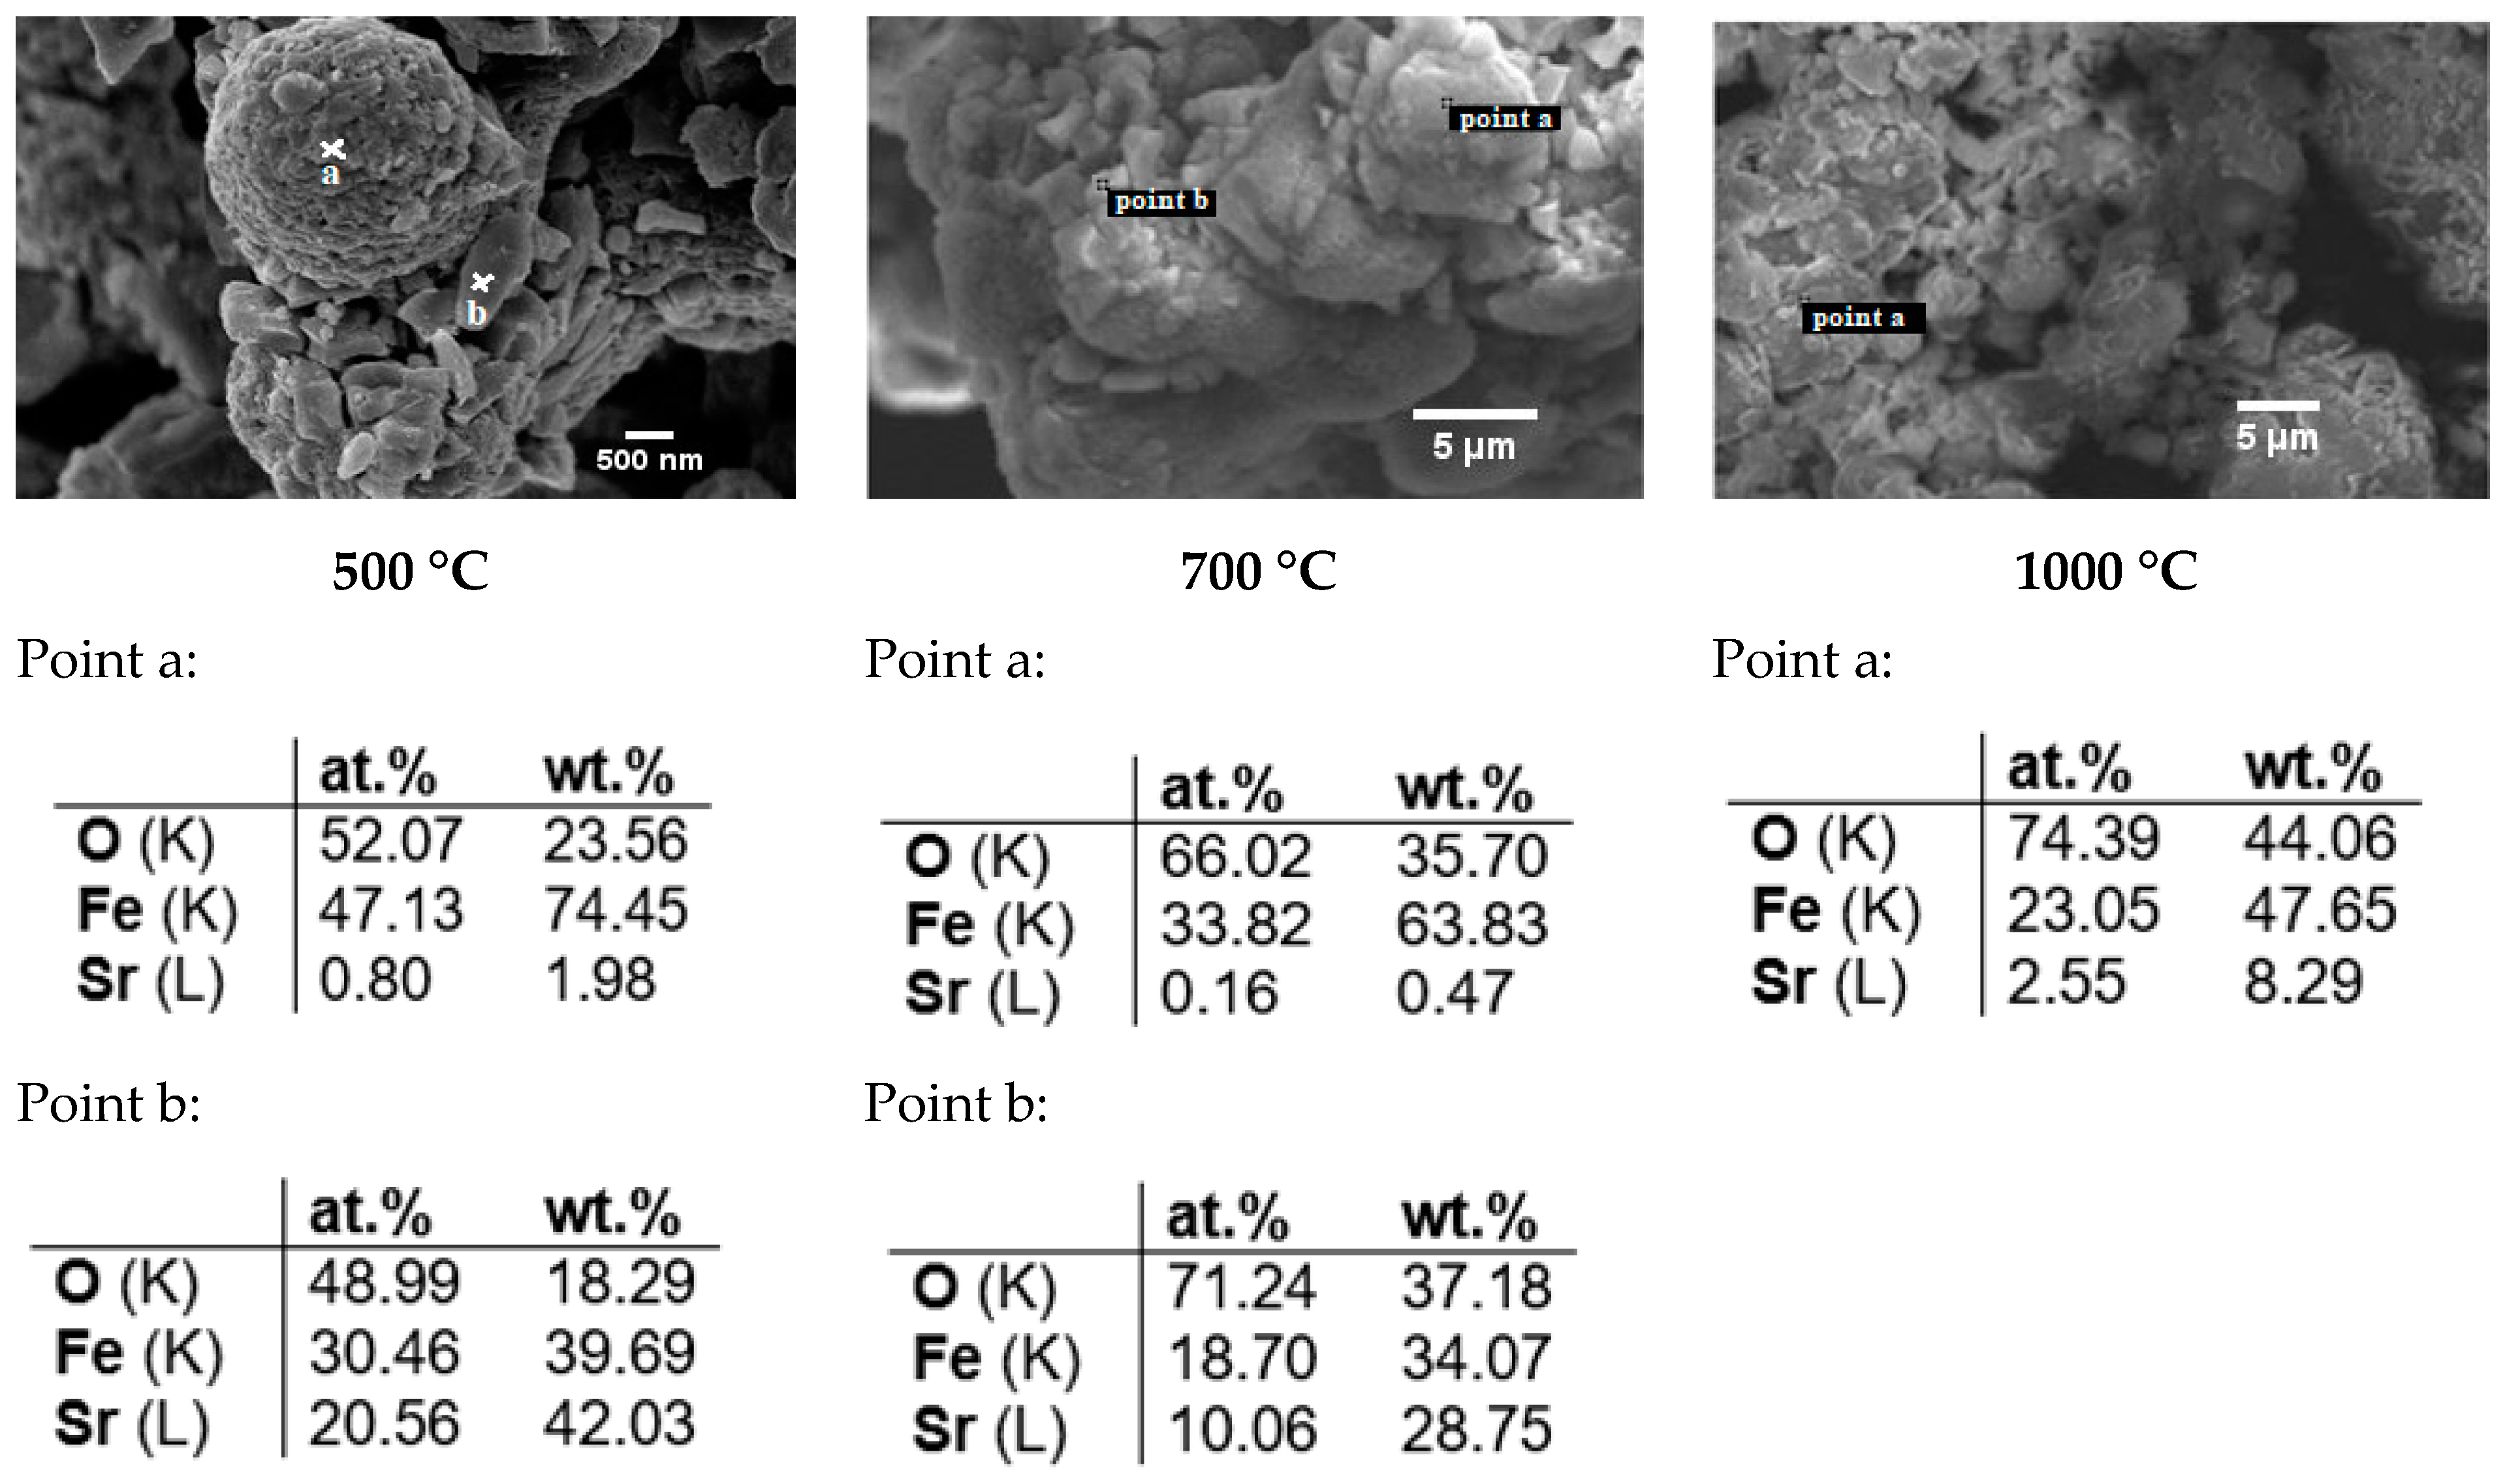
Figure 3 shows FE-SEM image and EDS analysis of a reduced Sr-hexaferrite powder sample calcined at 500°C. Points (a) and (b) on this image show the EDS analysis on fine aggregate particles and on a relatively large and flat particle, respectively.
The EDS analysis of point (a) is definitely for iron oxides, while the analysis point (b) shows a composition quite close to the Sr-rich phase, Sr7Fe10O22.
The magnetization curve of the sample reduced under the best conditions and then re-calcined at 700 °C is shown in Figure 2 (the individual hysteresis curve of this sample is shown in Figure S7). According to Figure 2, magnetic properties are still changing from soft to hard. Although this sample has a very low saturation magnetization, there has been a significant increase in the remanence and coercivity. According to the molar percentage of phases in this sample (Table 1), the composition of this sample is almost hematite. A small percentage of Sr-hexaferrite is also present in the sample, and no pure iron or magnetite is seen. Therefore, the magnetic behavior of this sample (reduction of the saturation magnetization and remanence) is more affected by the presence of hematite. The increase in coercivity can also be attributed to the structural anisotropy of the Sr-hexaferrite phase. According to Figure 2, a kink can be seen in the hysteresis loop. Almessiere et al. [11] observed a similar distortion kink during investigation of hard/soft composite of SrBaSc/NiFe. They identified the weak exchange coupling between the phases to be the reason for the kink in the hysteresis loop as the weak exchange causes the separate switch of the magnetic moments of the hard and soft phases towards the applied field. In a hard/soft ferrite composite, three interactions of hard/soft exchange, soft/soft dipole and hard/hard dipole are integrated; if dipole/dipole interactions are dominant, weak magnetic properties will be obtained [21]. They [11] were able to overcome the dipole/dipole interactions by changing the concentration of the composite composition and obtain smooth hysteresis loops.
Figure 3 and Figure S13 show an FE-SEM image of a reduced Sr-hexaferrite powder sample calcined at 700 °C. Large cracked particles can still be observed. Points (a) and (b) on this image show the EDS analysis on the aggregation region of interconnected small particles and on relatively large cracked particles, respectively. The EDS analyzes confirm that the small, interconnected particles are oxidized irons, and the larger cracked particles are Sr-rich phase.
The magnetization curve of the sample reduced under the best conditions and then re-calcined at 800 °C is shown in Figure 2 (the individual hysteresis curve of this sample is shown in Figure S8). By increasing the temperature from 700 °C to 800 °C, the saturation magnetization has increased from 17.31 to 30.86 emu g−1, which indicates an increase of about 78%. The remanence has also increased from 9.05 to 19.44 emu g−1 (~115%), and the coercivity from 2.47 to 4.13 kOe (~67%), respectively. Hence, it can be said that all the magnetic properties in the curve of Figure S8 (800 °C) have almost doubled compared to the curve of Figure S7 (700 °C). It can also be said that this is the first sample that can be considered a hard magnetic material. In particular, the coercivity field in this sample is significant and higher than the initial sample prepared by the conventional method. According to Table 1, the main difference between the sample prepared at 800 °C and the sample prepared at 700 °C is the double increase of the Sr-hexaferrite phase percentage. However, the amount of Sr-hexaferrite phase is still very low compared to the amount of hematite in the composition. Hence, it is concluded that the significant change in the magnetic properties of the sample requires more amount of Sr-hexaferrite phase.
The magnetization curve of the sample reduced under the best conditions and then re-calcined at 900 °C is shown in Figure 2 (also the individual hysteresis curve of this sample is shown in Figure S9). According to Figure 2, by increasing the temperature from 800 °C to 900 °C, the saturation magnetization and remanence have decreased from 30.86 emu g−1 to 26.08 emu g−1 (~15% reduction) and 19.44 emu g−1 to 16.36 emu g−1 (~16% reduction), respectively. Despite the inconsiderable decrease in saturation magnetization and remanence, the hysteresis curve at 900 °C has a higher coercivity (4.62 kOe) in comparison with the coercivity of 4.13 kOe at 800 °C.
Generally, the samples prepared at 800 °C and 900 °C have a higher coercivity than the initial Sr-hexaferrite sample. The investigation of phase percentage [20] shows that the Sr-hexaferrite phase in the sample prepared at 900 °C is much more (about twice as much) than the sample prepared at 800 °C, which is the reason for an increase in the coercivity.
The magnetization curve of the sample reduced under the best conditions and then re-calcined at 1000 °C is shown in Figure 2 (also the individual hysteresis curve of this sample is shown in Figure S10). The shape of the hysteresis loop perfectly shows the properties of a hard magnetic material. The highest saturation magnetization and remanence among the samples that have been investigated so far, as well as the high coercivity, make this sample very favorable for hard magnetic applications. Comparing the magnetic properties of this sample with the initial Sr-hexaferrite sample shows that about 10% decrease in saturation magnetization, 4% decrease in remanence and about 17% increase in coercivity have been achieved. The area of hysteresis loop in the second quadrant also had its highest value in this sample. However, according to the X-ray diffraction patterns in our previous work [20], this sample is still not a single-phase Sr-hexaferrite and contains other phases, such as hematite.
Figure S14 shows FE-SEM images of a reduced Sr-hexaferrite powder sample calcined at 1000 °C for one hour. Figure 3 also shows the EDS analysis of this sample. EDS analysis shows the composition of Sr-hexaferrite and confirms the formation of the desired product at the end of this stage. According to the TEM image of this sample (Figure S15), the Sr-hexaferrite particle size is less than 50 nm.
The magnetization curve of the sample reduced under the best conditions and then re-calcined at 1100 °C is shown in Figure 2 (the individual hysteresis curve of this sample is shown in Figure S11). At this high temperature, Sr-hexaferrite grows rapidly, and the magnetic properties are closer to the values of the initial Sr-hexaferrite. In addition, a sudden change in the slope of the second quadrant of the hysteresis loop was observed, indicating the existence of two different phases. Probably, the non-uniform growth of particles can cause a non-uniform particle size distribution, and due to the difference in the magnetic behavior of small and large particles, will result in a multiphasic behavior.
Finally, the magnetization curve of the sample reduced under the best conditions and then calcined at 1200 °C is shown in Figure 2 (also the individual hysteresis curve of this sample is shown in Figure S12). According to Figure 2, the coercivity is decreased, and the behavior of the curve in the second quadrant is still similar to the two-phase behavior.
According to 
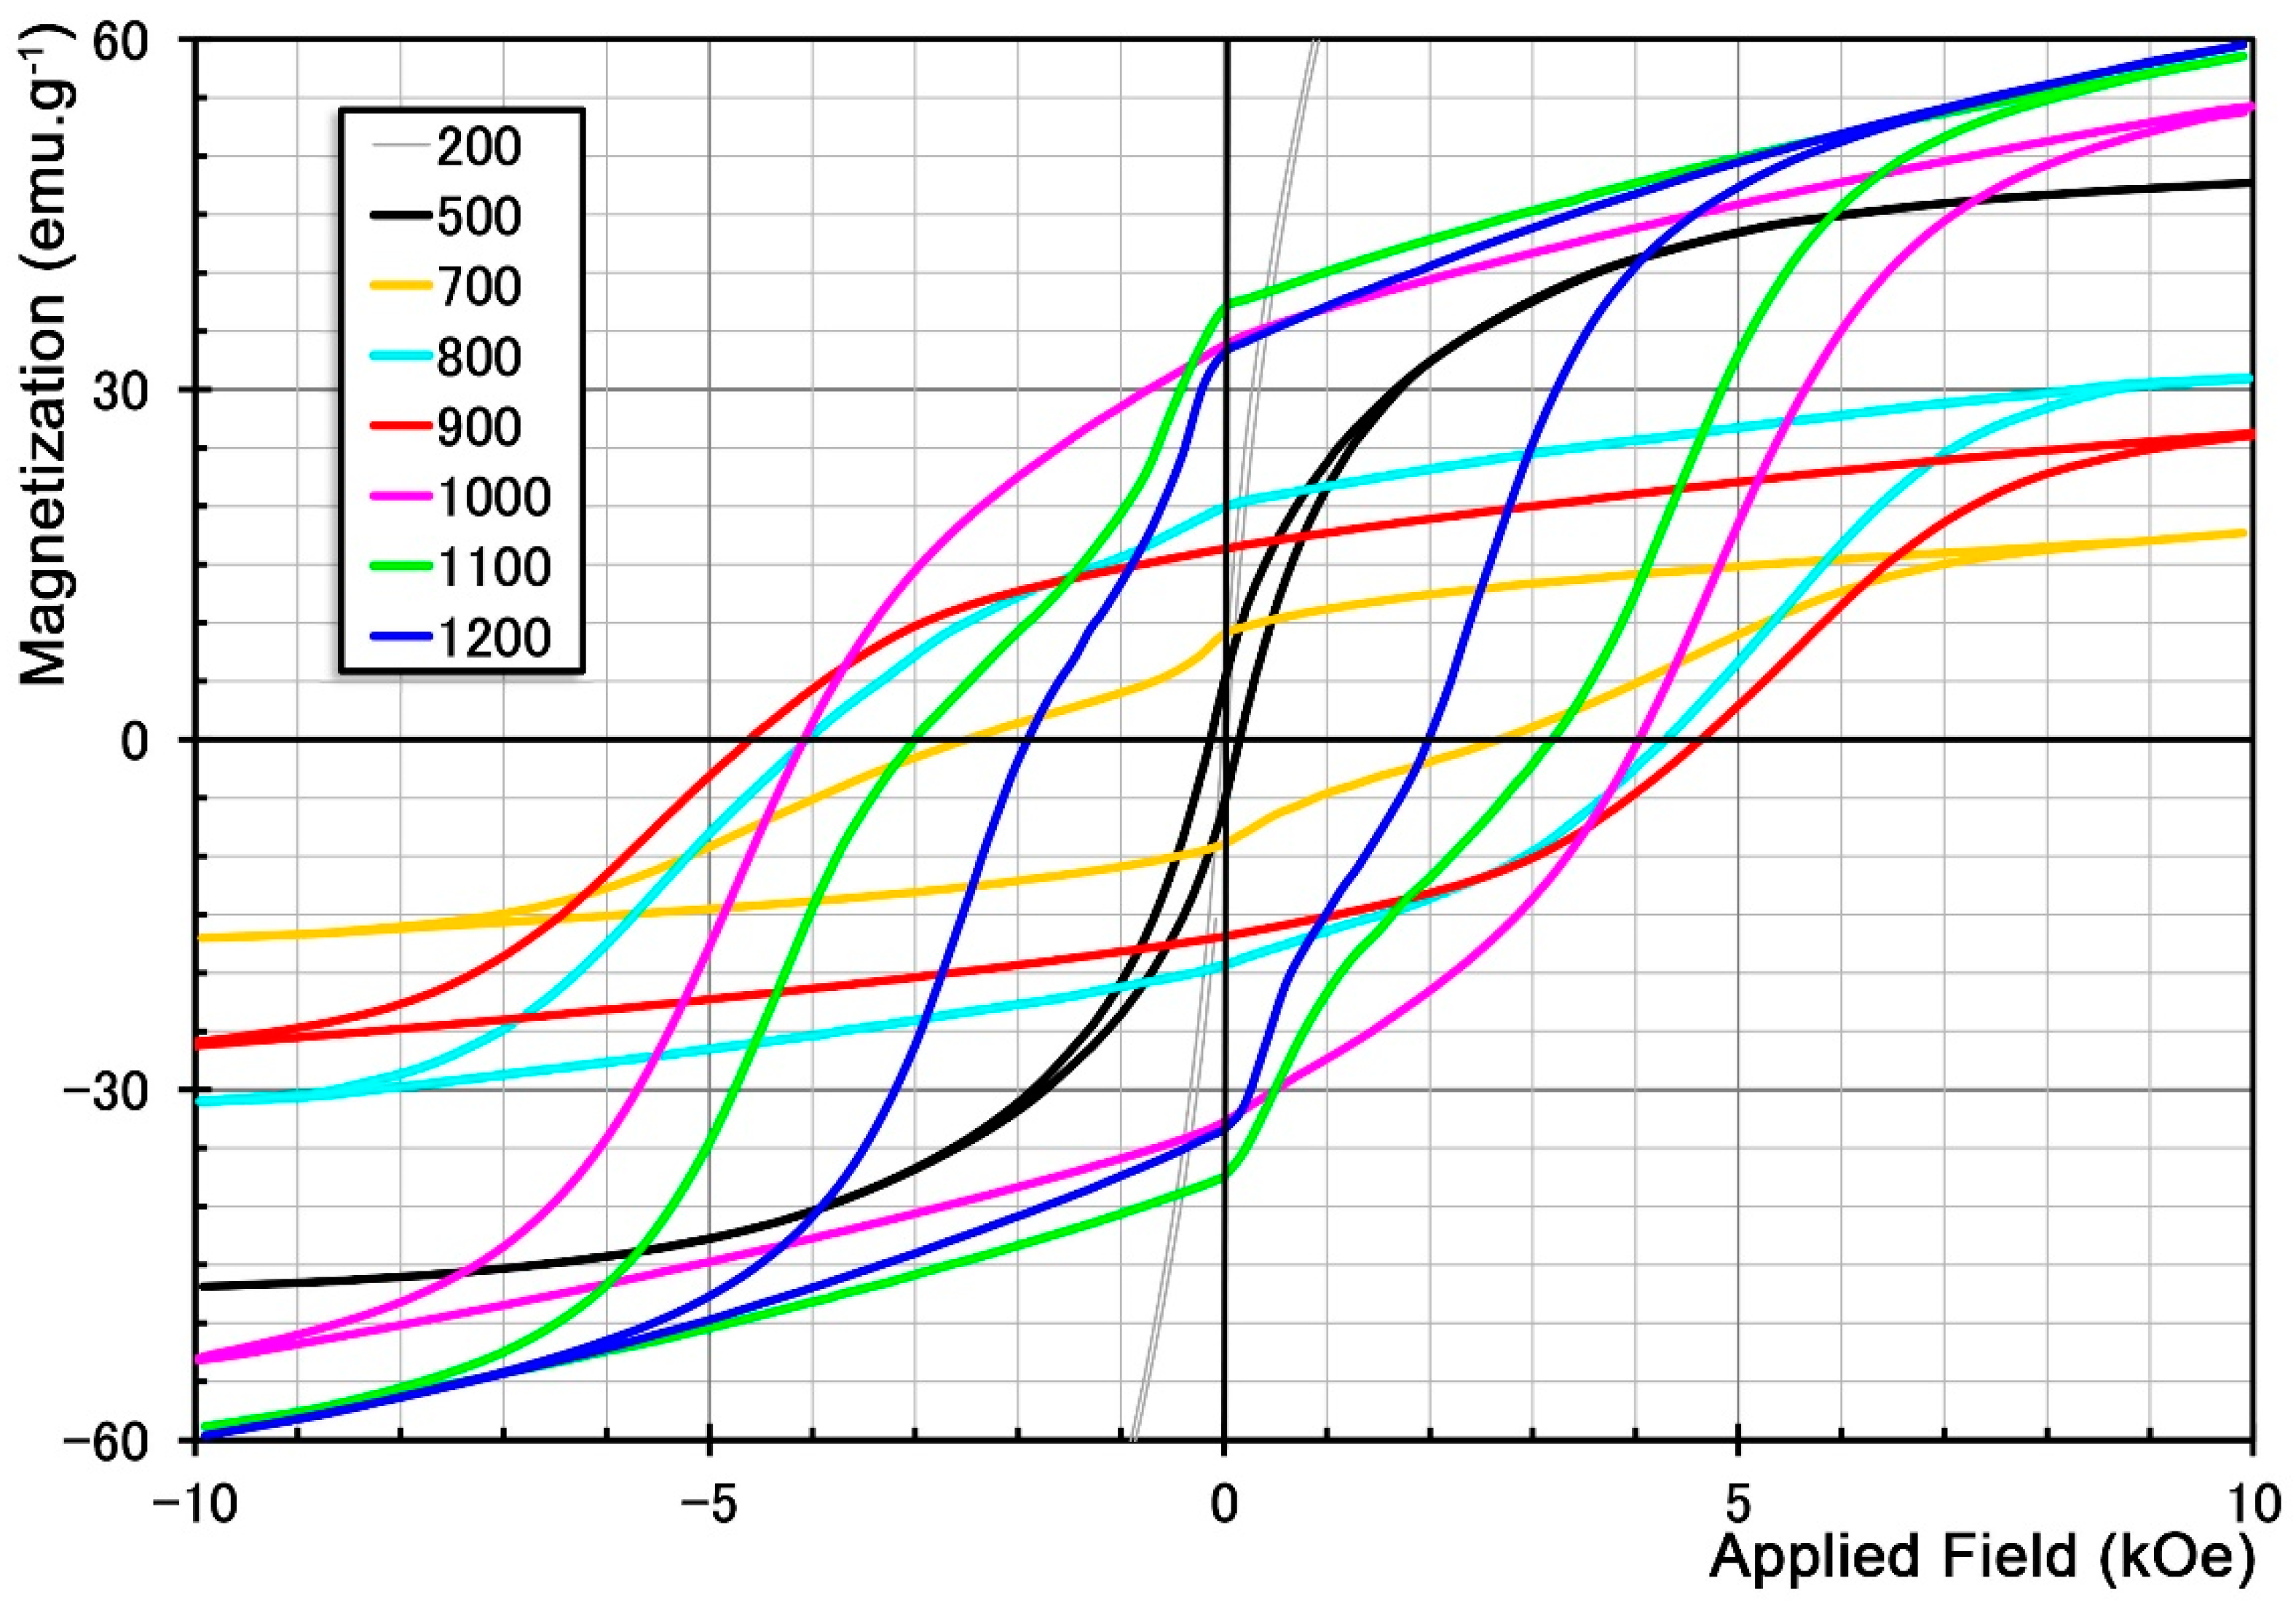
Figure 2, it can be concluded that the sample has the lowest saturation magnetization at 700 °C, and below this temperature, the saturation magnetization increases with a soft behavior; at a higher temperature, the saturation magnetization increases but with a hard behavior. Therefore, 700 °C can be considered as the transition temperature from soft to hard magnetic behavior. After 700 °C, there is a direct relationship between the calcination temperature and the saturation magnetization as well as the remanence. The saturation magnetization approaches its maximum at temperatures of 1100 and 1200 °C.
The area of the hysteresis loop in the second quadrant has the highest value for the sample calcined at 1000 °C. According to Figure 2, the temperature range of 900 to 1000 °C seems to be the turning point of the uniform behavior in the second quadrant of hysteresis loop, and at other temperatures, this behavior is similar to the two or multi-phase behavior.

3.2. Magnetic Properties Change Procedure during the Re-Calcination after Optimized CH4 Gas Heat Treatment

The saturation magnetization of samples reduced under the best conditions and then calcined at different temperatures was summarized and listed in Table 2. Figure 4 also shows the curve of these changes.
According to 
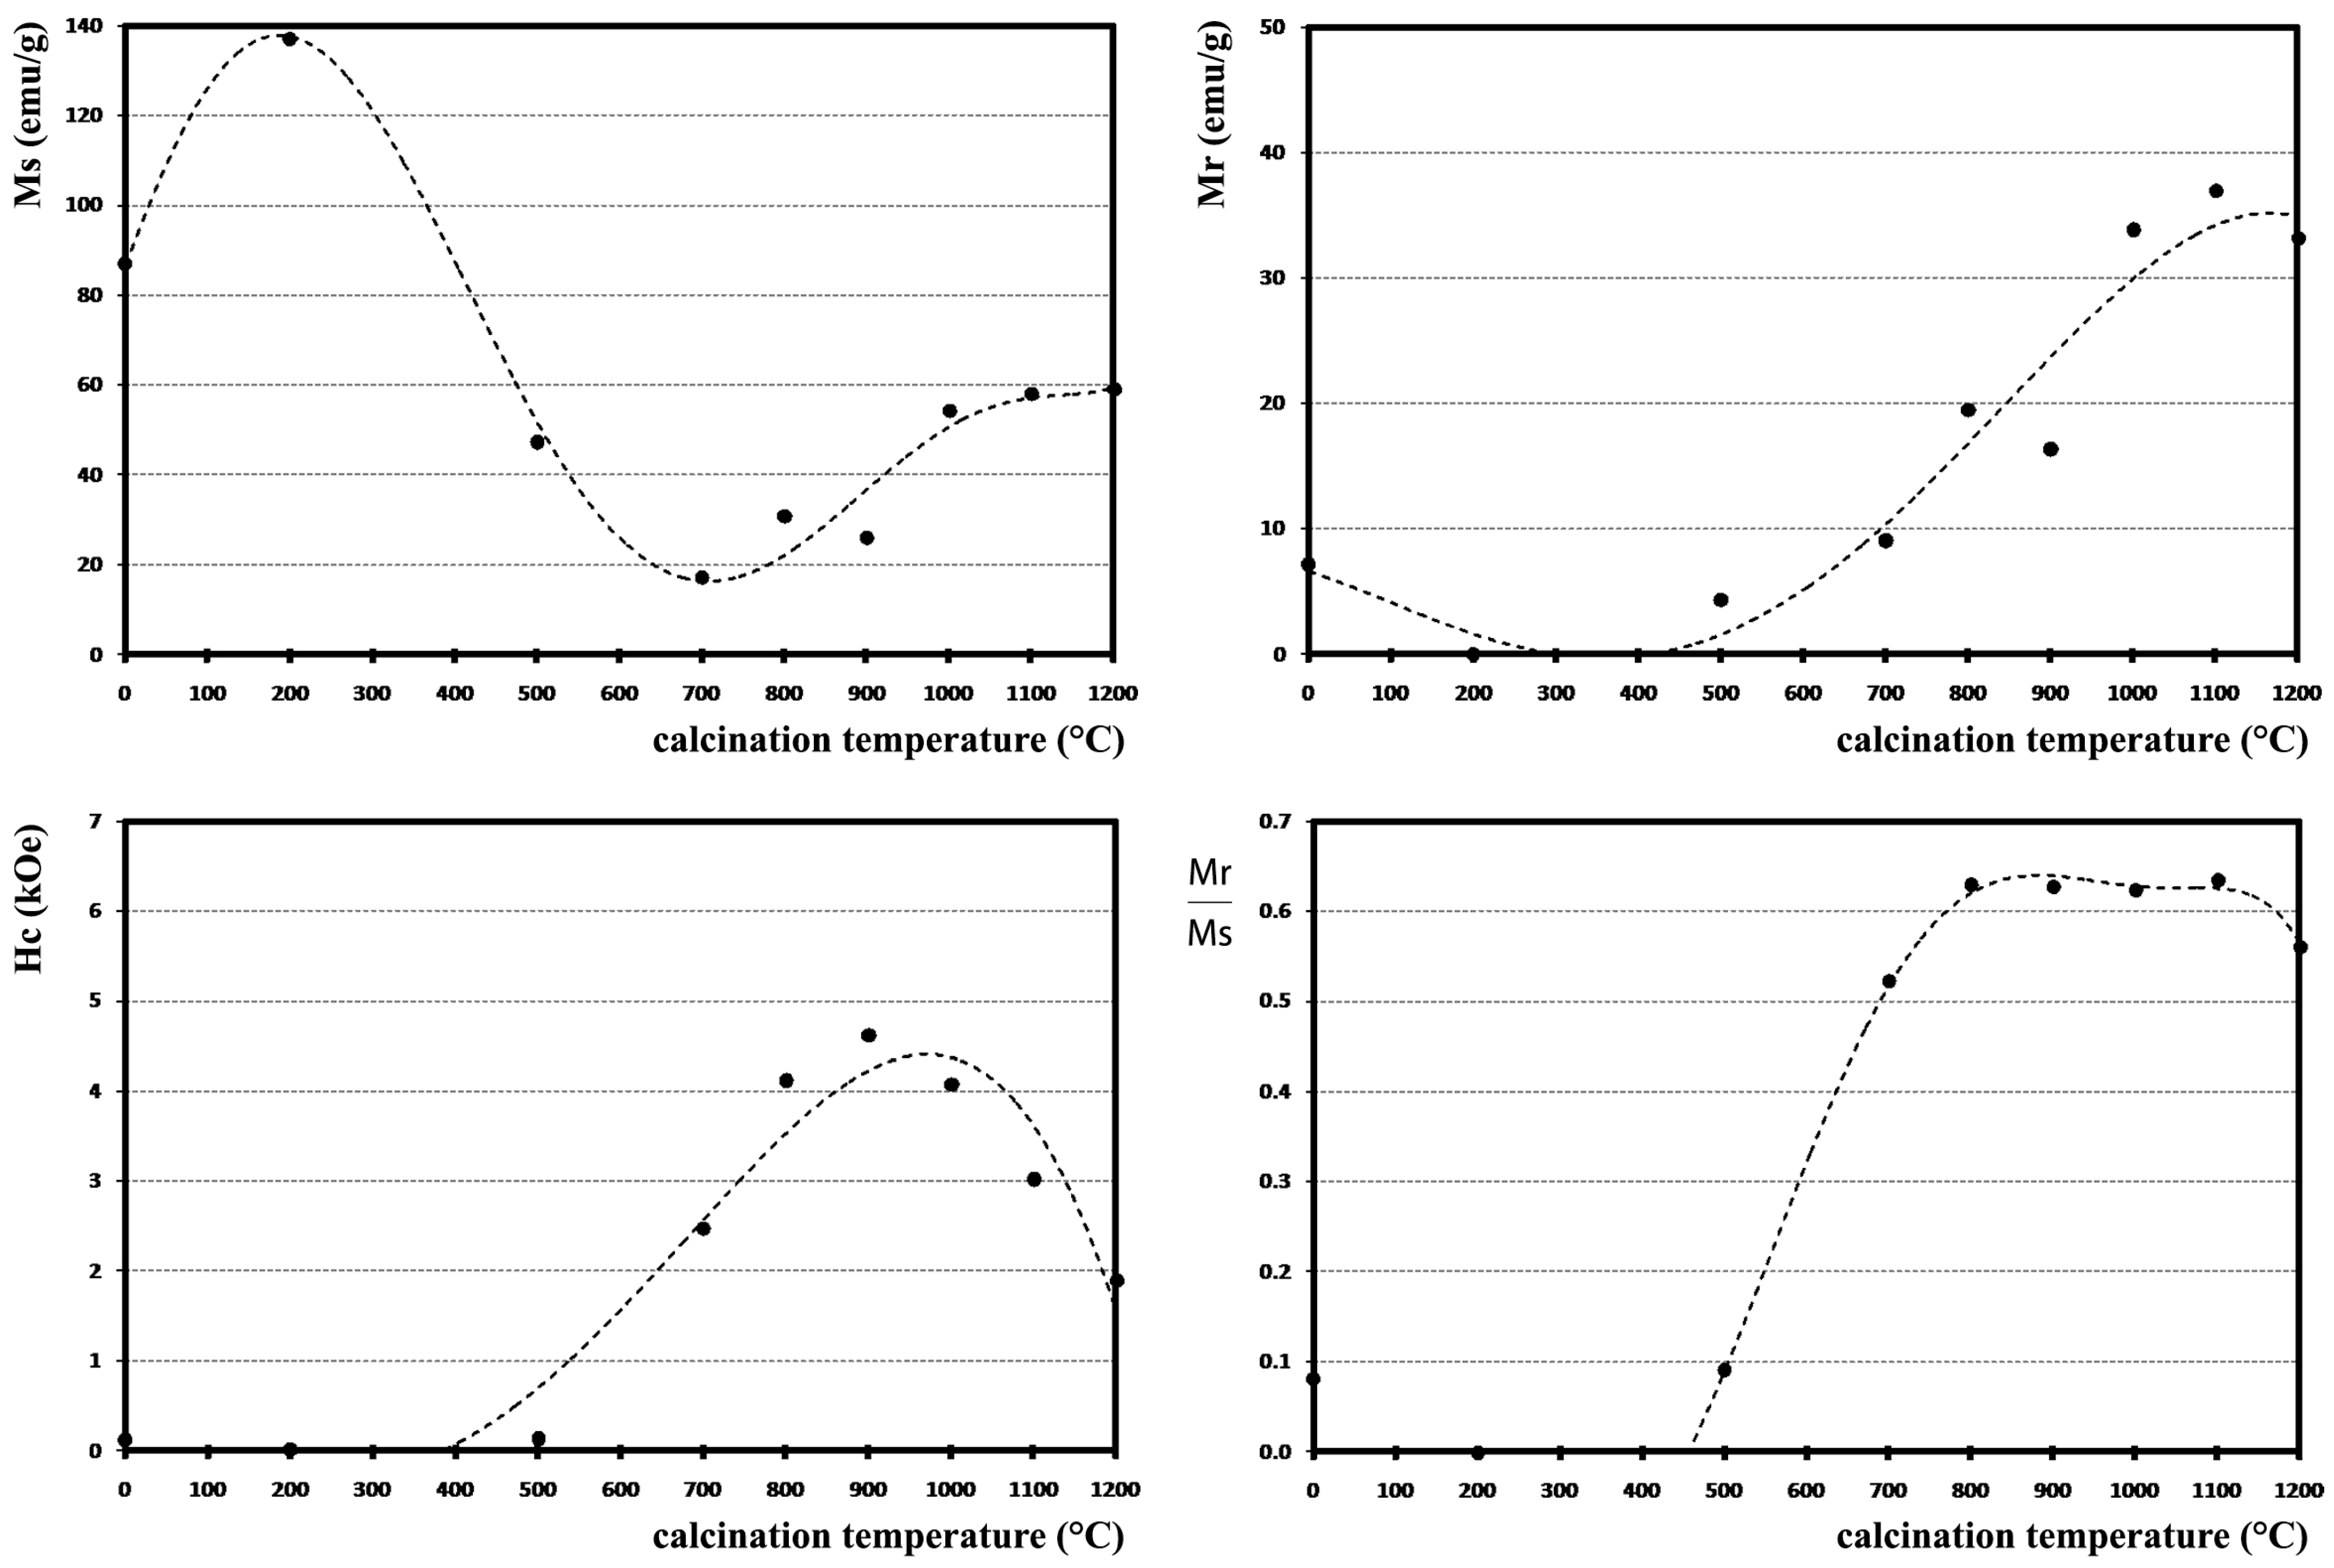
Figure 4, the saturation magnetization of the sample obtained from the reduction process increases after calcination at 200 °C. This increase in the saturation magnetization can be attributed to the effect of relaxation and stress relief during heat treatment because there is no phase transformation in the samples. By increasing the calcination temperature to 500 and then 700 °C, the saturation magnetization of the sample decreases, which is caused by the gradual transformation of the pure iron phase into hematite during the oxidation process.
The magnetic behavior changes at 700 °C. Above 700 °C, the saturation magnetization of the sample has an increasing trend as the calcination temperature increases and reaches its maximum above 1000 °C. The observed behavior after 700 °C is due to the gradual formation of the Sr-hexaferrite phase. The saturation magnetization of samples increases with as the Sr-hexaferrite phase percentage increases, and after 1000 °C, when almost all of the sample turns into Sr-hexaferrite, the increasing trend of saturation magnetization stops.
The remanence of samples reduced under the best conditions and then calcined at different temperatures is summarized and listed in Table 2. Figure 4 shows the curve of these changes.
According to Table 2 and Figure 4, at high temperatures (after 500 °C), the remanence has an increasing trend with increasing calcination temperature. In fact, when the first particles of Sr-hexaferrite (at 700 °C) are formed, the remanence, which is the result of the asymmetric structure of the Sr-hexaferrite phase, starts to increase. However, the maximum value of the remanence is obtained at 1100 °C, and the decrease of remanence after 1100 °C can be attributed to the increase of particle size.
The coercivity of samples was summarized and listed in Table 2. Figure 4 also shows the curve of these changes.
According to Figure 4, the coercivity is from close to zero up to 500 °C; after this temperature, it increases and reaches its maximum at 800–1000 °C, then decreases at higher temperatures. No hard magnetic phase was formed in the sample up to 700 °C; therefore, the coercivity did not increase significantly. The increase of coercivity up to 900 °C is proportional to the increase of Sr-hexaferrite phase in the sample, confirming the direct effect of Sr-hexaferrite in increasing the coercivity. However, after this temperature, a decreasing trend in the coercivity was observed, which is proportional to the calcination temperature. In fact, 900 °C is the transition point for the coercivity. According to the phase percentages in the sample (Table 1), it was observed that the amount of Sr-hexaferrite at 900 °C is about half in comparison with 1200 °C. Therefore, it may be possible to attribute the rise and fall of the coercivity to the stages of nucleation and growth of the Sr-hexaferrite phase. This means that, as long as the nucleation of Sr-hexaferrite fine particles continues, the coercivity increases in proportion to the number of new nuclei, and as a result, the percentage of the Sr-hexaferrite phase in the sample increases. Then, the growth of these nuclei will reduce the coercivity due to the increase in the particle size and the change in the demagnetization mechanism of the particles.
Another important parameter in determining the magnetic behavior of materials is Mr/Ms ratio. The ratio Mr/Ms of samples were summarized and listed in Table 2. Figure 4 also shows the curve of these changes.
Figure 4 shows that the ratio Mr/Ms increases rapidly after 500 °C, reaches its maximum at 800–1100 °C, and then decreases again. Two factors can play a role in the ratio Mr/Ms: the values of Mr and Ms, and the distance between these two quantities. For example, the distance between these two quantities is the lowest at 700 °C, and it would see that the ratio Mr/Ms should have its highest value in this condition; instead, the ratio Mr/Ms had its maximum at 800 to 1100 °C. This occurred because of the higher value of both Mr and Ms compared to their values at 700 °C. As Figure 2 shows, however, only the samples calcined at 900 and 1000 °C have uniform curves with no change in slope.
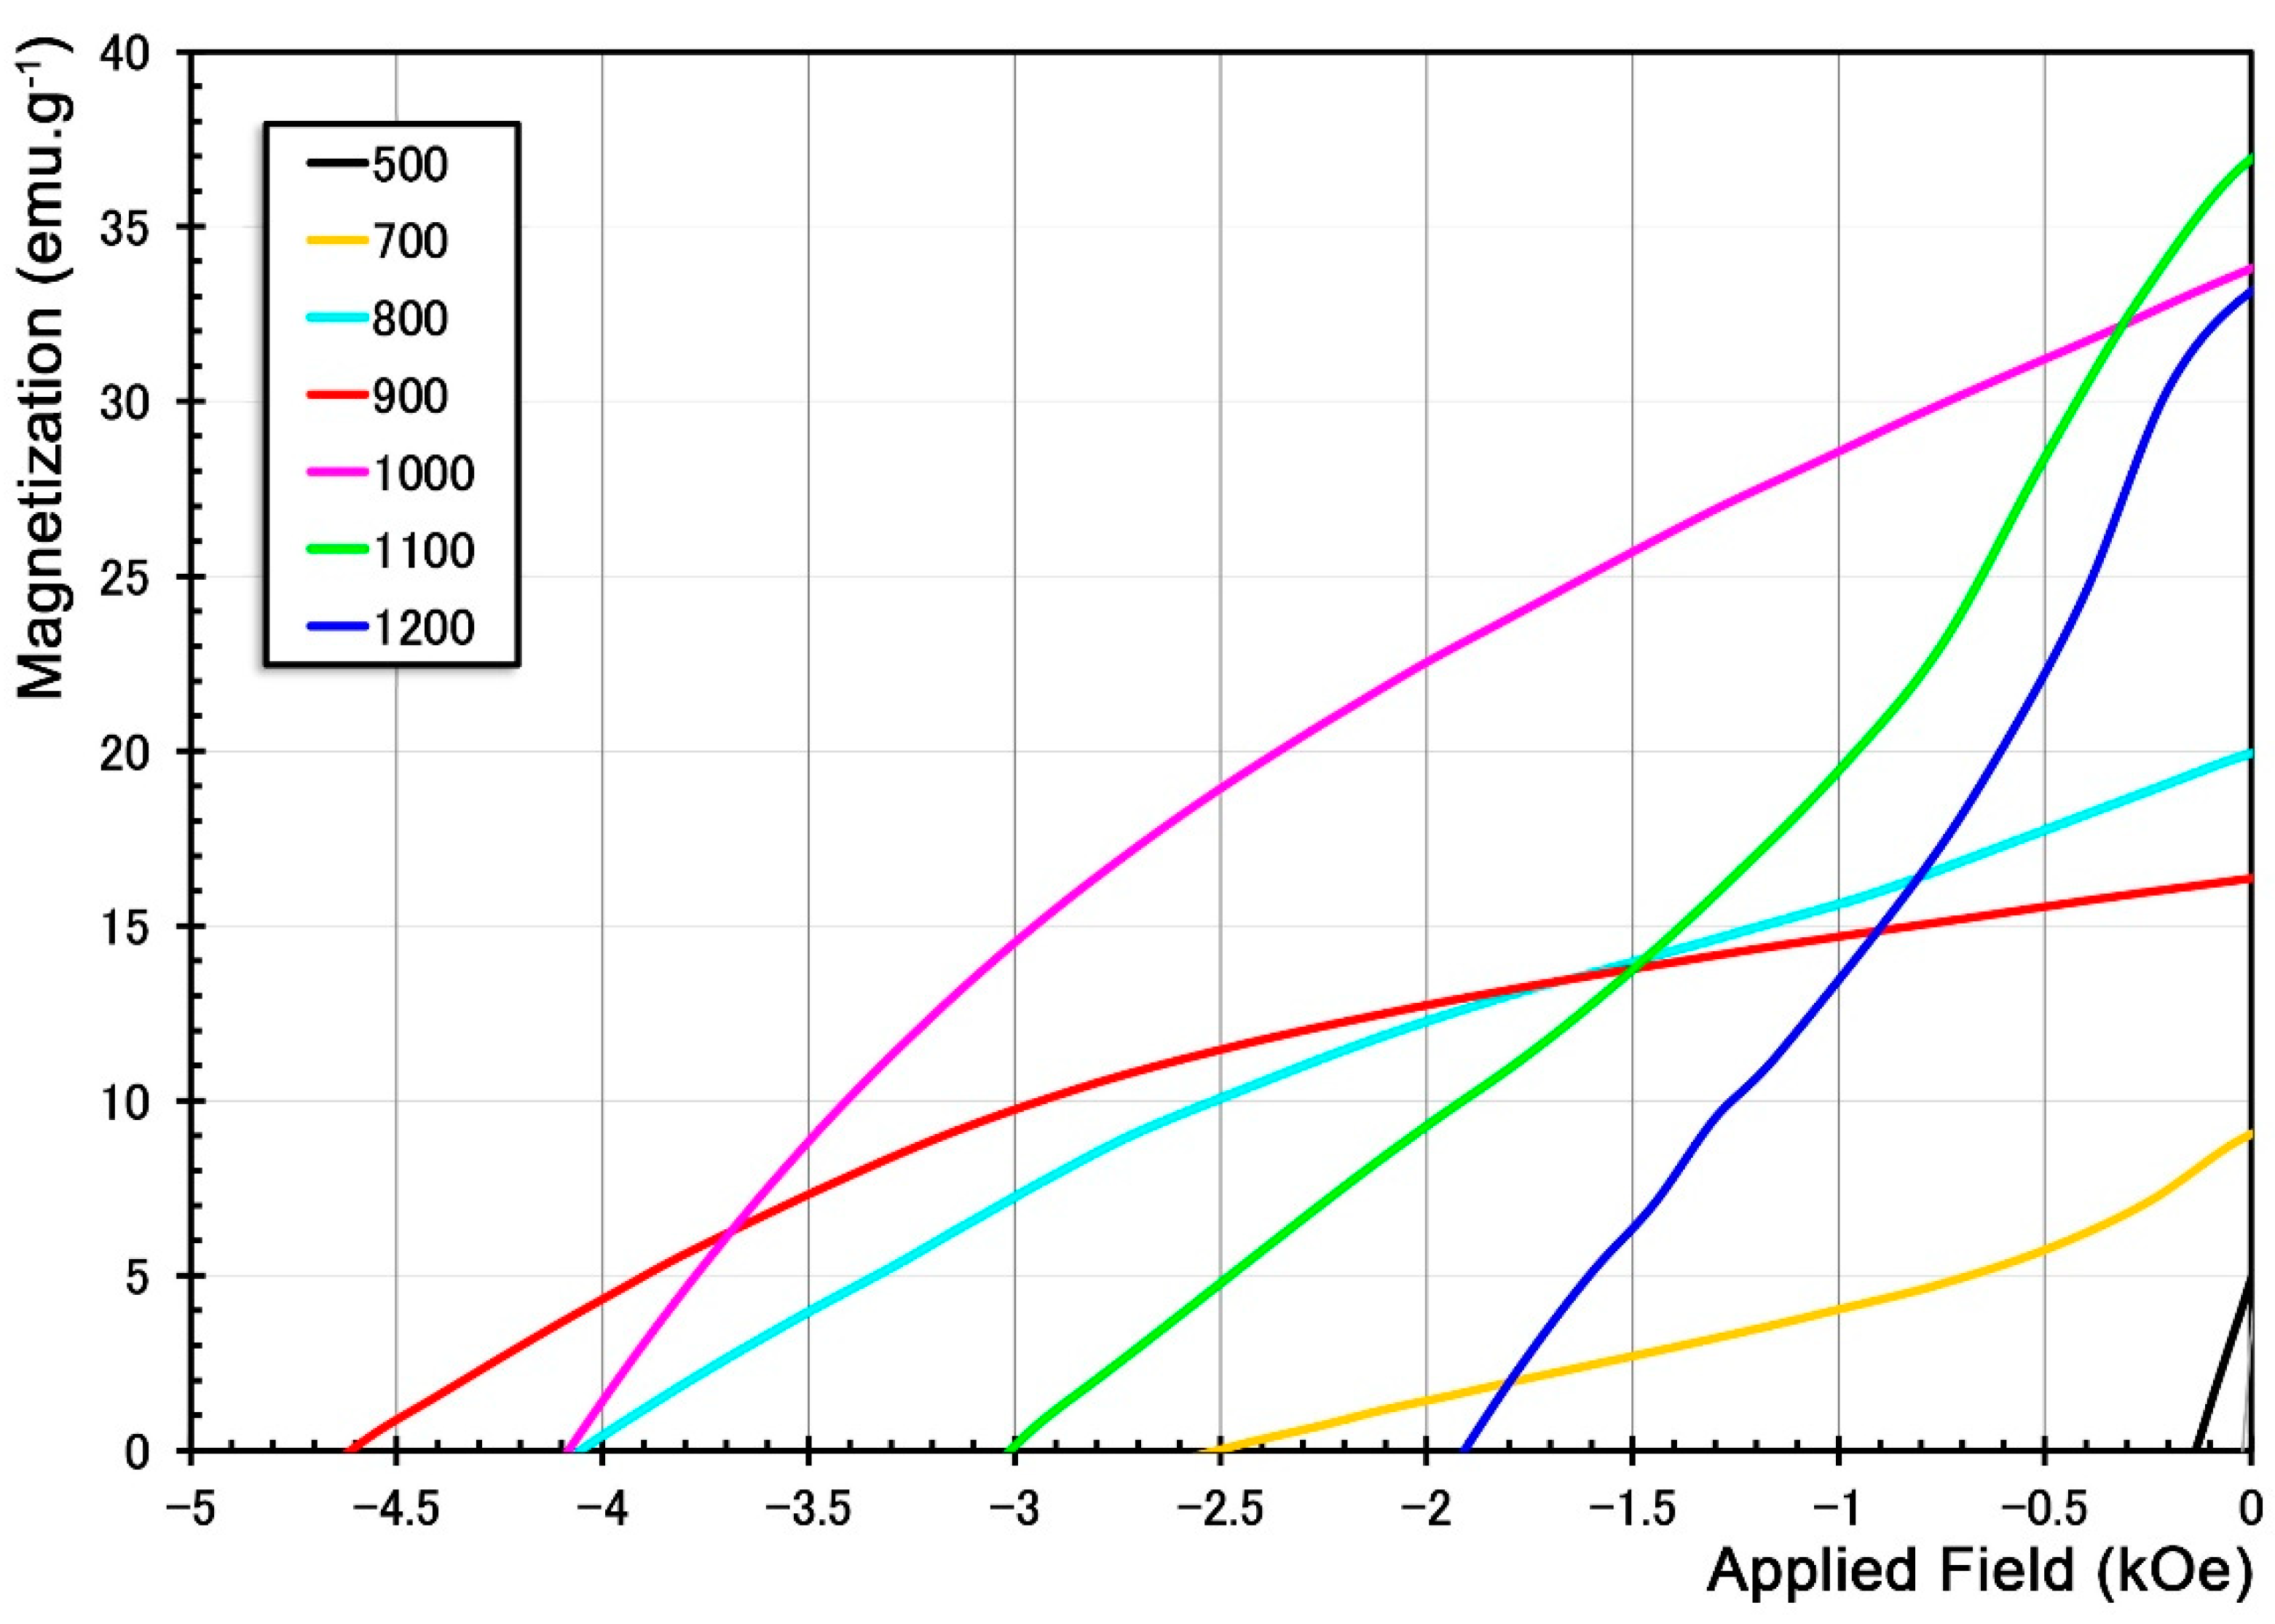
Figure 5 shows the area under the second quadrant of hysteresis curves of reduced and consequently calcined samples at different temperatures for comparison. Although the ratio Mr/Ms was almost equal in both temperatures of 900 °C and 1000 °C, the hysteresis curves indicate that the most significant area under the second quadrant belongs to the sample calcined at 1000 °C. Therefore, the temperature 1000 °C was selected as the optimum temperature for re-calcination in the GTR process to have the best magnetic properties.
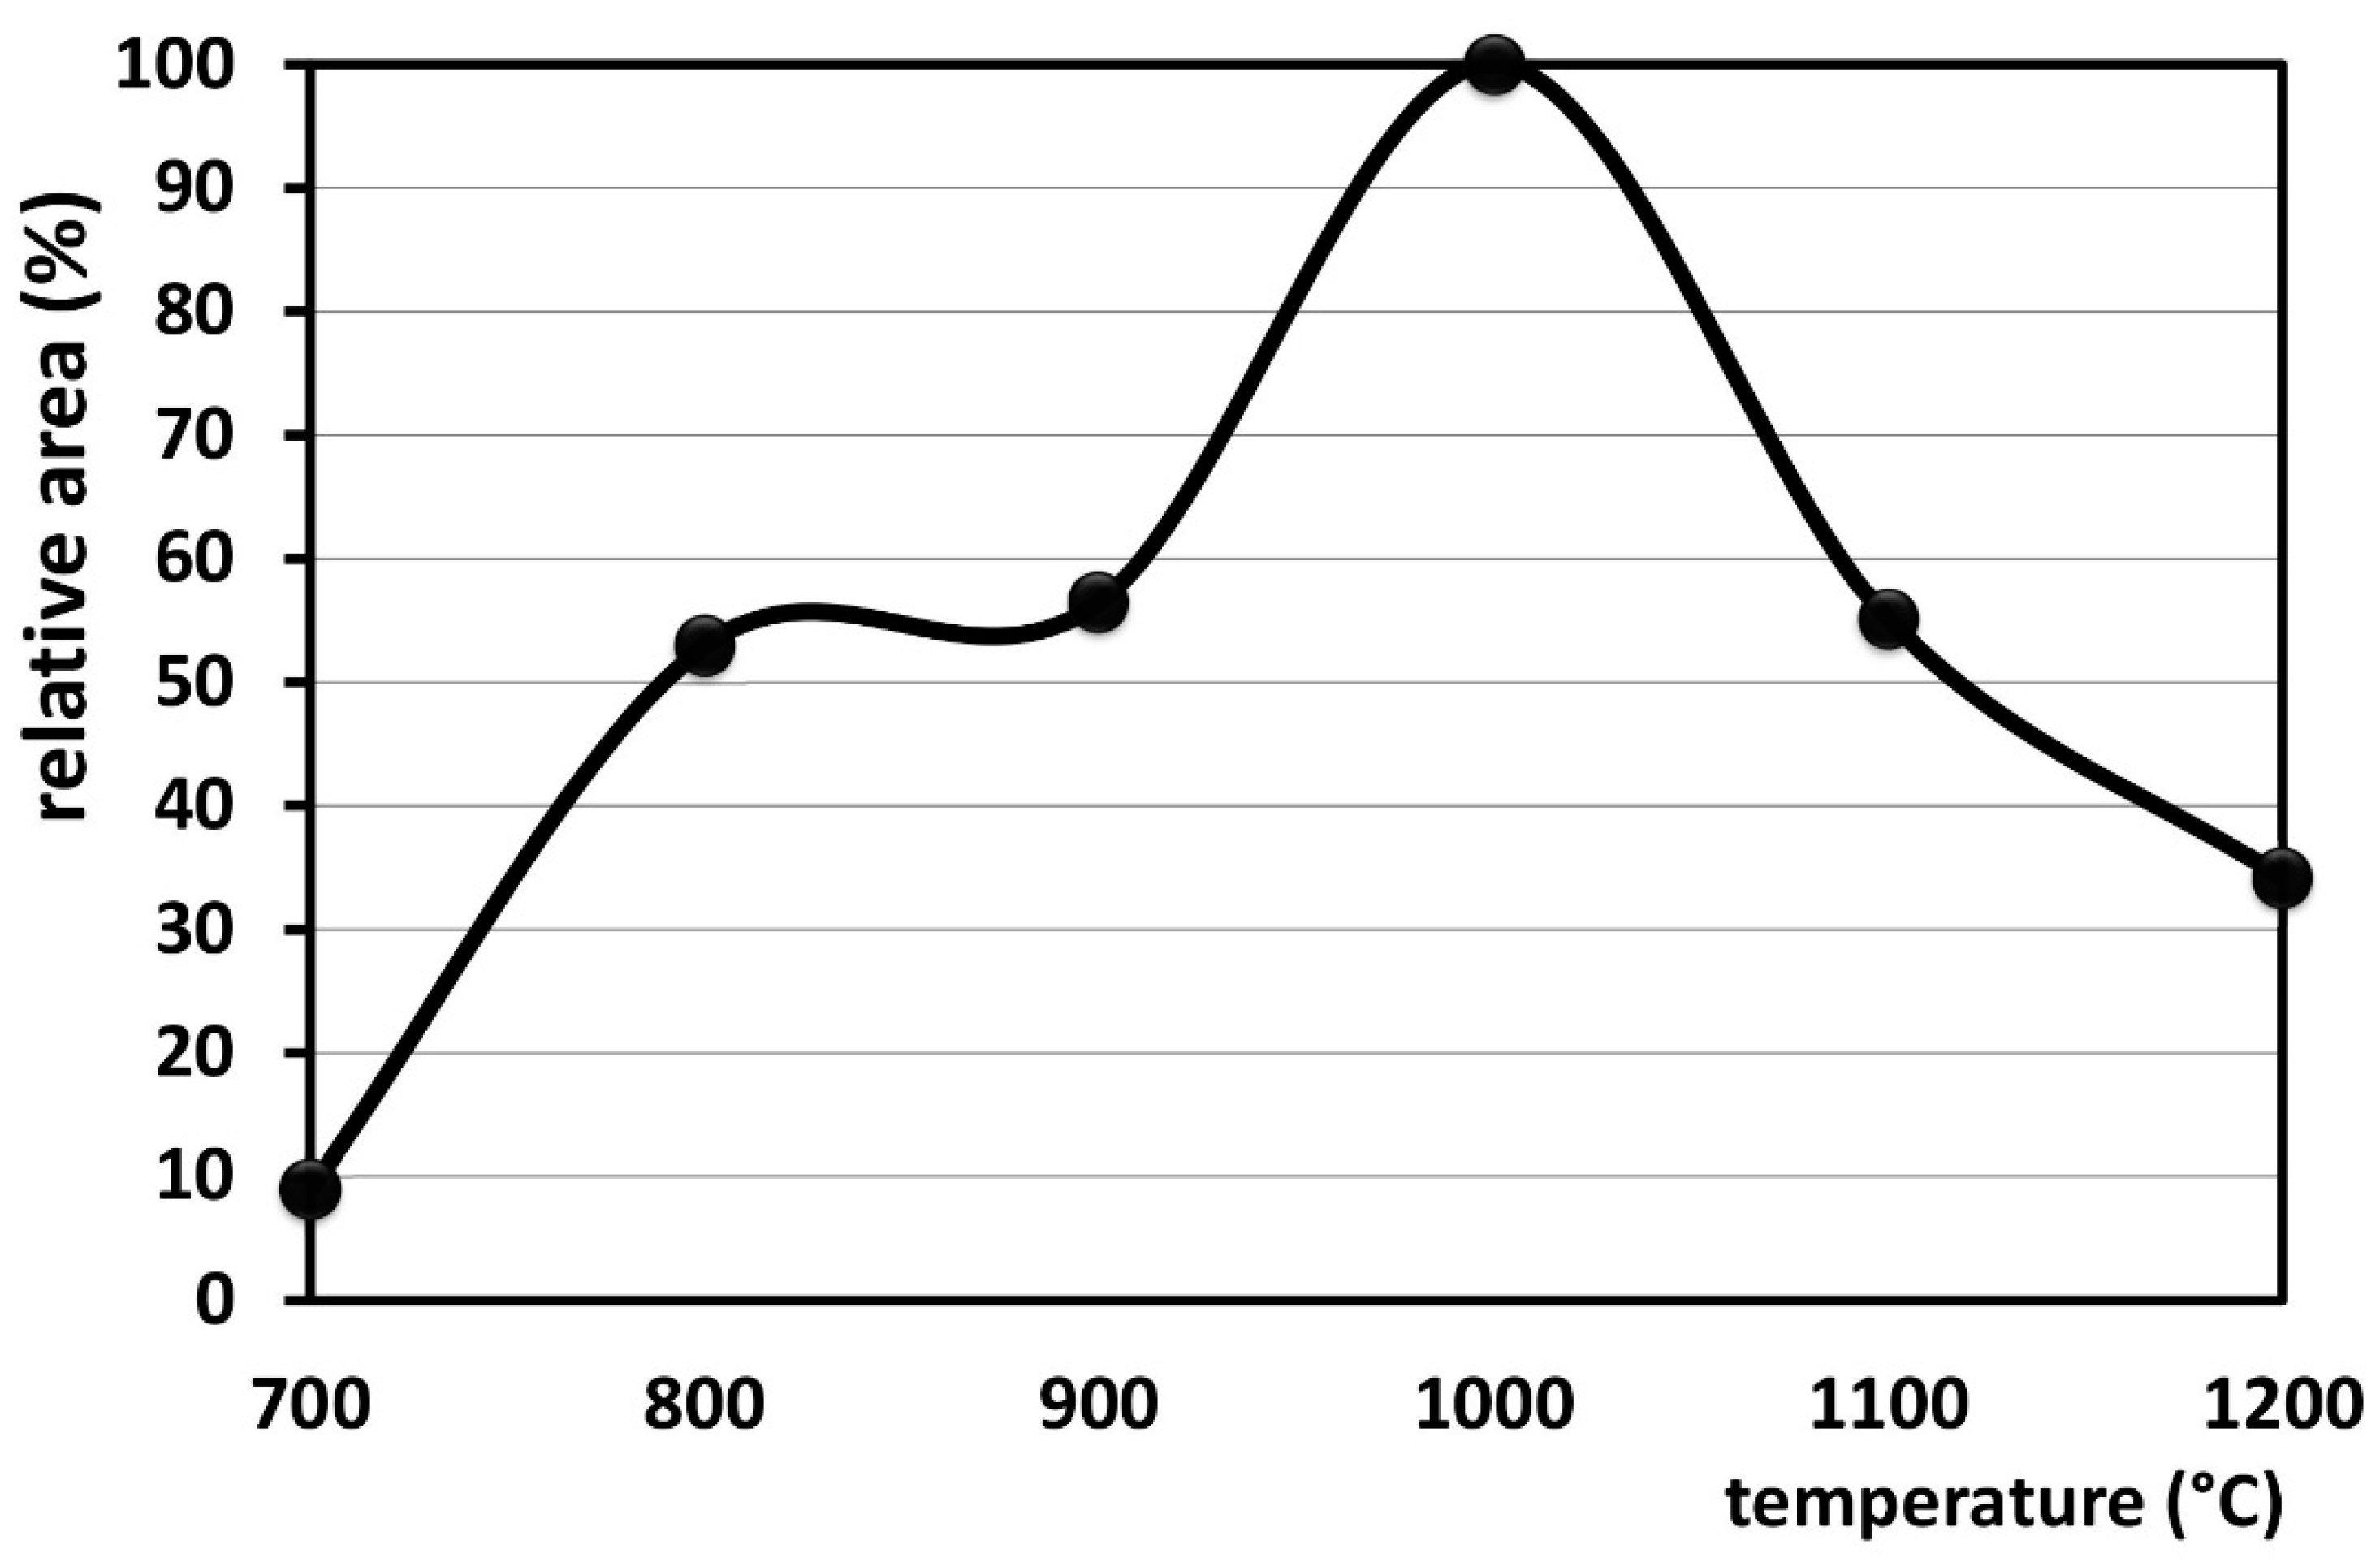
The area under each curve (in the second quadrant) was determined by counting pixels with the help of a graphical software and then normalized and expressed as a percentage for ease of comparison. The results are presented in Table 3 and compared in the Figure 6.

3.3. Analysis of Exchange Coupling Effect in Increasing the Magnetic Properties of the Optimum Sample

The results of magnetic behavior investigations of samples during the GTR process showed that, unexpectedly, the best magnetic properties were not obtained for the final product of single-phase Sr-hexaferrite powder. The sample calcined at 1000 °C, which still contains some hematite phase, showed better magnetic properties. It was observed that this product had a uniform magnetization curve along with the best magnetic properties. Due to the unexpectedness of the result, this sample was again prepared and analyzed under the same conditions, and completely similar results were obtained. Therefore, the possibility of forming an exchange coupling between Sr-hexaferrite and hematite in this sample is the most probable reason for such a phenomenon.
The most straightforward criterion for the exchange coupling phenomenon is the shape of magnetization curve. The composite obtained from two materials with different magnetic properties can produce different states of magnetic behavior depending on the interaction between these two materials. When the two constituent materials cannot interact effectively with each other, the shape of the magnetization curve will be distorted due to the behavior of two different phases. For example, during demagnetization, the phase with soft behavior will quickly decrease the magnetization, and the curve will be more affected by the hard phase behavior. When the two phases cause the demagnetization behavior of the resulting composite to be reversible in the second quadrant by stopping the reverse field, the soft phase returns to the initial magnetization value. However, when the behavior of the nanocomposite magnetization curve is the same as the magnetic behavior of a single-phase material, the phenomenon of exchange coupling occurs. Nanocomposite systems with such behavior are called rigid magnetic nanocomposites [10,22].
Up to 800 °C, there is less of a hard phase, and it is not possible for exchange coupling between two phases to occur. On the other hand, from 1100 °C and above, the ratio of the two phases is not enough to cause a strong exchange interaction, and due to high temperatures, the growth of some hard phase particles causes a drop in their hard properties. Fine and coarse hard particles together cause non-rigid two-phase behavior. If the content of the soft phase is low, not all hindered spins of the hard phase can rotate towards the magnetic field. Hence, an additional amount of soft phase is needed to overcome the magnetocrystalline anisotropy of the hard ferrite phase. When the amount of soft phase is sufficient, its combination with the hard phase forms an interfacial region. In this region, the soft phase has low magnetocrystalline anisotropy, and its magnetic moments can softly orient towards the magnetic field. By creating a torque, the hindered spins of the hard phase switch to the magnetic field, and exchange coupling occurs [11,23].
Finally, according to the ratio of ferrite and hematite (Table 1) the shape of the magnetization curve at 1000 °C can indicate the exchange interaction between these two phases. The ratio Mr/Ms can also be a measure for exchange coupling. In composites with dual magnetic behavior, at Mr/Ms > 0.5, the composite’s behavior is close to the ideal rigid behavior [24,25]. In this research, it was observed that above 700 °C, the magnetic behavior tends to the ideal rigid behavior, but the maximum value of ratio Mr/Ms occurs between 800 and 1100 °C. Therefore, it can be concluded that the sample calcined at 1000 °C has the necessary conditions for exchange coupling.

4. Conclusions

The magnetic behavior of conventionally synthesized Sr-hexaferrite during CH4 gas heat treatment and re-calcination were investigated. According to the VSM results, by oxidizing all iron at 500 °C, poor soft magnetic material was obtained, and the temperature of 700 °C was the transition temperature from soft to hard magnetic behavior with Hc = 2.47 kOe. By increasing the temperature to 800 °C, the first magnetically hard sample with Hc = 4.13 kOe was obtained, although the amount of Sr-hexaferrite phase was still very low. At 900 °C, the amount of the Sr-hexaferrite phase was doubled compared to 800 °C and the highest Hc (4.62 kOe) was obtained, but the saturation magnetization (Ms = 26.08 emu g−1) and remanence (Mr = 16.36 emu g−1) are still low. At 1000 °C, there was a slight drop in Hc (4.08 kOe) compared to 900 °C, but an increase of about 17% compared to the conventionally synthesized sample (3.5 kOe). The Ms = 54.28 emu g−1 and Mr = 33.83 emu g−1 were more than twice the values obtained at 900 °C and were competitive with the conventional sample (Ms = 60.88 emu g−1 and Mr = 35.30 emu g−1). At 1100 °C and 1200 °C, upon reaching Sr-hexaferrite single phase as well as particle growth, Hc changed to 3.02 kOe and 1.90 kOe, Ms to 58.18 emu g−1 and 59.12 emu g−1, and Mr to 36.93 emu g−1 and 33.14 emu g−1, respectively.
According to the results, the sample prepared at the calcination temperature of 1000 °C seems to be optimal. The coercivity of this sample was much higher than the initial Sr-hexaferrite. Furthermore, this sample had a completely uniform hysteresis loop, as long as high Mr/Ms, showing the conditions for exchange coupling. The hysteresis loop area in the second quadrant was also the best among the other samples.

Supplementary Materials

The following supporting information can be downloaded at: https://www.mdpi.com/article/10.3390/magnetochemistry9040103/s1, Figure S1: XRD pattern of Sr-hexaferrite powder prepared by conventional method; Figure S2: SEM image of Sr-hexaferrite powder prepared by conventional method [26]; Figure S3: Hysteresis curve of the initial Sr-hexaferrite powder prepared by the conventional method; Figure S4: XRD pattern of the Sr-hexaferrite powder reduced under the best conditions (temperature: 950 °C, gas flow rate:15 cc min−1 and time: 30 min); Figure S5: Hysteresis curve of the sample reduced under the best conditions (temperature: 950 °C, gas flow rate:15 cc min−1 and time: 30 min) and then calcined at 200 °C; Figure S6: Hysteresis curve of the sample reduced under the best conditions (temperature: 950 °C, gas flow rate:15 cc min−1 and time: 30 min) and then calcined at 500 °C; Figure S7: The hysteresis curve of the sample was reduced under the best conditions (temperature: 950 °C, gas flow rate:15 cc min−1, and time: 30 min) and then calcined at 700 °C; Figure S8: Hysteresis curve of the sample reduced under the best conditions (temperature: 950 °C, gas flow rate:15 cc min−1 and time: 30 min) and then calcined at 800 °C; Figure S9: Hysteresis curve of the sample reduced under the best conditions (temperature: 950 °C, gas flow rate:15 cc min−1, and time: 30 min) and then calcined at 900 °C; Figure S10: Hysteresis curve of the sample reduced under the best conditions (temperature: 950 °C, gas flow rate:15 cc min−1 and time: 30 min) and then calcined at 1000 °C; Figure S11: Hysteresis curve of sample reduced under the best conditions (temperature: 950 °C, gas flow rate:15 cc min−1, and time: 30 min) and then calcined at 1100 °C; Figure S12: The hysteresis curve of the sample was reduced under the best conditions (temperature: 950 °C, gas flow rate:15 cc min−1, and time: 30 min) and then calcined at 1200 °C; Figure S13: FE-SEM image of the sample reduced under the best conditions (temperature: 950 °C, gas flow rate:15 cc min−1 and time: 30 min) and then calcined at 700 °C; Figure S14: FE-SEM images of the sample reduced under the best conditions (temperature: 950 °C, gas flow rate:15 cc min−1 and time: 30 min) and then calcined at 1000 °C for one hour; Figure S15: TEM images of the sample reduced under the best conditions (temperature: 950 °C, gas flow rate:15 cc min−1 and time: 30 min) and then re-calcined at 1000 °C for one hour [27]; Table S1: Summary of crystallite size of phases after re-calcination process with different calcination conditions; the heat treatment conditions before re-calcination for all samples were temperature: 950 °C, gas flow rate:15 cc min−1, and time: 30 min.

Author Contributions

Conceptualization, S.A.S.E.; Data curation, R.D.; Formal analysis, R.D.; Investigation, R.D. and Z.L.; Project administration, S.A.S.E.; Resources, S.A.S.E. and B.H.; Supervision, S.A.S.E.; Validation, R.D.; Visualization, R.D.; Writing—original draft, Z.L.; Writing—review & editing, S.A.S.E. and B.H. All authors have read and agreed to the published version of the manuscript.

Funding

This research received no external funding.

Data Availability Statement

The data presented in this study are available on request from the first author.

Conflicts of Interest

The authors declare no conflict of interest.

References

  1. Semaida, A.M.; Darwish, M.A.; Salem, M.M.; Zhou, D.; Zubar, T.I.; Trukhanov, S.V.; Savchenko, A.G. Impact of Nd3+ Substitutions on the Structure and Magnetic Properties of Nanostructured SrFe12O19 Hexaferrite. Nanomaterials 2022, 12, 3452. [Google Scholar] [CrossRef] [PubMed]
  2. Agayev, F.G.; Trukhanov, S.V.; Jabarov, S.H.; Ayyubova, G.S.; Mirzayev, M.N.; Trukhanova, E.L.; Vinnik, D.A.; Kozlovskiy, A.L.; Zdorovets, M.V.; Sombra, A.S.B.; et al. Study of structural features and thermal properties of barium hexaferrite upon indium doping. J. Therm. Anal. Calorim. 2022, 147, 14107–14114. [Google Scholar] [CrossRef]
  3. Herzer, G.; Vazquez, M.; Knobel, M.; Zhukov, A.; Reininger, T.; Davies, H.; Grössinger, R.; Ll, J.S. Round table discussion: Present and future applications of nanocrystalline magnetic materials. J. Magn. Magn. Mater. 2005, 294, 252–266. [Google Scholar] [CrossRef]
  4. Lalegani, Z.; Nemati, A. Influence of synthesis variables on the properties of barium hexaferrite nanoparticles. J. Mater. Sci. Mater. Electron. 2016, 28, 4606–4612. [Google Scholar] [CrossRef]
  5. Meiklejohn, W.H.; Bean, C.P. New Magnetic Anisotropy. Phys. Rev. 1956, 102, 1413–1414. [Google Scholar] [CrossRef]
  6. Nogués, J.; Schuller, I.K. Exchange bias. J. Magn. Magn. Mater. 1999, 192, 203–232. [Google Scholar] [CrossRef]
  7. Nogués, J.; Sort, J.; Langlais, V.; Skumryev, V.; Suriñach, S.; Muñoz, J.; Baró, M. Exchange bias in nanostructures. Phys. Rep. 2005, 422, 65–117. [Google Scholar] [CrossRef]
  8. Kiwi, M. Exchange bias theory. J. Magn. Magn. Mater. 2001, 234, 584–595. [Google Scholar] [CrossRef]
  9. Porat, A.; Bar-Ad, S.; Schuller, I.K. Novel laser-induced dynamics in exchange-biased systems. EPL (Europhysics Lett.) 2009, 87, 67001. [Google Scholar] [CrossRef] [Green Version]
  10. Kneller, E.; Hawig, R. The exchange-spring magnet: A new material principle for permanent magnets. IEEE Trans. Magn. 1991, 27, 3588–3600. [Google Scholar] [CrossRef]
  11. Almessiere, M.A.; Slimani, Y.; Algarou, N.A.; Vakhitov, M.G.; Klygach, D.S.; Baykal, A.; Auwal, İ.A. Tuning the Structure, Magnetic, and High Frequency Properties of Sc-Doped Sr0.5Ba0.5ScxFe12-xO19/NiFe2O4 Hard/Soft Nanocomposites. Adv. Electron. Mater. 2022, 8, 2101124. [Google Scholar] [CrossRef]
  12. Almessiere, M.; Algarou, N.; Slimani, Y.; Sadaqat, A.; Baykal, A.; Manikandan, A.; Trukhanov, S.; Ercan, I. Investigation of exchange coupling and microwave properties of hard/soft (SrNi0.02Zr0.01Fe11.96O19)/(CoFe2O4)x nanocomposites. Mater. Today Nano 2022, 18, 100186. [Google Scholar] [CrossRef]
  13. Afshar, S.S.; Hasheminiasari, M.; Masoudpanah, S. Structural, magnetic and microwave absorption properties of SrFe12O19/Ni0.6Zn0.4Fe2O4 composites prepared by one-pot solution combustion method. J. Magn. Magn. Mater. 2018, 466, 1–6. [Google Scholar] [CrossRef]
  14. Yu, J.; Bai, L.; Gao, R. Effect of sintering temperature on magnetoelectric coupling in 0.2Ni0.9Zn0.1Fe2O4-0.8Ba0.9Sr0.1TiO3 composite ceramics. Process. Appl. Ceram. 2020, 14, 336–345. [Google Scholar] [CrossRef]
  15. Petrecca, M.; Muzzi, B.; Oliveri, S.M.; Albino, M.; Yaacoub, N.; Peddis, D.; Fernández, C.D.J.; Innocenti, C.; Sangregorio, C. Optimizing the magnetic properties of hard and soft materials for producing exchange spring permanent magnets. J. Phys. D Appl. Phys. 2020, 54, 134003. [Google Scholar] [CrossRef]
  16. Hernando, A.; González, J. Soft and hard nanostructured magnetic materials. Hyperfine Interact. 2000, 130, 221–240. [Google Scholar] [CrossRef]
  17. Raghunathan, A.; Melikhov, Y.; Snyder, J.; Jiles, D. Modeling of two-phase magnetic materials based on Jiles–Atherton theory of hysteresis. J. Magn. Magn. Mater. 2012, 324, 20–22. [Google Scholar] [CrossRef]
  18. Algarou, N.A.; Slimani, Y.; Almessiere, M.A.; Sadaqat, A.; Trukhanov, A.V.; Gondal, M.A.; Baykal, A. Functional Sr0.5Ba0. 5Sm0.02Fe11.98O4/x (Ni0.8Zn0.2Fe2O4) hard–soft ferrite nanocomposites: Structure, magnetic and microwave properties. Nanomaterials 2020, 10, 2134. [Google Scholar] [CrossRef]
  19. Almessiere, M.A.; Güner, S.; Slimani, Y.; Hassan, M.; Baykal, A.; Gondal, M.A.; Trukhanov, A.V. Structural and magnetic properties of Co0.5Ni0.5Ga0.01Gd0.01Fe1.98O4/ZnFe2O4 spinel ferrite nanocomposites: Comparative study between sol-gel and pulsed laser ablation in liquid approaches. Nanomaterials 2021, 11, 2461. [Google Scholar] [CrossRef]
  20. Dehghan, R.; Ebrahimi, S.A.S.; Lalegani, Z.; Hamawandi, B. Different Stages of Phase Transformation in the Synthesis of Nanocrystalline Sr-Hexaferrite Powder Prepared by a Gaseous Heat Treatment and Re-Calcination Method. Nanomaterials 2022, 12, 3714. [Google Scholar] [CrossRef]
  21. Poorbafrani, A.; Salamati, H.; Kameli, P. Exchange spring behavior in Co0.6Zn0.4Fe2O4/SrFe10.5O16.75 nanocomposites. Ceram. Int. 2015, 41, 1603–1608. [Google Scholar] [CrossRef]
  22. Carbucicchio, M.; Rateo, M. Ferromagnetic planar nanocomposites. ICAME 2004, 2003, 581–593. [Google Scholar]
  23. Pahwa, C.; Narang, S.B.; Sharma, P. Composition dependent magnetic and microwave properties of exchange-coupled hard/soft nanocomposite ferrite. J. Alloys Compd. 2019, 815, 152391. [Google Scholar] [CrossRef]
  24. Skomski, R.; Coey, J.M.D. Giant energy product in nanostructured two-phase magnets. Phys. Rev. B 1993, 48, 15812–15816. [Google Scholar] [CrossRef] [PubMed] [Green Version]
  25. Skomski, R.; Coey, J. Exchange coupling and energy product in random two-phase aligned magnets. IEEE Trans. Magn. 1994, 30, 607–609. [Google Scholar] [CrossRef] [Green Version]
  26. Kürşat, İ.Ç.İ.N.; Öztürk, S.; Çakil, D.D.; Sünbül, S.E. Mechanochemical synthesis of SrFe12O19 from recycled mill scale: Effect of synthesis time on phase formation and magnetic properties. J. Alloys Compd. 2021, 873, 159787. [Google Scholar]
  27. Dehghan, R.; Ebrahimi, S.S. Optimized nanocrystalline strontium hexaferrite prepared by applying a methane GTR process on a conventionally synthesized powder. J. Magn. Magn. Mater. 2014, 368, 234–239. [Google Scholar] [CrossRef]
Figure 1. Hysteresis curve of the CH4 heat-treated powder (temperature: 950 °C, gas flow rate: 15 cc min−1, and time: 30 min).
Magnetochemistry 09 00103 g001
Figure 2. Hysteresis curves of CH4 heat-treated powders calcined at 200, 300, 400, 500, 600, 700, 800, 900, 1000, 1100, and 1200 °C for 1 h.
Magnetochemistry 09 00103 g002
Figure 3. FE-SEM images and EDS analysis of the samples reduced under the best conditions (temperature: 950 °C, gas flow rate:15 cc min−1 and time: 30 min) and then calcined at 500 °C, 700 °C, and 1000 °C.
Magnetochemistry 09 00103 g003
Figure 4. Temperature dependence of saturation magnetization, remanence, coercivity, and ratio Mr/Ms for the CH4 heat-treated powder, calcined at different temperatures for 1 h.
Magnetochemistry 09 00103 g004
Figure 5. Second quadrant of magnetization curves of the CH4 heat treated powder, calcined at different temperatures for 1 h.
Magnetochemistry 09 00103 g005
Figure 6. Relative comparison of the area under the second quadrant of magnetization curves for the CH4 heat treated powder, calcined at different temperatures for 1 h.
Magnetochemistry 09 00103 g006
Table 1. Summary of phases during re-calcination process with different calcination conditions; the heat treatment conditions before re-calcination for all samples were heating at 950 °C for 30 min with gas flow rate of 15 cc min−1 [20].
Calcination Temperature
(°C)
Observed Phases (Mole)
200Sr7Fe10O22 (1.15), Fe2O3 (5.61), Fe3O4 (2.36), FeO (0.74), Fe (69.27)
300Sr7Fe10O22 (1.15), Fe2O3 (3.63), Fe3O4 (3.04), FeO (0.49), Fe (71.67)
400Sr7Fe10O22 (1.09), Fe2O3 (6.02), Fe3O4 (6.31), FeO (2.09), Fe (56.08)
500Sr7Fe10O22 (1.00), Fe2O3 (27.34), Fe3O4 (7.60), Fe (11.59)
600Sr7Fe10O22 (1.01), Fe2O3 (43.77), Fe3O4 (0.77)
700SrFe12O19 (1.40), Sr7Fe10O22 (0.92), Fe2O3 (36.98)
800SrFe12O19 (2.24), Sr7Fe10O22 (0.87), Fe2O3 (32.14)
900SrFe12O19 (4.25), Sr7Fe10O22 (0.63), Fe2O3 (21.35)
1000SrFe12O19 (7.52), Sr7Fe10O22 (0.10), Fe2O3 (4.37)
1100SrFe12O19 (7.78)
1200SrFe12O19 (8.26)
Table 2. Magnetic properties of the samples reduced under the best conditions (temperature: 950 °C, gas flow rate:15 cc min−1 and time: 30 min) and calcined at different temperatures.
Calcination Temperature
(°C)
Ms
(emu g−1)
Mr
(emu g−1)
Hc
(kOe)
Mr/Ms
Not Calcinated87.177.140.120.08
200137.000.000.020.00
50047.414.340.130.09
70017.319.052.470.52
80030.8619.444.130.63
90026.0816.364.620.63
100054.2833.834.080.62
110058.1836.933.020.63
120059.1233.141.900.56
Table 3. Calculated values for the area under the second quadrant of magnetization curves for the CH4 heat treated powder, calcined at different temperatures for 1 h.
Calcination Temperature (°C)Area (pixel)Area (%)
70042649.01
80025,04452.92
90026,73356.49
100047,325100.00
110026,08955.13
120016,16334.15
Disclaimer/Publisher’s Note: The statements, opinions and data contained in all publications are solely those of the individual author(s) and contributor(s) and not of MDPI and/or the editor(s). MDPI and/or the editor(s) disclaim responsibility for any injury to people or property resulting from any ideas, methods, instructions or products referred to in the content.

