Abstract
Diffusion weighted magnetic resonance imaging (DW-MRI) technique probing the microscopic movement of water molecules in tissue, allows for the quantification of water diffusivity and the contribution of perfusion to the total amount of water. In the last decades, its use in organs other than the brain has increased and it has successfully been applied to abdominal organs; otherwise the use of DWI for the assessment of perfusion (by measuring perfusion fraction and edema (by measuring the apparent diffusion coefficient—ADC) of entire organs is not a clinical standard. The aim of this paper is to assess whether DWI, specifically IVIM, can accurately assess edema (the amount of water contained in a tissue) and perfusion in abdominal organs (liver, spleen, intestine and kidneys) in an endotoxemic porcine model. Endotoxemia was induced in 20 piglets and they were divided into three groups: HM group (HighMAP, mean arterial pressure was maintained >65 mmHg by noradrenaline infusion), LM group (LowMAP, MAP was maintained between 50 and 60 mmHg) and LTD (the thoracic duct was ligated to increase abdominal edema). In addition, a fourth group of healthy controls (four animals) underwent MRI. Edema was also assessed by wet–dry weight in liver, spleen and intestine; and perfusion was assessed by hemodynamics, lactate concentration and SvO2. ADC was found to be higher in the intestine of the LTD group compared with the other groups, in accordance with wet–dry weight. In addition, ADC in kidneys was found to be correlated to glomerular filtration rate. f was correlated with hemodynamics in kidneys and liver. The presented data show that there is a potential for clinical use of the technique in septic patients.
1. Introduction
Diffusion weighted magnetic resonance imaging (DW-MRI) is a non-invasive technique used since the 1980s to assess brain damage, more specifically brain edema and infarction, after a stroke [1].
DW-MRI allows for measurements of the microscopic motion (diffusion) of water molecules in tissue by fitting a mathematical signal model to the imaging data. More advanced models and data collection schemes, intravoxel incoherent motion (IVIM), additionally allows for separation of the contribution of blood microcirculation in the capillary network (pseudo-diffusion) from pure diffusion in the intra- and extra-cellular space [2,3].
Tissue diffusivity can be quantified by the apparent diffusion coefficient (ADC), reflecting the mean net displacement of water molecules within tissues (both intra- and extra-cellular), and used to evaluate cellularity and degree of fibrosis. Increased signal intensity combined with decreased ADC is a common marker of edema [4] br, used, e.g., in the evaluation of ischemic stroke or other neurologic condition [5]. In the middle of the 1980s, Le Bihan et al. [6] proposed to use a more sophisticated formula to distinguish the portion of water molecules movement happening inside the capillary network (pseudo-diffusion). Using a conventional mono-exponential signal model, the pseudo-diffusion contribution affects the estimated ADC, especially at low diffusion weightings (i.e., low b values) [7]. However, using Le Bihan’s Intra-Voxel Incoherent Motion (IVIM) concept, based on a bi-exponential signal model, it was possible to isolate the contribution of perfusion by estimating the perfusion fraction (f), the pure diffusion coefficient (D) and the pseudo-diffusion coefficient (D*).
DW-MRI was, for some time, confined to the brain. In the last decades, several technological improvements were able to overcome the head borders and translate the technique to the entire body.
The first applications were dedicated to the assessment of prostate cancer stadium [8], the study of breast cancer [9] and the analysis of lymph nodes [10].
One of the biggest challenges to the performance of DW-MRI were the long acquisition times and the presence of breathing and bowel movements. Nowadays, the shortening of the time needed to acquire the images and the improvement of background signal suppression, makes it possible to conduct free-breathing acquisition during acceptable acquisition times [11].
DW-MRI has become a valuable routine clinical imaging sequence, especially for the evaluation of patients with cancer. It is used to detect disease, characterize lesions, and assess response to treatment. Clinically, DW-MRI is largely used as a qualitative tool, although it is a quantitative functional technique.
The possibility to use DW-MRI for assessing water diffusivity, as a proxy of edema, and perfusion of entire organs in specific pathological conditions, comparing the values with a “normal range” obtained in healthy patients, has rarely been investigated. However, the potential advantages of the technique’s application to these conditions are many. First of all, DW-MRI allows for non-invasive and simultaneous assessment of multiple abdominal organs, while maintaining an intact abdominal environment [12,13]. Secondly, it does not require the injection of an exogen contrast medium, which could alter hemorheology and affect the perfusion measurement [14]. Lastly, more than one characteristic of the tissue can be assessed by DW-MRI, such as edema, tissue cellularity (associated to malignancy or inflammation) and perfusion-related properties.
Being able to assess different abdominal organs, in terms of edema and perfusion at the same time could be particularly interesting in septic patients showing signs of multiple organ failure, which often include liver, kidney and intestine as target organs.
The aim of the presented study was to assess whether DW-MRI data could accurately describe edema and perfusion of abdominal organs in an endotoxemic pigs’ model.
To do so, we created 4 groups of animals. In 3 groups, endotoxin was injected to induce a sepsis-like status (HM Group: normal hemodynamic; LTD Group: normal hemodynamic and increased abdominal edema; and LM Group: compromised hemodynamic). Another group was formed by 4 animals that represented healthy controls and they did not receive any endotoxin. For details on the groups, please go to Section 2.
A paper published by the authors presented preliminary results on the use of DWI in endotemic animals. The presented papers gives a full and more in-depth presentation using a new data set [13].
2. Materials and Methods
The Animal Research Ethical Committee of Uppsala University approved this study (nr C145/14), which was performed according to the Arrive 2.0 Guideline [14].
The animals came from the same certified farm, they were from 3 to 5 months old and weighted 22 to 31 kg (mean value 26 kg). They fasted from 12 h before the experiment, but they had free access to water till 2 h before. Experiments took place from March 2015 until April 2017.
In order to pursue the study aim, the animals were divided into four groups. One group (HM group, as HighMAP) received endotoxin infusion and mean arterial pressure (MAP) was maintained >65 mmHg, as recommended by the Surviving Sepsis Campaign guidelines [15], for the entire observation time by the titration of a noradrenaline infusion; the second group of the endotoxemic animals (LM group, LowMAP group), MAP was maintained between 50 and 60 mmHg, to simulate a low perfusion state, typical of septic patients before the administration of vasoactive; in the third group (LTD group, as ligated thoracic duct), endotoxemia was also administered and, during the preparation time, the thoracic duct was ligated to impede the lymphatic drainage and induce more edema in abdominal organs while hemodynamics was maintained normal by noradrenaline infusion; in addition, a healthy controls group that did not receive any endotoxin was studied for 1 h.
2.1. Randomization
The animals were included in two studies with different grouping, that explains the uneven size of the different groups. However, in the other studies the animals were assigned to their groups by a 1:1 randomization using online software (www.randomizer.com, 26 January 2016) that assigned an individual and a group number to every animal. The randomization schema was calculated by the software on the first day of experiments and followed throughout the study.
2.2. Preparation
Animals were pre-medicated with Zoletil Forte™ (tiletamine and zolazepam) 6 mg kg−1 and Rompun Vet™ (xylazine) 2.2 mg kg−1 i.m. After 5 min, they were placed supine on an operating table, a bolus of fentanyl 10–20 µg kg−1 was given through a cannulated ear vein and a tracheotomy was performed inserting a 7 mm ID endotracheal tube (Mallinckrodt Medical, Dublin, Ireland).
Ventilation was started in volume-control mode by a Servo-I ventilator (Maquet, Sweden) with a tidal volume (TV) of 6 mL kg−1, inspiratory: expiratory ratio (I:E) 1:2, FiO2 0.5, respiratory rate (RR) 25 cycles/min and PEEP 5 cmH2O.
Anesthesia was then maintained with a continuous iv infusion of ketamine 30 mg kg−1 h−1, midazolam 0.1 mg kg−1 h−1 and fentanyl 3.75 µg kg−1 h−1. After checking that anesthesia was sufficient to prevent responses to painful stimulation, muscle relaxation was added as a continuous IV infusion of rocuronium 3 mg kg−1 h−1. Thirty mL kg−1 Ringer’s Acetate were administered during the preparation to both groups.
In the endotoxemic animals, a triple-lumen thermistor-tipped balloon catheter (Swan-Ganz catheter, 7 Fr) was placed in the pulmonary artery from the right external jugular vein to measure cardiac output, and a neck artery was cannulated for the continuous monitoring of MAP. A urinary catheter was surgically positioned in the bladder from a 3–4 cm laparotomy; at the baseline and every hour during the observation time a transducer was connected to the urinary catheter, 10 mL of saline were injected in the bladder and intra-abdominal pressure (IAP) was measured.
A 10–20 cm laparotomy was performed, the spleen and the intestine were displaced, the thoracic duct identified (on the left side of the abdominal aorta); in LTD group’s animals it was ligated. Then, the organs were repositioned and the peritoneum, muscles and skin layers sutured.
In the healthy controls, a neck artery was cannulated to measure MAP and to take a blood sample (for lactate concentration measurement). They were ventilated as the rest of the pigs during the preparation time (PEEP was maintained 5 cmH2O). They were brought to the MR department after one hour from the end of the preparation; no endotoxin infusion was administered.
2.3. Protocol
After baseline measurements, an endotoxin infusion was started (Sigma, Castle Hill, NSW, Australia) Lipopolysaccharide from Escherichia coli, 0111:B4, L2630-100 mg, 129K4025) in 20 animals. The infusion rate was 15 μg kg−1 h−1 for 2 h, then decreased to 5 μg kg−1 h−1.
A noradrenaline infusion was titrated to maintain MAP equal to or above 65 mmHg, as recommended by the guidelines for resuscitation in the Third International Consensus Definition for Sepsis and Septic Shock [16] in HM and LTD groups, while in the LM group MAP was maintained between 50 and 60 mmHg.
As soon as a stable condition was reached (most of the time during the first hour of observation), PEEP was gradually increased to 15 cmH2O.
After 6 h of endotoxin infusion, the animals were taken to the Magnetic Resonance Imaging (MRI) Research unit for image acquisition, and then euthanized by the injection of a KCl bolus.
General anesthesia was maintained during the imaging acquisition, while endotoxin was discontinued.
During autopsy, samples from the abdominal organs were taken and used to measure wet–dry weight and histopathological assessment of edema.
2.4. Acquired Data
2.4.1. DW-MRI Data
DW-MRI was performed on a Philips Achieva dStream 1.5T scanner. Settings are reported in Table 1.

Table 1.
DW-MRI settings.
In this work, the ADC estimated from the mono-exponential model and the f and D estimated from the bi-exponential model were used as estimates of edema (ADC, D) and perfusion (f).
2.4.2. Image Analysis
The abdominal organs analyzed were the liver, the spleen, the small intestine and the kidneys. The DW images generated by the MRI system were transferred and analyzed using a processing and viewing software (Pride DWI Tool R 1.5, Philips Healthcare, Eindhoven, The Netherlands).
Data was fitted with the Levenberg–Marquardt nonlinear least squares algorithm and no filtering was applied.
The organs were identified, and regions of interest (ROIs) were manually drawn slice-wise on the anatomical images (T2 images) and thereafter propagated to the ADC, D and f parametric maps. Three to six ROIs were drawn in each studied organ (liver, spleen, small intestine and kidneys). In the drawing process, big vessels were avoided and the size of the regions in the same organ were as much as possible standardized.
For each map, the mean value of the ROIs was calculated used for the analysis. A goodness of fit of 95% was considered as sufficient for inclusion whereas a lower fit was discarded.
ADC and D were compared to other measurement of edema; and f was compared to global measurements of perfusion.
The ROIs drawing process is showed in Figure 1.
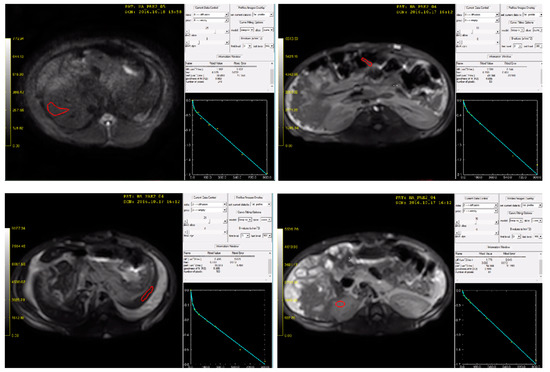
Figure 1.
The ROIs drawing process using the software Pride R1.5. From upper left (clockwise): liver ROI (red), intestine ROI, left kidney ROI and spleen ROI. For every quadrant, on the down right corner the graph for the calculation of the goodness of fit. In the illustration, T2-weighted images, where the ROIs were drawn.
2.5. Other Data
Global perfusion was assessed by MAP and abdominal perfusion pressure (APP) measurement, arterial lactate concentration, venous saturation of oxygen (SvO2) and urinary output. MAP was monitored continuously and recorded at the baseline and every hour during the observation time, together with mean pulmonary artery pressure (PAPmean), central venous pressure (CVP) and heart rate; while APP, cardiac output (CO) and intra-abdominal pressure (IAP) were measured at baseline and once every hour during observation time. MAP was the target for the titration of noradrenaline infusion in endotoxemic animals (>65 mmHg for the HM and LTD group, and between 50 and 60 mmHg for LM group). APP was obtained by subtracting IAP from MAP [17]. Arterial lactate concentration was measured (by blood gas analysis in arterial blood) at the baseline and every hour during the observation time, as SvO2 (from pulmonary artery blood). Urinary output was collected and it is represented as mL/kg of weight/h.
Edema was assessed in the abdominal organs by wet–dry weight and, in the small intestine, by histopathological analysis. The measurements were performed in the liver, spleen and intestine.
During the autopsy, the abdominal organs were dissected and one piece from each organ was positioned on a metal paper foil, weighted on a precision scale (wet weight), put in a 37 °C oven for a week and then re-weighted (dry weight).
In addition, another 1–2 cm2 piece was dissected from the small intestine, embedded in formalin 4% and then sent to a pathology department. A pathologist, blinded to the protocol, assessed the edema grade of the tissue and gave a score from 0 to 4 to describe it.
3. Statistical Analysis
The normality of the data were assessed using a Shapiro–Wilk test.
Normal data are presented as mean and standard deviation. The histopathological score, as non-parametric, is presented as median and range.
Comparisons between the two groups were performed using Student’s t-test or ANOVA and multiple t-test (with Bonferroni correction) and using the Mann–Whitney test (according to the nature of the data).
For testing the correlation between variables, Pearson’s coefficient was calculated (r2 and p values reported).
p < 0.05 was defined as statistically significant.
Statistical analysis was performed using Prism version 8.4.2 (GraphPad software); and R (open-source software, version 3.6.3).
4. Results
A total of 24 piglets were included in the study, with an average weight of 27 kg (range 22–31 kg).
The HM group (endotoxemia, MAP > 65 mmHg and intact thoracic duct) was formed by 10 animals, the LM group (endotoxemia, MAP between 50 and 60 mmHg and intact thoracic duct) by 6 animals, LTD (endotoxemia, MAP > 65 mmHg and ligated thoracic duct) by 4 animals and the healthy controls group was formed by 4 animals.
4.1. DW-MRI Performance
At the end of the observation period (6 h for the three intervention groups and 1 h for the healthy controls group), all the animals included in the study were transported to the Magnetic Resonance Department for MRI acquisition. The hemodynamic was maintained in all the animals by the titration of noradrenaline, during transportation and during the image acquisition, with no major changes from the values measured during the observation time. In LM group MAP was maintained as during the observation period (between 50 and 60 mmHg).
During DW-MR images analysis, the average size of the ROIs drawn was 69 mm2. The smallest ROI was drawn in the intestine and was 32 mm2 and the biggest was drawn in the liver and was 71 mm2.
The highest number of discarded ROIs (goodness of fit < 95%) was in the intestine, where one third of the drawn ROIs needed to be re-drawn (see Material and Methods for description of the goodness of fit).
4.2. Hemodynamics
The hemodynamic parameters at baseline and during the observation period in all the groups are reported in Table 2. Baseline values were similar for all the groups.
Table 2.
Hemodynamic parameters at baseline and every hour during the observation time, reported per group. ** is p < 0.01 per multiple t-test. HM: highMaP; LTD: Ligated Thoracic Duct; LM: LowMAP; MAP: Mean Arterial Pressure; PAPmean: Mean Pulmonary Artery Pressure; CVP: Central Venous Pressure; IAP: Intra-Abdominal Pressure; CO: Cardiac Output; APP: Abdominal Perfusion Pressure; h: hour.
MAP and APP were found lower in the LM group at all the time points (ANOVA and multiple t-test p values < 0.05).
PAPmean increased over time in all the groups, but no difference was found between them.
Cardiac output and heart rate were globally lower and higher, respectively, in the LM group compared to the other groups (ANOVA p value = 0.04 for both values).
4.3. Global Perfusion
Lactate measurements (mmol/L) at baseline and every hour during the observation time is reported in Figure 2. Lactate peak was reached after 3 h from the induction of endotoxemia in HM and LM group and after five hours in LTD group.
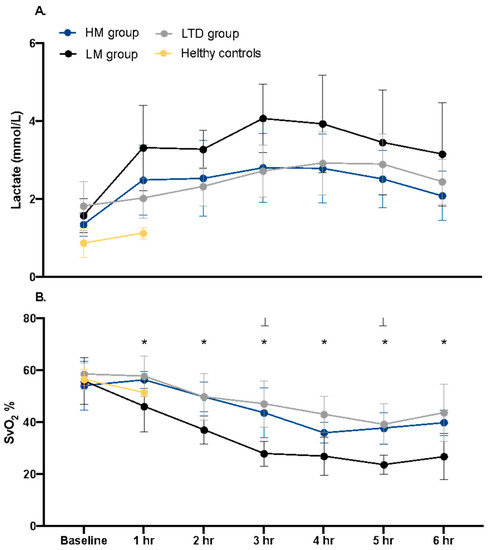
Figure 2.
Part (A). Lactate concentration (mmol/L) in arterial blood at baseline and every hour during the observation time in the three groups, and at baseline and after 1 h of observation in healthy controls group. Part (B). SvO2 (%) at the baseline and every hour during the observation time in the three groups, and at baseline and after 1 h of observation in healthy controls group. Data presented as mean and standard deviation. p value < 0.05 for the comparison between LTD and LM group indicated with *, for the comparison between HM and LM group indicated with ⊥.
Lactate was globally higher in LM group compared to the other groups (ANOVA p = 0.04).
SvO2 (%) value at baseline and every hour during the observation time is reported in Figure 1 (lower part). SvO2 was globally lower in LM group compared to the other groups (ANOVA < 0.01) and by multiple t-test (with Bonferroni correction) it was lower in LM compared to HM group at all time points after baseline, while it was found lower compared to LTD group 3 and 5 h after the start of endotoxemia.
f value per organ and per group is reported in Figure 3.
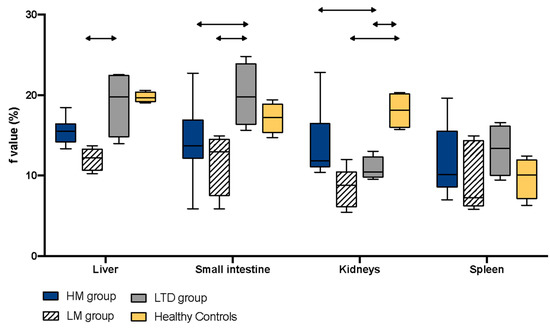
Figure 3.
f value represented in abdominal organs per group. Data presented as mean, standard deviation and range. The arrows represent statistically significant difference between groups.
In kidneys, f was higher in the healthy controls (mean ± SD: 19.7 ± 0.69%) compared to the LM (8.54 ± 2.45%) and LTD group (10.86 ± 1.51%); besides it was higher in the HM group (13.71 ± 4.13%) compared to LTD.
In liver, f was lower in the LM group (12.1 ± 1.37%) compared to the LTD group (19 ± 4.23%); and in intestine, HM (14.16 ± 4.7%) and LM group (11.65 ± 4%) showed an f lower than LTD group 20 ± 3.9%).
The f in liver and kidneys showed positive correlation with MAP (r2 0.49 and 0.2, respectively) and APP (r2 0.47 and 0.2, respectively). No correlation with other hemodynamic parameters was observed. The f in liver was also correlated with SvO2 at 6 h after the induction of endotoxemia (r2 0.39). A trend of correlation between kidneys’ f value and the lactate value at 6 h after the induction of endotoxemia (r2 0.19; p 0.06) was observed.
In the small intestine, the f value was higher in the LTD group (20 ± 3.97%) compared to both LM (11.6 ± 4%) and HM (14.2 ± 4.7%). No correlation with hemodynamics parameters was observed.
The f value in the spleen was similar in all the groups.
4.4. Edema
Wet–dry weight results per organ in each group are reported in Figure 4.
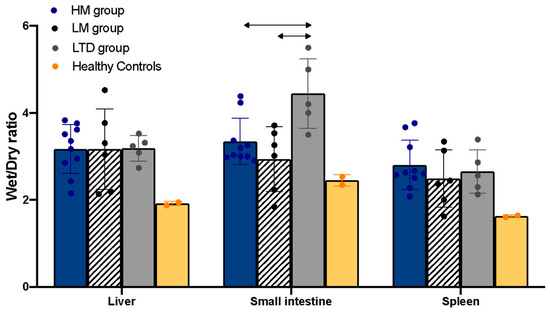
Figure 4.
Wet–dry ratio represented in the abdominal organs per group. The data are presented as mean and standard deviation, and as individual values (scattered dots). The arrows represent statistically significant difference between groups.
Wet–dry weight was performed in only 2 animals in the healthy controls group; the values are reported in the figure, but they were not included in the statistical analysis.
The wet–dry ratio in the small intestine was higher in the LTD group (4.44 ± 0.8 g) compared to the HM (3.33 ± 0.57 gr) and LM group (3.16 ± 0.92 gr).
The histopathological assessment of small intestine found similar edema in the HM group (median and range of the score: 2.2; 1–3) and the LM group (median and range: 2.3; 1–3). The score was higher in the LTD group than in the other groups (median and range: 3.7; 1–4). In the healthy controls, the score was not calculated.
ADC measurement (in μm2/ms) per organ in each group are reported in Figure 5 (upper part).
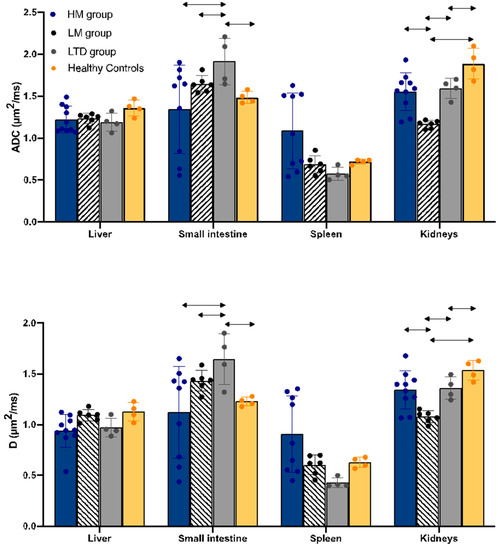
Figure 5.
ADC (upper part) and D (lower part) per organ per group. The arrows represent statistically significant differences between the groups.
ADC in the intestine resulted higher in the LTD group (1.91 ± 0.28) than in all the other groups (HM group: 1.22 ± 0.16; LM group: 1.65 ± 0.1; healthy controls group: 1.48 ± 0.07).
In the kidneys, ADC was higher in the healthy controls group (1.89 ± 0.18) than in all the other groups (HM group: 1.55 ± 0.22; LM group: 1.17 ± 0.05; LTD group: 1.59 ± 0.12).
D values per group per organ are reported in Figure 5 (lower part). It was found between 80 and 90% of the ADC value in all the organs and groups, and the differences among groups were the same.
ADC and D in kidneys were found correlated with the urinary output (mL/kg/h). Data from all the groups plotted together are reported in Figure 6.
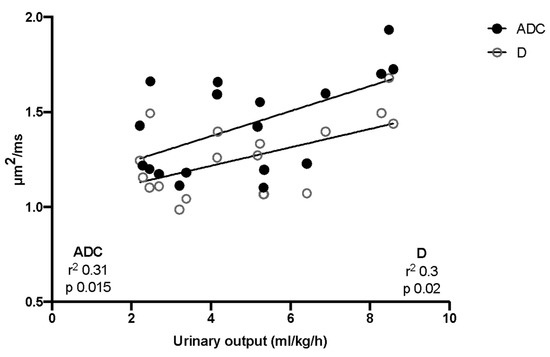
Figure 6.
Correlation between ADC and urinary output. All the groups are plotted together.
5. Discussion
The presented study aimed to investigate the feasibility of DW-MRI as a tool for the assessment of edema and inflammation of abdominal organs during endotoxemia.
5.1. Perfusion and f Value
In the liver and kidneys, perfusion reflected the hemodynamics of the different groups. f value correlated positively, moderately to strong, with MAP and APP and correlations were also found with SvO2.
In the intestine, instead, perfusion was not associated with hemodynamics, and even if LM group showed the lowest perfusion and the lowest MAP, no correlation with MAP, APP or others hemodynamic parameters was found. The lack of correlation between intestine perfusion and hemodynamics could be explained by the well-described patchy and inhomogeneous perfusion of intestine typical of the septic state, observed in multiple studies [18,19]. In addition, to draw ROIs on the MR images in the intestinal walls was technically challenging because of the small size and the potential intestinal movement during imaging. There is a possibility that intestinal ROIs (even if correctly positioned) could have included an intestinal area that is not representative of the global organ perfusion.
It is interesting to notice that the cardiac output was not found associated with perfusion in any of the abdominal organs investigated. The redistribution of cardiac output described in sepsis [20], that affects mostly the intestine and the liver by reducing their output fraction in favor of brain and thoracic organs, could be the reason for this lack of association.
5.2. Edema and ADC
Wet–dry weight and ADC (and D) identified a similar increase in LTD group intestine edema, due to the ligation of thoracic duct and the reduced lymphatic drainage. In other organs, the ability of ADC and D to measure edema is still uncertain as the ligation of the duct for 6 h was not enough to produce an increase in the water content of those organs.
In kidneys, the correlation of ADC and D with the urinary output has been described in previous studies [21,22] (more frequently using ADC, and not D). As ADC and D are measuring the movement of water molecules within tissues, the massive movement produced by the ultrafiltrate production in the renal tubules makes up part of the ADC calculation. In a study by Sigmund et al., the use of diuretic drugs that reduce the reabsorption of water from the tubules, is associated to a higher ADC value in the patients’ kidneys [23]. According to Sigmund and others functional studies that aimed to investigate the association between ADC and glomerular filtration rate [22,24,25], the f value was not influenced by the changes in the amount of water passing through the tubules. Otherwise, a reduction in the renal perfusion, when below the autoregulation threshold affects glomerular filtration rate directly, causing its decrease and the reduction of urinary output as well.
The presented data confirm the correlation of ADC and D with glomerular filtration rate (assessed through urinary output). Urinary output was not found associated with f value, but f value, ADC and D were the highest in the Healthy controls and the lowest in LM group (that had the lowest MAP).
The fact that ADC is also influenced by perfusion (at low b values) did not affect the capacity of the parameter to predict urinary output (and, indirectly, the glomerular filtration rate).
5.3. f Value and ADC in Healthy Tissues
As no previous studies have investigated perfusion and diffusion of abdominal organ tissues during sepsis, it is not possible to compare the presented results with clinical data. Otherwise, a small cluster of studies reported data collected in healthy volunteers or in the healthy portion of tissues, so that it is possible to compare with f and ADC values collected in the healthy control group.
In most of the studies identified in the literature, ADC was reported for healthy controls, while very few studies reported the value of D. That is the reason the narrative comparison between previous investigations and the presented study’s results is limited to f value and ADC.
Liver f value in the healthy controls was 19 ± 0.7% (mean ± SD) and was similar to what has been reported in the literature in healthy patients (Andreou et al: average 18% [26]; Peng et al. 22% [27]).
Similarly, ADC in the healthy controls subject of this study was 1.36 ± 0.1 and varied from 1.22 [26] to 1.36 [28] in clinical studies including healthy volunteers.
In the kidneys, the average f value was 18 ± 2%, and comparable with non-pathological kidneys from clinical studies (23% [29] and 22% [30]). ADC was 1.86 ± 0.2, very similar to the value reported by Toya et al. in patients with a normal glomerular filtration rate [31].
Few studies used DW-MRI to assess intestinal tissue, and most of them investigated inflammatory intestinal lesions [32] and cancer or metastasis [33]; healthy tissue is very rarely assessed.
In the intestine of the healthy controls group, the average f value obtained was 17 ± 2% and it was similar to what is reported by Lu et al. in the normal rectal wall [34], but no studies investigated perfusion in the small intestine [35].
ADC in the small intestine of a healthy subject from the presented study was 1.5 ± 0.07. Previously, only one study reported (again Lu et al.) an ADC value of 1.6 on average in non-pathological intestine samples [34]. Two other studies, instead, reported values oscillating from 2 to 3 in healthy tissue [36,37]. An ADC lower than 2 was associated with inflammation in these studies and used as a cut-off to appraise inflammatory lesions. Inflammation is associated with increased cellularity that is associated to a lower ADC. One possible explanation for the discrepancies between the study results and the values reported in the literature, could be the presence of chronic inflammation in the pigs’ intestine. Animals maintained in captivity can develop chronic intestinal inflammation with an increased in cellularity without a proportional increased edema. Otherwise, there are no data to confirm this hypothesis. Another explanation for the discrepancies could be the aforementioned challenges in estimating DW-MRI-related measures in the intestine.
In the spleen, both f and ADC did not show correlation with hemodynamics, and they did not differ among groups. No patterns were underlined by the data analysis. The reason for this behavior could be found in the spleen tissue histology and in its specific circulation. The splenic vessels are large and characterized by a low flow (sinusoids), and the splenic tissue is highly structured and includes a high number of immune system cells. These specificities could be at the base of the low ADC value (high cellularity) and low f value (low flow); Qyaam et al. reported that low flow in hemangioma was read as a high cellularity tissue (low ADC value) and that could be the case with the spleen as well. Only one study, to the authors’ knowledge, reports the ADC value in the spleen of healthy volunteers, which was 0.74 on average, similar to the value of the healthy controls group (0.72 ± 0.03); no studies report spleen f value in humans.
Further studies are needed to better investigate the reliability of the technique and whether the experimental results can be translated into a clinical setting. Otherwise, the non-invasive nature of the examination and the improvements of the technique, facilitate its possible future use in clinical studies.
5.4. Limitations
The presented study is the first using DW-MRI for the assessment of perfusion and edema in abdominal organs during endotoxemia. The results, when compared to the perfusion and edema assessed using other methods, showed consistency.
However, there are some limitations to point out.
First, the number of animals included was limited and the subjects were not evenly distributed into the groups.
Second, perfusion assessed by DW-MRI was compared with hemodynamic parameters and global markers of hypoperfusion, such as lactate and SvO2. No other techniques were employed to assess the perfusion of single organs as control method.
Furthermore, the images analysis could have been conducted using different methods (Bayesian [38] or Deep Learning application [39,40]). This could have impacted the analysis quality and introduced bias, especially at low SNRs and for the estimation of f and D* maps.
Lastly, the study of edema was limited to the intestine as the ligation of the thoracic duct, used to reduce the lymphatic drainage and increase abdominal organs edema, did not produce the expected results in other organs.
6. Conclusions
In the presented study, DW-MRI used to assess perfusion and edema in abdominal organs during endotoxemia produced consistent results that captured the modification in hemodynamics in the liver, kidneys and the increase of edema in intestine, suggesting that the assessment of these organs in septic patients is a future potential employment of the technique.
Author Contributions
Conceptualization, S.M., H.A. and M.L.; methodology, S.M. and E.L.; software, E.L.; validation, S.M., E.L., H.A. and M.L.; formal analysis, S.M. and E.L.; data curation, S.M.; writing—original draft preparation, S.M. and E.L.; writing—review and editing, S.M., E.L., H.A. and M.L.; visualization, S.M.; supervision, H.A. and M.L.; funding acquisition, M.L. All authors have read and agreed to the published version of the manuscript.
Funding
This research was founded by Uppsala University.
Institutional Review Board Statement
The animal study protocol was approved by the Ethics Committee of Uppsala University (nr C145/14).
Data Availability Statement
All data are available after request to the corresponding author.
Acknowledgments
The authors want to acknowledge Hedenstierna Laboratoriet and Department of Radiology personnel for the help.
Conflicts of Interest
The authors declare no conflict of interest.
References
- Qayyum, A. Diffusion-weighted Imaging in the Abdomen and Pelvis: Concepts and Applications1. RadioGraphics 2009, 29, 1797–1810. [Google Scholar] [CrossRef] [PubMed]
- Wirestam, R.; Borg, M.; Brockstedt, S.; Lindgren, A.; Holtas, S.; Stahlberg, F. Perfusion-related parameters in intravoxel incoherent motion MR imaging compared with CBV and CBF measured by dynamic susceptibility-contrast MR technique. Acta Radiol. 2001, 42, 123–128. [Google Scholar] [CrossRef] [PubMed]
- Henkelman, R.M. Does IVIM measure classical perfusion? Magn. Reson. Med. 1990, 16, 470–475. [Google Scholar] [CrossRef] [PubMed]
- Wick, W.; Kuker, W. Brain edema in neurooncology: Radiological assessment and management. Onkologie 2004, 27, 261–266. [Google Scholar] [CrossRef] [PubMed]
- Robinson, D.; Kreitzer, N.; Ngwenya, L.B.; Adeoye, O.; Woo, D.; Hartings, J.; Foreman, B. Diffusion-Weighted Imaging Reveals Distinct Patterns of Cytotoxic Edema in Patients with Subdural Hematomas. J. Neurotrauma 2021, 38, 2677–2685. [Google Scholar] [CrossRef]
- Le Bihan, D.; Breton, E.; Lallemand, D.; Grenier, P.; Cabanis, E.; Laval-Jeantet, M. MR imaging of intravoxel incoherent motions: Application to diffusion and perfusion in neurologic disorders. Radiology 1986, 161, 401–407. [Google Scholar] [CrossRef] [PubMed]
- Koh, D.-M.; Collins, D.J.; Orton, M.R. Intravoxel incoherent motion in body diffusion-weighted MRI: Reality and challenges. AJR Am. J. Roentgenol. 2011, 196, 1351–1361. [Google Scholar] [CrossRef] [PubMed]
- Mazaheri, Y.; Afaq, A.; Rowe, D.B.; Lu, Y.; Shukla-Dave, A.; Grover, J. Diffusion-weighted magnetic resonance imaging of the prostate: Improved robustness with stretched exponential modeling. J. Comput. Assist. Tomogr. 2012, 36, 695–703. [Google Scholar] [CrossRef]
- Brandao, A.C.; Lehman, C.D.; Partridge, S.C. Breast magnetic resonance imaging: Diffusion-weighted imaging. Magn. Reson. Imaging Clin. N. Am. 2013, 21, 321–336. [Google Scholar] [CrossRef] [PubMed]
- De Cataldo, C.; Bruno, F.; Palumbo, P.; Di Sibio, A.; Arrigoni, F.; Clemente, A.; Bafile, A.; Gravina, G.L.; Cappabianca, S.; Barile, A.; et al. Apparent diffusion coefficient magnetic resonance imaging (ADC-MRI) in the axillary breast cancer lymph node metastasis detection: A narrative review. Gland Surg. 2020, 9, 2225–2234. [Google Scholar] [CrossRef]
- Sandrasegaran, K. Functional MR imaging of the abdomen. Radiol. Clin. N. Am. 2014, 52, 883–903. [Google Scholar] [CrossRef]
- Verdant, C.L.; De Backer, D.; Bruhn, A.; Clausi, C.M.; Su, F.; Wang, Z.; Rodriguez, H.; Pries, A.R.; Vincent, J.-L. Evaluation of sublingual and gut mucosal microcirculation in sepsis: A quantitative analysis. Crit. Care Med. 2009, 37, 2875–2881. [Google Scholar] [CrossRef] [PubMed]
- Marchesi, S.; Ortiz Nieto, F.; Ahlgren, K.M.; Roneus, A.; Feinstein, R.; Lipcsey, M.; Larsson, A.; Ahlstrom, H.; Hedenstierna, G. Abdominal organ perfusion and inflammation in experimental sepsis: A magnetic resonance imaging study. Am. J. Physiol. Gastrointest. Liver Physiol. 2019, 316, G187–G196. [Google Scholar] [CrossRef] [PubMed]
- du Sert, N.P.; Hurst, V.; Ahluwalia, A.; Alam, S.; Avey, M.T.; Baker, M.; Browne, W.J.; Clark, A.; Cuthill, I.C.; Dirnagl, U.; et al. The arrive guidelines 2.0: Updated guidelines for reporting animal research. PLoS Biol. 2020, 18, 9–10. [Google Scholar] [CrossRef]
- Briegel, J.; Mohnle, P. International guidelines of the Surviving Sepsis Campaign: Update 2012. Anaesthesist 2013, 62, 304–309. [Google Scholar] [CrossRef] [PubMed]
- Evans, L.; Rhodes, A.; Alhazzani, W.; Antonelli, M.; Coopersmith, C.M.; French, C.; Machado, F.R.; Mcintyre, L.; Ostermann, M.; Prescott, H.C.; et al. Surviving sepsis campaign: International guidelines for management of sepsis and septic shock 2021. Intensive Care Med. 2021, 47, 1181–1247. [Google Scholar] [CrossRef] [PubMed]
- Malbrain, M.L.N.G. Different techniques to measure intra-abdominal pressure (IAP): Time for a critical re-appraisal. Intensive Care Med. 2004, 30, 357–371. [Google Scholar] [CrossRef] [PubMed]
- Song, J.; Wang, X.; Xu, X.; Jia, B.; Zheng, Q.; Ka, W.; Sun, D.; Wen, Z.; Xie, L.; Yao, W. The effects of non-ionic contrast medium on the hemorheology in vitro and in vivo. Clin. Hemorheol. Microcirc. 2014, 58, 385–393. [Google Scholar] [CrossRef]
- Edul, V.S.K.; Ince, C.; Navarro, N.; Previgliano, L.; Risso-Vazquez, A.; Rubatto, P.N.; Dubin, A. Dissociation between sublingual and gut microcirculation in the response to a fluid challenge in postoperative patients with abdominal sepsis. Ann. Intensive Care 2014, 4, 39. [Google Scholar] [CrossRef]
- Jhanji, S.; Stirling, S.; Patel, N.; Hinds, C.J.; Pearse, R.M. The effect of increasing doses of norepinephrine on tissue oxygenation and microvascular flow in patients with septic shock. Crit. Care Med. 2009, 37, 1961–1966. [Google Scholar] [CrossRef] [PubMed]
- Lang, C.H.; Bagby, G.J.; Ferguson, J.L.; Spitzer, J.J. Cardiac output and redistribution of organ blood flow in hypermetabolic sepsis. Am. J. Physiol. 1984, 246 Pt 2, R331–R337. [Google Scholar] [CrossRef] [PubMed]
- Toya, R.; Naganawa, S.; Kawai, H.; Ikeda, M. Correlation between estimated glomerular filtration rate (eGFR) and apparent diffusion coefficient (ADC) values of the kidneys. Magn. Reson. Med. Sci. MRMS Off. J. Jpn. Soc. Magn. Reson. Med. 2010, 9, 59–64. [Google Scholar] [CrossRef]
- Ichikawa, S.; Motosugi, U.; Ichikawa, T.; Sano, K.; Morisaka, H.; Araki, T. Intravoxel incoherent motion imaging of the kidney: Alterations in diffusion and perfusion in patients with renal dysfunction. Magn. Reson. Imaging 2013, 31, 414–417. [Google Scholar] [CrossRef]
- Sigmund, E.E.; Vivier, P.-H.; Sui, D.; Lamparello, N.A.; Tantillo, K.; Mikheev, A.; Rusinek, H.; Babb, J.S.; Storey, P.; Lee, V.S.; et al. Intravoxel incoherent motion and diffusion-tensor imaging in renal tissue under hydration and furosemide flow challenges. Radiology 2012, 263, 758–769. [Google Scholar] [CrossRef] [PubMed]
- Xie, Y.; Li, Y.; Wen, J.; Li, X.; Zhang, Z.; Li, J.; Zhao, Y.; Wang, P.; Zhang, J.; Tian, Y.; et al. Functional Evaluation of Transplanted Kidneys with Reduced Field-of-View Diffusion-Weighted Imaging at 3T. Korean J. Radiol. 2018, 19, 201–208. [Google Scholar] [CrossRef] [PubMed]
- Li, Q.; Li, J.; Zhang, L.; Chen, Y.; Zhang, M.; Yan, F. Diffusion-weighted imaging in assessing renal pathology of chronic kidney disease: A preliminary clinical study. Eur. J. Radiol. 2014, 83, 756–762. [Google Scholar] [CrossRef] [PubMed]
- Andreou, A.; Koh, D.M.; Collins, D.J.; Blackledge, M.; Wallace, T.; Leach, M.O.; Orton, M.R. Measurement reproducibility of perfusion fraction and pseudodiffusion coefficient derived by intravoxel incoherent motion diffusion-weighted MR imaging in normal liver and metastases. Eur. Radiol. 2013, 23, 428–434. [Google Scholar] [CrossRef] [PubMed]
- Peng, J.; Zheng, J.; Yang, C.; Wang, R.; Zhou, Y.; Tao, Y.-Y.; Gong, X.-Q.; Wang, W.-C.; Zhang, X.-M.; Yang, L. Intravoxel incoherent motion diffusion-weighted imaging to differentiate hepatocellular carcinoma from intrahepatic cholangiocarcinoma. Sci. Rep. 2020, 10, 7717. [Google Scholar] [CrossRef]
- Zhu, J.; Zhang, J.; Gao, J.-Y.; Li, J.-N.; Yang, D.-W.; Chen, M.; Zhou, C.; Yang, Z.-H. Apparent diffusion coefficient normalization of normal liver: Will it improve the reproducibility of diffusion-weighted imaging at different MR scanners as a new biomarker? Medicine 2017, 96, e5910. [Google Scholar] [CrossRef] [PubMed]
- Lee, S.-K.; Lee, J.; Jang, S.; Lee, E.; Jeon, C.-Y.; Lim, K.-S.; Jin, Y.B.; Choi, J. Renal Diffusion-Weighted Imaging in Healthy Dogs: Reproducibility, Test-Retest Repeatability, and Selection of the Optimal b-value Combination. Front. Vet. Sci. 2021, 8, 641971. [Google Scholar] [CrossRef] [PubMed]
- Liang, P.; Chen, Y.; Li, S.; Xu, C.; Yuan, G.; Hu, D.; Kamel, I.; Zhang, Y.; Li, Z. Noninvasive assessment of kidney dysfunction in children by using blood oxygenation level-dependent MRI and intravoxel incoherent motion diffusion-weighted imaging. Insights Imaging 2021, 12, 146. [Google Scholar] [CrossRef]
- Sulkowska, K.; Palcsewski, P.; Duda-Zysk, A. Diffusion-weighted MRI of kidneys in healthy volunteers and living kidney donors. Clin. Radiol. 2015, 70, 1122–1127. [Google Scholar] [CrossRef] [PubMed]
- Ding, L.; Xiao, L.; Lin, X.; Xiong, C.; Lin, L.; Chen, S. Intravoxel Incoherent Motion (IVIM) Diffusion-Weighted Imaging (DWI) in Patients with Liver Dysfunction of Chronic Viral Hepatitis: Segmental Heterogeneity and Relationship with Child-Turcotte-Pugh Class at 3 Tesla. Gastroenterol. Res. Pract. 2018, 2018, 2983725. [Google Scholar] [CrossRef]
- Lu, B.; Yang, X.; Xiao, X.; Chen, Y.; Yan, X.; Yu, S. Intravoxel Incoherent Motion Diffusion-Weighted Imaging of Primary Rectal Carcinoma: Correlation with Histopathology. Med. Sci. Monit. Int. Med. J. Exp. Clin. Res. 2018, 24, 2429–2436. [Google Scholar] [CrossRef] [PubMed]
- Barral, M.; Eveno, C.; Hoeffel, C.; Boudiaf, M.; Bazeries, P.; Foucher, R.; Pocard, M.; Dohan, A.; Soyer, P. Diffusion-weighted magnetic resonance imaging in colorectal cancer. J. Visc. Surg. 2016, 153, 361–369. [Google Scholar] [CrossRef]
- Durayski, E.; Watte, G.; Pacini, G.S.; Roman, D.H.; Machado, M.B.; Marchiori, E.; Hochhegger, B.; Baldisserotto, M. Diffusion-weighted imaging and apparent diffusion coefficient values for evaluating terminal ileitis in patients with Crohn’s disease. Radiol. Bras. 2019, 52, 361–367. [Google Scholar] [CrossRef] [PubMed]
- Ninivaggi, V.; Missere, M.; Restaino, G.; Gangemi, E.; Di Matteo, M.; Pierro, A.; Sallustio, G.; Bonomo, L. MR-enterography with diffusion weighted imaging: ADC values in normal and pathological bowel loops, a possible threshold ADC value to differentiate active from inactive Crohn’s disease. Eur. Rev. Med. Pharmacol. Sci. 2016, 20, 4540–4546. [Google Scholar]
- While, P.T. A comparative simulation study of bayesian fitting approaches to intravoxel incoherent motion modeling in diffusion-weighted MRI. Magn. Reson. Med. 2017, 78, 2373–2387. [Google Scholar] [CrossRef]
- Kaandorp, M.P.T.; Barbieri, S.; Klaassen, R.; van Laarhoven, H.W.M.; Crezee, H.; While, P.T.; Nederveen, A.J.; Gurney-Champion, O.J. Improved unsupervised physics-informed deep learning for intravoxel incoherent motion modeling and evaluation in pancreatic cancer patients. Magn. Reson. Med. 2021, 86, 2250–2265. [Google Scholar] [CrossRef]
- Mastropietro, A.; Procissi, D.; Scalco, E.; Rizzo, G.; Bertolino, N. A supervised deep neural network approach with standardized targets for enhanced accuracy of IVIM parameter estimation from multi-SNR images. NMR Biomed. 2022, 35, e4774. [Google Scholar] [CrossRef]


Disclaimer/Publisher’s Note: The statements, opinions and data contained in all publications are solely those of the individual author(s) and contributor(s) and not of MDPI and/or the editor(s). MDPI and/or the editor(s) disclaim responsibility for any injury to people or property resulting from any ideas, methods, instructions or products referred to in the content. |
© 2023 by the authors. Licensee MDPI, Basel, Switzerland. This article is an open access article distributed under the terms and conditions of the Creative Commons Attribution (CC BY) license (https://creativecommons.org/licenses/by/4.0/).