1. Introduction
Spin triangles constitute a “rediscovered” class of metal complexes [
1], whose magnetic properties have rendered them interesting as potential magnetoelectric materials [
2,
3,
4,
5,
6], with a proposed use as electrically controlled and slow-decoherence spin-chirality qubits [
7,
8,
9,
10].
Our overall ability to design and implement such devices is predicated on our precise understanding of their magnetic structures, down to the finest details. Traditionally, the general strategy implemented to tackle this task is the same as with most other molecular magnetic materials: magnetometric techniques (e.g., SQUID magnetometry) are first used to elucidate the gross magnetic structure governed by isotropic (Heisenberg–Dirac–van Vleck) interactions and eventually antisymmetric (Dzyaloshinskii–Moriya) interactions, both of superexchange origins. Finer terms, such as zero-field splitting (zfs) or anisotropic interactions, are not very reliably assessed via magnetometric techniques, necessitating the use of spectroscopic techniques, the most prominent of which is Electron Paramagnetic Resonance (EPR) spectroscopy.
The use of EPR spectroscopy has its own limitations, e.g., when dealing with non-Kramers systems and very large zfs terms. While these systems are addressable through high-frequency (W-band frequencies and above) or THz EPR, the availability of such experiments can be a limiting factor to their use. Classical EPR, however, i.e., at Q-band frequencies and below, can yield very precise information on weaker terms, such as hyperfine interactions. In addition, low-temperature studies can yield very informative data on the ground states of polynuclear complexes, which then can be used to verify the magnetometry-derived conclusions regarding exchange interactions [
11].
The above strategy works very nicely in cases where J >> kBT, A, i.e., at the strong exchange limit. When, however, exchange interactions are very weak with respect to the thermal energy and comparable to eventual hyperfine interactions, errors in magnetometric techniques (weighing, diamagnetic corrections) render their use problematic. The large diamagnetic content of biological magnetic systems can give rise to such problems even for strong exchange interactions. In such cases, EPR spectroscopy can often yield useful information. However, a careful construction of the model is then required to include any term that might influence the EPR spectrum. These include not just isotropic interactions, but also the full description of the system symmetry that influences its anisotropic terms. These may include Dzyaloshinskii–Moriya interactions (DMI), dipolar interactions, anisotropic exchange and hyperfine interactions, taking proper care to model the various tensor orientations (e.g., , , etc.) and vectors connecting the different spins.
In a previous work, we showed that it is possible to derive very accurate descriptions of the magnetic properties of trinuclear Cu
II complexes [
12] by properly accounting for the dipolar terms, which induce a zfs in their quartet states. Such studies are not only applicable on single-crystal data, but also to those from randomly oriented samples (powders or frozen solutions). In those previous cases, hyperfine interactions were not considered, either because they were unresolved or because they were very weak, respectively. Moreover, it was considered that their inclusion might render the problem computationally intractable; in the case of Cu
II3, the Hilbert space would reach a dimension of (2
S + 1)
n × (2
I + 1)
m = 512 for
S = 1/2 (Cu
II),
I = 3/2 (for
63/65Cu), and for
n =
m = 3 electron and nuclear spins, further complicated by the need to calculate 2
3 = 8 possible isotopologs for the
63/65Cu nuclei.
The renewed interest in spin triangles as spin-chirality qubits involves the excitation of the “chiral transitions” between, not within, the low-lying spin doublets. Therefore, engineering the interdoublet energy gap Δ becomes a question of interest. For spin triangles with monatomic bridges (e.g., O2−, OH−, RO−), this can be in the order of ~102 cm−1 for CuII3 triangles, ~101 cm−1 for FeIII3 triangles and ~100 cm−1 for CrIII triangles, i.e., in the THz and FIR regimes. Large trinucleating ligands in place of monatomic ones impose larger interspin separations, allowing us to eventually modulate this energy and lower it within the GHz regime, which is more tractable using EPR instrumentation.
Ligand 2,4,6-tris(di-2-pyridylamino)-1,3,5-triazine (dipyatriz) has in the past been used to construct such molecular architectures. Its attractiveness in copper(II) chemistry lies in the fact that the axial ligands of copper(II) ions can be easily changed by proper the choice of synthetic conditions, namely the relative ratios of CuCl
2·2H
2O and CuClO
4·6H
2O starting materials. Exchanging neutral for anionic ligands can therefore rationally modify the total charge of the molecule. Indeed, previously reported complexes include [Cu
3(dipyatriz)
2Cl
3](ClO
4)
3 (
1) [
13], [Cu
3(dipyatriz)
2(H
2O)Cl
2](ClO
4)
4 (
2) [
13], [Cu
3(dipyatriz)
2(H
2O)
3](ClO
4)
6 (
3) [
14], [Cu
3(dipyatriz)
2Cl
3][CuCl
4]Cl (
4) [
15] and [Cu
3(dipyatriz)
2Cl
3]Cl
3 (
5) [
16], with electric charges of the molecules being rationally modifiable from +3 to +6 without noticeably changing the structure of the metal core (although the +5 complex [Cu
3(dipyatriz)
2(H
2O)
2Cl](ClO
4)
5 has not yet been reported, its synthesis should, in principle, be feasible through the modification of the molecular ratios of CuCl
2·2H
2O and Cu(ClO
4)
2·6H
2O used for the new synthesis of complex
2 reported here). This feature constitutes a degree of freedom for the control of solubilities in desired solvents.
This was therefore deemed a suitable system to construct spin triangles characterized by moderate to weak interactions, and use EPR spectroscopy to assess their magnetic structures far more accurately than it is possible with magnetometric techniques.
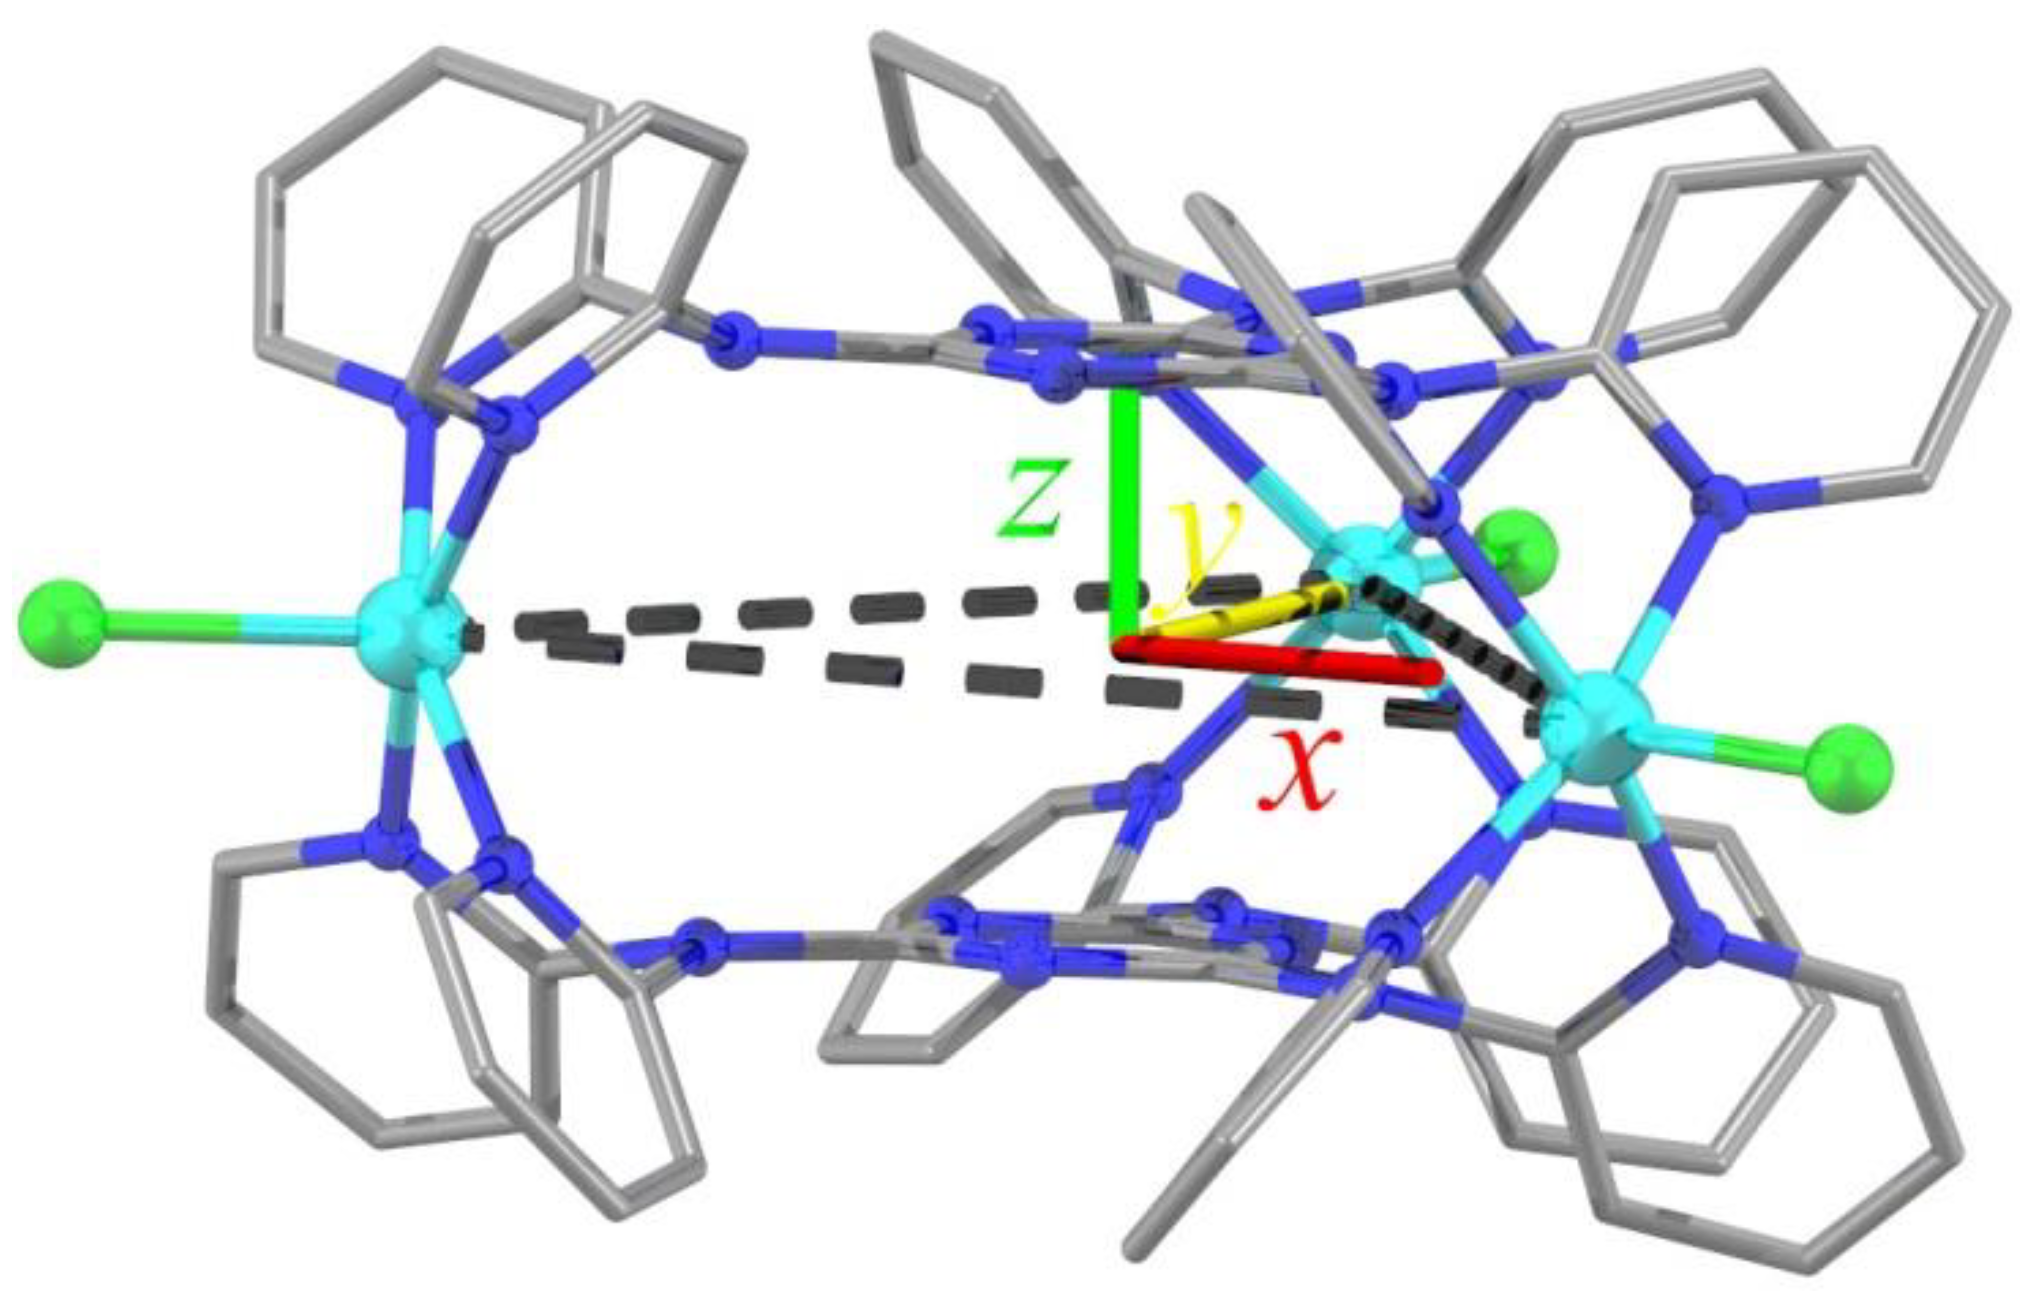
This work describes the modeling of the spin Hamiltonian parameters of a series of Cu
II3 spin triangles of similar structures (
Figure 1) using continuous-wave (CW) EPR data at the X- and Q-bands. From a general perspective, these results outline a methodology to fully account for features of EPR spectra arising from exchange and dipolar interactions by accurately describing the spatial arrangement of the tensorial and vectorial terms of the multispin Hamiltonian. Moreover, the specific results provide precise estimates of exchange interactions mediated by an extended organic superexchange pathway. Such precise estimates, quite difficult to come by via magnetometric methods, are valuable for the calibration of theoretical methods attempting to derive such exchange terms from first principles.
2. Results
In the original work [
13], no magnetic studies were reported for
1. For the structurally related complex
4, SQUID magnetometry yielded antiferromagnetic interactions (
J = +0.42 cm
−1) with
giso = 2.04; these results, however, needed to also account for the Curie contribution of the [CuCl
4]
2− counter-anion, putting the derived values into question due to possible correlations [
15]. In a related work, the SQUID magnetometry of
3 also yielded AF interactions, though much weaker, i.e.,
J = 0.08 cm
−1 (
giso = 2.07) [
14].
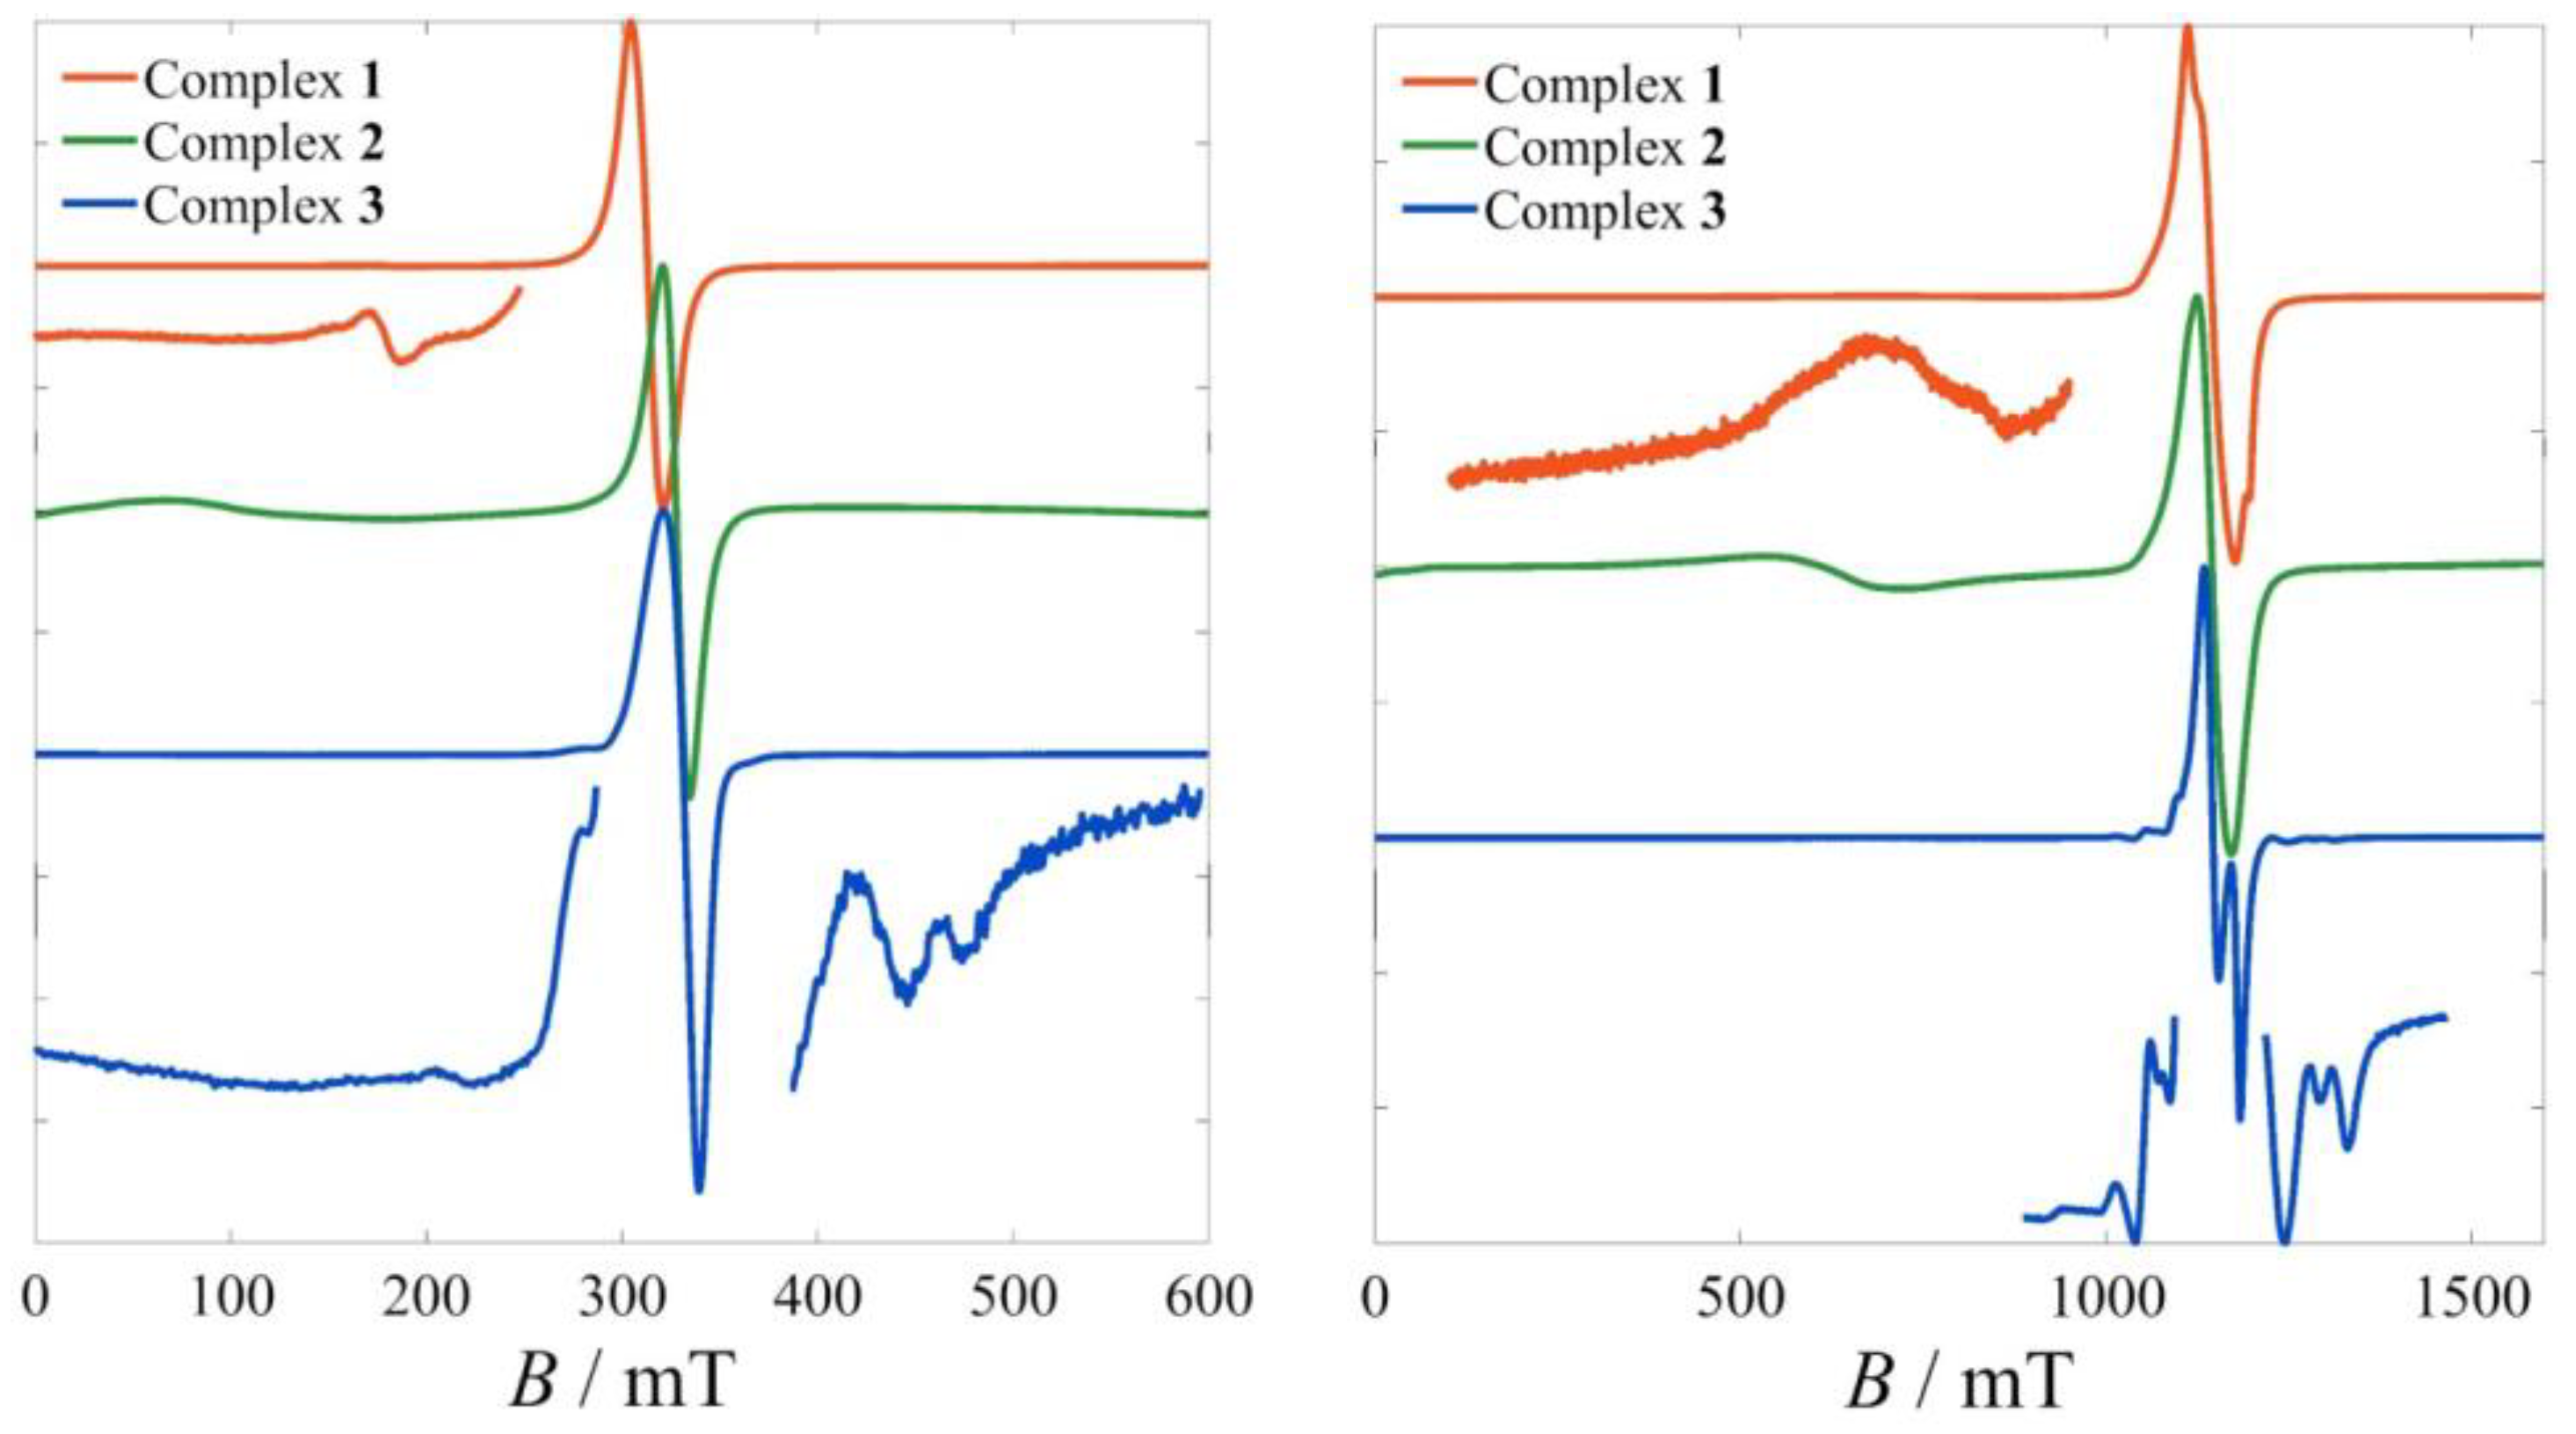
Preliminary EPR studies at the X- and Q-bands in the solid state (
Figure 2) revealed largely unresolved spectra for
1 and
2. These exhibit clear low-field features which disappear upon dissolution. Thus, these might tentatively be attributed to half-field and third-field transitions due to intermolecular dipolar interactions. However, the complexity of simulating EPR spectral features stemming from intermolecular interactions precludes their confident assignment.
On the other hand, fine and hyperfine structures are observed in the spectra of 3, both in the X- and the Q-bands. At the same time, the low-field region (not shown) is completely devoid of any features. The factors influencing EPR spectra in the solid state are more complicated due to the extended intermolecular interactions, but a plausible explanation for the above observations is that the larger intermolecular distances between the hexacations of 3 must play a role in reducing dipolar broadenings in the solid state. Indeed, the shortest intermolecular Cu···Cu distances are 7.262, 8.829 and 9.686 Å for 1, 2 and 3, respectively.
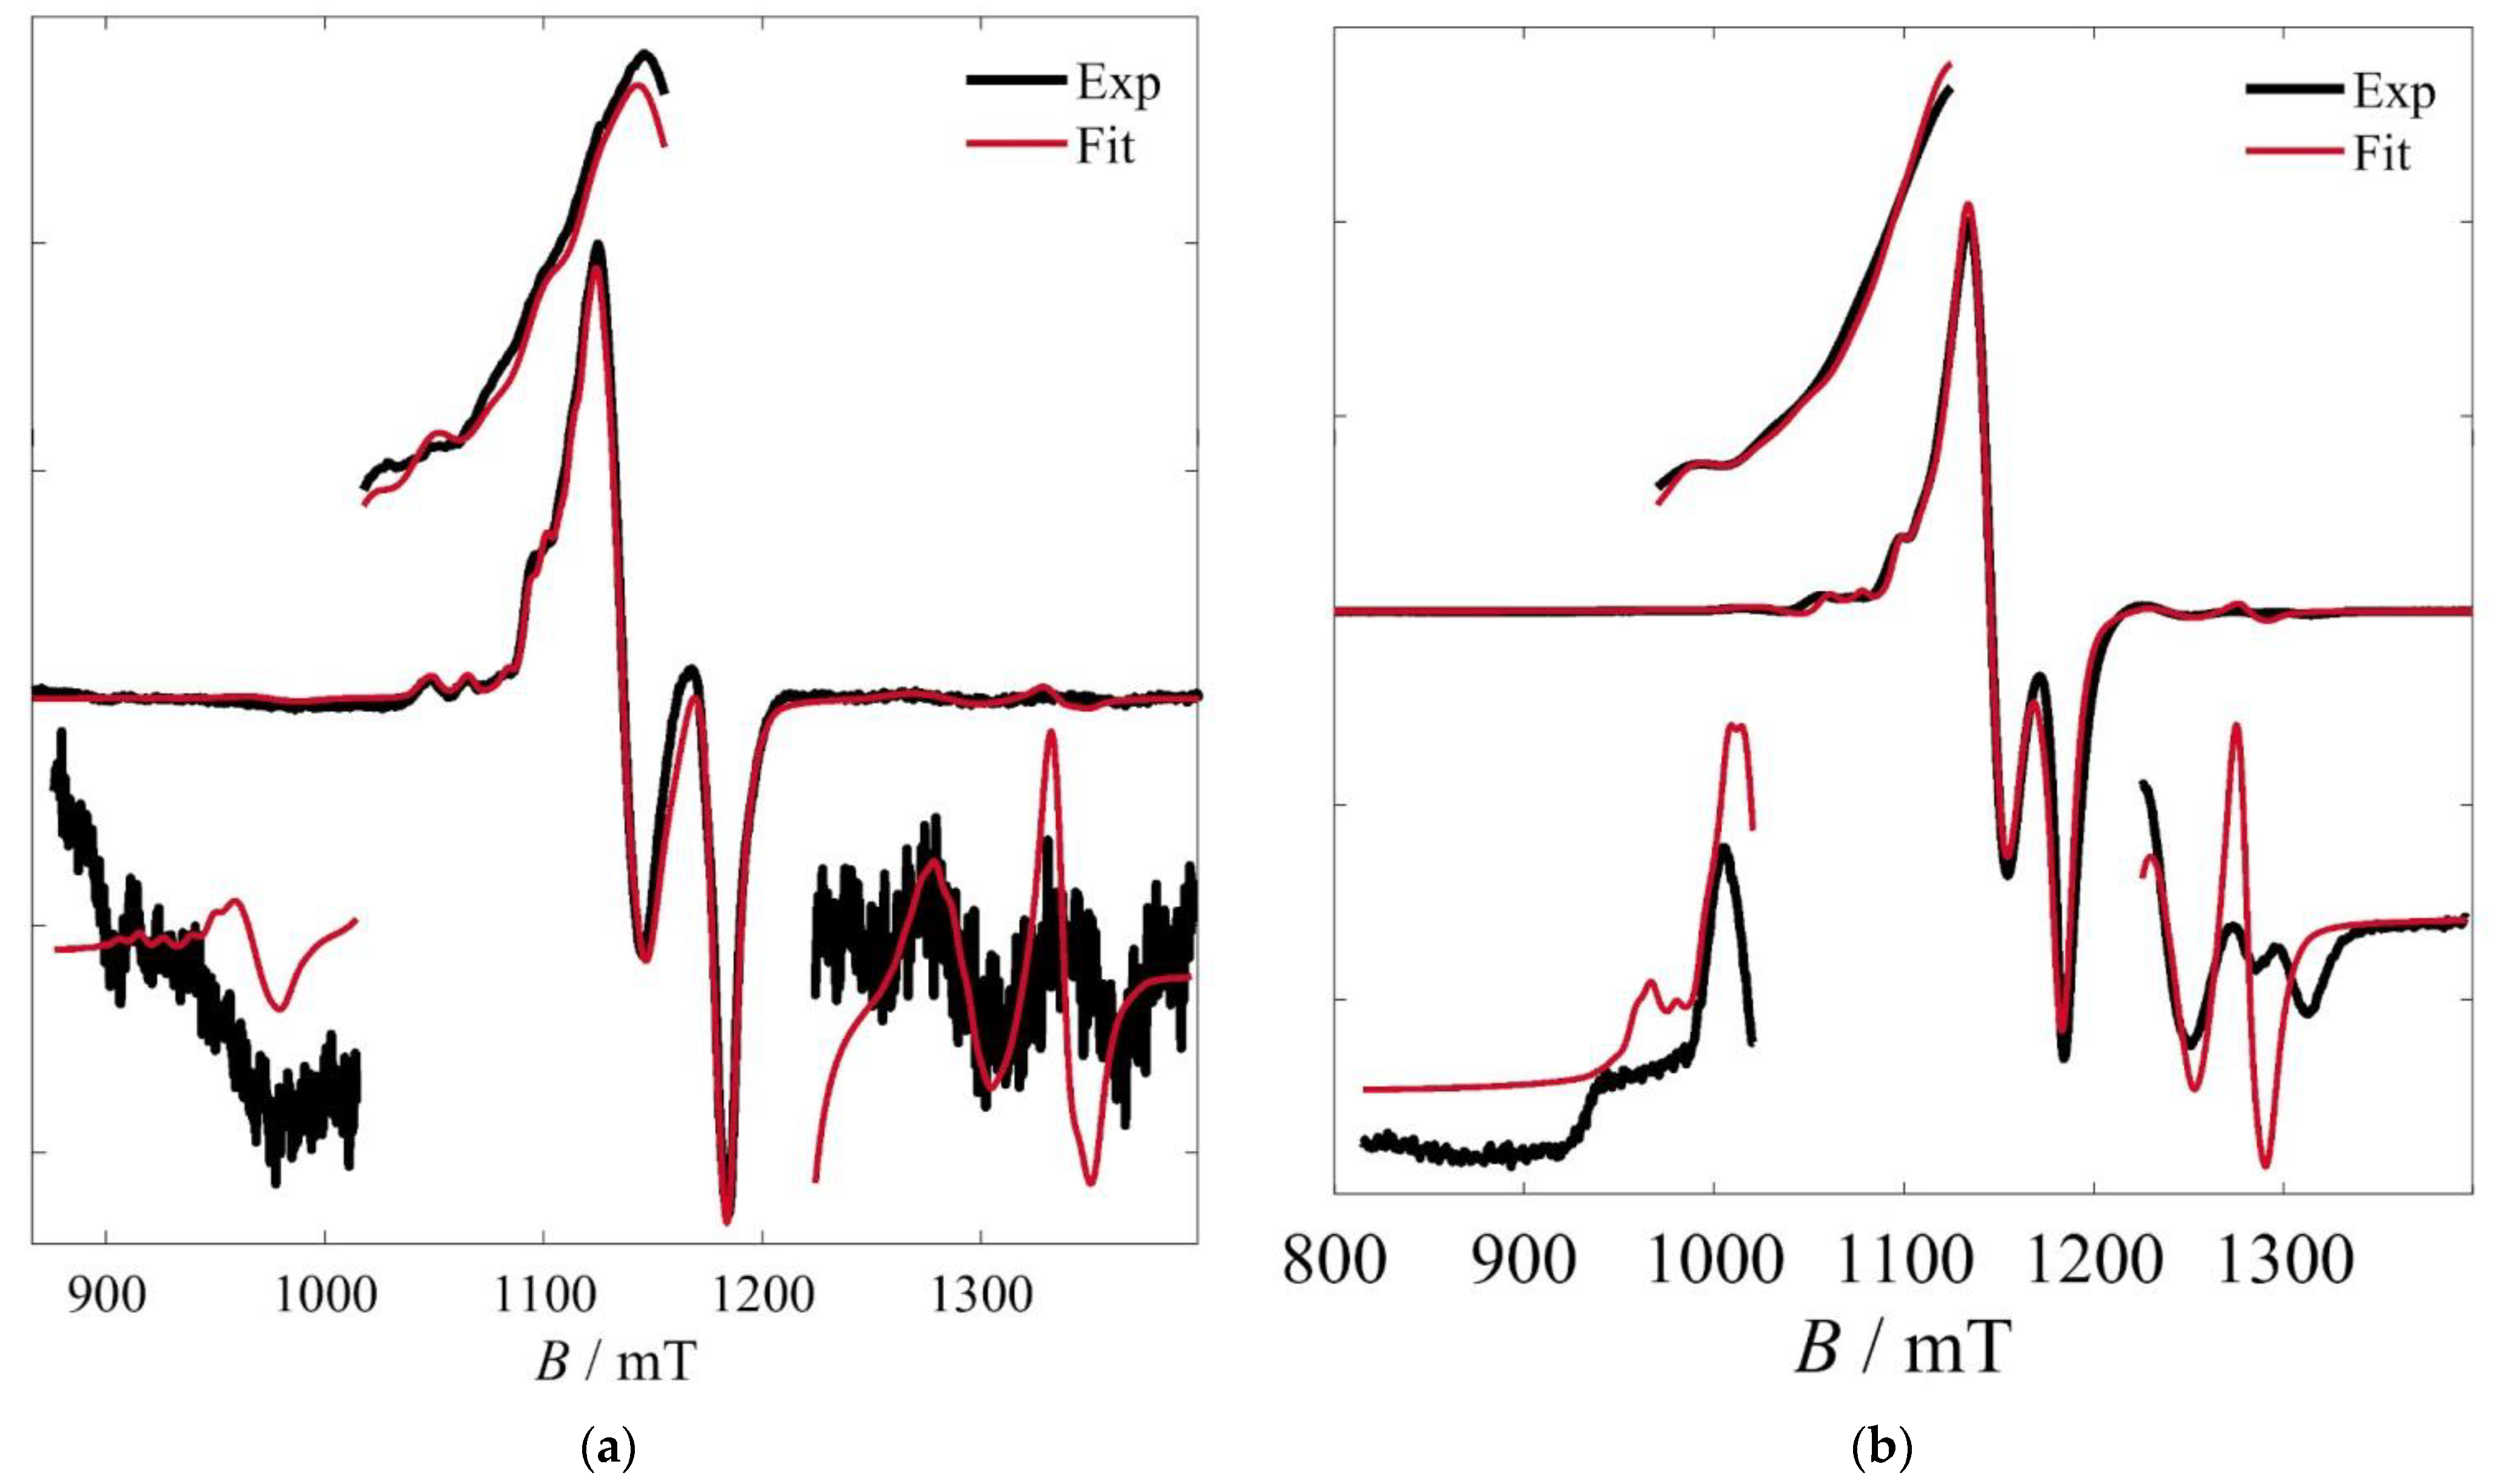
To better understand the magnetic properties of the three complexes, frozen solution studies were also carried out. In the X-band spectra (
Figure 3, left), the hyperfine interactions of the
Ai|| component were partially resolved for
1 and
3, but not for
2. The
g-anisotropy was predictably much less resolved for all three. Q-band spectra were then collected at 5 K in the hopes of better resolving the various contributions. Indeed, at that frequency, not only was the
g-anisotropy resolved, but further details emerged (
Figure 3, right). First, the perpendicular component of the anisotropy
Ai⊥ was also resolved, whereas lateral weak absorptions appeared, which were assigned to intermultiplet (Δ
ST = ±1) transitions.
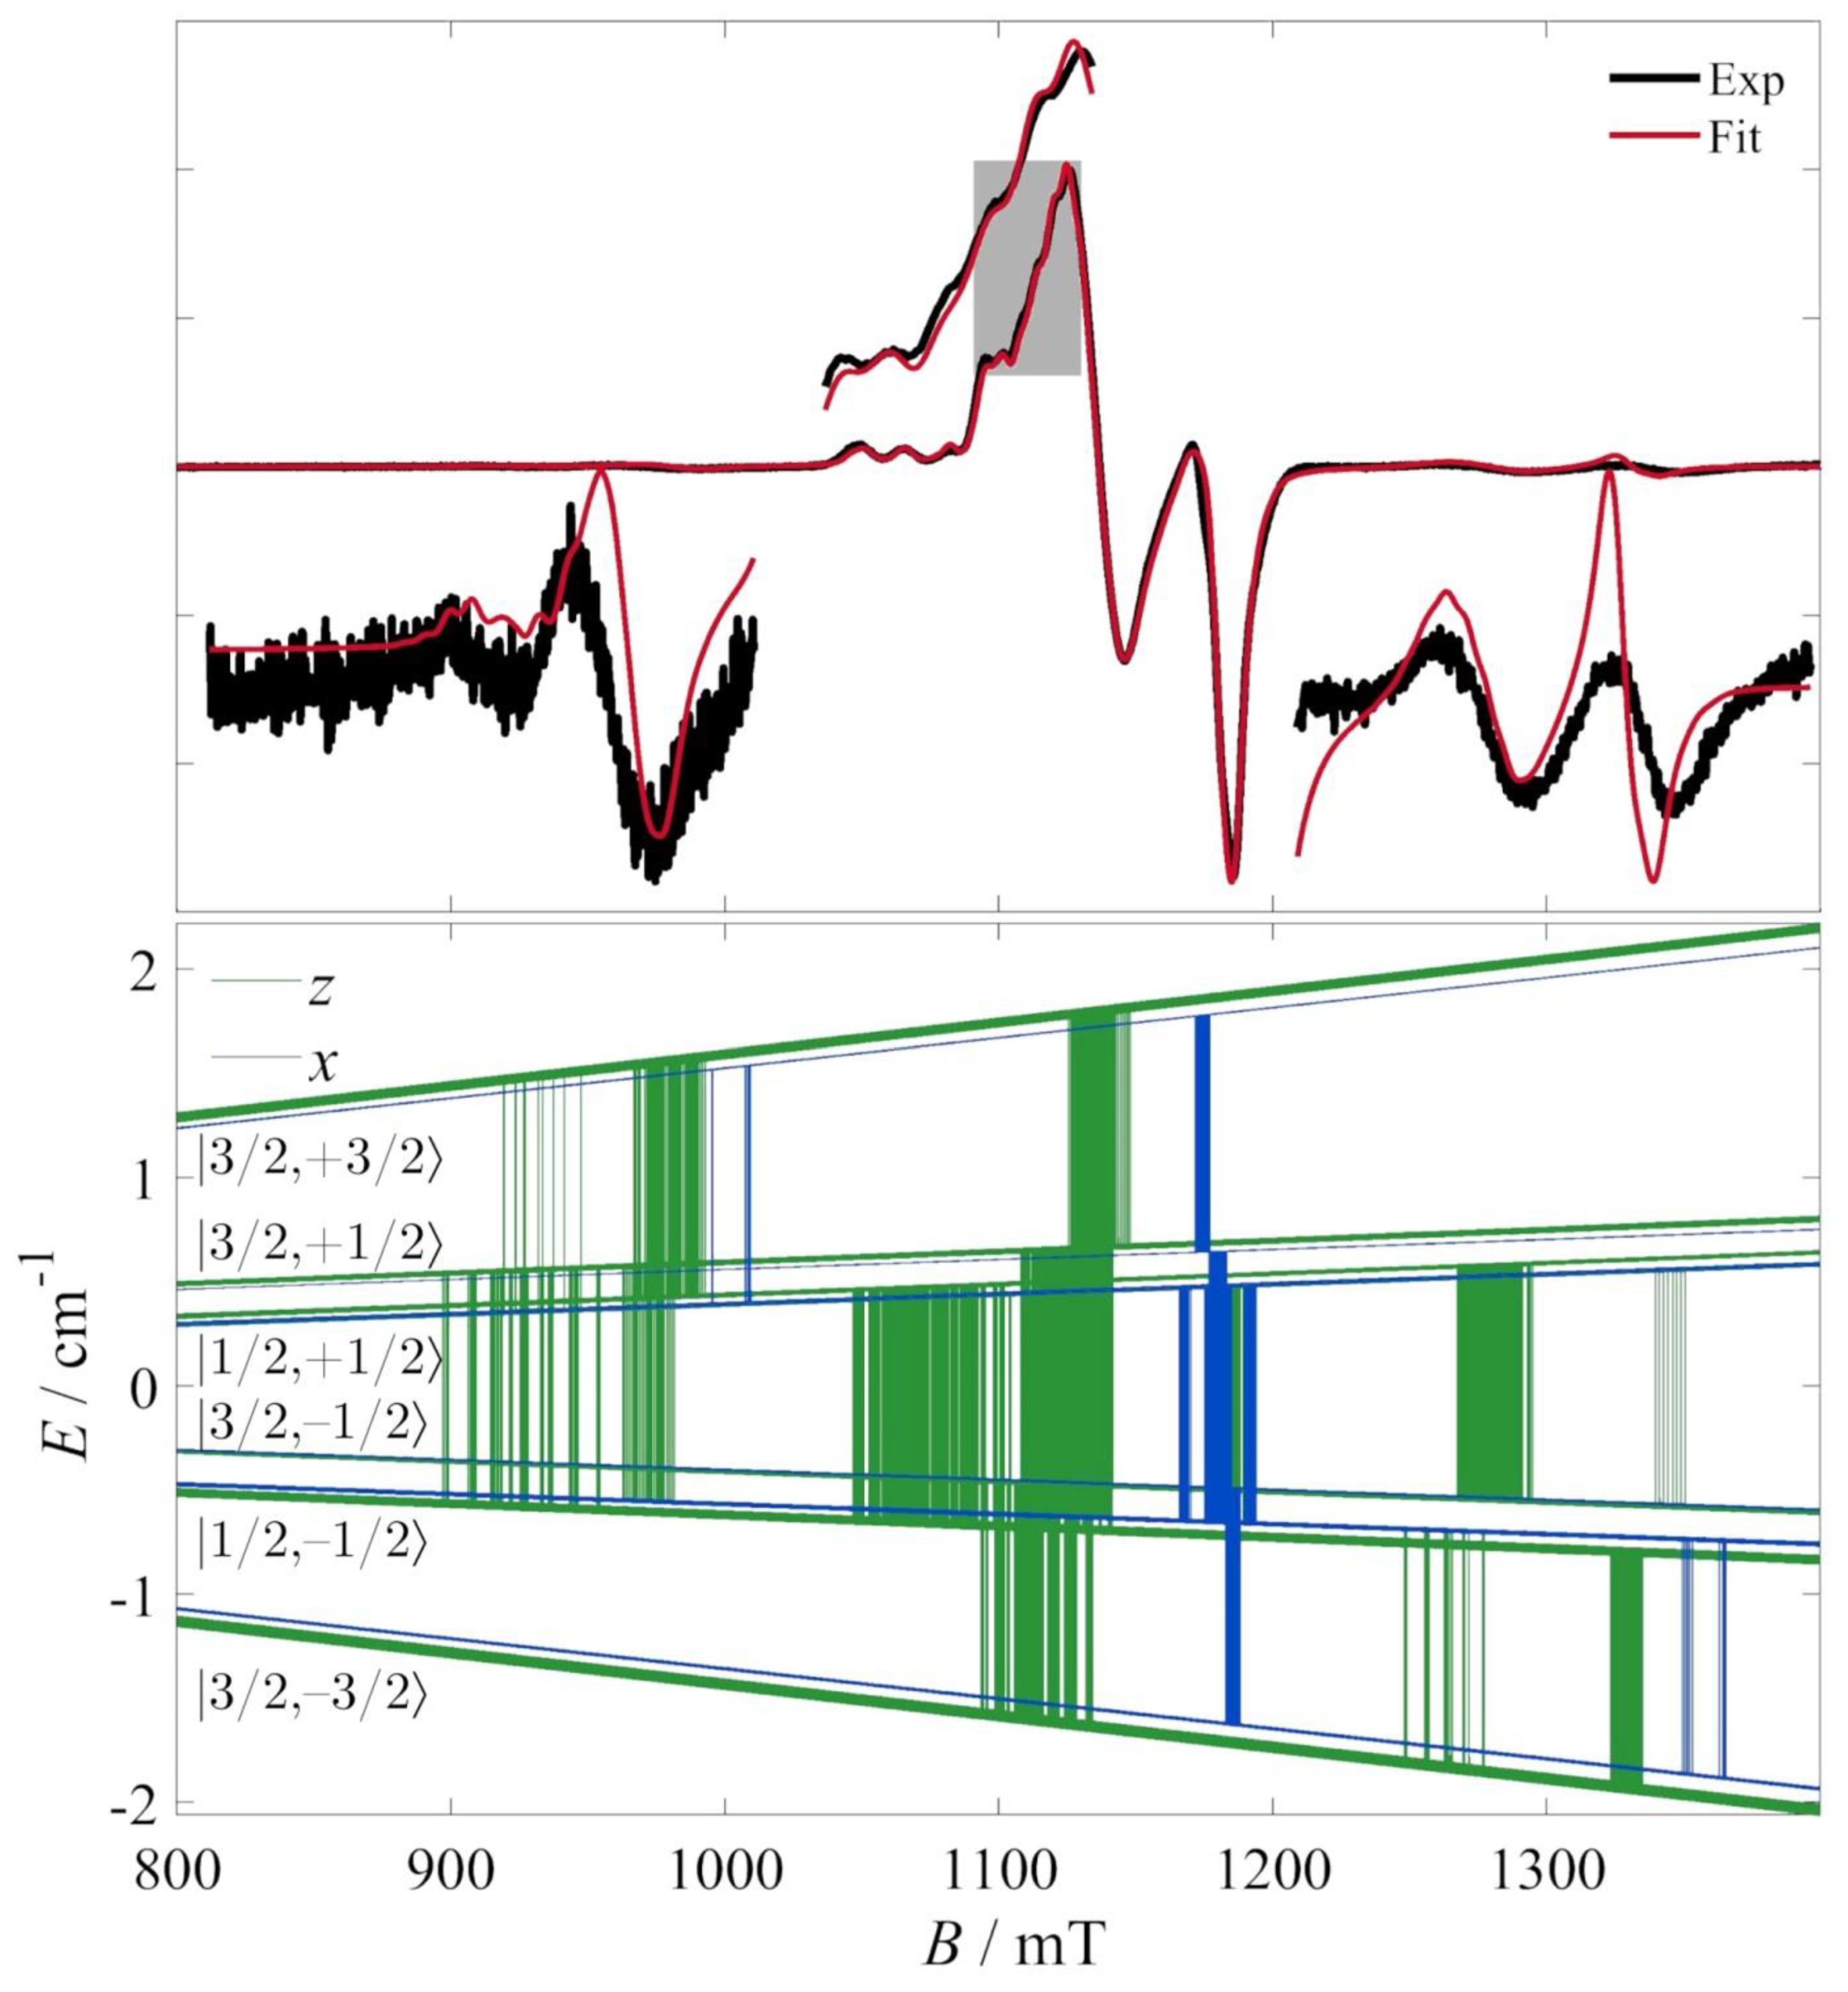
These additional features of the Q-band spectra permitted their thorough analysis based on a more elaborate model. Although all three spectra demonstrated the same overall features, the most detailed analysis was carried out on the spectrum of 1, which exhibited the best S/N ratio.
The selected model comprised an isosceles magnetic symmetry of the isotropic (Heisenberg–Dirac–van Vleck) interactions, dipolar interactions and hyperfine interactions. The full multispin Hamiltonian was:
For the calculations, the fitted quantities were the average of the J and J’ values and their difference, defined, respectively, as: Jav = (2J + J’)/3 and ΔJ = J − J’ (whence it can be derived that J = (3Jav + ΔJ)/3 and J’ = (3Jav − 2ΔJ)/3). To avoid overparameterization, the g- and A-tensor elements for the three ions were taken as identical, as were the interspin distances. The g-tensor reference frames were fixed to idealized positions based on the crystal structure, characterized by Euler angles Eg1 = [90°, 90°, −45°], Eg2 = [30°, −90°, 135°] and Eg3 = [−30°, 90°, −45°] with respect to the molecular frame (ERM = [0, 0, 0]). The A-tensors were initialized collinear to their respective g-tensors (EAi(0) = Egi) and were allowed to vary slightly around that position during the fitting process. To avoid overparameterization, this variation, ΔA, was common for all three hyperfine tensors (EAi = EAi(0) + ΔA).
Preliminary fits were carried out with a model assuming two
63Cu nuclei and one
65Cu nucleus, which is very close to the natural abundances of the two nuclei (i.e., 69.17% and 30.83%, respectively). Simulations revealed that these were largely superimposable with the spectrum calculated, assuming natural abundances on each site (
Figure S1). Since, however, the simulation time rose by a factor of 8 in the latter case due to the calculation of the 2
3 possible isotopologs, this calculation was reserved for only the final fits and statistical analyses of the fitted variables (reported below).
The best-fit parameters to this model, along with their 95% confidence intervals, are thus determined to be:
gi|| = 2.25707 ± 0.00036,
gi⊥ = 2.05853 ± 0.00021, σ
G = 2.31 ± 0.80 mT
pp, σ
L = 2.85 ± 0.22 mT
pp,
rij = 8.22 ± 0.11 Å,
Jav = 0.11217 ± 0.00050 cm
−1, Δ
J = 0.0114 ± 0.0018 cm
−1,
Ai|| = 502.94 ± 8.42 MHz
, Ai⊥ = 52.0 ± 13.2 MHz,
ΔA = [−6.4 ± 2.5°, 3.4 ± 7.4°, 28.8486 ± 0.0005°]. The fit is shown in
Figure 4, along with the resonances calculated in the
z- and
x-molecular orientations of the magnetic field. The fitted tensor elements are shown in
Figure 5.
The fitted transitions involve several intermultiplet ones, whose assignment is facilitated by the consideration of the low-field part of the Zeeman diagram (
Figure S2). Briefly, in spin triangles, the spin–spin couplings create magnetic levels whose description can be based on the intermediate spin quantum number
S23 (where
Ŝ23 =
Ŝ2 +
Ŝ3), the total spin quantum number
S (where
Ŝ =
Ŝ1 +
Ŝ23) and the quantum number
MS of the projection of the total spin (= +
S, +
S − 1, …, −
S). In that scheme,
S23 allows us to distinguish between the two spin doublets (e.g., for
Si = 1/2 systems,
S23 = 0 or 1). However, in the present case, the two doublets are too closely packed and the resonances too numerous for a clear labeling of the states to be possible with the |
S23,
S,
MS〉 scheme. Instead, the simplified scheme |
S,
MS〉 is used in
Figure 4.
Unsurprisingly, the confidence intervals indicate that the g-tensor elements are very well determined. Moreover, we also derive quite small confidence intervals for the average J value, whose magnitude closely tracks the positions of the lateral absorptions. The calculated distance is remarkably close to the crystallographically determined distance average of 8.29 Å (from 8.28, 8.46 and 8.12 Å distances), thus validating the hypothesis of the point dipole model. The values of the hyperfine interactions are also quite well determined and yield reasonable values.
One remark concerns the Euler angles of the local hyperfine tensors. The first two rotation angles which, respectively, define the angular deviations from the triangle dissector and the triangle plane are predictably small and ill-defined. However, we derive a remarkably narrow confidence interval for the third angle, which defines rotations around the local z-axes. This is interpreted more as an artifact of the covariance matrix calculation rather than as a highly certain determination of that angle. While the fits did coherently converge to a significant rotation around the local z-axes, and while these are considered as bearing true physical meaning, the narrowness of the associated confidence interval is not considered to be quantitatively reliable.
A feature that was consistently difficult to reproduce was the line width of the lateral absorptions, with the calculated spectra always yielding much sharper line shapes. The inclusion of antisymmetric (Dzyaloshinskii–Moriya) interactions did not improve the agreement with the experiments. A tentative interpretation is that this line shape is associated with distributions of the exchange terms. Indeed, given the relative flexibility of the molecular scaffold, it is plausible to assume the presence of several slightly different conformations of the molecules in solution. These should be associated with slightly distributed Jav and ΔJ values, which should contribute to this line broadening. A detailed analysis of magnetic exchange parameter distributions would require the calculation of a series of EPR spectra, and would therefore be prohibitively time consuming due to the large Hilbert space of this problem.
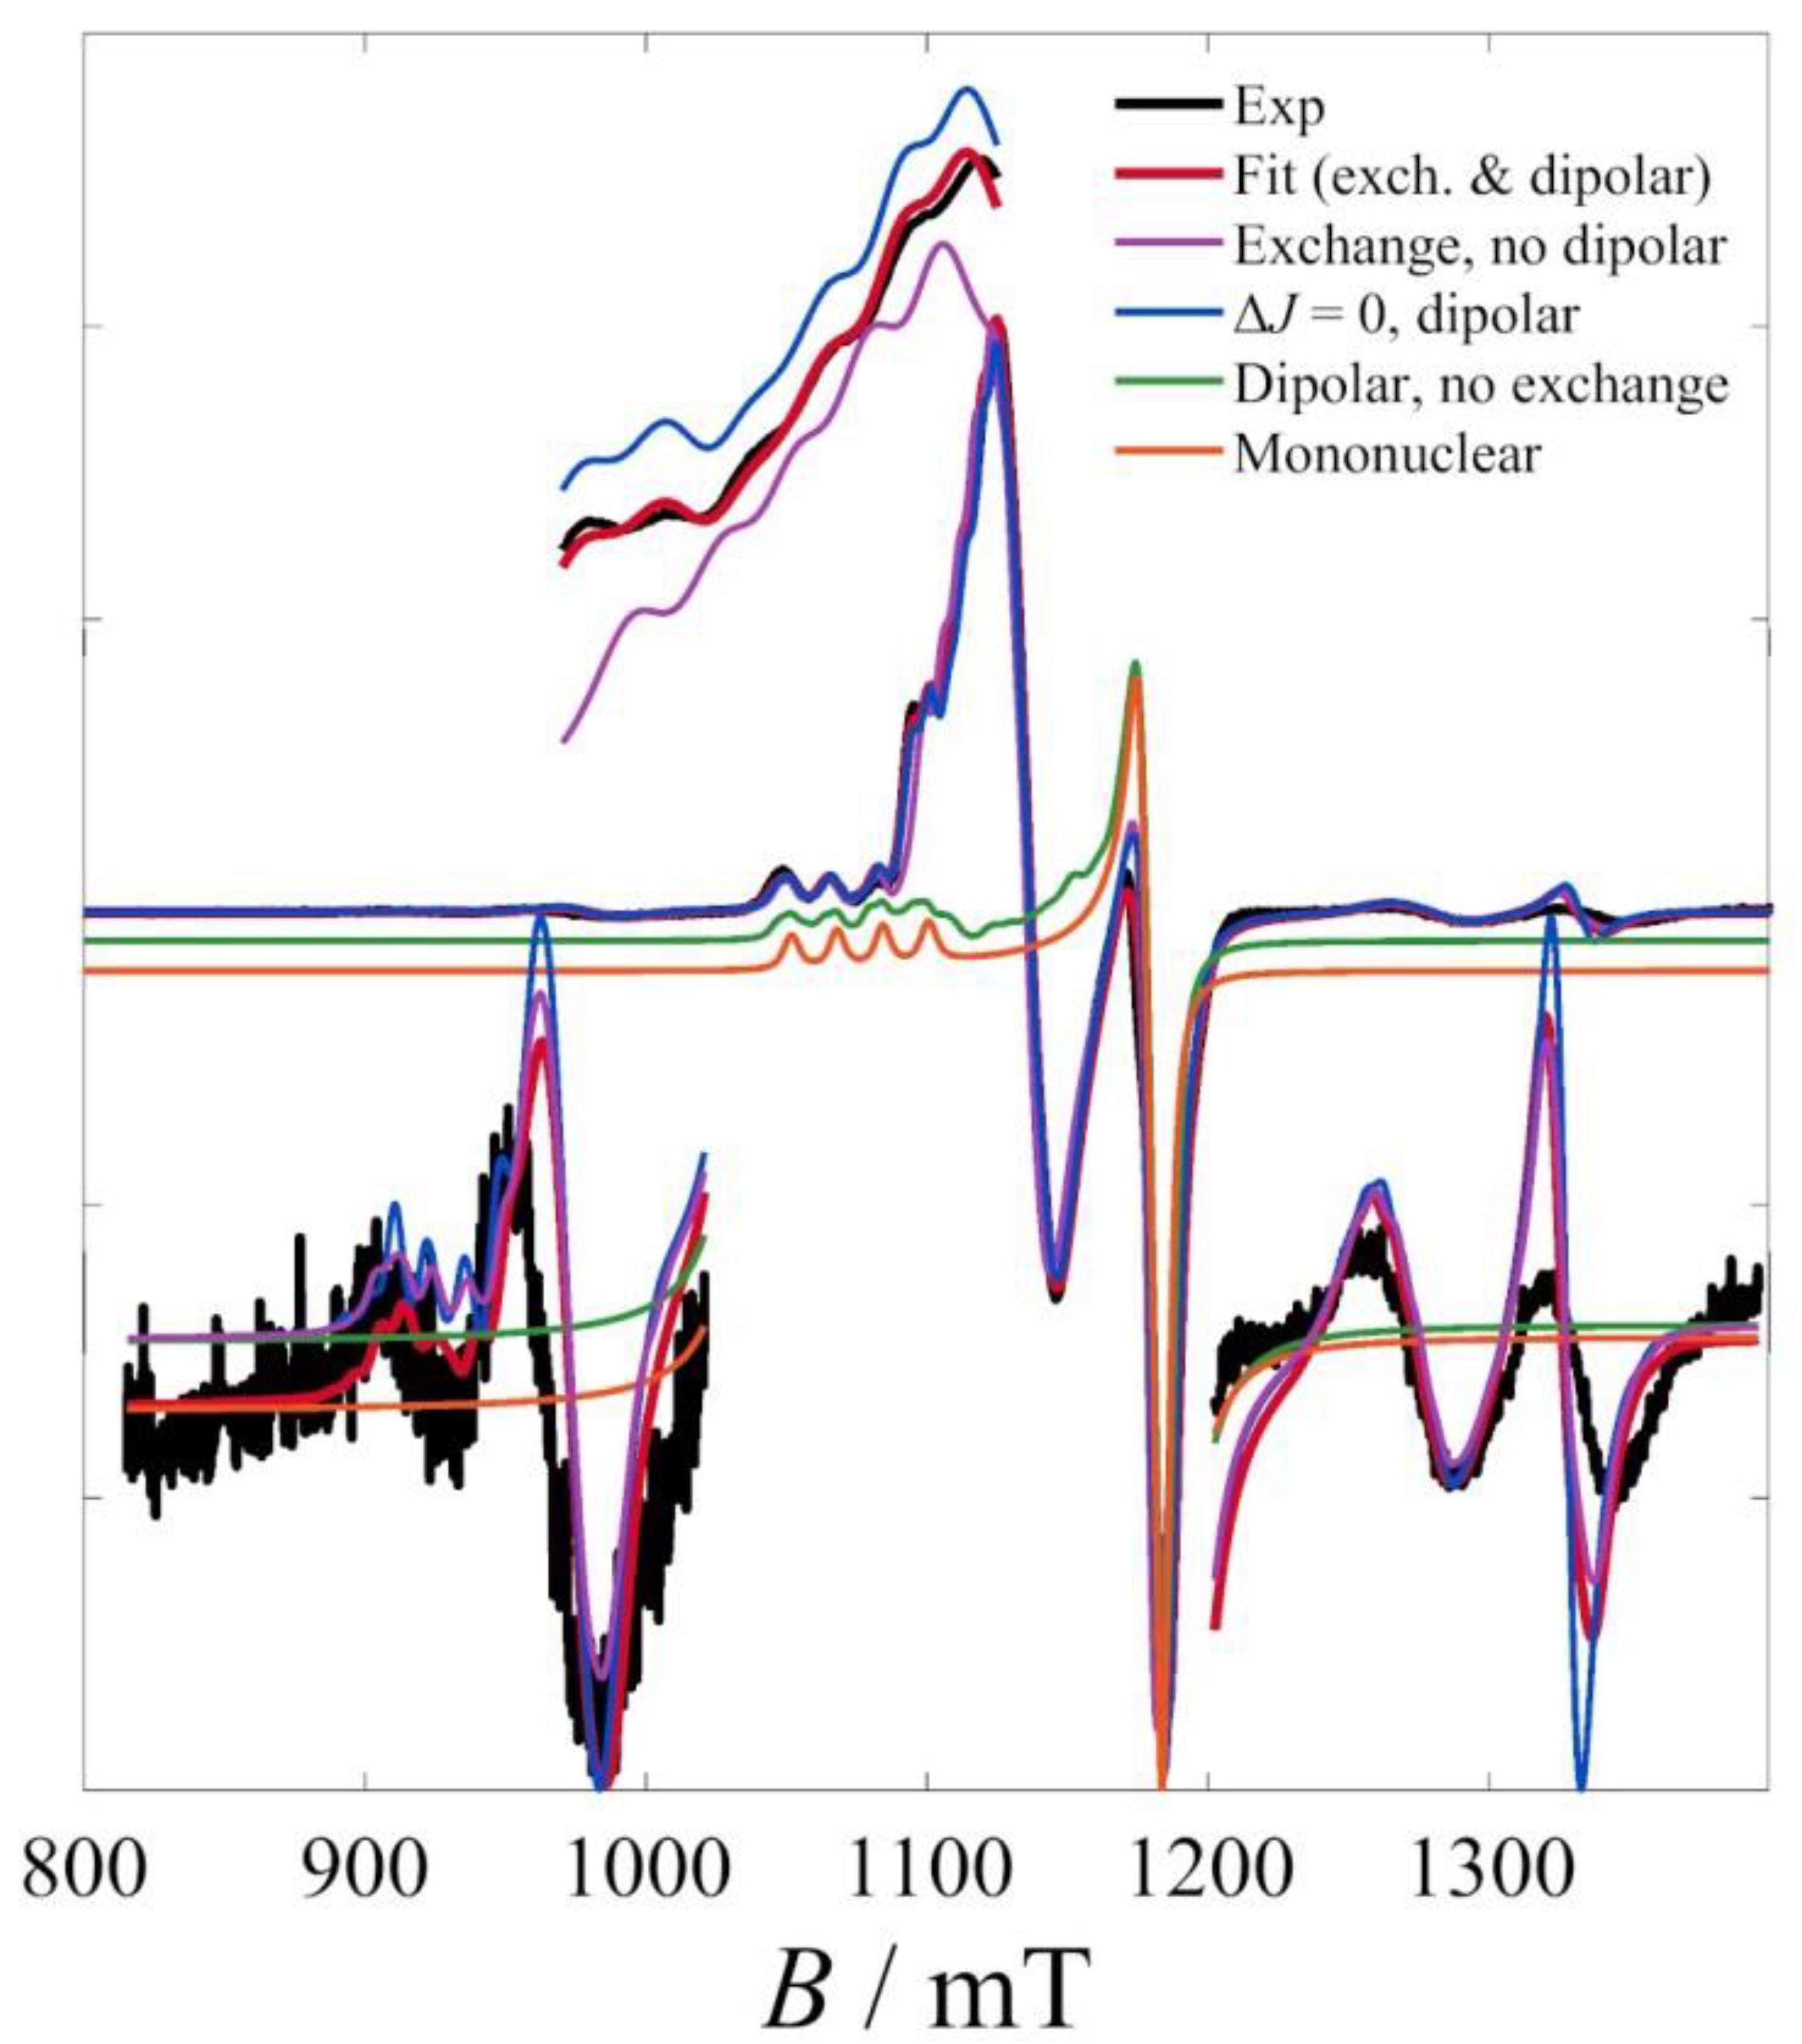
To validate the model used and to justify the number of terms employed, the effect of each of these terms was demonstrated by simulations shown in
Figure 6. The most salient observation is the remarkable effect of the exchange terms on the spectral appearance, both in the central and on the lateral absorptions. Simulations considering only the dipolar contributions or a simple mononuclear paramagnetic species were far from the observed spectrum.
Moreover, it was shown that the dipolar term is also necessary to reproduce the finer details of the central absorption; indeed, neglecting the dipolar terms leads to simulations of visibly lower quality, presumably from the absence of the dipolar-induced zfs in the quartet state.
The least conspicuous effect is that of the ΔJ term (Heisenberg asymmetry), also reflected on the relatively larger confidence intervals of its fitted value. Indeed, the inclusion of this term mainly affects the appearance of the lateral absorptions, particularly the low-field ones. Although small, however, the role of this term is not insignificant and indicates the power of EPR spectroscopy to detect small differences of already weak exchange terms; indeed, the fitted value of 0.0114 cm−1 or 343 MHz is of the order of magnitude of the hyperfine terms.
The absolute values of the principal tensor elements of the pairwise dipolar interactions at those distances were 228, 104 and 99 MHz, yielding a total zfs with Ddip = 74 MHz (0.0025 cm−1) when the local reference frames are taken into account.
Given the relatively good quality of the Q-band spectrum of
2, fits were attempted based on the model used for
1 and by using that best-fit solution as a point of departure. However, given the relatively poorer spectral quality, a simplification was made by considering collinear
and
local tensors. The best-fit parameters to this model, along with their 95% confidence intervals, are:
gi|| = 2.25488 ± 0.00061,
gi⊥ = 2.06111 ± 0.00025, σ
G = 3.3 ± 1.0 mT
pp, σ
L = 2.41 ± 0.50 mT
pp,
rij = 8.35 ± 0.15 Å,
Jav = 0.11628 ± 0.00073 cm
−1, Δ
J = 0.0150 ± 0.0019 cm
−1,
Ai|| = 543 ± 14 MHz
, Ai⊥ = 69.6 ± 6.4 MHz.
ΔA was fixed to [0, 0, 0]. The respective calculated spectrum is shown in
Figure 7a.
Finally, similar fits were attempted for the powder room-temperature spectra of
3 (
Figure 7b), whose fine structure made such fits feasible. It is suggested that the observation of this fine structure is probably due to the larger intermolecular separations in the solid state, which reduce dipolar broadenings. The previously determined parameters proved to be a suitable starting point for the fits to this spectrum. However, the predictably poorer resolution of the hyperfine interactions, as well as some additional features in the lateral (intermultiplet) absorptions, add some uncertainty to these fits. Accordingly, these are treated as simulations and the results are given without a detailed statistical treatment. These are:
gi|| = 2.230,
gi⊥ = 2.061, σ
G = 3.31 mT
pp, σ
L = 3.85 mT
pp,
rij = 8.22 Å,
Jav = 0.078 cm
−1, Δ
J = 0.011 cm
−1,
Ai|| = 540.0 MHz
, Ai⊥ = 48.0 MHz.
ΔA was fixed to [0, 0, 0].
3. Discussion and Comparative Analyses
This work demonstrates that EPR spectroscopy can be successfully used to address weak spin–spin interactions in relatively complicated polynuclear systems, thus providing an important complement to magnetometric studies. Indeed, the detailed EPR study of 1–3 allowed the estimation of very weak exchange interactions as well as dipolar couplings to a level of confidence practically unattainable with magnetic susceptometry experiments. Notably, a single EPR experiment for each complex provided sufficient information for the determination of those interactions in parallel to hyperfine ones.
As far as the specific complexes of this study are concerned, these were shown to exhibit a close agreement in their magnetic properties (
Table 1), in accordance to their very similar molecular structures. Regarding the exchange and hyperfine interactions, the rationalization of their precise magnitudes requires the use of theoretical models, which is beyond the scope of this work. However, regarding the larger line widths of
3, these may plausibly be attributed to remaining intermolecular dipolar interactions in the solid state, which give rise to smaller but non-negligible dipolar broadenings.
It should be noted that similar systems have been studied in the past, using EPR spectroscopy at even higher fields like in the case of Cu
II3 triangles encapsulated in polyoxometallates. In particular, the powder W-band EPR spectra of K
9Na[Cu
3(H
2O)
3(
α-TeW
9O
33)
2]·16H
2O [
17] and Na
9[Cu
3Na
3(H
2O)
9(
α-AsW
9O
33)
2]·26H
2O [
18] were simulated by a giant spin approach, with the exchange interactions determined independently by variable-temperature magnetic susceptometry. Subsequently, single-crystal studies of the latter complex were complemented by pulsed field-sweep experiments for the same purpose [
19,
20]. Despite the clear presence of intermultiplet resonances in these latter spectra, these resonances were not simulated for the determination of exchange interactions.
Of relevance are also studies of the extensively explored polyoxovanadate system K
6[V
15As
6O
42(H
2O)]·8H
2O, or “V
15”, whose precise determination of the spin–spin interactions has been a contentious issue. The metallic core of the molecule can be considered as three-layered, i.e., {V
6-V
3-V
6}, with the top and bottom “V
6” layers exhibiting strong antiferromagnetic interactions, which quench their magnetizations. Thus, the low-temperature magnetic properties of the molecule are usually treated as stemming from the weakly coupled triangular “V
3” layer [
21]. It is of note that while extensive studies have been conducted, employing an arsenal of techniques, such as various types of magnetometry [
22,
23], EPR at various frequencies [
24], inelastic neutron scattering [
25], heat capacity [
26] and NMR spectroscopy [
27], there still remain ambiguities around the precise nature of the spin–spin interactions of this molecule. The application of the models described in this work should complement our understanding of this question.


