Article

Structure and Magnetism of Iron-Substituted Nickel Hydroxide Nanosheets

by
Samuel W. Kimmel
1,†,
Barry D. Koehne
1,†,
Ben Gibson
2,
Wilhelmus J. Geerts
1,3,
Nikoleta Theodoropoulou
1,3,* and
Christopher P. Rhodes
1,2,*
1
Material Science, Engineering, and Commercialization Program, College of Science and Engineering, Texas State University, San Marcos, TX 78666, USA
2
Department of Chemistry and Biochemistry, Texas State University, San Marcos, TX 78666, USA
3
Department of Physics, Texas State University, San Marcos, TX 78666, USA
*
Authors to whom correspondence should be addressed.
These authors contributed equally to this work.
Magnetochemistry 2023, 9(1), 25; https://doi.org/10.3390/magnetochemistry9010025
Submission received: 10 December 2022 / Revised: 29 December 2022 / Accepted: 4 January 2023 / Published: 8 January 2023
(This article belongs to the Special Issue Advances in Magnetic Nanomaterials and Nanostructures)

Abstract

:
Nanosheets composed of stacked atomic layers exhibit unique magnetic, electrical, and electrochemical properties. Here, we report the effect of iron substitution on the structure and magnetism of nickel hydroxide, Ni(OH)2, nanosheets. Ni(OH)2 and iron-substituted Ni(OH)2 (5, 10, 20, and 50 atomic % Fe substitution) were synthesized using a rapid microwave-assisted hydrothermal process. Scanning and transmission electron microscopy show the materials are polycrystalline nanosheets that aggregate into micron-sized clusters. From X-ray diffraction characterization, iron substitutes into the α-Ni(OH)2 lattice up to 20 at. % substitution. The nanosheets exhibit different in-plane and through-plane domain sizes, and Fe substitution affects the nanocrystallite shape anisotropy. The magnetic response differs with Fe substitution: 0% and 5% Fe are ferromagnetic, while samples with 10% and 20% Fe are ferrimagnetic. The competing interactions between magnetization sublattices and the magnetic anisotropy due to the crystalline and shape anisotropy of the nanosheets lead to magnetization reversal at low temperatures. The correlation between higher coercivity and larger nanocrystalline size anisotropy with higher Fe % supports that magnetic anisotropy contributes to the observed ferrimagnetism. The interplay of morphology and magnetic response with Fe-substituted Ni(OH)2 nanosheets points to new ways to influence electron interactions in layered materials which has implications for batteries, catalysis, sensors, and electronics.

Graphical Abstract

1. Introduction

Nickel hydroxide, Ni(OH)2, has wide-ranging applications in batteries, sensors, supercapacitors, water electrolysis, photocatalysis, and other applications [1,2,3], and is also a precursor for nickel oxide which has applications in antiferromagnetic spintronics [4]. Nickel hydroxide occurs in predominately two phases: β-Ni(OH)2 and α-Ni(OH)2. Both compounds organize into a hexagonal crystal structure with hydroxyl ions above and below the Ni2+ forming a close-packed two-dimensional (2D) trigonal crystal. Both the β-phase and α-phase adopt layered structures, and in the case of β-Ni(OH)2, these hexagonal layers are weakly bonded along the c-axis directly, while in α-Ni(OH)2, intercalated water molecules or other anions are between the layers [1,5]. The layers of α-Ni(OH)2 are turbostratic [1] and are typically stacked in platelike or flower-like arrangements.
The α-phase is preferred as an alkaline battery cathode material due to its ability to store more than one electron per Ni site [6,7]; however, unsubstituted α-Ni(OH)2 is unstable in alkaline electrolyte and requires substituents to stabilize the structure. A variety of metal cation (Al, Co, Fe, Cr, Mn, Y, Zn, La) substituents can be incorporated within the α-Ni(OH)2 structure by chemical/electrochemical routes, and the metal substituents alter the material’s structure and electrochemical properties depending on the substituent [8,9]. Metal cation substituents within γ-NiOOH, the oxidized form of α-Ni(OH)2, have been investigated for mitigating self-discharge in nickel–zinc batteries [10]. Some of the authors of this paper have previously reported that substitution of trivalent aluminum for divalent nickel within α-Ni(OH)2 increased the interlayer distance due to higher amounts of charge-compensating nitrate anions within the interlayer region and resulted in stabilizing the α-Ni(OH)2 structure and increasing the voltage and discharge capacity within nickel–zinc batteries [11].
Iron is a particularly interesting substituent within Ni(OH)2, and Fe substitution into α-Ni(OH)2 increases the electrocatalytic oxygen evolution reaction (OER) activity [9,12,13]. A prior study reported that the concentration of Fe substituted into α-Ni(OH)2 nanosheets influences the catalytic performance, with a Ni0.78Fe0.22 substitution ratio showing the lowest OER overpotential [12]. In addition to Fe substitution, the incorporated/interlayer molecules and ions and morphology of nanostructured α-Ni(OH)2 can all influence the electrocatalytic OER performance [14,15,16]. The α-Ni(OH)2 morphology influences the number of exposed active catalytic sites [14], while incorporated/interlayer molecules and ions such as carbonates, nitrates, sulfates, and halides affect the OER overpotential and Tafel slope [15,16]. Understanding how Fe substitution alters the electronic structure within nickel–iron hydroxides is critically important as the electronic structure influences properties including catalytic activity, electronic conductivity, battery charge/discharge voltage, stability, and optical properties.
The magnetic response of nanomaterials differs from bulk materials [17]. Magnetization in nanomaterials is influenced by a number of factors including morphology [18], phase [19,20,21], interlayer spacing [22,23], particle size [24,25], oxidation state [26], adsorbed or coordinated species [27,28], and defects [25,29]. A prior study indicated that nanoparticles can exhibit strong coupling between magnetic and structural disorder as well as having a magnetic moment originating from the magnetization of the single-domain particle core surrounded by a surface region hosting spin disorder [30]. Magnetic susceptibility has been correlated with charge storage within hydrous ruthenium oxide nanomaterials [31]. In situ magnetometry of Fe3O4 electrodes supported that surface capacitance was due to spin-polarized electrons stored in the reduced metallic nanoparticles [32].
The magnetic behavior of Ni(OH)2 and Fe-substituted Ni(OH)2 results from exchange interaction between the metal ions mediated by the adjacent oxygen ions. For Ni2+ (3d8) with octahedral coordination of OH anions, the electronic configuration is t2g6eg2 with two unpaired, spin-aligned valence electrons in the two, singly occupied eg orbitals; however, the electronic configuration and energy levels can be modified by distortions of the octahedral geometry due to structural disorder or changes in the electronic structure by interactions with additional molecules or impurities within the structure [1]. Fe2+ (3d6) and Fe3+ (3d5) coordinated to aquo ligands adopt high-spin configurations, t2g4eg2 and t2g3eg2, respectively [33].
Prior studies have investigated the magnetization of β-Ni(OH)2 and α-Ni(OH)2 [20,21]. α-Ni(OH)2 intercalated with acetate has been reported to be ferromagnetic with a Curie temperature of 16 K [20]. The alkaline-stable β-Ni(OH)2 is reported to be an antiferromagnet with a Neel temperature of 35.5 K [19], or reported to exhibit both intraplanar ferromagnetic behavior and interplanar antiferromagnetic behavior [20]. The magnetization of nickel–iron hydroxides prepared from chemical precipitation from sulfate salts under basic conditions was previously reported [34]. A prior study reported magnetic properties of nickel–iron hydroxides synthesized under hydrothermal conditions from nickel nitrate and iron chloride precursors [18]. The magnetization of manganese-substituted nickel hydroxide has been investigated [35]. A prior study reported that magnetic and Mossbauer characterization of Fe-substituted γ-NiOOH showed that the spin state of Fe depends on the Fe concentration and the substituent’s oxidation state varies to accommodate the native crystal field [24,26].
The magnetization of nanosheets is of particular interest for next-generation memory, spintronics, optoelectronics, and two-dimensional magnetic materials, which can exhibit unique layer-dependent magnetic ordering [36] and low-dimensional magnetization [37]. We previously reported the structure of α-Ni(OH)2 and Al-, Zn-, and Mn-substituted α-Ni(OH)2 nanosheets synthesized using a rapid microwave-assisted hydrothermal process [11]. Here, we report on how Fe substitution within Ni(OH)2 nanosheets prepared using microwave synthesis affects the structure and magnetism, which to our knowledge has not been previously reported.

2. Materials and Methods

2.1. Microwave Synthesis of α-Ni(OH)2 and Fe-Substituted α-Ni(OH)2

A series of Ni1−xFex(OH)2 (x = 0, 0.05, 0.10, 0.20, 0.50) nanosheets were synthesized by adapting a microwave-assisted hydrothermal route previously reported by our group to include iron in the synthesis [11]. In the modified synthesis, Ni(OH)2 nanosheets and Fe-substituted Ni(OH)2 nanosheets were synthesized by atomic substitution of Ni for Fe following the notation Ni1-xFex, where x = 0.00, 0.05, 0.10, 0.20, and 0.50 and are notated as Ni1.00 Fe0.00, Ni0.95Fe0.05, Ni0.90Fe0.10, Ni0.80Fe0.20, and Ni0.50Fe0.50, respectively. For a given iron concentration, Ni(NO3)2·6 H2O (Ward’s Science, Rochester, NY, USA), urea (VWR Analytical, Orange, CA, USA) and FeSO4·7H2O (Alfa Aesar, Ward Hill, MA, USA) were dissolved in a solution of ethylene glycol (21 mL, VWR Analytical) and ultrapure water (3 mL, ≥18 MΩ-cm; used for all reactions and washings); the masses and volumes of reactants are listed in Table S1. The solution was then exposed to variable microwave radiation (CEM Discover SP) at 120 °C for 13 min while under magnetic stirring. The precipitate was collected by centrifugation (6000 RPM, 4 min), washed five times with water and three times with ethanol (EtOH, 200 proof), and then dried overnight at 60 °C under ambient atmosphere.

2.2. Structural Characterization

The microwave-synthesized Ni1-xFex(OH)2 materials were characterized by scanning electron microscopy (SEM) and energy dispersive X-ray spectroscopy (EDS) using a Helios NanoLab 400 DualBeam Field Emission Scanning Electron Microscope using an accelerating voltage of 10 kV and a current of 0.34 nA. The micrographs were generated from secondary electrons using a though-the-lens detector. The samples were prepared by suspending the solids in isopropyl alcohol and drop casting onto aluminum SEM stubs; the isopropyl alcohol was evaporated prior to SEM analysis. No additional conductive coatings were applied to the samples. EDS spectra were obtained during SEM imaging. Within each individual sample, three regions were analyzed with the at. % of each element averaged across three regions. The experimentally determined relative at. % of Ni to Fe slightly varied from sample-to-sample at the same nominal substitution ratios (Table S2, Figure S5). As the sample-specific iron content is expected to influence the magnetization of the Fe-Ni(OH)2 nanosheets, a single representative data set (SEM, EDS, X-ray diffraction, and magnetic characterization) of Ni1−xFex samples is presented in its entirety; all data sets from similarly prepared samples follow the same reported trends.
Powder X-ray diffraction (XRD) patterns were collected using a Bruker AXS D8 Advanced Powder X-ray diffractometer (Cu Ka radiation source, 40 kV and 25 mA) using a high-resolution energy-dispersive 1D Linxeye XE detector with a (scan range 5–80° 2q with a 0.01° increment). The diffraction patterns were analyzed using PDXL analysis software (Rigaku, Tokyo, Japan). The software was used to strip the Ka2 contribution, identify the background, and fit the diffraction pattern. The Bragg equation was used to determine the d-spacing; the crystallite size, D, was determined using the Scherrer equation, D = K s λ β 2 θ c o s θ where K s is the Scherrer constant (a Scherrer constant of 0.94 was used for the analysis), λ   is the wavelength of the X-rays, and β 2 θ is the integral breadth of the diffraction peak [38,39]. We note that the absolute values of the nanocrystal sizes determined from XRD depend on the Scherrer constant, which differ based on domain shape and fitting method [38,39]. The experimental XRD pattern was fit to a known standard, described in the text below, using a split pseudo-Voigt function to determine the crystallographic constants a, b, and c.
An unsubstituted Ni(OH)2 nanosheet sample and a 5 at.% Fe-substituted Ni(OH)2 nanosheet sample were prepared for transmission electron microscopy imaging by bath sonicating a small amount of the nanosheet powder in EtOH. After sonication, the nanosheet/EtOH suspension was drop cast onto an ultrathin carbon film on lacey carbon support (Ted Pella, Redding, CA, USA, item number 01824). The samples were analyzed using a Thermo Scientific, Waltham, MA, USA, FEI Talos f200i S/TEM equipped with a single tilt sample holder using an accelerating voltage of 200 kV.

2.3. Magnetic Characterization

The magnetization, M, of the Ni1−xFex samples series was measured as a function of magnetic field, H, (M vs. H) and as a function of temperature, T, (M vs. T) using a Vibrating Sample Magnetometer (VSM) (Quantum Design, San Diego, CA, USA, DynaCool). The VSM instrument allows measurements within a 9 Tesla magnetic field and between 2 to 300 K. The M vs. T measurements were performed in two ways: zero field cooled (ZFC) or field cooled (FC). For the ZFC magnetization measurements, the sample was cooled to 2 K in zero magnetic field. When the lowest temperature of 2 K is stabilized, a specified magnetic field is applied, and the magnetization was measured as temperature increases at a rate of 3 K/minute. For the FC magnetization measurements, the sample magnetization was measured after a magnetic field was applied at 300 K and as the sample was cooled at a rate of 3 K/minute from 300 K to 2 K in that magnetic field. Proper centering was ensured by a touchdown of VSM every 10 K or 10 min, whichever was shorter.
The M vs. H measurements were performed by cooling the sample down to a specified temperature without a magnetic field, and a wait time of 2 h at that temperature was added to ensure that the sample has reached thermal equilibrium. The magnetic field was ramped up and down between +9 and −9 Tesla at a rate of 50 Oe/s.
Polypropylene injection molded powder holders specifically made for VSM measurements were used to keep the powder compressed and securely mounted. The powder holders were weighed, emptied, loaded, sealed, and reweighed to obtain the mass of each powder material (sample). The samples were vibrated with the holders parallel to field at a frequency of 40 Hz and within a distance of 2 mm. The powder holders had a small diamagnetic signal, which was measured by running an empty holder in the system using the same measurement settings that all the sample data was collected with. This ensured that the contribution of the holders could be accounted for in all measured data if needed. Below 200 K, the signal from the empty capsule was typically two to three orders of magnitude smaller than the magnetization from the samples (Figure S6).

3. Results and Discussion

3.1. Analysis of Morphology and Composition

The microwave reaction of nickel nitrate, iron sulfate, urea, ethylene glycol and water produce powders with different colors depending on the amount of iron (from light green for Ni1.00Fe0.00 to dark brown for Ni0.00Fe1.00), as shown in Figure S1d. The colors observed for the solutions before and after the microwave reaction are included in the Supplementary Materials (Figure S1 and supporting text). Scanning electron microscopy (SEM) images of unsubstituted Ni(OH)2 (Figure 1a) show ultrathin nanosheets that coalesce into ~2–3 µm sized loosely packed aggregate structures. SEM images (Figure 1b–e) show that as Fe2+ is substituted for Ni2+, the lateral (planar) dimensions of the nanosheets become progressively smaller with Fe substitution. Substitution up to 20% Fe preserves the overall nanosheet morphology, but at 50% Fe substitution (Figure 1e), the nanosheets appear to be interwoven with smaller particles (denoted by red arrows) that may be related to the presence of an additional phase observed by XRD as discussed below. For comparison, a 100% Fe material was synthesized, and the material shows a complete breakdown of the nanosheet morphology and is rather composed of nanoneedles and platelet aggregates (Figure S2).
Energy dispersive X-ray spectroscopy (EDS) elemental mapping of the Fe-substituted nanosheets shows a uniform distribution of Ni and Fe throughout the macrostructure of the nanosheet aggregates (Figure 2), without any Ni or Fe-rich regions detected within our resolution and within the imaging area, which is several times larger than the nanosheet areas. As Ni is substituted for Fe, the Ni integrated signal intensity decreases (EDS mapping shown in Figure 2b,e,h,k) while the Fe signal increases (EDS mapping shown in Figure 2c,f,i,l); EDS spectra showing Ni and Fe peak intensities from mapping analysis of the samples are presented in Figure S3. The relative Ni-to-Fe concentration in the powder is in the range of the solution-phase Ni-to-Fe stoichiometry, but differs slightly (Table 1); variations between synthetic and experimental Ni-to-metal concentrations have been reported in other cation-substituted α-Ni(OH)2 prepared by solution-phase precipitation and are in part attributed to the different reaction kinetics between the metal species [10,11,40].
In addition to Ni and Fe present within the material, EDS analysis shows the N, O, and S signals for the Fe-substituted nanosheet samples (Figure S3). The presence of N and S within the material is attributed to the presence of residuals and derivatives of the reaction precursors (i.e., urea, nitrates, and sulfates), and these species can be directly coordinated to Ni sites or loosely associated with the structure and located in the interlayer region [1,5,11]. Elemental mapping of a 5% Fe substituted material shows a uniform distribution of Ni, Fe, N, O, and S signals throughout the nanosheet structure (Figure S4). With higher Fe substitution, EDS analysis shows the relative at % of N decreases (from precursor nickel nitrate) and the at % of S increases (from precursor iron sulfate) (Table S2), which is in line with the precursor ratios used for the reaction such that higher Fe substitution increases the sulfate:nitrate ratio within the material as expected.

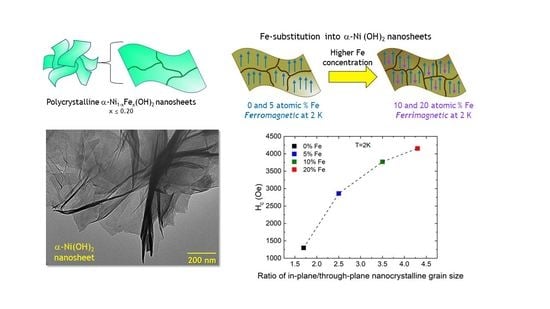
3.2. Effect of Fe Substitution on the Structure of α-Ni(OH)2 Nanosheets

Powder XRD was obtained to characterize the crystal structure and domain sizes of the materials and determine the effect of Fe substitution. The XRD pattern of the Fe-free Ni1.00Fe0.00 material (Figure 3a) corresponds to a hydrated α-phase Ni(OH)2 (ICDD# 022-0444) with three prominent peaks corresponding to the (001), (110), and (300) planes of α-Ni(OH)2 and two minor peaks corresponding to the (002) and (111) planes [41]. Within the crystal structure of α-Ni(OH)2, the (001) diffraction represents nickel hydroxide layers organized along the c-axis of the unit cell perpendicular to the a/b-axes; the (002) planes correspond to half the distance between (001) planes. The prominence of the (001) and (002) peaks suggests that nanocrystals are oriented along the c-axis. The (110) planes are perpendicular to the (001) planes and arise from ordering of nickel and hydroxide atoms within the layers [1].
The experimental XRD patterns were fit to determine crystallographic lattice parameters. α-Ni(OH)2 is a hexagonal crystal structure with trigonal symmetry between the bond angles (α = β = 90°, and γ = 120°). The lattice parameters of the α-phase were determined for the unsubstituted and Fe-substituted samples. The c-lattice parameter determined from XRD analysis for unsubstituted α-Ni(OH)2, Ni1.00Fe0.00, is 7.35 Å, and the a and b parameters are 5.37 Å (a = b within the unit cell) as shown in (Table 1), which are consistent with values reported from Bode et al. for hexagonal α-Ni(OH)2 [41]. Variations between the interlayer d-spacing and the crystallographic constant c are due to the difference in calculating these parameters. The interlayer c-spacing was calculated using the Bragg equation for single point, 2θmax, while the crystallographic constants a, b, and c were determined by fitting experimental data to a known diffraction pattern (ICDD# 022-0444) using a split pseudo Voigt function across all available Bragg-diffraction angles [42]. The a, b, and c-parameters were within experimental accuracy of the analysis for Fe concentrations between 5–20%, indicating that iron incorporation into the α-Ni(OH)2 occurred up to 20%. Fe concentration up to 20% did not distort the native crystal structure beyond the initial changes observed in Ni0.95Fe0.05. The changes in the lattice parameters with Fe substitution up to 20% are consistent with Fe substitution within the nickel hydroxide layers. The ionic radius of a 6-fold coordinated Fe3+ (high spin) is 0.645 Å and is in a similar range as that of Ni2+ (0.69 Å) [43], and different interlayer interactions and structural disorder may also influence electron density and bond distances of atoms within the layers. We note the ionic radius of Fe2+ (high spin) has a larger ionic radius of 0.78 Å.
When the reaction was substituted with 50% Fe in Ni0.50Fe0.50, there are several new diffraction planes that appear at 35.7°, 57.4°, 61.4°, and 63.1° 2θ (Figure 3a), indicating that a second phase in addition to the α-Ni(OH)2 phase is present. Based on the diffraction patterns, the secondary phase in the Ni0.50Fe0.50 materials is attributed to nickel ferrite (NiFe2O4; ICDD# 066-0778); however, further analysis is needed to determine the composition. We focused further analysis on the materials with up to 20% Fe substitution since within these samples the XRD patterns support that Fe is substituted within the α-Ni(OH)2 lattice.
Fe substitution increases the interlayer (001) d-spacing from 7.43 Å in Ni01.0Fe0.00 up to 7.87 Å in Ni0.90Fe0.10 and 7.79 Å in Ni0.80Fe0.20 (Figure 3b, Table 1). The interlayer spacing of α-Ni(OH)2 is affected by the reaction conditions; residual anions and molecules from solution phase reaction that are often incorporated into the structure [5,11]. The increase in the interlayer (001) d-spacing with an increase in Fe substitution is attributed to the increased concentration of SO42− (as supported by EDS analysis discussed above) in the interlayer. The SO42− anion has been shown to increase the interlayer (001) d-spacing of Al-substituted α-Ni(OH)2 relative to samples containing NO3 anions synthesized from either a metal-sulfate or metal-nitrate precursor [44]. In contrast to the (001) diffraction plane, Fe substitution does not affect the d-spacing of the (110) planes to the same extent (Table 1).
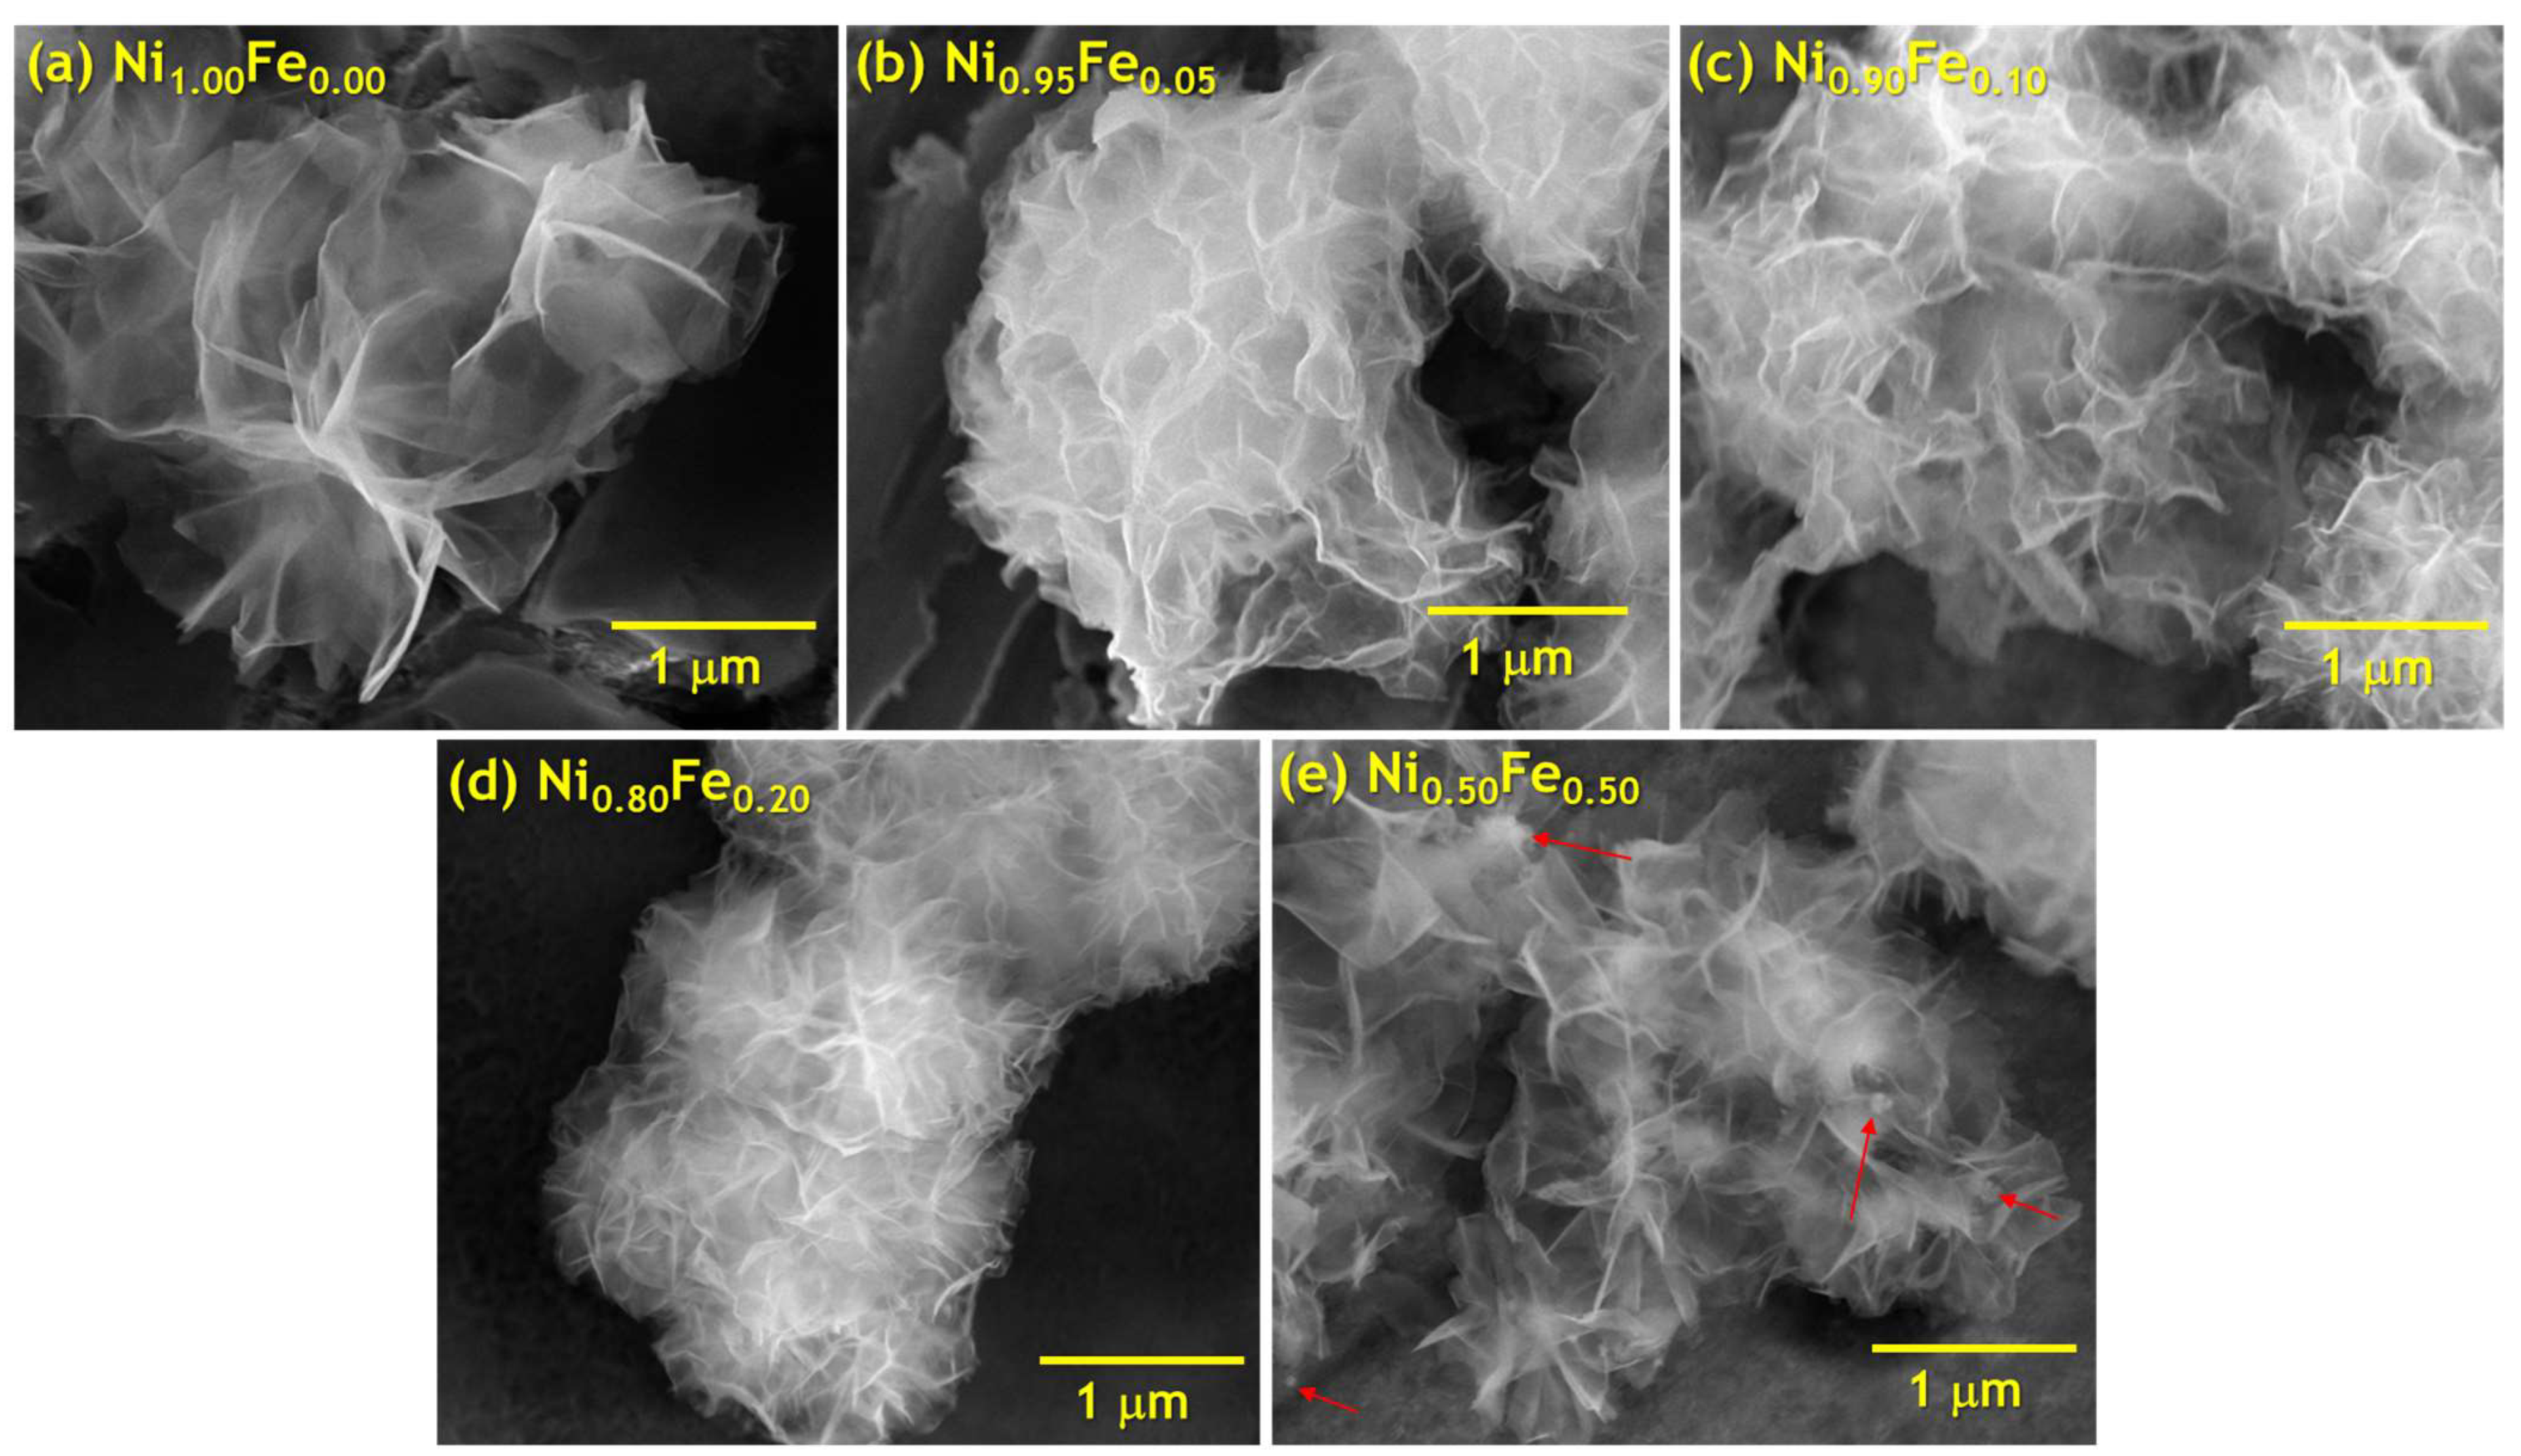
Additionally, the diffraction line profile of (001) reflections becomes broader and asymmetric. The (001) reflections arise only from layers of the structure normal to the c-axis. This lineshape is due to randomization of layers relative to one another along the c-axis. So as the Fe percentage increases, the nanosheets become more disordered and more entangled. This is consistent with the SEM images (Figure 1) which show that not only do the nanosheet lateral dimensions decrease with Fe substitution, but they also become more disordered and “entangled” or more “interconnected”.
In addition to the (001) peak shifts with Fe concentration, the (001) peaks become broader as the Fe concentration increases. From Scherrer analysis of the XRD peak widths, unsubstituted α-Ni(OH)2 exhibits a crystalline size of 14.3 nm for nanocrystal grains within in the (110) planes, notated as Din-plane (in-plane of the nanosheets) and a crystalline size of 8.3 nm for domains defined by (001) planes, notated as Dthrough-plane (though the plane thickness of the nanosheets), as presented in Table 1. The crystallite domain size determined from the (001) planes, Dthrough-plane, corresponds to the thickness of multiple stacked layers in the c-axis direction, and the distance determined from the (110) planes, Din-plane, corresponds to the size of the crystalline domains within the plane of the nanosheets. Fe substitution decreases Dthrough-plane from 8.3 nm for Ni1.00Fe0.00 to 2.3 nm for Ni0.80Fe0.20. Din-plane, the lateral size of the (110)-oriented nanocrystals, initially decreases from 14.3 nm for Ni1.00Fe0.00 to 9.1 nm for Ni0.90Fe0.10 and to 9.9 nm for Ni0.80Fe0.20. Further study is needed to determine the specific reason for smaller (110)-oriented nanocrystals (Din-plane) with Fe substitution; however, we consider that in addition to the effect of Fe the different anion (sulfate) may also influence directional growth.
As the (001) planes are perpendicular to the (110) planes, we calculated the ratio of the (110) to (001)-oriented nanocrystals, R(Din-plane/Dthrough-plane) (Table 1). Note that this ratio of the nanocrystal grain sizes R does not depend on the choice of Scherrer constant. As Fe substitution increases, R(Din-plane/Dthrough-plane) increases from 1.7 to 4.8. The high values of R(Din-plane/Dthrough-plane) indicate distinctly different in-plane and through-plane nanocrystal sizes (shape anisotropy) and are consistent with the morphological structure of the material observed by SEM images (Figure 1) and TEM images discussed below.
We used bright-field transmission electron microscopy (BF-TEM) to probe the structure of unsubstituted α-Ni(OH)2 (Ni1.00Fe0.00) and the 5% Fe-substituted (Ni0.95Fe0.05) materials (Figure 4). The lattice fringes of Ni1.00Fe0.00 (Figure 4c) obtained from the planar edge region of the nanosheet (relative to the electron beam; boxed in red in Figure 4b) show that an individual nanosheet is comprised of multiple nanocrystals (or crystallites) with lattice spacings of 2.69–2.72 Å, consistent with d-spacing of (110) planes of α-Ni(OH)2 (2.68 Å) from XRD analysis (Table 1). The nanosheets observed within the BF-TEM images have different darkness levels, which are influenced by the nanosheet thickness and aggregation. Unsubstituted α-Ni(OH)2 nanosheets synthesized using a similar prep comprise two to three individual Ni(OH)2 octahedra layers with an average thickness of 1.52 nm [45], while Al-substituted Ni(OH)2 nanosheets comprise stacks of 6–40 individual layers [11]. TEM images (Figure 4) show that the Ni1.00Fe0.00 and Ni0.95Fe0.05 are composed of nanosheets with large lateral dimensions which is consistent with XRD analysis that indicates the nanosheets organize and increase in length along the (110) plane relative to the (001) plane. For unsubstituted α-Ni(OH)2 (Ni01.0Fe0.00), the lateral size of the crystallites, Din-plane, (14.3 nm) determined from XRD analysis is 2–3 orders of magnitude smaller than the lateral dimensions of the nanosheets (~1000 nm) observed by electron microscopy; the nanosheets consist of multiple crystallites oriented without a preferred orientation within the nanosheet plate rather than a nanosheet being a single crystal. From the TEM images, as Fe is substituted for Ni, layers become more closely spaced and create more “ridges”. The topography of the 0% Fe sample shown on Figure 4c is a lot flatter than the topography of the 5% Fe sample shown in Figure 4f. These surface features can create local crystal anisotropy and can potentially increase the magnetic energy barriers for spins.

3.3. Magnetic Characterization of Fe-Substituted α-Ni(OH)2 Nanosheets

The temperature dependence of the ZFC and FC magnetization curves for all samples measured with a 100 Oe magnetic field are plotted in Figure 5a and 5b, respectively. Qualitatively, all samples behave similarly. The ZFC magnetization is positive and rises sharply at temperatures below 20 K; it has a maximum at a characteristic temperature, Tmax, and becomes negative as the temperature is lowered (Figure 5a). The FC magnetization increases sharply below 20 K and saturates below 10 K (Figure 5b). The irreversibility between the ZFC and FC measurements of magnetization originates from the interplay between the thermal energy and the energy barrier that hinders relaxation towards of the magnetization equilibrium and has been previously reported for nickel hydroxides [20]. A peak or maximum in the ZFC magnetization is obtained when the measuring magnetic field is lower than the coercive field (Hc) and the coercive field is strongly temperature dependent [46]. As we will show later, the coercivity at 10 K for the 5% and 10% Fe samples is 165 Oe and 164 Oe respectively, while the coercivity for the 0% Fe and 20% Fe is 6 Oe and 100 Oe respectively. So, the coincidence of the ZFC peaks at 10 K for the 5% and 10% Fe samples is directly related to the coincidence of the coercivity values. At temperatures above 20 K, the ZFC and FC magnetization curves coincide for all samples.
The inverse susceptibility ( χ 1 ) plots for all samples calculated from the ZFC magnetization in 100 Oe are shown in Figure 5c. We analyze the inverse susceptibility for a magnetic field of 100 Oe to ensure that there are no artifacts due to magnetic flux trapped in the superconducting magnet or contributions from the capsule above 100 K where the sample magnetization is lower. The ZFC magnetization with the 100 Oe applied field can be considered as the net spontaneous magnetization. It is clear that there are two different kinds of temperature dependence. At high temperatures ,   χ 1 increases linearly with temperature for all samples but is much larger for the 0% and 5% Fe samples (Figure 5c). Below 50 K, we need to examine the χ 1 behavior for each sample separately. The magnetic susceptibility χ = M H of paramagnetic materials follows the Curie–Weiss law χ = C T θ p above a critical temperature Tc. C is the Curie constant and extrapolation of χ   vs. T to a straight line cuts the temperature axis at θ p , the paramagnetic Curie point; θ p > 0 for ferromagnets and θ p < 0 for antiferromagnets or ferrimagnets. Below θ p , there is a long-range spin order even in the absence of an applied field so a spontaneous magnetization appears [47].
Figure 6a shows χ 1 vs. T for the sample with 0% Fe. The curve of χ 1 vs. T is a straight line at high temperatures but becomes concave upward below ~70 K [47]. Linear fits of χ 1 = T C θ p C in the temperature range of 50–250 K give θ p = 30 ± 3   K . Since θ p is positive, this sample becomes ferromagnetic below ~30 K. The behavior of the sample with 5% Fe (Figure 6b) is similar to the 0% Fe, and we extract θ p = 25   K from the high-temperature linear fits. The Curie constant C from the high-temperature fit of the inverse susceptibility is C = 8.65 ± 0.51   ×   10 3   e m u   K g   O e for the Fe 0% sample and C = 9.32 ± 0.05   ×   10 3   e m u   K g   O e for the 5% Fe sample. The uncertainty values in C come from the exact temperature range we use for the linear fit. The Curie constant value that we derive here for the 0% Fe sample is in excellent agreement with the Curie constant previously reported by Rall and Seehra [20].
The behavior of χ 1 with temperature is very different for the samples with 10% and 20% Fe shown in Figure 6c,d, respectively. For temperatures above 125 K, χ 1 varies linearly with temperature according to the Curie–Weiss law. Linear extrapolations (we chose the 125–250 K range for consistency) give θ p = 200   K and θ p = 195   K for the 10% and 20% Fe samples, respectively. Since θ p is negative, they are either antiferromagnets or ferrimagnets. The Curie constant, C, from the high-temperature fit of the inverse susceptibility, is C = 51.9   ×   10 3   e m u   K g   O e for the 10% Fe sample and C = 54.6   ×   10 3   e m u   K g   O e for the 20% Fe sample. Below ~100 K, χ 1 decreases rapidly with temperature and becomes concave downward over a large temperature range; it has a hyperbolic character. The Curie–Weiss law is obeyed only for temperatures well above the critical temperature (above 125 K), as discussed earlier. This χ 1 behavior is in sharp contrast with the ferromagnetic or antiferromagnetic cases, and for a simple crystalline system this behavior of χ 1 is clearly associated with ferrimagnetic ordering, indicating that the 10 and 20% Fe samples are ferrimagnetic [48].
The inverse susceptibility χ 1   intersects the temperature axis at a critical temperature TFN. We determine TFN = 16 K and TFN = 15 K for the 10% and 20% Fe samples, respectively, by a linear fit of χ 1 versus temperatures near the critical point (20–40 K) and finding the temperature for which χ 1 = 0 . In general, a ferrimagnetic system has two or more interacting sublattices, A and B, and the lattice of A ions is spontaneously magnetized in one direction, while the lattice of B ions is magnetized in the opposite or a different direction from the A direction. In contrast to an antiferromagnet, the magnitudes of the A and B sublattice magnetizations in a ferrimagnet are not equal, and a net spontaneous magnetization results. A and B can represent either different atomic species or the same ion types on sites of different symmetry. Although the interaction strengths within each lattice are not equal, both sublattices must have the same Curie temperature according to the Weiss theory of ferrimagnetism. Within this model, the net spontaneous magnetization can be zero at a temperature where the magnetizations of the two lattices are exactly balanced. This temperature is called the compensation point or compensation temperature, To, and represents the temperature at which the opposing sublattice magnetizations are exactly balanced [49]. This behavior is often called “magnetization reversal”. Although competing interactions between sublattices are necessary, they are inadequate by themselves in causing magnetization reversal; without any magnetic anisotropy, the magnetic moments would rotate to align with the magnetic field below the compensation temperature when the magnetization of one of the sublattices becomes dominant. So, in addition to competing interactions such as negative exchange coupling between two or more magnetization lattices or interfacial exchange coupling between FM and AFM lattices, high magnetic anisotropy is essential in observing magnetization reversal [49]. For lower magnetic fields, the Zeeman energy is lower than the anisotropy energy, and the reversal of the net magnetization in the applied field direction will be prohibited by the magnetic anisotropy of the system.
The competing exchange couplings assumed in these samples are related to the substitution of Fe for Ni. The interlayer distance for the samples studied (see Table 1) is constant for the investigated compositional range; the differences in the magnetic behavior can be correlated with variations in the chemical composition. For the two reported ferrimagnetic samples, the relative Ni-to-Fe concentrations in the powder are x = 0.1 and x = 0.2 (Table 1). If we assume that the metal cations are statistically distributed across the layers with this average Ni to Fe ratio (Ni:Fe, 9:1, 8:2), then each Fe3+ ion will be on the average surrounded by six Ni2+ ions (Ni−OH−Fe pairs), whereas each Ni2+ atom will be neighbored by at most one Fe3+ and at least five Ni2+ ions (Ni−OH−Ni and Ni−OH−Fe pairs). So, the competing exchange couplings assumed in these samples must be between Ni−OH−Fe pairs and Ni−OH−Ni pairs.
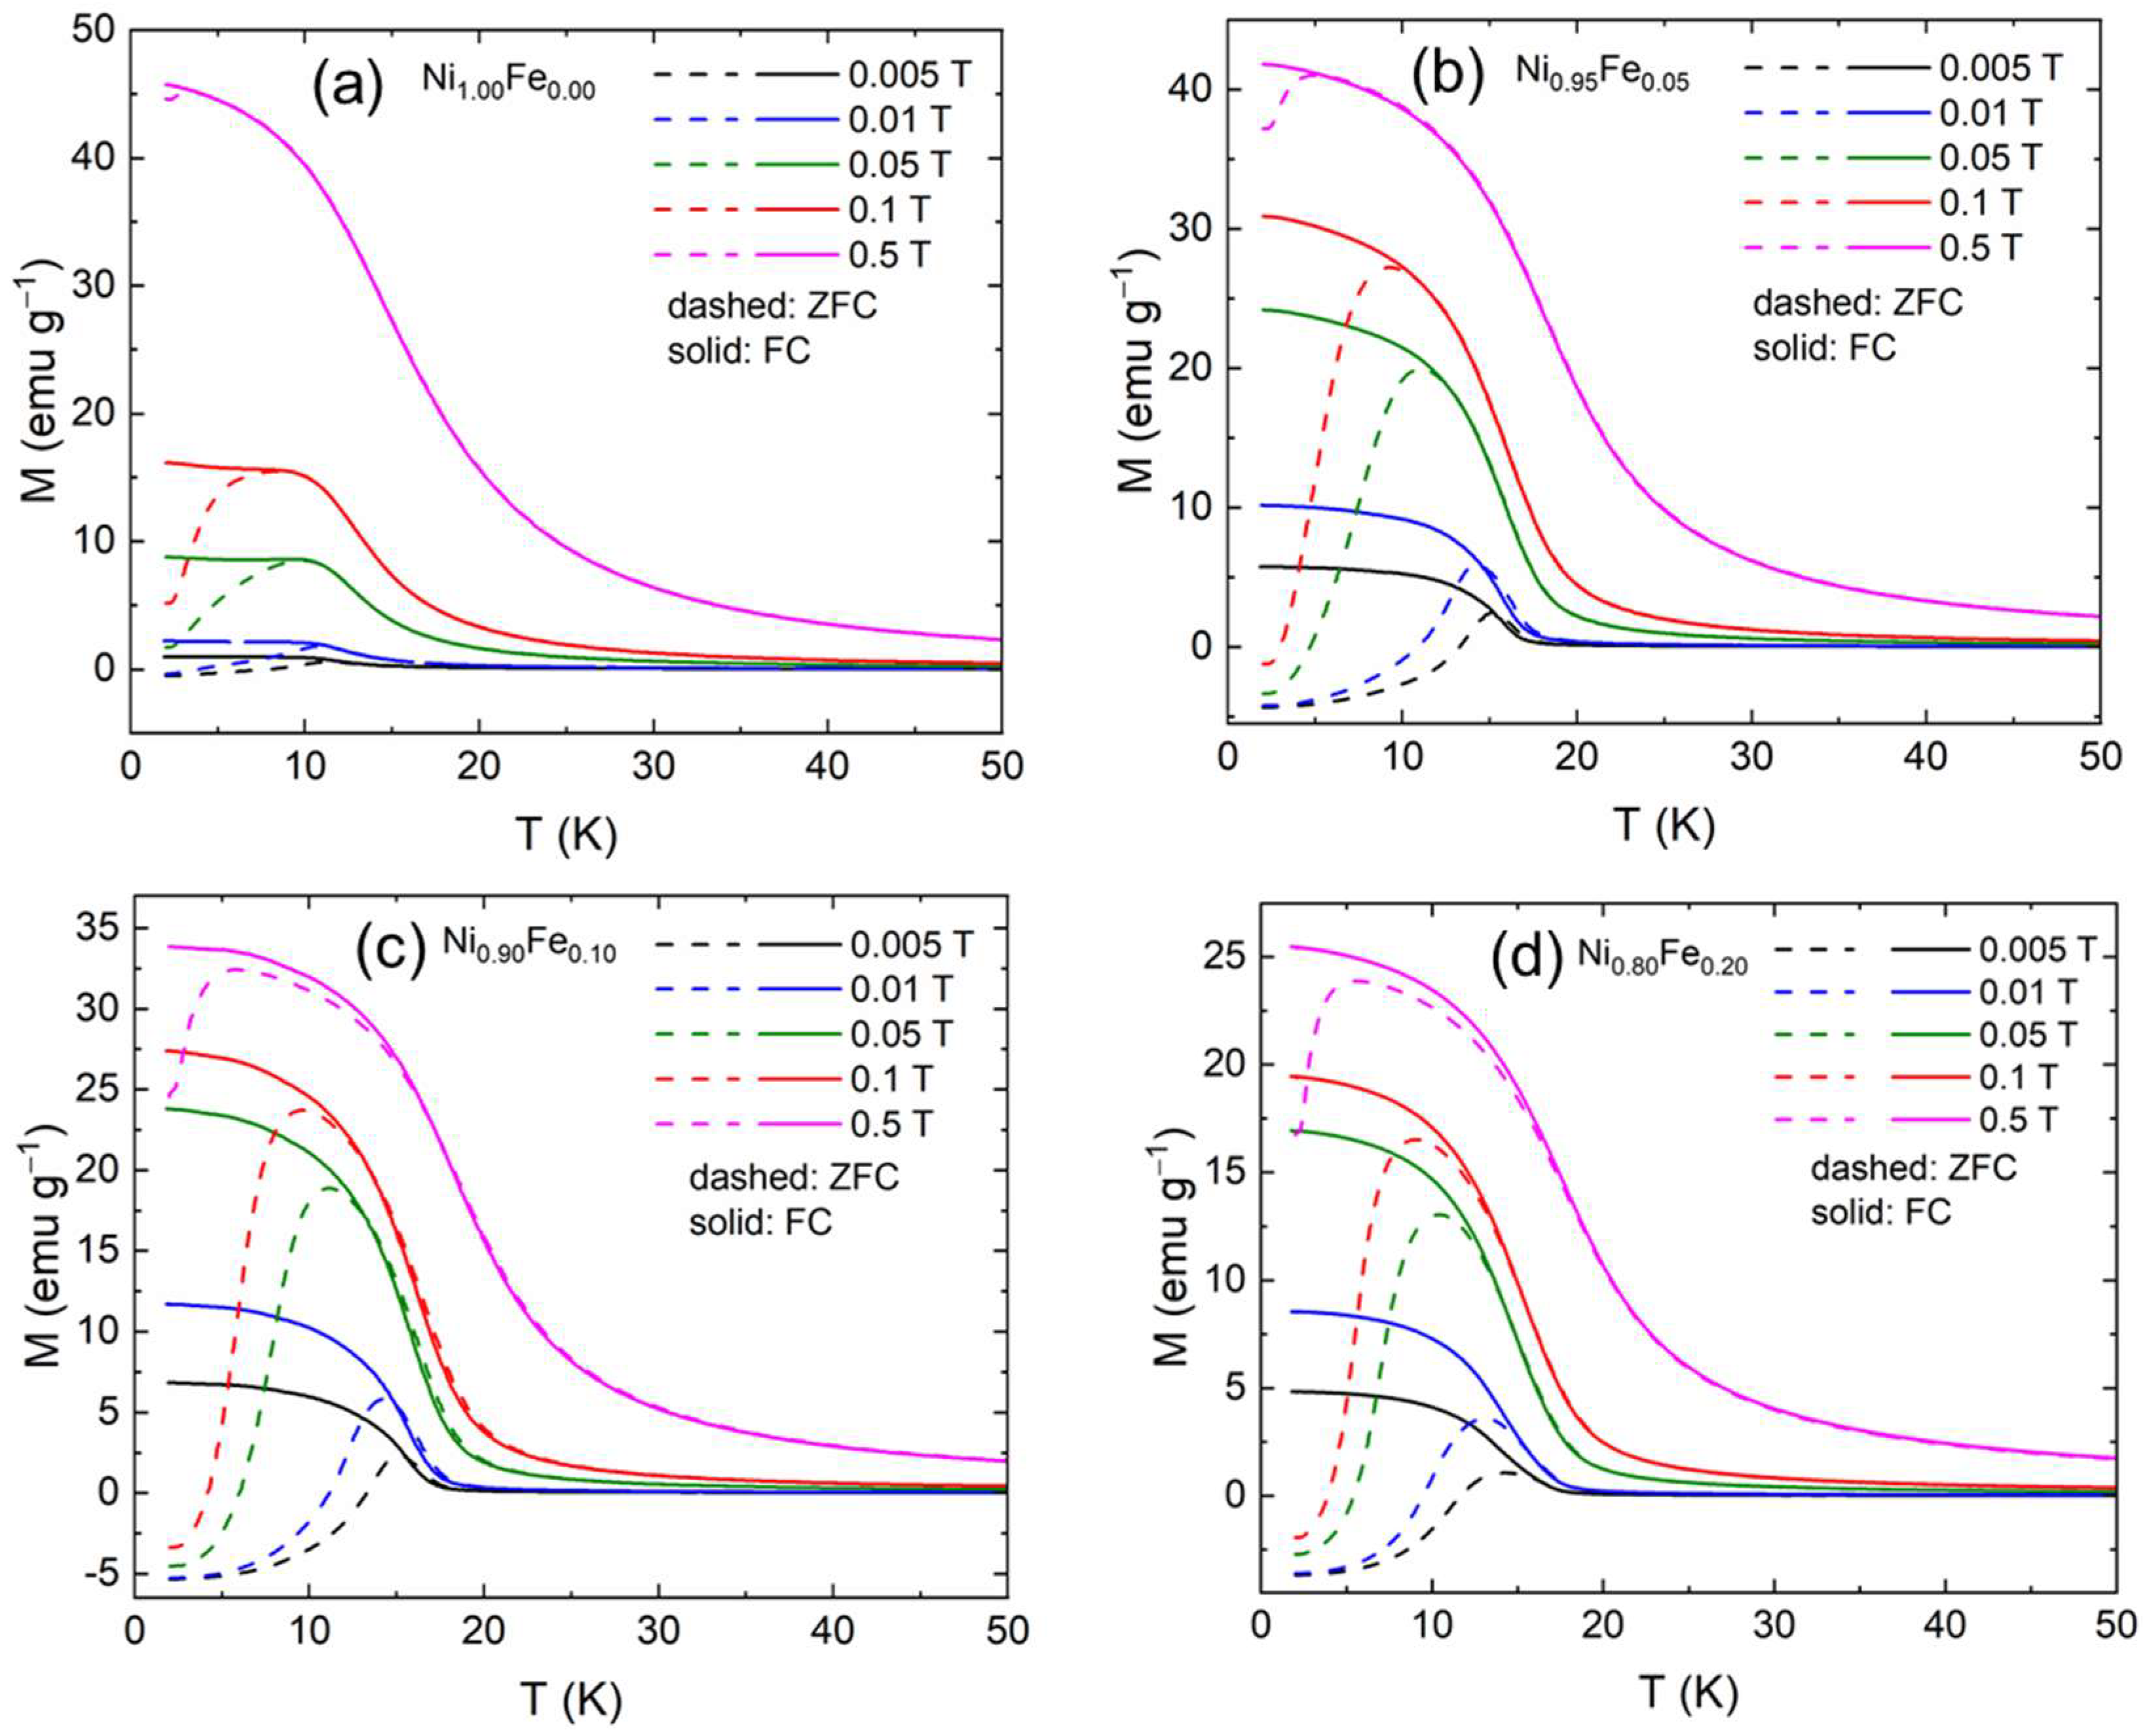
From the analysis of the temperature dependence of the magnetization, we conclude that α-Ni(OH)2 is ferromagnetic and progressively becomes ferrimagnetic as Fe (up to 20%) is substituted for Ni. We further measured the FC and ZFC magnetization under higher applied fields. The FC and ZFC magnetization curves for applied fields of 0.005 T, 0.01 T, 0.05 T, 0.1 T, and 0.5 T are shown in Figure 7. The ZFC magnetization curves measured under high magnetic fields as above do not represent the spontaneous magnetization anymore; they rather represent the ability of the system to respond to an external magnetic field at each temperature. The FC curve now represents the “frozen” total magnetic moment of the system. The FC and ZFC susceptibilities for all samples follow two interesting trends that we describe next.
First, the ZFC and FC curves coincide at high temperatures but separate below an “irreversibility” temperature, Tir, which is dependent on the applied magnetic field. Below Tir, the FC susceptibility increases as the temperature is lowered, has a plateau and saturates. The ZFC susceptibility increases as the temperature is lowered, has a maximum at Tmax and then decreases as the temperature is further lowered. For high (enough) magnetic fields, the FC and ZFC curves coincide. The irreversibility between the ZFC and FC measurements of magnetization originates from the interplay between the thermal energy and an energy barrier that hinders relaxation towards of the magnetization equilibrium and such irreversibility has been previously reported for nickel hydroxides [20]. When a large magnetic field is applied, the FC and ZFC magnetizations can coincide. In that case, the system is in a state where interactions between spins are overpowered by the interaction of the moments with the external magnetic field, and the magnetic moments are oriented along the external magnetic field. The fact that the susceptibility of an antiferromagnet or ferrimagnet below the critical temperature depends on the size of the field used to measure it is due to crystal anisotropy. The second feature of the magnetization behavior as a function of temperature (Figure 7) is that while MFC is always positive, MZFC becomes negative below the compensation temperature, To, which depends on the applied magnetic field.
The compensation temperature is plotted on Figure 8a as a function of the applied magnetic field for all samples. As the magnetic field increases, To is suppressed, and the ZFC magnetization becomes progressively “less negative”. For 0% Fe, an applied magnetic field of just below 200 Oe is sufficient to suppress the negative ZFC magnetization (Figure 8a). For the 5, 10, and 20% Fe, the negative ZFC magnetization is not suppressed at low temperatures even under 1000 Oe, but To decreases as the applied field increases. This is also the case for 10% and 20% Fe. Note that for a 0.5 T magnetic field, the ZFC magnetization does not go through zero anymore for any of the samples suggesting that the antiferromagnetic interactions between sublattices have been suppressed.
The ZFC magnetization at 2K is plotted on Figure 8b as a function of the applied magnetic field. The ZFC Magnetization is negative for all samples for the 50 Oe and 100 Oe applied magnetic fields. The MZFC for the 0% Fe sample that shows ferromagnetic behavior has the smallest magnitude which is very close to zero. In contrast, the value of MZFC for the 5, 10 and 20% Fe samples has a larger magnitude and remains negative for up to a 1000 Oe applied magnetic field. Note that the magnitude of MZFC does not increase as a function of the magnetic field; rather, it is flat and increases sharply when a 5000 Oe magnetic field is applied which points to an intrinsic origin and not external factors such as a demagnetizing field. In our case, the negative magnetization can be understood as magnetic moments being pinned by magnetocrystalline anisotropy due to the multiple crystallographic domains. The pinning energy is higher than the energy imparted by the external magnetic field of 1000 Oe for the samples doped with Fe. Additionally, the MZFC at 5000 Oe is largest for the 0% Fe sample and decreases monotonically with Fe %, which reflects the effect of pinning of the moments; the magnetic anisotropy is smaller for the 0% Fe sample.
Figure 8c shows the temperature at which the ZFC magnetization has a maximum versus the applied magnetic field. As the applied magnetic field increases, the maximum of the ZFC magnetization decreases. In magnetic nanoparticles, the magnetic irreversibility is conventionally associated with the energy required for a particle to reorient its magnetic moment when a magnetic field is applied, overcoming a barrier due to shape, magnetoelasticity or crystalline anisotropy [49]. Irreversibility between FC and ZFC also occurs in ferromagnetic and antiferromagnetic systems below the transition temperature and can originate from the magnetocrystalline anisotropy; it is more prominent in polycrystalline materials [50].
Measurements of the sample magnetization at 2K as a function of the applied magnetic field H (M-H loops) are shown in Figure 9. Hysteresis is observed for all samples. Notably, the initial magnetization at H = 0 is negative for the Fe substituted samples in agreement with the ZFC magnetization behavior discussed earlier (see Figure 7). Measurements of each sample’s magnetization as a function of the applied magnetic field H at 4 K, 8 K, 10 K are shown in the insets of Figure 9. Hysteresis is observed for all samples, and we extract the coercive field (or coercivity) (Hc), remnant magnetization (Mr), and saturation magnetization (Ms). The coercivity at 2 K clearly increases as the Fe content increases. While the M-H loop for 0% Fe shows typical ferromagnetic behavior at 2 K (Figure 9a), the M-H loops for the 5%, 10%, and 20% Fe show some evidence of AF interactions (Figure 9b–d): the loop has a more “square” shape, i.e., the remnant magnetization is close to the saturation magnetization. This also could point to a larger magnetocrystalline anisotropy for the higher Fe %.
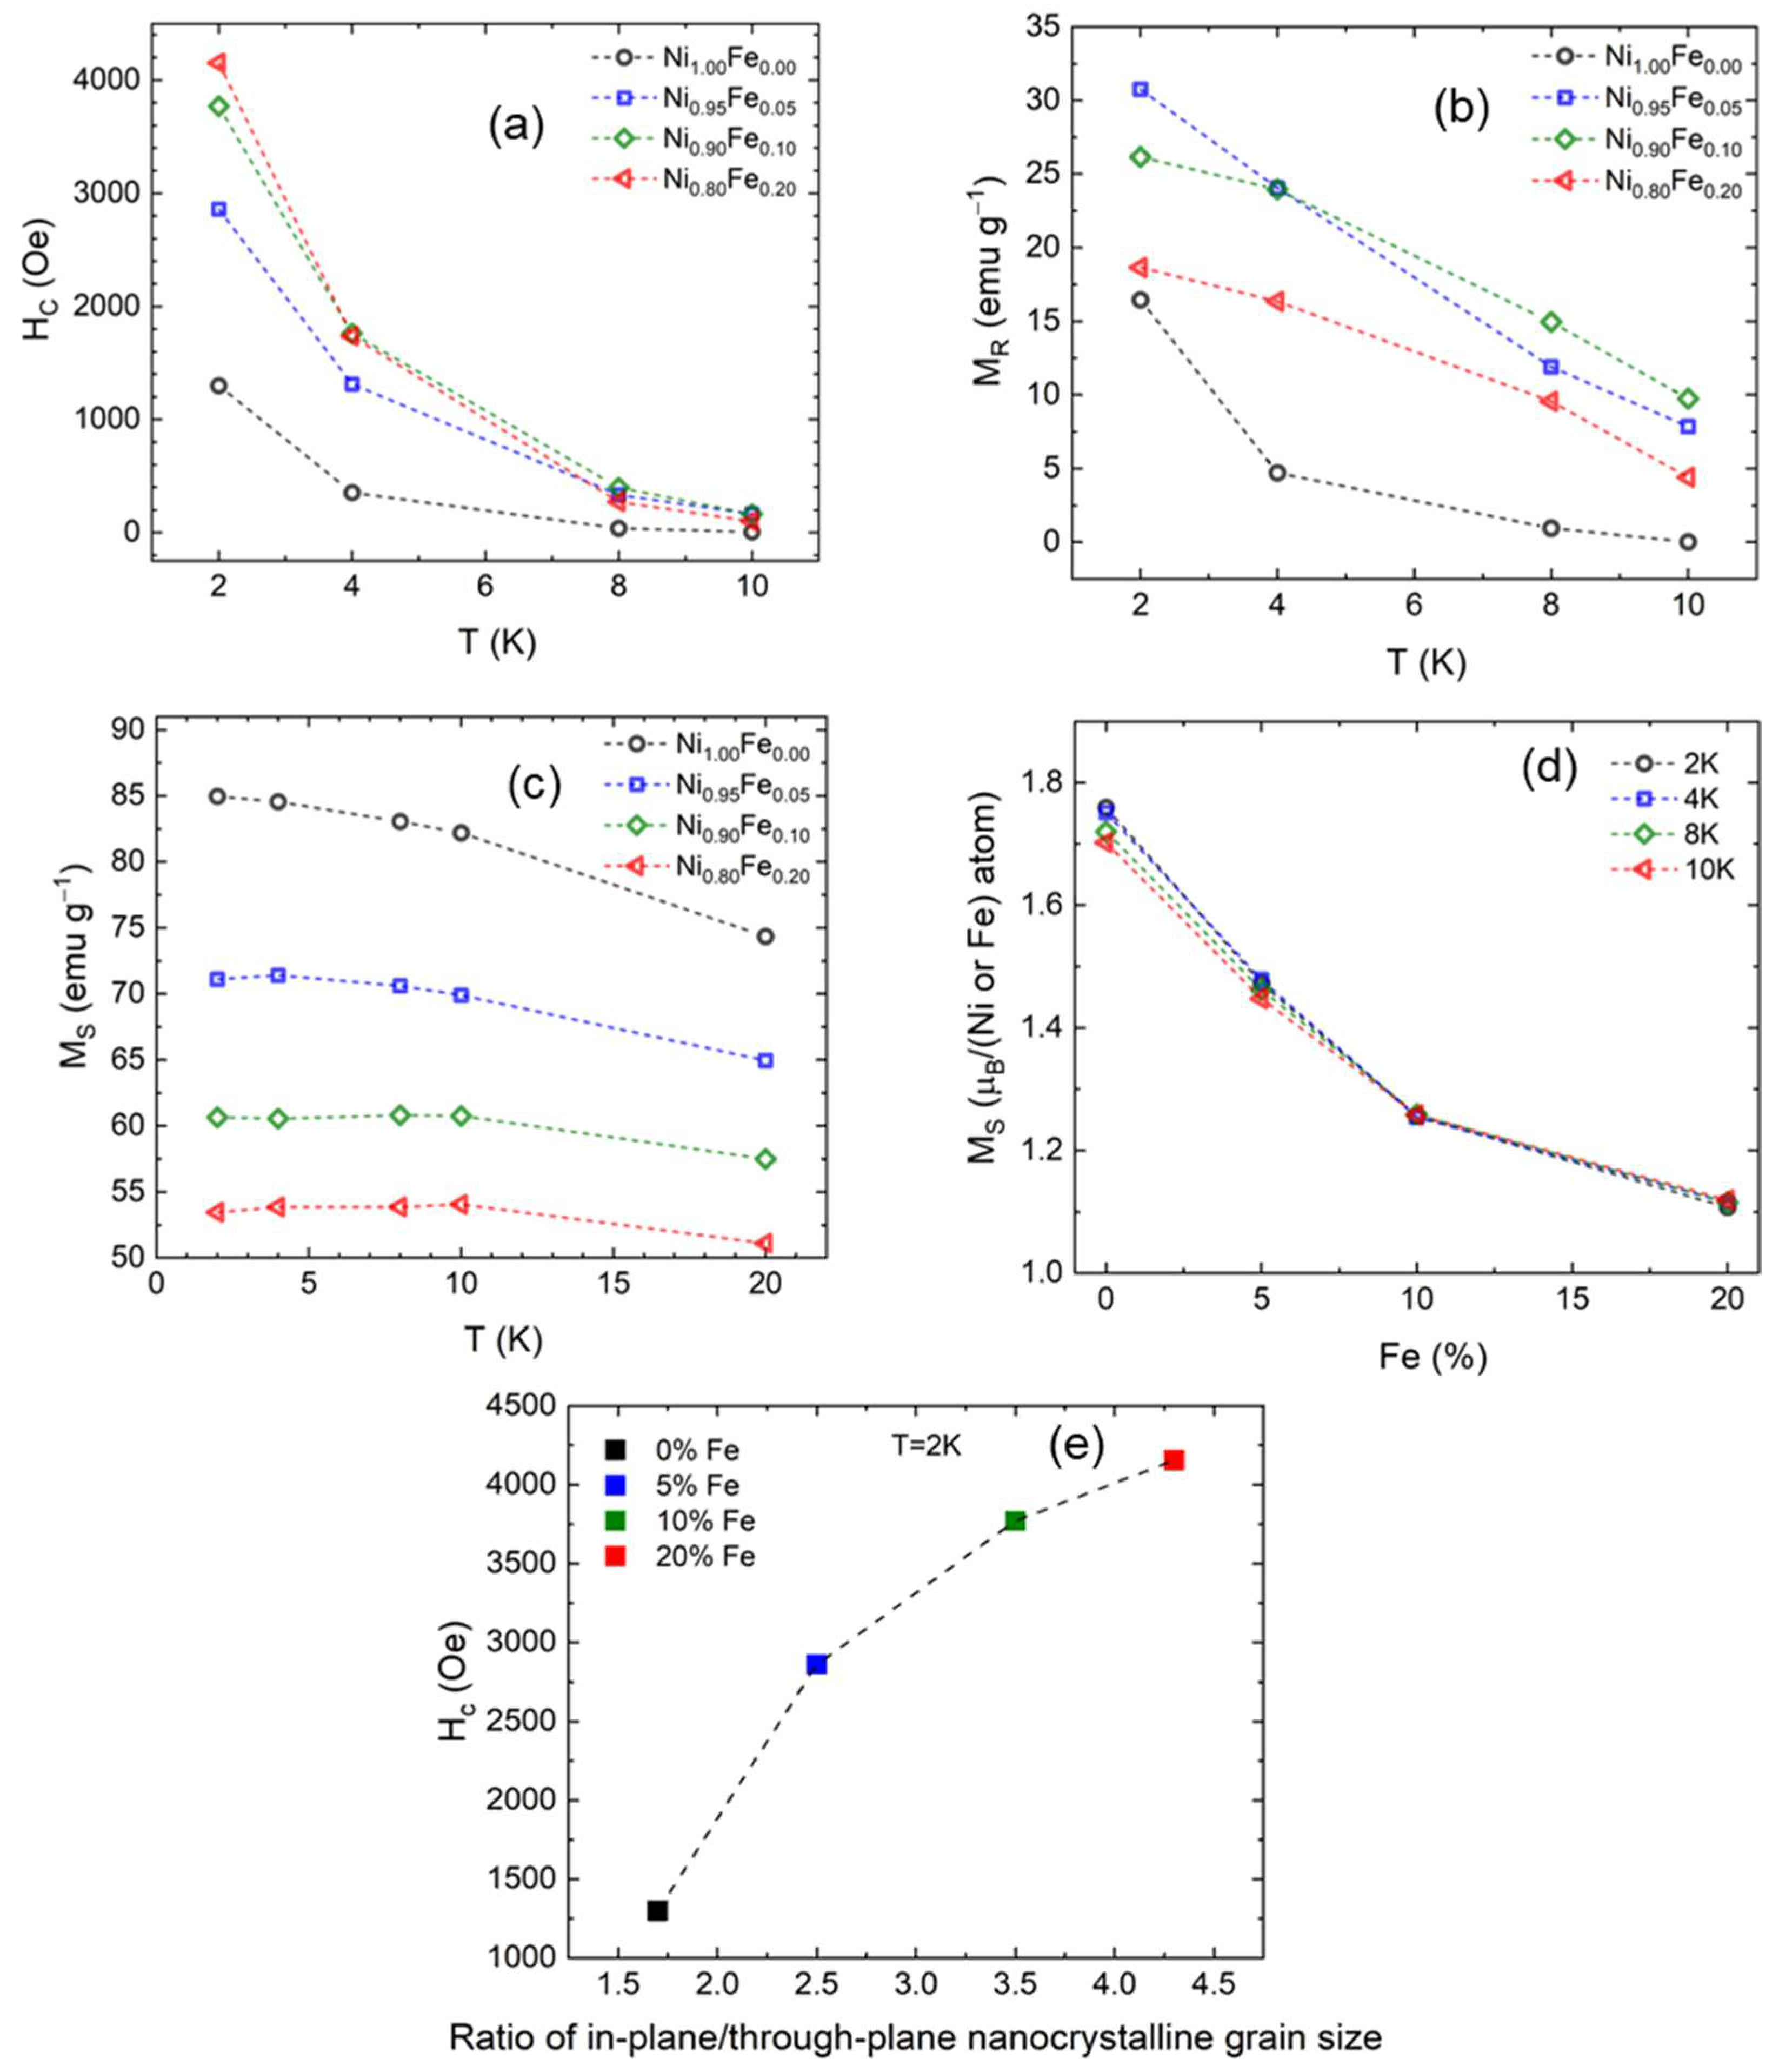
Hc, Mr, and Ms are shown in Figure 10 as a function of temperature. The coercive field (Figure 10a) is highest at 2 K and decreases monotonically as the temperature increases for all samples. At 2 K, the coercivity is also highest for the sample with 20% Fe and lowest for the sample with 0% Fe as noted earlier. This trend is also followed at higher temperatures. This is consistent with the field required to suppress the negative MZFC at 2 K (Figure 8b) and the field required to suppress the ZFC to FC irreversibility being higher as the Fe concentration increases. So, the field required to suppress the difference between the ZFC and FC susceptibilities is related to the magnitude and the temperature variation of the coercivity, HC, which is a measure of the magnetic anisotropy.
Figure 10b shows that at 2K the remnant magnetization is highest for the 5% Fe and 10% Fe samples and lowest for the 0% Fe sample while the remnant magnetization for the 20% Fe sample is lower than the 5% and 10% Fe samples and is closer to the 0% Fe sample. This indicates that the magnetocrystalline anisotropy is stronger for the 5% and 10% Fe samples at 2 K. Finally, the saturation magnetization (taken at 9 T, full data is shown in SI, Figure S7) shown in Figure 10c is also decreasing as temperature decreases but is more sample-dependent than temperature-dependent.
This trend in saturation magnetization is clearer in Figure 10d where we have plotted the saturation magnetization in Bohr magnetons per magnetic atom (Fe or Ni) as a function of the Fe %. The saturation magnetic moment we calculate for α-Ni(OH)2 (0% Fe) is 1.8 μB and is in good agreement with a previous experimental report [20]. The saturation magnetization decreases as Fe is substituted for Ni. This is consistent with the observed ferrimagnetic behavior and indicates that Fe and Ni form two crystal lattices which orient in opposite directions. The saturation magnetization decreases as the Fe concentration increases, which is consistent with the ferrimagnetic behavior of the high Fe concentration samples. The reduction in Ms can be explained by the presence of competing interaction between lattices and possibly the presence of a non-collinear spin structure below the critical temperature. The non-colinear spin structure is also apparent on the full H-range M vs. H loops (Figure S7).
In the paramagnetic region, we can calculate the effective magnetization from the Curie constant C = N A μ e f f 2 3 k B where N A is Avogadro’s number, k B is Boltzmann constant and μ e f f is the effective paramagnetic magnetic moment [47]. The effective magnetic moment for 0% Fe is 2.9 µB which corresponds exactly to a high–spin state, S, for Ni2+ (S = 1). The calculated effective moment for S = 1 and spectroscopic splitting factor g = 2 is 2.83 µB. This value is also in agreement with previous reports for α-Ni(OH)2 [20]. The effective magnetic moment only slightly increases from 2.9 µB for 0% Fe to 3 µB for 5% Fe. The magnetization for the 10 and 20% Fe samples are 7.1 µB and 7.3 µB, respectively (Table 2). A substantial shift to higher effective magnetic moments occurs between 5 and 10% Fe, indicating that the effect of Fe substitution on the effective magnetic moment is not linear with % Fe. The effective magnetic moment is related to the spin and the spectroscopic splitting factor via the equation μ e f f   =   g [ S ( S + 1 ) ] 1 2 [47]. The effective paramagnetic magnetic moment in the 10 and 20% Fe samples corresponds to spin S = 5/2, in line with the presence of high-spin Fe3+ and perhaps an orbital contribution.
From our data and analysis, Fe substitution has a clear effect on the magnetization of α-Ni(OH)2, and a summary of relevant magnetic parameters and ordering for the samples with different % Fe (up to 20%) is presented in Table 2. The ferromagnetic behavior of α-Ni(OH)2 and 5% Fe observed from our study is consistent with a prior study of α-Ni(OH)2 [20]. Compared to 5% Fe substitution, substitution at 10 and 20% Fe results in ferrimagnetism (rather than ferromagnetism), higher paramagnetic effective moments, and higher coercivity values. From our structural analysis, 10 and 20% Fe result in higher values of R(Din-plane/Dthrough-plane). The correlation between coercivity and R(Din-plane/Dthrough-plane) shown in Figure 10e indicates that a higher ratio of in-plane/through-plane nanocrystalline grain size results in higher coercivity which is consistent with higher Fe % increasing the pinning of moments within the nanocrystallites. From prior studies of Ni(OH)2 and related systems, the magnetism is affected by intraplanar exchange, interlayer exchange, and dipole interactions from interacting ligands [20,21,51]. Morphology has also been shown to influence the magnetization of layered hydroxides [18]. The oxidation state of Fe affects magnetization. In an aqueous solution, Fe2+ can oxidize to Fe3+ by reacting with dissolved O2 [52], the oxidation state of the Fe incorporated into the γ-NiFeOOH lattice (oxidized form of α-Ni(OH)2) can also vary depending on the Ni:Fe substitution ratio [26].
All the layered hydroxides of Ni obtained by intercalating different ligands order ferromagnetically with TC around 16–18 K, even though there are large variations in the interplanar spacings. The appearance of ferromagnetism in α-Ni(OH)2 as compared to the antiferromagnetism observed in β-Ni(OH)2 has been attributed to the increase in the distance between Ni2+ ions in adjacent nanosheets [53]. In Ni-Fe-layered double hydroxides, the ferromagnetic critical temperature decreases with increasing interlayer separation [54]. In our system, the transition from a ferromagnet to a ferrimagnet occurs by adding only 10% of Fe to the material. Such a dramatic change in the magnetic properties could be related to the low–dimensionality in the system, i.e., the effect of the surfaces and interfaces is stronger. A prior study of nickel iron hydroxides with 10 and 20% Fe substitution [34] did not find ferrimagnetism and strong deviation from Curie–Weiss-type behavior at low temperatures as we observe within our 10 and 20% Fe materials. We note that this prior study used different precursors and synthetic conditions (coprecipitation under basic conditions) compared to that used within our study. The comparison of our result with this prior study shows that different magnetization occurs with the same Ni:Fe substitution ratios which demonstrates that structure and morphology play a critical role in the magnetization of nanostructured materials.
The sample with 50% Fe shows clearly different magnetization compared with the 0, 5, 10 and 20% Fe samples. The magnetic behavior of the sample with 50% Fe is shown in Figure S8. The ZFC and FC magnetizations under 50 and 100 Oe magnetic fields do not overlap even at room temperature anymore, which indicates that the critical temperature for this sample is above room temperature. The different magnetic behavior of the material with 50% Fe compared to the materials with lower % Fe is attributed to the presence of nickel ferrite within the material as determined from XRD discussed earlier.

4. Conclusions

Fe-substituted nickel hydroxide nanosheets were synthesized using a rapid microwave-assisted hydrothermal method. Fe substitution results in changes in the structure and magnetization. The samples are composed of nanosheets that are aggregated into micron-sized flower-like superstructures. With up to 20 at % Fe substitution, X-ray diffraction analysis supports that Fe is incorporated within the metal hydroxide layers as a substituent; however, at a higher Fe substitution ratio of 50 at %, an additional phase consistent with nickel ferrite is observed. For Fe substitution up to 20 at %, the interlayer spacing is increased by Fe substitution, which is attributed to differences in composition of the interlayer region. The nanosheets have highly different crystallographic textures and in-plane to out-of-plane crystallite domain size ratios, which are influenced by Fe substitution.
Temperature and field-dependent magnetization measurements show unique behavior as Fe is substituted for Ni; the material transitions from being initially ferromagnetic to progressively becoming ferrimagnetic. Unsubstituted a-Ni(OH)2 and 5%-substituted Fe are ferromagnetic below ~25–30 K; however, the 10 and 20% Fe-substituted samples exhibit ferrimagnetic ordering which indicates interacting sublattices or domains. Fe substitution affects the value of the compensation point, below which the zero-field cooled susceptibilities become negative. The compensation point decreases monotonically with % Fe which reflects the effect of the ferrimagnetic behavior. The field-dependence of the compensation point shows a unique magnetization reversal with % Fe. The field-dependent and temperature-dependance of the compensation point with Fe substitution supports high magnetic anisotropy and negative exchange coupling between two or more magnetization lattices or interfacial exchange coupling between ferromagnetic and antiferromagnetic lattices. Magnetization measurements support that the spins of unpaired electrons tend to be “pinned” along their preferred axis of magnetocrystalline anisotropy. Substitution at 10 and 20% Fe results in higher effective magnetic moments and higher coercivity values compared to 5% Fe substitution.
The correlation between higher coercivity and larger nanocrystalline size anisotropy with higher Fe % supports that shape anisotropy contributes to the observed ferrimagnetism with the 10 and 20% Fe materials. The observed magnetic anisotropy occurs despite a random distribution of particles with the powder. The crystals have a preferred orientation, and therefore, the polycrystalline powder itself has an anisotropy dictated by the weighted average of the individual crystals. Our study furthers understanding of how substituents within nanomaterials affect shape and magnetic anisotropy and can lead to new approaches to influence electron interactions in two-dimensional and layered materials which have important implications for battery, catalysis, electronic, gas sensing and spintronics applications.

Supplementary Materials

The following supporting information can be downloaded at: https://www.mdpi.com/article/10.3390/magnetochemistry9010025/s1, Table S1: Mass and volume of chemical precursors used for the microwave synthesis of Ni(OH)2 and Fe-substituted Ni(OH)2 nanosheets; Figure S1: Photographs of the microwave synthesized iron-substituted nanosheet powders (a) before and (b) after the microwave reaction, (c) after washing and centrifugation, and (d) after drying; Figure S2: Scanning electron micrographs of 100% iron microwave synthesized material; Figure S3: Energy dispersive X-ray spectra of (a) Ni0.95Fe0.05, (b) Ni0.90Fe0.010, (c) Ni0.80Fe0.020, and (d) Ni0.50Fe0.50; Table S2: Average atomic % of elements determined by energy dispersive X-ray spectra; Figure S4: SEM image (a) and elemental mapping of Ni, Fe, O, N, and S (b–f) of 5% Fe-substituted Ni(OH)2 nanosheets (Ni0.95Fe0.05); Figure S5: Comparison of the relative Fe-to-Ni concentration between two batches of material. Figure S6: Magnetization versus magnetic field at 2 K, 4 K, and 8 K of an empty powder holder. Figure S7: M vs. H loops in the full range of the magnetic fields. Figure S8: (a) FC and ZFC Magnetization, (b) M-H loop at 2 K, and (c)M-H loops at 4 K, 8 K, 10 K for 50% Fe (Ni0.50Fe0.50).

Author Contributions

C.P.R., N.T. and W.J.G. designed and supervised the experiments. S.W.K. synthesized and characterized the series by SEM, TEM, XRD, and VSM. B.D.K. performed VSM characterization and analysis. B.G. synthesized the characterized the series by XRD. S.W.K. and B.D.K. wrote the first draft of the manuscript. N.T. and B.D.K. performed the magnetization analysis and calculations and drafted the magnetic characterization section. All authors contributed to the manuscript. All authors have read and agreed to the published version of the manuscript.

Funding

S.W.K. and C.P.R. acknowledge support of this research from the Office of Naval Research (award no. N00014-21-1-2072) for synthesis and structural characterization. C.P.R., B.G., B.D.K. and N.T. acknowledge support from NSF Partnerships for Research and Education in Materials (PREM) Center for Intelligent Materials Assembly (CIMA), Award No. 2122041, for X-ray diffraction and magnetization analysis. This work was also supported in part by the NSF Career Award DMR #1255629 and Department of Defense grant 78810-W911NF-21-1-0253.

Institutional Review Board Statement

Not applicable.

Informed Consent Statement

Not applicable.

Data Availability Statement

Not applicable.

Conflicts of Interest

The authors declare no conflict of interest.

References

  1. Hall, D.S.; Lockwood, D.J.; Bock, C.; MacDougall, B.R. Nickel Hydroxides and Related Materials: A Review of Their Structures, Synthesis and Properties. Proc. R. Soc. A 2015, 471, 1–65. [Google Scholar] [CrossRef]
  2. Miao, Y.; Ouyang, L.; Zhou, S.; Xu, L.; Yang, Z.; Xiao, M.; Ouyang, R. Electrocatalysis and Electroanalysis of Nickel, Its Oxides, Hydroxides and Oxyhydroxides toward Small Molecules. Biosens. Bioelectron. 2014, 53, 428–439. [Google Scholar] [CrossRef] [PubMed]
  3. Liu, B.; Liu, X.; Fan, X.; Ding, J.; Hu, W.; Zhong, C. 120 years of Nickel-Based Cathodes for Alkaline Batteries. J. Alloys Compd. 2020, 834, 1–11. [Google Scholar] [CrossRef]
  4. Machado, F.L.A.; Ribeiro, P.R.T.; Holanda, J.; Rodriguez-Suarez, R.L.; Azevedo, A.; Rezende, S.M. Spin-Flop Transition in the Easy-Plane Antiferromagnet Nickel Oxide. Phys. Rev. B. 2017, 95, 1–10. [Google Scholar] [CrossRef]
  5. Hall, D.S.; Lockwood, D.J.; Poirier, S.; Bock, C.; MacDougall, B.R. Raman and Infrared Spectroscopy of Alpha and Beta Phases of Thin Nickel Hydroxide Films Electrochemically Formed on Nickel. J. Phys. Chem. A 2012, 116, 6771–6784. [Google Scholar] [CrossRef] [Green Version]
  6. Corrigan, D.A.; Knight, S.L. Electrochemical and Spectroscopic Evidence on the Participation of Quadrivalent Nickel in the Nickel Hydroxide Redox Reaction. J. Electrochem. Soc. 1989, 136, 613–619. [Google Scholar] [CrossRef]
  7. O’Grady, W.E.; Pandya, K.I.; Swider, K.E.; Corrigan, D.A. In Situ X-Ray Absorption near-Edge Structure Evidence for Quadrivalent Nickel in Nickel Battery Electrodes. J. Electrochem. Soc. 1996, 143, 1613–1616. [Google Scholar] [CrossRef]
  8. Young, K.H.; Wang, L.; Yan, S.; Liao, X.; Meng, T.; Shen, H.; Mays, W. Fabrications of High-Capacity a-Ni(OH)2. Batteries 2017, 3, 6. [Google Scholar] [CrossRef]
  9. Corrigan, D.A.; Bendert, R.M. Effect of Coprecipitated Metal Ions on the Electrochemistry of Nickel Hydroxide Thin Films: Cyclic Voltammetry in 1 M Koh. J. Electrochem. Soc. 1989, 136, 723–728. [Google Scholar] [CrossRef]
  10. Bardé, F.; Palacín, M.R.; Beaudoin, B.; Christian, P.A.; Tarascon, J.M. Cationic Substitution in g-Type Nickel (Oxi)Hydroxides as a Means to Prevent Self-Discharge in Ni/Zn Primary Batteries. J. Power Sources 2006, 160, 733–743. [Google Scholar] [CrossRef]
  11. Kimmel, S.W.; Hopkins, B.J.; Chervin, C.N.; Skeele, N.L.; Ko, J.S.; DeBlock, R.H.; Long, J.W.; Parker, J.F.; Hudak, B.M.; Stroud, R.M.; et al. Capacity and Phase Stability of Metal-Substituted a-Ni(OH)2 Nanosheets in Aqueous Ni–Zn Batteries. Mater. Adv. 2021, 2, 3060–3074. [Google Scholar]
  12. Yan, K.; Sheng, M.; Sun, X.; Song, C.; Cao, Z.; Sun, Y. Microwave Synthesis of Ultrathin Nickel Hydroxide Nanosheets with Iron Incorporation for Electrocatalytic Water Oxidation. ACS Appl. Energy Mater. 2019, 2, 1961–1968. [Google Scholar] [CrossRef]
  13. Trotochaud, L.; Young, S.L.; Ranney, J.K.; Boettcher, S.W. Nickel-Iron Oxyhydroxide Oxygen-Evolution Electrocatalysts: The Role of Intentional and Incidental Iron Incorporation. J. Am. Chem. Soc. 2014, 136, 6744–6753. [Google Scholar] [CrossRef]
  14. Luan, C.; Liu, G.; Liu, Y.; Yu, L.; Wang, Y.; Xiao, Y.; Qiao, H.; Dai, X.; Zhang, X. Structure Effects of 2D Materials on Alpha-Nickel Hydroxide for Oxygen Evolution Reaction. ACS Nano 2018, 12, 3875–3885. [Google Scholar] [CrossRef] [PubMed]
  15. Hunter, B.M.; Hieringer, W.; Winkler, J.R.; Gray, H.B.; Müller, A.M. Effect of Interlayer Anions on [NiFe]-LDH Nanosheet Water Oxidation Activity. Energy Environ. Sci. 2016, 9, 1734–1743. [Google Scholar] [CrossRef] [Green Version]
  16. Zhou, D.; Cai, Z.; Bi, Y.; Tian, W.; Luo, M.; Zhang, Q.; Zhang, Q.; Xie, Q.; Wang, J.; Li, Y.; et al. Effects of Redox-Active Interlayer Anions on the Oxygen Evolution Reactivity of Nife-Layered Double Hydroxide Nanosheets. Nano Res. 2018, 11, 1358–1368. [Google Scholar] [CrossRef]
  17. Gajbhiye, N.S. Trends in Research on Nanostructured Magnetic Materials. Met. Mater. Proc. 1998, 10, 247–264. [Google Scholar]
  18. Carrasco, J.A.; Abellán, G.; Coronado, E. Influence of Morphology in the Magnetic Properties of Layered Double Hydroxides. J. Mater. Chem. C 2018, 6, 1187–1198. [Google Scholar] [CrossRef]
  19. Rall, J.D.; Seehra, M.S.; Choi, E.S. Metamagnetism and Nanosize Effects in the Magnetic Properties of the Quasi-Two-Dimensional System b-Ni(OH)2. Phys. Rev. B. 2010, 82, 1–10. [Google Scholar] [CrossRef]
  20. Rall, J.D.; Seehra, M.S. The Nature of the Magnetism in Quasi-2D Layered a-Ni(OH)2. J. Condens. Matter Phys. 2012, 27, 1–8. [Google Scholar] [CrossRef]
  21. Rall, J.D.; Seehra, M.S.; Shah, N.; Huffman, G.P. Comparison of the Nature of Magnetism in Alpha and Beta Nickel Hydroxide. J. Appl. Phys. 2010, 107, 1–2. [Google Scholar]
  22. Zhang, C.; Tsuboi, T.; Namba, H.; Einaga, Y.; Yamamoto, T. Enhancement of the Coercivity in Co-Ni Layered Double Hydroxides by Increasing Basal Spacing. Dalton Trans. 2016, 45, 13324–13331. [Google Scholar] [CrossRef]
  23. Coronado, E.; Galén-Mascarós, J.R.; Martí-Gastaldo, C.; Ribera, A.; Palacios, E.; Castro, M.; Burriel, R. Spontaneous Magnetization in Ni-Al and Ni-Fe Layered Double Hydroxides. Inorg. Chem. 2008, 47, 9103–9110. [Google Scholar] [CrossRef] [PubMed]
  24. Maaz, K.; Karim, S.; Mumtaz, A.; Hasanain, S.K.; Liu, J.; Duan, J.L. Synthesis and Magnetic Characterization of Nickel Ferrite Nanoparticles Prepared by Co-Precipitation Route. J. Magn. Magn. Mater. 2009, 321, 1838–1842. [Google Scholar] [CrossRef]
  25. Long, J.W.; Logan, M.S.; Rhodes, C.P.; Carpenter, E.; Stroud, R.M.; Rolison, D.R. Nanocrystalline Iron Oxide Aerogels as Mesoporous, Magnetic Architectures. J. Am. Chem. Soc. 2004, 126, 16879–16889. [Google Scholar] [CrossRef]
  26. Demourgues-Guerlou, L.; Fournes, L.; Delmas, C. On the Iron Oxidation State in the Iron-Substituted Gamma-Nickel Oxyhydroxides. J. Solid State Chem. 1995, 114, 6–14. [Google Scholar] [CrossRef]
  27. Taibi, M.; Ammar, S.; Jouini, N.; Fiévet, F.; Molinié, P.; Drillon, M. Layered Nickel Hydroxide Salts: Synthesis, Characterization and Magnetic Behaviour in Relation to the Basal Spacing. J. Mater. Chem. 2002, 12, 3238–3244. [Google Scholar] [CrossRef]
  28. Rabu, P.; Delahaye, E.; Rogez, G. Hybrid Interfaces in Layered Hydroxides: Magnetic and Multifunctional Superstructures by Design. Nanotechnol. Rev. 2015, 4, 557–580. [Google Scholar] [CrossRef]
  29. Herval, L.K.S.; von Dreifus, D.; Rabelo, A.C.; Rodrigues, A.D.; Pereira, E.C.; Gobato, Y.G.; de Oliveira, A.J.A.; de Godoy, M.P.F. The Role of Defects on the Structural and Magnetic Properties of Nb2O5. J. Alloys Compd. 2015, 653, 358–362. [Google Scholar] [CrossRef]
  30. Zakutna, D.; Niznansky, D.; Barnsley, L.C.; Babcock, E.; Salhi, Z.; Feoktystov, A.; Honecker, D.; Disch, S. Field Dependence of Magnetic Disorder in Nanoparticles. Phys. Rev. X 2020, 10, 10–17. [Google Scholar]
  31. Swider-Lyons, K.E.; Bussmann, K.M. Correlation of the Charge Storage and Magnetic Susceptibility of Hydrous RuO2. In Proceedings of the Symposium on Solid State Ionics, Boston, MA, USA, 29 November–2 December 2004; pp. 51–56. [Google Scholar]
  32. Li, Q.; Li, H.S.; Xia, Q.T.; Hu, Z.Q.; Zhu, Y.; Yan, S.S.; Ge, C.; Zhang, Q.H.; Wang, X.X.; Shang, X.T.; et al. Extra Storage Capacity in Transition Metal Oxide Lithium-Ion Batteries Revealed by in Situ Magnetometry. Nat. Mater. 2021, 20, 76–83. [Google Scholar] [CrossRef]
  33. Hauser, A. Ligand Field Theoretical Considerations. In Spin Crossover in Transition Metal Compounds I; Gutlich, P., Goodwin, H.A., Eds.; Topics in Current Chemistry-Series; Springer: Berlin, Germany, 2004; Volume 233, pp. 49–58. [Google Scholar]
  34. Demourgues-Guerlou, L.; Delmas, C. Structure and Properties of Precipitated Nickel-Iron Hydroxides. J. Power Sources 1993, 45, 281–289. [Google Scholar] [CrossRef]
  35. Guerloudemourgues, L.; Denage, C.; Delmas, C. New Manganese-Substituted Nickel Hydroxides: Crystal-Chemistry and Physical Characterization. J. Power Sources 1994, 52, 269–274. [Google Scholar] [CrossRef]
  36. Kumari, S.; Pradhan, D.K.; Pradhan, N.R.; Rack, P.D. Recent Developments on 2D Magnetic Materials: Challenges and Opportunities. Emerg. Mater. Res. 2021, 4, 827–846. [Google Scholar] [CrossRef]
  37. Chen, P.; Xu, K.; Li, X.; Guo, Y.; Zhou, D.; Zhao, J.; Wu, X.; Wu, C.; Xie, Y. Ultrathin Nanosheets of Feroxyhyte: A New Two-Dimensional Material with Robust Ferromagnetic Behavior. Chem. Sci. 2014, 5, 2251–2255. [Google Scholar] [CrossRef]
  38. Birkholz, M.; Fewster, P.F.; Genzel, C. Thin Film Analysis by X-ray Scattering; Wiley-VCH: Weinheim, Germany, 2006. [Google Scholar]
  39. Lim, D.J.; Marks, N.A.; Rowles, M.R. Universal Scherrer Equation for Graphene Fragments. Carbon 2020, 162, 475–480. [Google Scholar] [CrossRef]
  40. Cochran, E.A.; Woods, K.N.; Johnson, D.W.; Page, C.J.; Boettcher, S.W. Unique Chemistries of Metal-Nitrate Precursors to Form Metal-Oxide Thin Films from Solution: Materials for Electronic and Energy Applications. J. Mater. Chem. A 2019, 7, 24124–24149. [Google Scholar] [CrossRef]
  41. Bode, V.H.; Dehmelt, K.; Witte, J. Uber Die Oxydationsprodukte Von Nickel(II)-Hydroxiden. Z. Anorg. Allg. Chem. 1969, 366, 1–21. [Google Scholar] [CrossRef]
  42. Nath, D.; Singh, F.; Das, R. X-Ray Diffraction Analysis by Williamson-Hall, Halder-Wagner and Size-Strain Plot Methods of Cdse Nanoparticles- a Comparative Study. Mater. Chem. Phys. 2020, 239, 1–9. [Google Scholar] [CrossRef]
  43. Shannon, R.D. Revised Effective Ionic Radii and Systematic Studies of Interatomic Distances in Halides and Chalcogenides. Acta Crystallogr. A 1976, 32, 751–767. [Google Scholar] [CrossRef]
  44. Li, Y.W.; Yao, J.H.; Liu, C.J.; Zhao, W.M.; Deng, W.X.; Zhong, S.K. Effect of Interlayer Anions on the Electrochemical Performance of Al-Substituted a-Type Nickel Hydroxide Electrodes. Int. J. Hydrog. Energy 2010, 35, 2539–2545. [Google Scholar] [CrossRef]
  45. Zhu, Y.; Cao, C.; Tao, S.; Chu, W.; Wu, Z.; Li, Y. Ultrathin Nickel Hydroxide and Oxide Nanosheets: Synthesis, Characterizations and Excellent Supercapacitor Performances. Sci. Rep. 2014, 4, 1–7. [Google Scholar] [CrossRef] [PubMed] [Green Version]
  46. Joy, P.A.; Date, S.K. Comparison of the Zero-Field-Cooled Magnetization Behavior of Some Ferromagnetic and Ferrimagnetic Systems. J. Magn. Magn. Mater. 2000, 218, 229–237. [Google Scholar] [CrossRef]
  47. Cullity, B.D.; Graham, C.D. Introduction to Magnetic Materials, 2nd ed.; IEEE/Wiley: Hoboken, NJ, USA, 2009; pp. i–xvii, 544p. [Google Scholar]
  48. Morrish, A.H. The Physical Principles of Magnetism; Wiley-IEEE Press: New York, NY, USA, 2001. [Google Scholar]
  49. Kumar, A.; Yusuf, S.M. The Phenomenon of Negative Magnetization and Its Implications. Phys. Rep.-Rev. Sec. Phys. Lett. 2015, 556, 1–34. [Google Scholar] [CrossRef]
  50. Joy, P.A.; Kumar, P.S.A.; Date, S.K. The Relationship between Field-Cooled and Zero-Field-Cooled Susceptibilities of Some Ordered Magnetic Systems. J. Condens. Matter Phys. 1998, 10, 11049–11054. [Google Scholar] [CrossRef]
  51. Drillon, M.; and Panissod, P. Long-Range Ferromagnetism in Hybrid Compounds: The Role of Dipolar Interactions. J. Magn. Magn. Mater. 1998, 188, 93–99. [Google Scholar] [CrossRef]
  52. Meng, X.; Han, J.; Lu, L.; Qiu, G.; Wang, Z.L.; Sun, C. Fe(2+)-Doped Layered Double (Ni, Fe) Hydroxides as Efficient Electrocatalysts for Water Splitting and Self-Powered Electrochemical Systems. Small 2019, 15, e1902551. [Google Scholar] [CrossRef]
  53. Seehra, M.S.; Singh, V. Magnetic Ordering of Nickel Hydroxide Layers 30 a Apart Obtained by Intercalating Dodecyl Sulfate. J. Phys. Condens. Matter 2013, 25, 356001–356007. [Google Scholar] [CrossRef]
  54. Carrasco, J.A.; Cardona-Serra, S.; Clemente-Juan, J.M.; Gaita-Ariño, A.; Abellán, G.; Coronado, E. Deciphering the Role of Dipolar Interactions in Magnetic Layered Double Hydroxides. Inorg. Chem. 2018, 57, 2013–2022. [Google Scholar] [CrossRef]
Figure 1. Scanning electron micrographs of the microwave synthesized nanosheets; (a) Ni1.00Fe0.00, (b) Ni0.95Fe0.05, (c) Ni0.90Fe0.10, (d) Ni0.80Fe0.20, and (e) Ni0.50Fe0.50; red arrows point to changes in morphology within the Ni0.50Fe0.50 material.
Magnetochemistry 09 00025 g001
Figure 2. Elemental mapping of Ni and Fe determined by energy dispersive x-ray spectroscopy of (ac) Ni0.95Fe0.05, (df) Ni0.90Fe0.10, (gi) Ni0.80Fe0.20, and (jl) Ni0.50Fe0.50.
Magnetochemistry 09 00025 g002
Figure 3. X-ray diffraction patterns of (a) Fe-substituted nanosheets at 0, 5, 10, 20, and 50 at % Fe substitution ratio (notated as Ni1.00Fe0.00, Ni0.95Fe0.05, Ni0.90Fe0.10, Ni0.80Fe0.20, and Ni0.50Fe0.50, respectively), ICDD data of α-Ni(OH)2 (ICDD# 022-0444) is indexed with the 0, 5, 10, 20% Fe substituted samples for reference, ICDD data for NiFe2O4 (ICDD# 066-0778) and α-Ni(OH)2 (ICDD# 022-0444) are indexed with the 50% NiFe sample (α-Ni(OH)2 peaks denoted by * and NiFe2O4 by ∆) for reference; (b) and expanded region of the XRD pattern between 5° and 20° 2θ showing shifts in the (001) diffraction and corresponding d-spacings.
Magnetochemistry 09 00025 g003
Figure 4. Bright-field transmission electron microscopy of Ni1.00Fe0.00 (ac) and Ni0.95Fe0.05 (df) at different magnifications; the red box in (b) denotes the region used for the higher magnification image shown in (c); yellow dotted circles in (c) show crystalline domains with the (110) planes oriented perpendicular to the yellow arrows.
Magnetochemistry 09 00025 g004
Figure 5. Magnetization curves for (a) ZFC and (b) FC conditions, and (c) Inverse susceptibility for Ni1.00Fe0.00, Ni0.95Fe0.05, Ni0.90Fe0.10, and Ni0.80Fe0.20 (samples with up to 20% Fe) measured in a 100 Oe applied field.
Magnetochemistry 09 00025 g005
Figure 6. Inverse susceptibility for a 100 Oe applied field for (a) Ni1.00Fe0.00 (0% Fe) (b) Ni0.95Fe0.05 (5% Fe), (c) Ni0.90Fe0.10 (10% Fe), and (d) Ni0.80Fe0.20 (20% Fe) showing that samples with 0% and 5% Fe are ferromagnetic while samples with 10% and 20% Fe are ferrimagnetic.
Magnetochemistry 09 00025 g006
Figure 7. Zero field cooled (ZFC) and field cooled (FC) susceptibilities for applied fields of 50 Oe, 100 Oe, 200 Oe, 500 Oe, 0.1 T, and 0.5 T. field for (a) Ni1.00Fe0.00 (0% Fe), (b) Ni0.95Fe0.05 (5% Fe), (c) Ni0.90Fe0.10 (10% Fe), and (d) Ni0.80Fe0.20 (20% Fe).
Magnetochemistry 09 00025 g007
Figure 8. (a) Compensation point, T0, as a function of the applied magnetic field, and (b) ZFC magnetization at 2 K versus applied magnetic field, and (c) temperature at which the ZFC magnetization has a maximum TMAX, versus applied magnetic field, for Ni1.00Fe0.00 (0% Fe), Ni0.95Fe0.05 (5% Fe), Ni0.90Fe0.10 (10% Fe), and Ni0.80Fe0.20 (20% Fe).
Magnetochemistry 09 00025 g008
Figure 9. M vs. H loops at 2 K for (a) Ni1.00Fe0.00 (0% Fe), (b) Ni0.95Fe0.05 (5% Fe), (c) Ni0.90Fe0.10 (10% Fe), and (d) Ni0.80Fe0.20 (20% Fe) The remanence (Mr) and coercivity (Hc) are labeled in (a); insets in (ad) show M vs. H loops for 4, 8 and 10 K.
Magnetochemistry 09 00025 g009
Figure 10. (a) Coercive field (HC), (b) remnant magnetization (MR), and (c) saturation magnetization (MS) as a function of temperature for −20% Fe samples; (d) saturation magnetization (MS) in Bohr magnetons as a function of Fe % at low temperatures; and (e) plot of coercive field (HC) versus ratio of in-plane/through plane nanocrystalline grain size for 0–20% Fe samples.
Magnetochemistry 09 00025 g010
Table 1. Elemental composition and crystallographic properties of Fe-substituted nanosheets obtained by energy dispersive X-ray spectroscopy (EDS) and X-ray diffraction analysis. Within Ni0.50Fe0.50, the lattice parameters of the α-phase are included; Dthrough-plane is the nanocrystalline grain size determined from the (001) planes; Din-plane is the crystalline grain size determined from the (110) planes; R(Din-plane/Dthrough-plane) is the ratio of the Din-plane/ Dthrough-plane; details are provided in the text.
Relative Atomic %from SynthesisRelative Atomic % from EDS Analysisd-Spacing (Å)Lattice Parameters(Å)Crystallite Size (nm)R (Din-plane/Dthrough-plane)
(001)(110)a = bcDthrough-planeDin-plane
Ni1.00Fe0.00-7.432.685.377.358.314.31.7
Ni0.95Fe0.05Ni0.94Fe0.067.692.675.347.793.69.12.5
Ni0.90Fe0.10Ni0.89Fe0.117.872.675.347.652.69.23.5
Ni0.80Fe0.20Ni0.83Fe0.177.792.375.347.652.39.94.3
Ni0.50Fe0.50Ni0.51Fe0.497.002.665.297.052.311.24.9
Table 2. Magnetic characteristics of α-Ni(OH)2 and iron-substituted α-Ni(OH)2 nanosheets.
ParameterNi1.00Fe0.00Ni0.95Fe0.05Ni0.90Fe0.10Ni0.80Fe0.20
Paramagnetic Curie
Temperature, θp (K)
30.325−200−195
Critical Temperature, TFN (K)--1615
Magnetic ordering (2K)FerromagneticFerromagneticFerrimagneticFerrimagnetic
Effective magnetic moment (µB)2.93.07.17.3
Disclaimer/Publisher’s Note: The statements, opinions and data contained in all publications are solely those of the individual author(s) and contributor(s) and not of MDPI and/or the editor(s). MDPI and/or the editor(s) disclaim responsibility for any injury to people or property resulting from any ideas, methods, instructions or products referred to in the content.

