Article

Ligand Control of 59Co Nuclear Spin Relaxation Thermometry

Department of Chemistry, Colorado State University, 1301 Center Ave., Fort Collins, CO 80523-1872, USA
*
Author to whom correspondence should be addressed.
Magnetochemistry 2020, 6(4), 58; https://doi.org/10.3390/magnetochemistry6040058
Submission received: 23 October 2020 / Revised: 8 November 2020 / Accepted: 9 November 2020 / Published: 12 November 2020
(This article belongs to the Section Magnetic Resonances)

Abstract

:
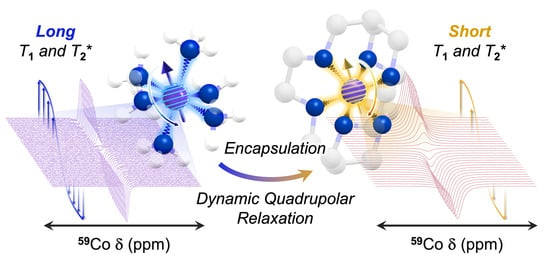
Studying the correlation between temperature-driven molecular structure and nuclear spin dynamics is essential to understanding fundamental design principles for thermometric nuclear magnetic resonance spin-based probes. Herein, we study the impact of progressively encapsulating ligands on temperature-dependent 59Co T1 (spin–lattice) and T2 (spin–spin) relaxation times in a set of Co(III) complexes: K3[Co(CN)6] (1); [Co(NH3)6]Cl3 (2); [Co(en)3]Cl3 (3), en = ethylenediamine); [Co(tn)3]Cl3 (4), tn = trimethylenediamine); [Co(tame)2]Cl3 (5), tame = triaminomethylethane); and [Co(dinosar)]Cl3 (6), dinosar = dinitrosarcophagine). Measurements indicate that 59Co T1 and T2 increase with temperature for 16 between 10 and 60 °C, with the greatest ΔT1T and ΔT2T temperature sensitivities found for 4 and 3, 5.3(3)%T1/°C and 6(1)%T2/°C, respectively. Temperature-dependent T2* (dephasing time) analyses were also made, revealing the highest ΔT2*/ΔT sensitivities in structures of greatest encapsulation, as high as 4.64%T2*/°C for 6. Calculations of the temperature-dependent quadrupolar coupling parameter, Δe2qQ/ΔT, enable insight into the origins of the relative ΔT1T values. These results suggest tunable quadrupolar coupling interactions as novel design principles for enhancing temperature sensitivity in nuclear spin-based probes.

Graphical Abstract

1. Introduction

The control of nuclear spin properties by molecular design is an important capability for many applications, spanning from diagnostic bioimaging [1,2,3] to encoding and processing quantum information [4,5,6,7]. A more focused application is designing temperature dependence into nuclear spin properties toward molecular-level thermometry, an essential technique for next-generation treatments of cancer [8,9,10,11]. Here, 59Co nuclear spins are an extremely promising platform for detecting changes in temperature, owing to the extreme thermal sensitivity of the metal ion chemical shift [12]. We note that chemical shift is not the only temperature-dependent property of nuclear spins. Indeed, the influence of temperature on nuclear spin relaxation dynamics may provide a practical additional mechanism for thermometry. Importantly, the quadrupolar coupling of the 59Co (I = 7/2) nucleus is exquisitely sensitive to subtle changes in the structure of the coordination shell. Thus, slight temperature-dependent structural changes are expected to drive nuclear spin behaviors by manipulating the quadrupolar coupling interaction, inducing temperature dependence in the 59Co spin–lattice and spin–spin relaxation times, T1 and T2, respectively. We note that other, more common nuclear spin-based probes, e.g., 1H, 13C, 19F, and 31P, are all I = 1/2, are not quadrupolar nuclei, and thus do not sense changes in temperature in this manner [13,14,15].
Owing to the foregoing advantages, we target design strategies to control the temperature sensitivity of 59Co nuclear spin dynamics in encapsulating ligands, which can prevent chemical decomposition in vivo, avoiding the release of toxic metal-ions [16,17,18]. Recent work by us demonstrated that the interconnected structures of encapsulating scaffolds amplify temperature sensitivity for contained 59Co nuclei [19]. Importantly, these studies probed only temperature-driven changes in chemical shift. In contrast, it is unknown to what extent, if any, encapsulation affects the temperature dependence of 59Co nuclear spin relaxation processes.
Herein, we provide the first test of the effect of encapsulation on the thermometric capabilities of the 59Co nuclear spin dynamics in Co(III) complexes. To do so, we performed variable-temperature 59Co NMR relaxation time experiments, specifically T1, T2, and linewidth analysis (T2*) with a series of six octahedral and pseudo-octahedral cobalt(III) complexes: (Figure 1) K3[Co(CN)6] (1); [Co(NH3)6]Cl3 (2); [Co(en)3]Cl3 (3), en = ethylenediamine); [Co(tn)3]Cl3 (4), tn = trimethylenediamine); [Co(tame)2]Cl3 (5), tame = triaminomethylethane); and [Co(dinosar)]Cl3 (6), dinosar = dinitrosarcophagine). This series enables comparison of the temperature-dependent relaxation dynamics of these complexes with (i) molecular symmetry (e.g., from the Oh complexes 1 and 2 to the nearly D3 complexes 36), and (ii) relative degree of encapsulation (from 26). We further computed quadrupolar coupling parameters from computational structures to rationalize the relative temperature dependence of the relaxation dynamics. We find no precise correlation between relaxation and encapsulation. Instead, we propose that ΔT1T of the 59Co nucleus is driven by changes in the quadrupolar coupling parameters, Δe2qQ, from thermally driven structures. These evaluations highlight important structural conditions of chelation among the series, which are shown to yield various trends in temperature-dependent T1, T2, and T2*.

2. Materials and Methods

2.1. General Considerations

Compounds utilized in this study were either purchased from commercial chemical vendors and used as received (1 and 2) or synthesized according previously reported literature preparations (36) [20,21,22,23,24].

2.2. Variable-Temperature 59Co-NMR Spectroscopy

Samples of all measured compounds were made as 0.7 mL volumes of 30 mM concentrations in protiated distilled water. Spectroscopic measurements were made at 118 MHz (59Co) using an Agilent Unity INOVA 500 MHz (1H) spectrometer at a field strength of 11.74 T with a 5mm BB NMR probe. Before any data collection, standard shims, deuterium locking, and probe tuning were made on 1 M sample of K3[Co(CN)6] in D2O, the 59Co-NMR reference standard. During 59Co-NMR experiments, data were collected in the absence of shimming and locking due to field stability of the instrument. Each sample was measured across a temperature range of 10–60 °C in 10 °C intervals. For each regulated temperature interval, samples were allowed to thermally equilibrate for 15 min before the probe was tuned for each pulse experiment.

2.3. Variable-Temperature 59Co Inversion Recovery and CPMG Experiments

Inversion recovery experiments were made on each sample across a temperature range of 10–60 °C in 10 °C intervals upon thermal equilibration. Inversion recovery data were acquired from 180° − τ − 90° pulse sequence experiments with 180° and 90° pulse lengths set at 22.4 and 11.2 µs, respectively. Pulse delay lengths τ were set by exponentially incremented time intervals relative to previously reported room temperature T1 values of each compound [19]. Similarly, CPMG (Carr–Purcell–Meiboom–Gill) pulse sequence experiments were made on each sample across a temperature range of 10–60 °C in 10 °C increments [25,26]. CPMG data were acquired from 90° − (τ − 180° − τ)n spin echo pulse sequence experiments with 180° and 90° pulse lengths identical to the corresponding inversion recovery parameters.

2.4. Computation of 59Co Quadrupolar Coupling Constants

Computational analyses were completed for the Co–N6 encapsulation series (26) by structural optimizations over a range of temperatures. Temperature-specific optimizations were assisted by previous extended X-ray absorption fine-structure (EXAFS) characterization by fixing Co–N distances according to experimentally determined metal–ligand bond lengths to the three temperatures utilized in the EXAFS study, i.e., 13, 35, and 57 °C [27]. The remainder of the structure was allowed to optimize freely about the fixed Co–N6 coordination sphere using the Gaussian 16 [28] electronic structure package. Electronic properties calculations were then performed using Orca 4.11 [29] to predict the quadrupolar coupling constant parameter (e2qQ) of the temperature-specific optimized structures.

3. Results

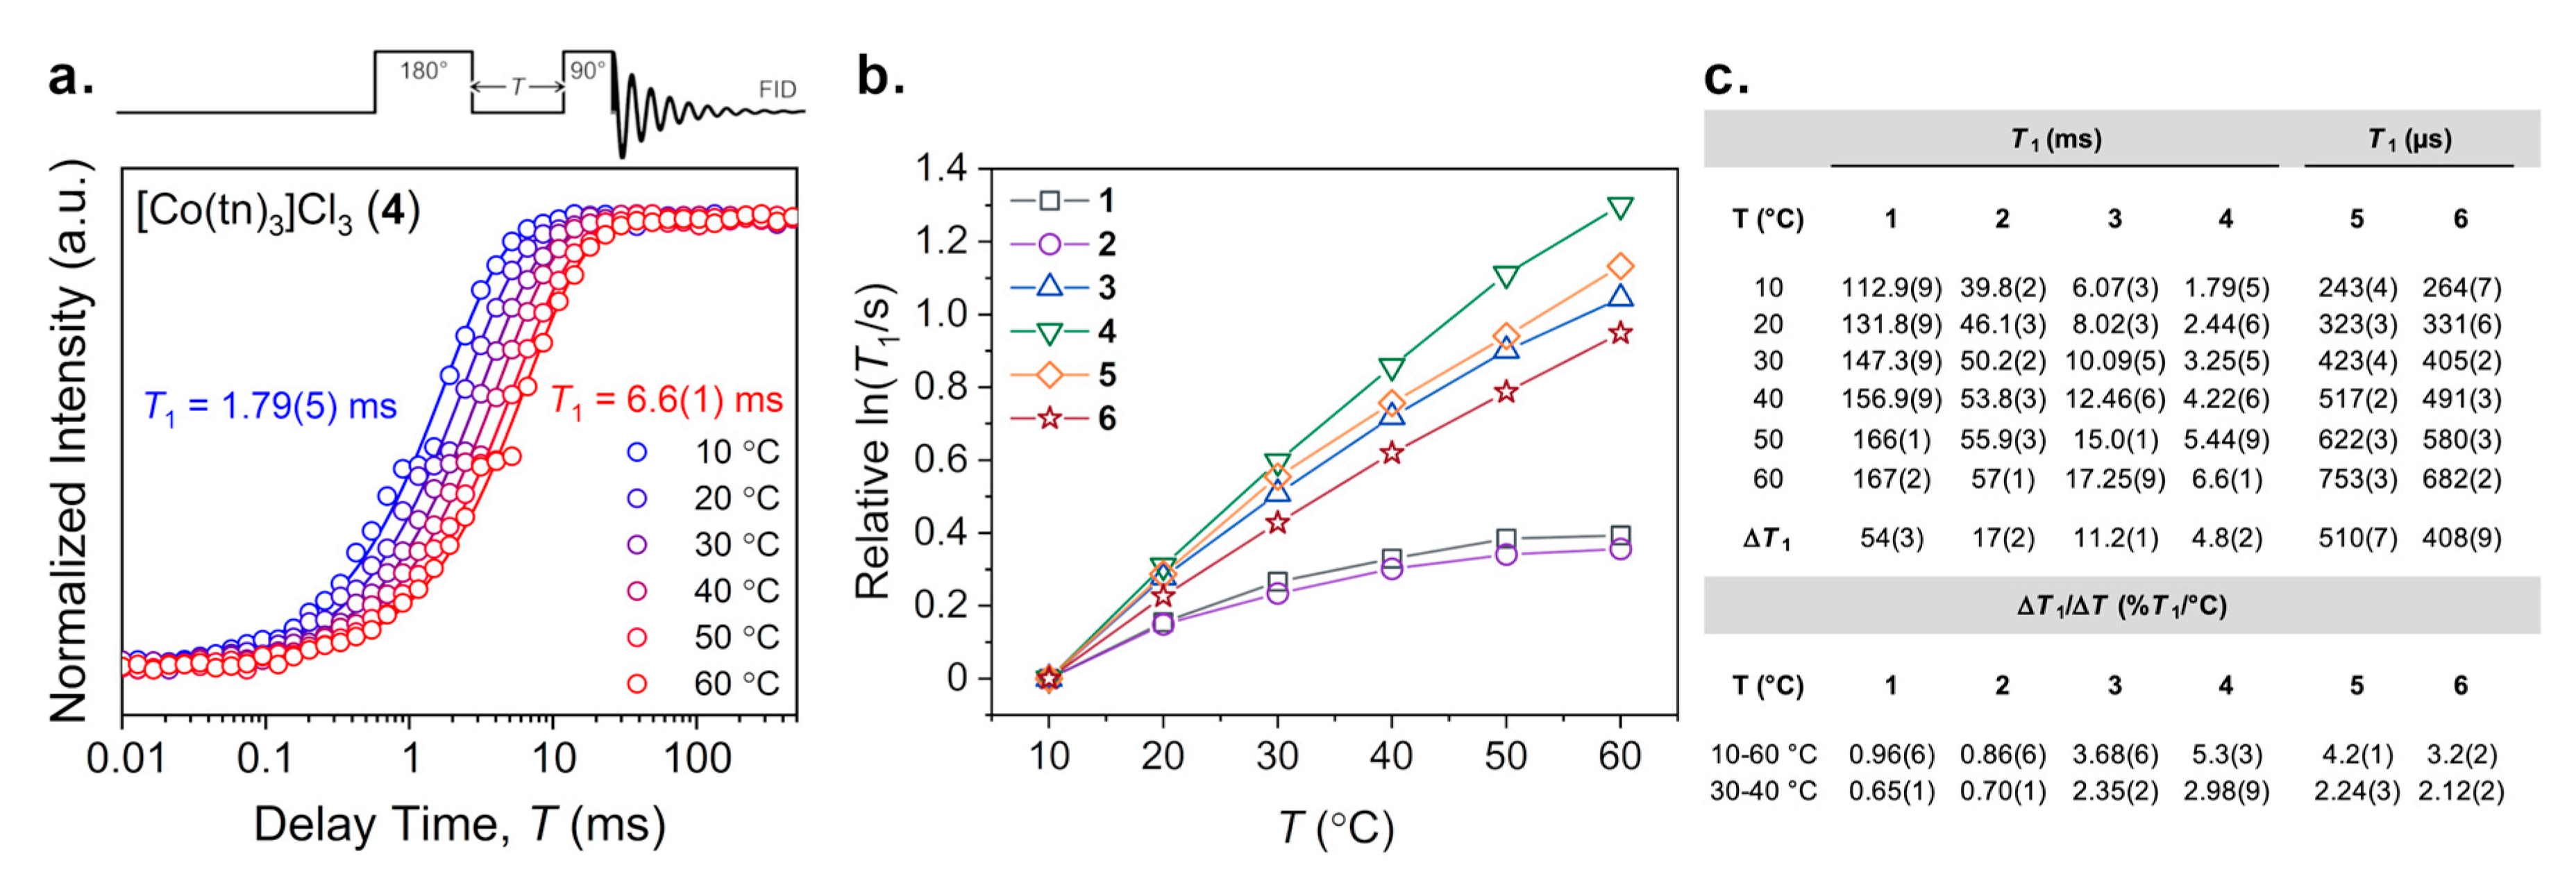
The first temperature-dependent 59Co nuclear spin property we investigated was the spin–lattice, or T1, relaxation time. Variable-temperature inversion recovery experiments were performed for 16 over a 10–60 °C temperature range. At each temperature, an initially inverted 59Co-NMR peak was observed and intensity was recovered as a function of increasing delay time following the inverting π pulse. Figure 2a shows the resulting recovery curves of 4 obtained from these pulsed experiments at different temperatures. Additional inversion recovery curves are available in the supplementary information (Figures S1–S6). The fitted inversion recovery data for 16 reveal lengthening of T1 with increasing temperature. The observed ranges of T1 span from 112.9(9) to 167(2) ms for 1, 39.8(2) to 57(1) ms for 2, 6.07(3) to 17.25(9) ms for 3, 1.79(5) to 6.6(1) ms for 4, 243(4) to 753(3) µs for 5, and 264(7) to 682(2) µs for 6 (Figure 2c). The largest absolute change in T1 over this temperature range is exhibited by 1T1 = 54(3) ms), while the smallest difference occurs for 6T1 = 408(9) µs). Between the minimum and maximum values of 1 and 6, absolute changes in ΔT1 for 25 are 17(1) ms, 11.2(1) ms, 4.8(2) ms, and 511(7) µs, respectively. The general magnitudes of these values are consistent with previous 59Co relaxation data on structurally similar cobalt systems [30,31,32,33].
For the purpose of comparison, it is useful to define relative changes in T1 for each complex since absolute differences ΔT1, as above, heavily weight molecules with long T1 times. As a result, the use of logarithmic scales of T1 with temperature are necessary to show a clear comparison of ΔT1 between 16 (Figure S7). In the following discussion, we express a comparative degree of change in T1 between 10 to 60 °C as a percentage difference divided by the 50 °C window. For example, the ΔT1 of 1 over 10 to 60 °C is approximately 54 ms. This value corresponds to a 48.2% increase in T1 from 112.9 ms (10 °C) over the 50 °C window, thus quantitated by 0.96(6)%T1/°C. Similarly, the other relative ΔT1T sensitivities are 0.86(6), 3.68(6), 5.3(3), 4.2(1), and 3.2(2)%T1/°C for 26, respectively. Figure 2b depicts the relative magnitudes of these values for all complexes over the 10–60 °C temperature window on a logarithmic scale. Owing to the potential utility of relaxation in modern biomedical imaging techniques, we highlight the aforementioned values of ΔT1T within the biologically relevant domain of 30–40 °C at 0.65(1), 0.70(1), 2.35(2), 2.98(9), 2.24(3), and 2.12(2)%T1/°C for 16, respectively (Figure 2c). These values follow the same general trend as with the 10–60 °C window, though the changes in magnitude differ slightly.
Notably, 4 shows the greatest change for both temperature windows, and 1 and 2 show the smallest relative increase in T1. However, the relation between T1 and T show varying degrees of temperature linearity across the series. T1 is expected to show a linear temperature dependence if the quadrupolar mechanism is operative. A high degree of linearity is shown by the D3-symmetric molecules of the series, 36. For these complexes, quadrupolar relaxation is expected due to the interaction between the electric quadrupolar moment and the lower-symmetry electric field gradient at the 59Co nucleus (relative to Oh 1 and 2). However, the non-linear relaxation behaviors of 1 and 2 suggest different operative relaxation processes of the central 59Co nucleus [30,34]. For these complexes, curvature in the plots of ln(T1/s) vs. T (°C) (Figure 2b) show a gradual decline with increasing temperature, indicative of another contributing relaxation mechanism. The spin–rotation relaxation mechanism is known to contribute to relaxation in similar Oh 59Co complexes, [30,31] thus is the likely origin of the non-linear temperature dependence in 1 and 2.
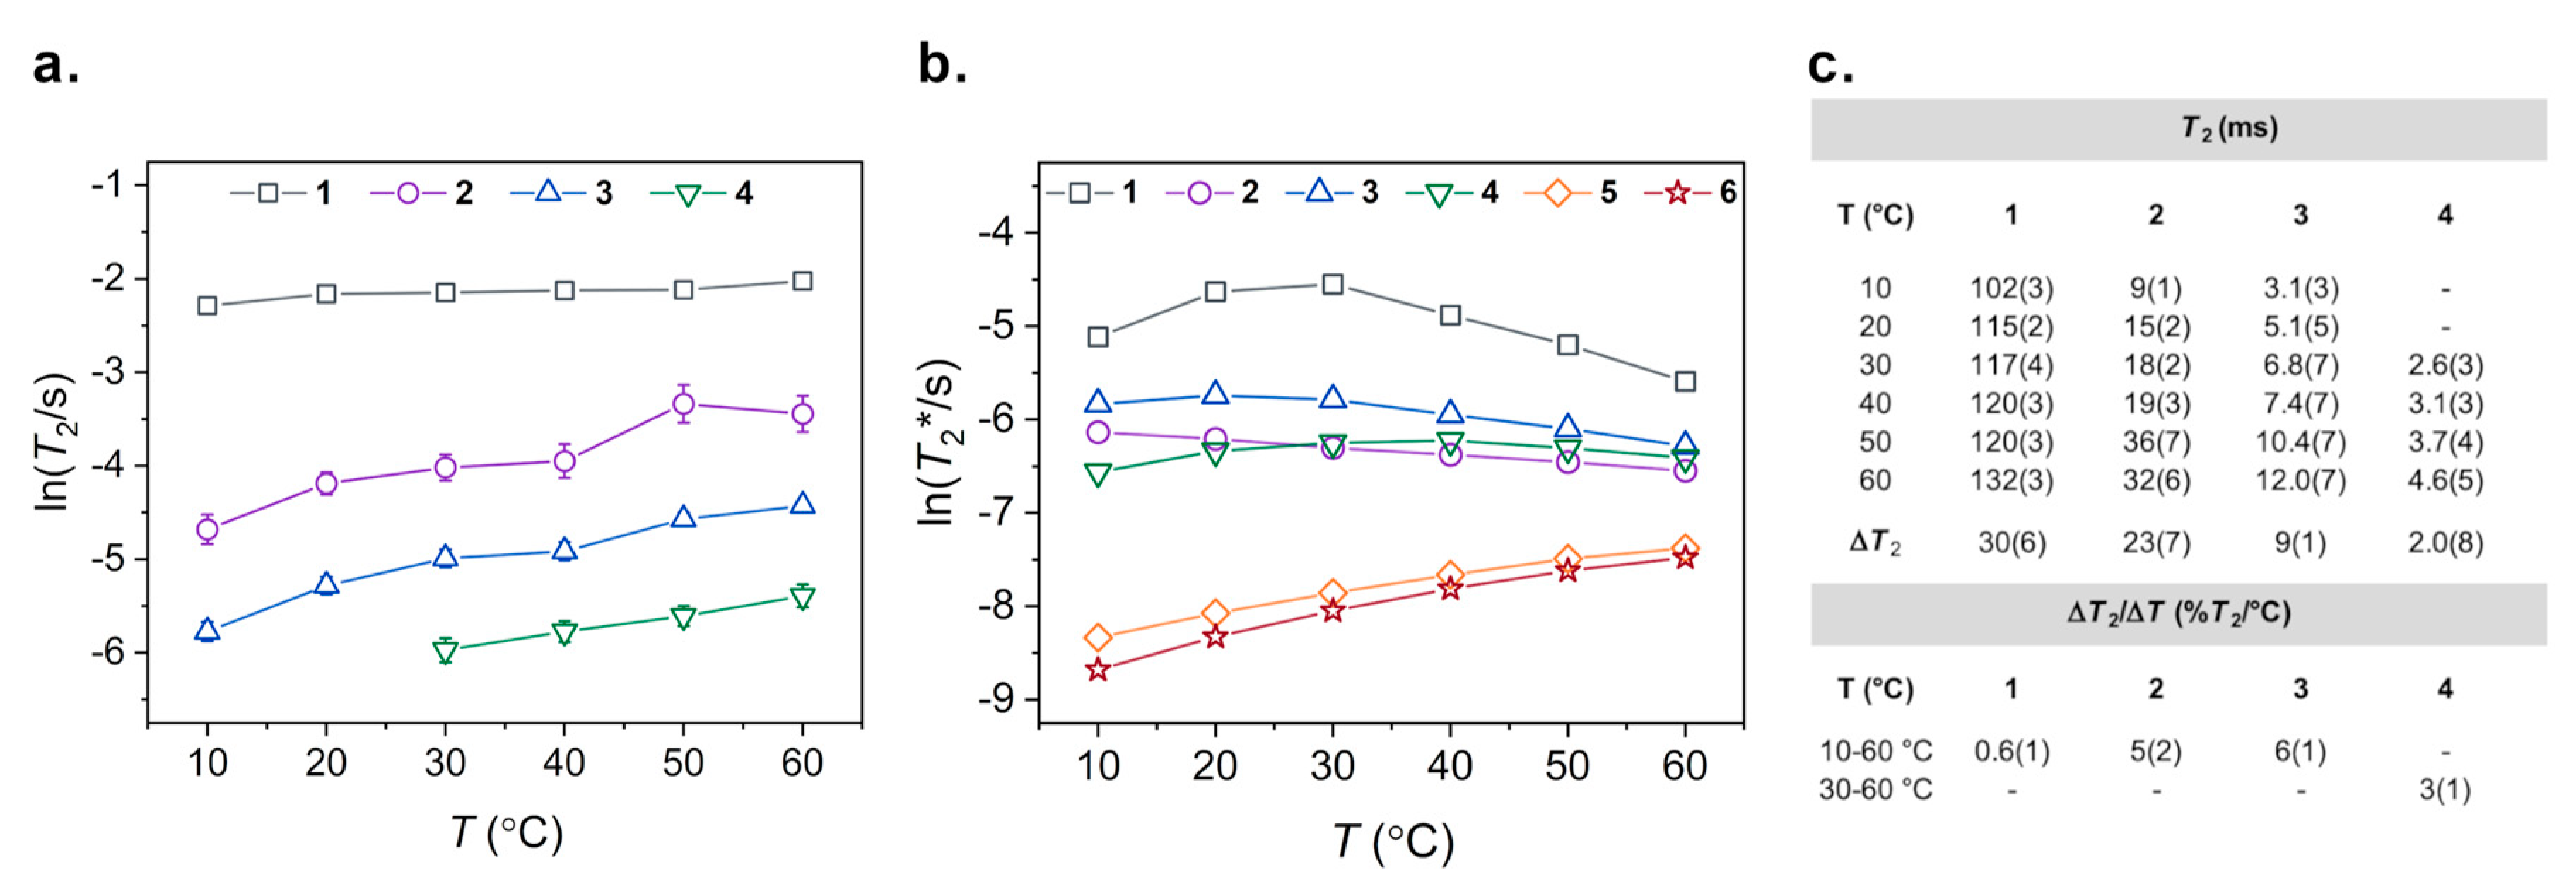
The second temperature-dependent nuclear spin property we investigated was T2. Variable-temperature CPMG experiments were performed over a 10–60 °C temperature range for on 13, and a 30–60 °C range for 4 to collect T2 values. At each temperature measurement, a 59Co NMR peak was observed with an intensity that decayed as a function of increasing number of π pulses. Figures S8–S11 show the resulting decay curves of the studied complexes and T2 times were determined from exponential fits of the decay. Similar to the temperature-dependent T1 behaviors, T2 increases with increasing temperature for 14. Figure 3a shows the relaxation trends for 14 over the 50 °C window. Unfortunately, due to instrumental limitations, we were not able to collect T2 values for 4 at 10 and 20 °C, nor for 5 and 6 at any temperature between 10–60 °C. Pulse delay times for CPMG experiments on complexes with relatively low T2 values approached the same timescales as the pulse durations (on the order of 10–20 µs). Thus, CPMG data could not be collected for 5 and 6, which are likely to have even shorter T2 times than 4 at 30 °C (the shortest experimentally determined T2 value). For 14, the observed range of T2 times span from 102(3) to 132(3) ms for 1, 9(1) to 32(6) ms for 2, and 3.1(3) to 12.0(7) ms for 3 (Figure 3c). The largest absolute change in T2 over a 10–60 °C temperature range is exhibited by 1T2 = 30(6) ms), followed by decreasing values of ΔT2 at 23(7) ms for 2, and 9(1) ms for 3. Between 30–60 °C, T2 for 4 was measured from 2.6(3) to 4.6(5) ms with an absolute ΔT2 of 2.0(8) ms. The increases in T2 over the studied range are expressed as ΔT2T by 0.6(1), 5(2), and 6(1)%T2/°C over 10–60 °C for 13, respectively, while an increase of 3(1)%T2/°C is shown for 4 over 30–60 °C.
As an additional method of comparing the variation in 59Co nuclear spin properties of 16, we investigated the dephasing time, or T2*, a relaxation time analogous to T2 above. T2* can be extracted from the temperature-dependent NMR linewidths through the relationship T2* = 1/(2πΔν) where Δν (Hz) is the full width at half the maximum height (FWHM) of the 59Co-NMR peak. This method enables a complete comparison of 16, in contrast to the CPMG experiments. Figure 3b shows the temperature-dependent trends in T2* for all complexes over the 10–60 °C range. Complexes 1, 3, and 4 all show increasing T2* with increasing temperature up to a maximum, then begin to decrease with further increasing temperature. The maxima occur near 30, 20, and 40 °C for 1, 3, and 4, respectively. In contrast, complex 2 shows a continual decline in T2* over the studied temperature range, while 5 and 6 both exhibit linear increases in T2*. The absolute changes in ΔT2* over 10–60 °C are −2.27, −0.73, −1.06, 0.24, 0.39, and 0.40 ms for 16, respectively (Table S1). This trend is reflected in the smaller, biologically relevant 30–40 °C window, where absolute ΔT2* values are −2.99, −0.13, −0.46, 0.05, 0.08, and 0.08 ms. As with ΔT1 and ΔT2, the absolute difference in timescales heavily weights complexes with already long T2* values. The relative changes according to ΔT2*/ΔT, which here describe essentially the temperature dependence of the spectral linewidth, are −0.76, −0.67, −0.72, 0.33, 3.21, and 4.64%T2*/°C for 16, respectively. The largest increase in T2* is shown by 6, with 5 showing the second largest increase. This trend is reflected in the narrowing linewidths observed in the 59Co NMR spectra as a function of increasing temperature.
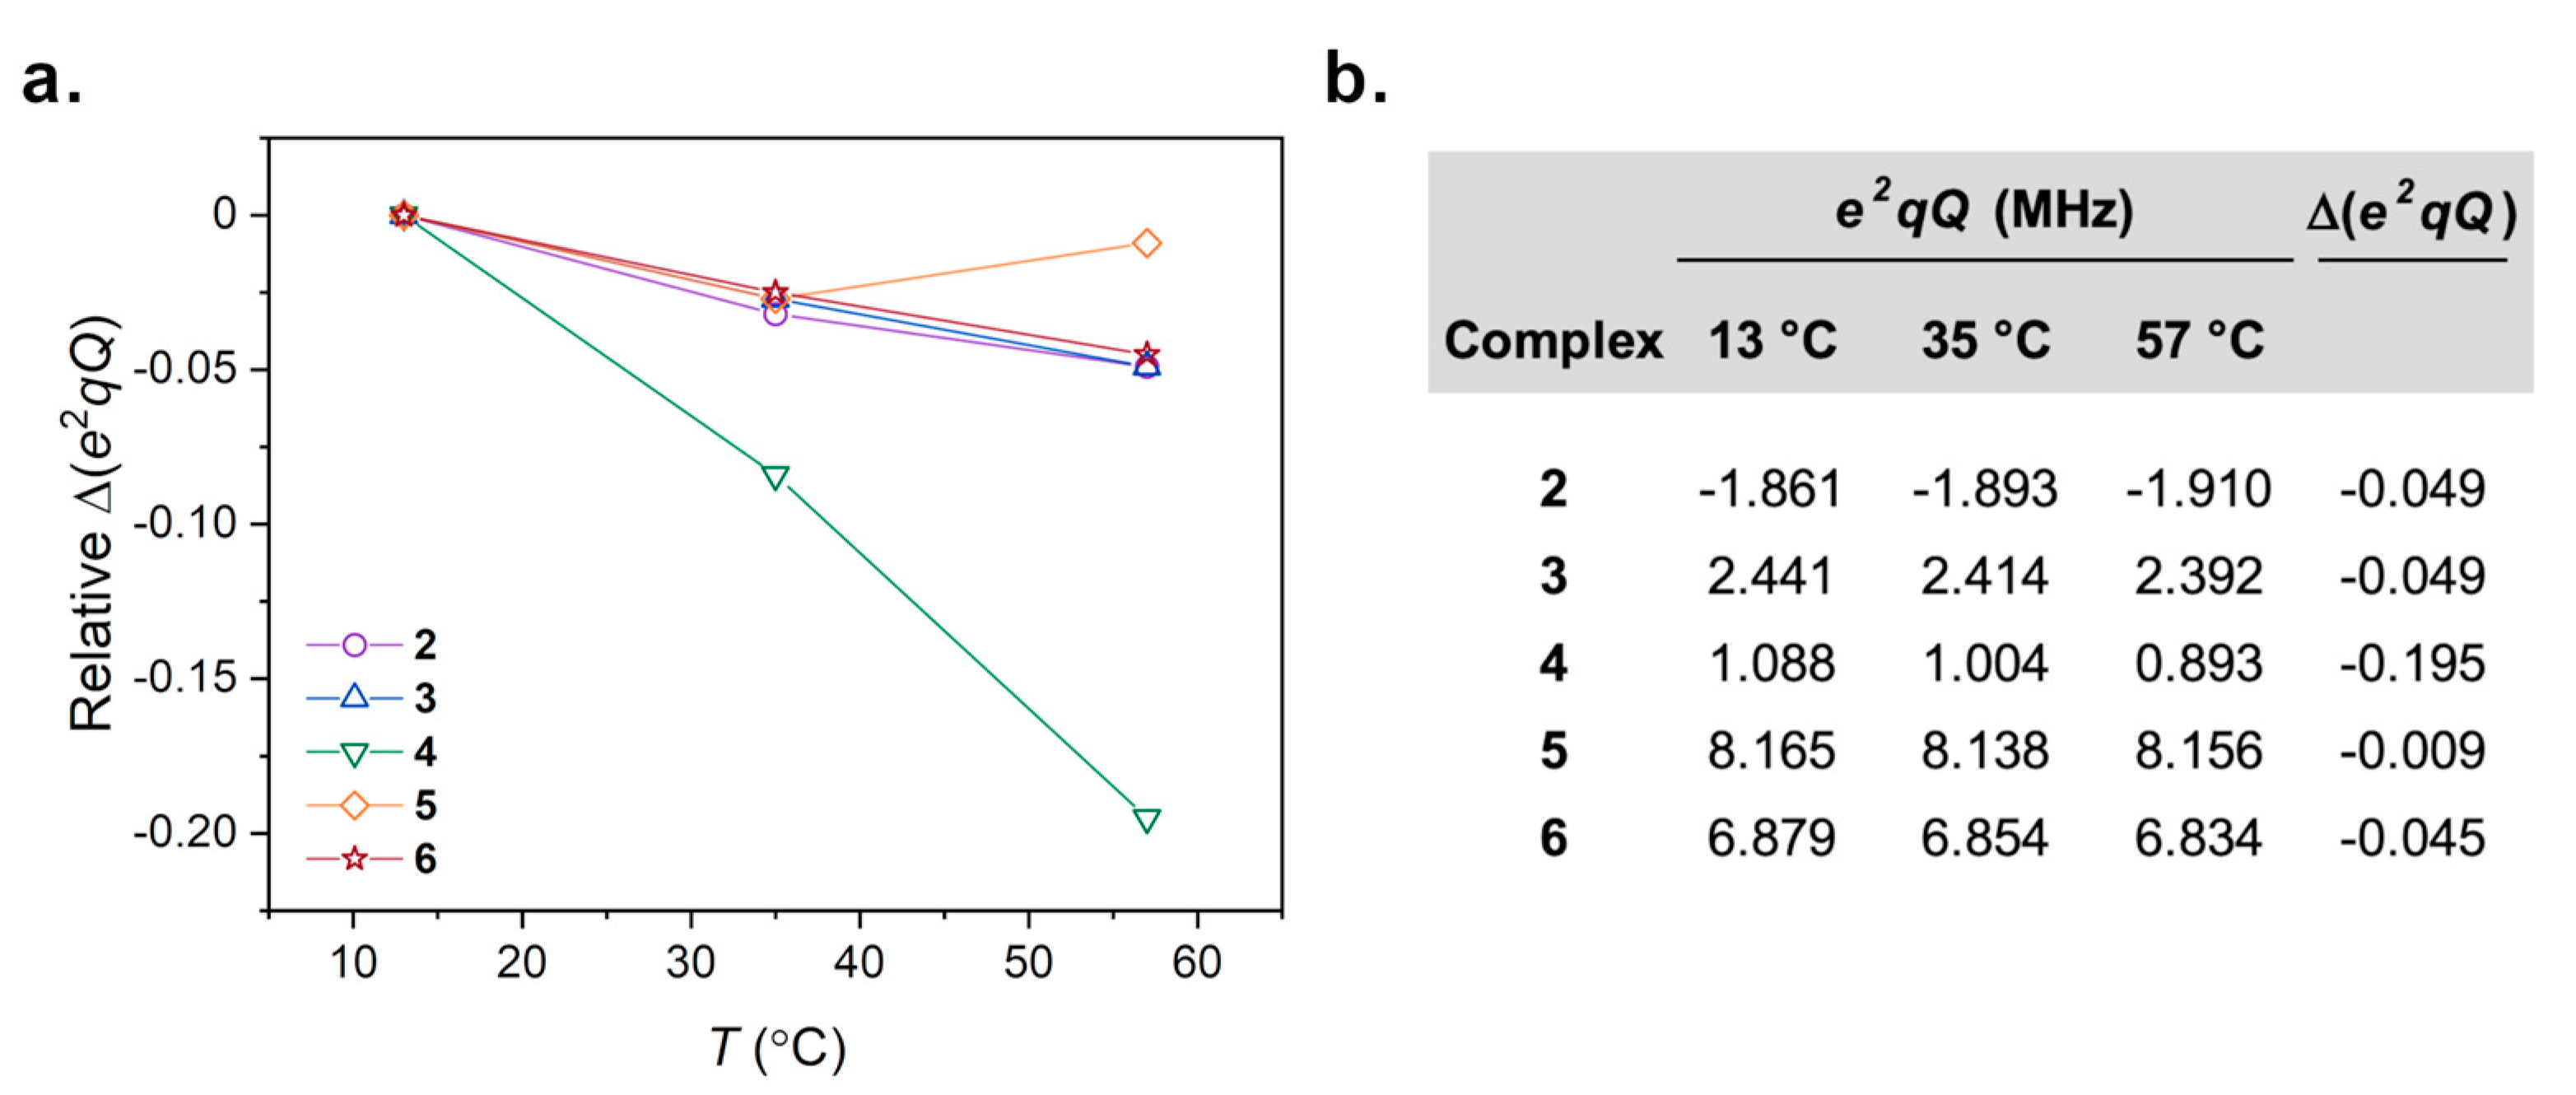
To assist in understanding the relaxation time data, we computed values of the quadrupolar coupling constant parameter (e2qQ) for the Co–N6 encapsulation series (26) at different temperatures within the 10–60 °C window. Predictions of e2qQ were completed from partially optimized, variable-temperature structures following analyses from extended X-ray absorption fine-structure (EXAFS) spectroscopy [27]. Values of e2qQ computed for these structures range from −1.861 to −1.910 MHz for 2, 2.441 to 2.392 for 3, 1.088 to 0.893 MHz for 4, 8.165 to 8.156 MHz for 5, and 6.879 to 6.834 MHz for 6 (Figure 4). The smallest values of e2qQ are found for the smaller complexes (24) reflecting higher symmetries in molecular structure, relative to the larger, more encapsulating D3 structures (5 and 6) showing the largest values of e2qQ in the series.
The differences in e2qQ by temperature-driven structure vary in scale, but all decrease with increasing temperature (Figure 4). Values of Δe2qQ for 26 are found to be −0.049, −0.049, −0.195, −0.009, and −0.045 MHz, respectively. Of these predicted values, the greatest change is found for 4 followed by 2 and 3, then 6 and 5. Importantly, the largest Δe2qQ is exhibited by 4 which also shows the largest ΔT1T value. Conversely, the encapsulated D3 structures of 5 and 6 possess the highest magnitudes of e2qQ between 8.156 to 8.165 MHz and 6.834 to 6.879 MHz, respectively, but show the least change by Δe2qQ.

4. Discussion

Spin–lattice relaxation of the 59Co nucleus is primarily attributed to the electric quadrupolar coupling interaction [30,31,32], which is dictated by the symmetry and structure of a given ligand shell. Evaluation of T1 via Arrhenius analyses of 16 elucidate the extent to which this is true. In principle, a higher linearity of ln(T1) vs. 1/T (103 K−1) depicted in Figure 5 indicates the contribution of a single relaxation process in governing T1. A slightly curved temperature dependence is observed for Oh 1 and 2, as evidenced by the lower R2 values (0.91) to linear regression. Conversely, highly linear trends are observed for the more D3-symmetry 36, with R2 values of 0.99. For this latter series of four complexes, an activation energy, Ea, can be extracted from these linear fits to the Arrhenius equation, 1/T1 = A exp(–Ea/RT), where A is a preexponential factor, R is the ideal gas constant, and T is absolute temperature (Table S2). Here, Ea describes the activation energy to molecular tumbling, and a lower Ea suggests more facile motion in solution [30,35,36]. Activation energies for 36 are found to be 16.4(5), 20.6(3), 17.6(5), and 14.9(1) kJ/mol, respectively (1.37(4), 1.72(3), 1.47(4), and 1.24(1) × 103 cm−1, respectively). Values of Ea increase from 6 < 3 < 5 < 4, reflecting the same trend in ΔT1T. Notably, the moderately encapsulated complex 4 shows the highest barrier to rotation and also the highest ΔT1T. If the spin–lattice relaxation is expected to be driven by motional changes dependent on molecular mass, then the observed trend in ΔT1T cannot be strictly reasoned by changes in a temperature-dependent correlation time, τc (Figure S12 and Table S3). If the former were true, then the larger complexes 5 and 6 would be expected to have higher activation energies than that shown for 4, an outcome that would be reflected by a longer τc in solution. In fact, they show shorter τc values, despite having larger ligand scaffolds. Thus, we conclude that the standard mechanisms for describing temperature-dependent relaxation, which principally stem from changes in correlation time, do not solely account for the observed changes here.
We instead propose that these changes in motion synergize with changes in the local symmetry of the 59Co nucleus to produce the observed trends in ΔT1T, especially in the series of D3 structures. Previous studies of 36 revealed ~0.007 Å changes in Co–N bond distances per °C over the 50 °C temperature range of our investigations here [27]. These changes in bond distances were also accompanied by changes in symmetry of the coordination geometry through changes in N–Co–N angles. As a result of these changes in symmetry, we find in our calculations here that the quadrupolar coupling constants decrease with increasing temperature with a magnitude that trends as 4 > 3 > 6 > 5 (Figure 4). The trend in Δe2qQ does not completely correlate to the trend in relaxation across the series, hence our suggestion that motion is also important. However, complex 4 shows both the greatest value of Δe2qQ at −0.194 MHz, and the highest ΔT1T at 5.3(3)%T1T over the 50 °C window.
The nearly equivalent values of T1 and T2 suggest that T2 is limited by T1, and, as such, T2 is also expected to be impacted by the quadrupolar coupling. However, the temperature dependence of T2 does not follow T1. Owing to the large temperature dependence of the 59Co chemical shift, we attribute this discrepancy to slight differences in resonance frequency by small temperature fluctuations which do not affect T1 as strongly as T2 [37]. We further highlight that the fast time scales of T2 for 5 and 6 are beyond the limits of the instrumentation. Hence, it would be challenging to utilize T2 as a thermometric parameter for these species. In that light, the temperature dependence of the 59Co linewidth appears more favorable for thermometry in complexes of greater encapsulation (and thus most chemically stable) owing to the linearity of ΔT2*/ΔT in the tridentate and encapsulated species 5 and 6. Finally, we note that the values of T2* obtained here are likely lower bounds for this parameter, as temperature inhomogeneities in the instrument cavity (by even a fraction of 1 °C) will broaden the signal independent of T2*.
The above analyses suggest three important points for the development of 59Co spin-based probes for quadrupolar-driven relaxation thermometry. Firstly, we note the importance of chelating or macrocyclic ligands, as 36 exhibited mostly quadrupolar relaxation, which is likely driven by the D3-directing nature of these ligands. Secondly, we see that enabling a higher ΔT1T is largely dependent on whether the species possesses a strong temperature dependence of the quadrupolar coupling constant, not necessarily the magnitude of constant itself. Complex 4 exemplifies this point. Finally, third, the range of computed e2qQ and Δe2qQ imply a tunable quadrupolar coupling interaction through temperature-driven structures. It is worth noting that this is, to the best of our knowledge, the first argument for this effect in governing thermometry by relaxation. Moreover, in this context, the most-encapsulated structures, 5 and 6, both show the lowest Δe2qQ values, compared to the structures of 3 and 4 with lesser denticity. This effect may be rationalized by a hindered variation in the symmetry of the structure due to the relative interconnectivity of the individual N donor atoms. Indeed, EXAFS analyses suggest that 4 exhibits the greatest transition towards Oh symmetry with increasing temperature when 3, 5, and 6 all deviate toward D3 symmetry [27]. This subtle difference in temperature-dependent structure is likely an important point toward designing future 59Co NMR thermometers.

5. Conclusions

We report a collection of temperature-dependent relaxation dynamic studies on a series of progressively encapsulated cobalt(III) complexes. The foregoing temperature-dependent data underline the fact that structure plays a vital role in controlling relaxation thermometry for the 59Co nucleus, but the coarse design principle of “encapsulation” does not solely govern the temperature dependence of T1 nor T2*. Relaxation times are found to be largely determined by the quadrupolar coupling interaction for the D3 complexes and a combination of quadrupolar and spin–rotation mechanisms for the Oh species (1 and 2). The chelated complex 4 has the largest relative increase in T1 as a function of its decrease in quadrupolar coupling, as mediated by a temperature-driven structure. We also found that encapsulated Co–N6 species, demonstrated by 5 and 6, are potentially promising thermometric structures by linear T2* temperature dependencies. These factors thus provide a foundation for future studies of tuning temperature-dependent nuclear spin relaxation processes in Co(III) complexes.

Supplementary Materials

The following are available online at https://www.mdpi.com/2312-7481/6/4/58/s1, Figure S1: Variable-temperature inversion recovery fits of 1, Figure S2: Variable-temperature inversion recovery fits of 2, Figure S3: Variable-temperature inversion recovery fits of 3, Figure S4: Variable-temperature inversion recovery fits of 4, Figure S5: Variable-temperature inversion recovery fits of 5, Figure S6: Variable-temperature inversion recovery fits of 6, Figure S7: T1 trend analysis ln(T1) vs. T (°C) of 16, Figure S8: Variable-temperature CPMG fits of 4 from 30–60 °C, Figure S9: Variable-temperature CPMG fits of 1 from 10–60 °C, Figure S10: Variable-temperature CPMG fits of 2 from 10–60 °C, Figure S11: Variable-temperature CPMG fits of 3 from 10–60 °C, Figure S12: Variable-temperature correlation times of 26, Table S1: Variable-temperature 59Co T2* values and linewidth fit values, Table S2: Linear trend fit parameters for ln(T1) vs 1/T (103 K–1) of 16, Table S3: Calculated variable-temperature correlation times of 26, Table S4: Computed structure of 3 at 13 °C, Table S5: Computed structure of 3 at 35 °C, Table S6: Computed structure of 3 at 57 °C, Table S7: Computed structure of 4 at 13 °C, Table S8: Computed structure of 4 at 35 °C, Table S9: Computed structure of 4 at 57 °C, Table S10: Computed structure of 5 at 13 °C, Table S11: Computed structure of 5 at 35 °C, Table S12: Computed structure of 5 at 57 °C, Table S13: Computed structure of 6 at 13 °C, Table S14: Computed structure of 6 at 35 °C, Table S15: Computed structure of 6 at 57 °C.

Author Contributions

T.M.O., A.K.R., and J.M.Z. conceived of the experiments, T.M.O. and S.H.J. collected all reported experimental and computational data. All authors were involved in the composition of the manuscript. All authors have read and agreed to the published version of the manuscript.

Funding

This research was performed with the support of Colorado State University (CSU) and the NIH (R21-EB027293). NMR experiments were performed on an instrument at the CSU Analytical Resources Core, which is supported by an NIH-SIG award (1S10OD021814-01) and the CSU-CORES Program. Computational resources are enabled by the Catalysis Collaboratory for Light-activated Earth Abundant Reagents (C-CLEAR), which is supported by the National Science Foundation (NSF) and the Environmental Protection Agency through the Networks for Sustainable Molecular Design and Synthesis (CHE-1339674) at Colorado State University, Fort Collins. S.H.J. acknowledges the Colorado Chapter of the ARCS Foundation for their continued support.

Acknowledgments

We acknowledge Z. Cleveland and C. Rithner for useful discussions and experimental assistance.

Conflicts of Interest

There are no conflict of interest to report in this work.

References

  1. Sotoma, S.; Epperla, C.P.; Chang, H.-C. Diamond Nanothermometry. ChemNanoMat 2018, 4, 15–27. [Google Scholar] [CrossRef]
  2. Toyli, D.M.; de las Casas, C.F.; Christle, D.J.; Dobrovitski, V.V.; Awschalom, D.D. Fluorescence thermometry enhanced by the quantum coherence of single spins in diamond. Proc. Natl. Acad. Sci. USA 2013, 110, 8417–8421. [Google Scholar] [CrossRef] [PubMed] [Green Version]
  3. Hui, Y.Y.; Chen, O.Y.; Azuma, T.; Chang, B.-M.; Hsieh, F.-J.; Chang, H.-C. All-Optical Thermometry with Nitrogen-Vacancy Centers in Nanodiamond-Embedded Polymer Films. J. Phys. Chem. C 2019, 123, 15366–15374. [Google Scholar] [CrossRef]
  4. Thiele, S.; Balestro, F.; Ballou, R.; Klyatskaya, S.; Ruben, M.; Wernsdorfer, W. Electrically driven nuclear spin resonance in single-molecule magnets. Science 2014, 344, 1135–1138. [Google Scholar] [CrossRef]
  5. Gershenfeld, N.A.; Chuang, I.L. Bulk Spin-Resonance Quantum Computation. Science 1997, 275, 350–356. [Google Scholar] [CrossRef] [Green Version]
  6. Havel, T.F.; Cory, D.G.; Lloyd, S.; Boulant, N.; Fortunato, E.M.; Pravia, M.A.; Teklemariam, G.; Weinstein, Y.S.; Bhattacharyya, A.; Hou, J. Quantum information processing by nuclear magnetic resonance spectroscopy. Am. J. Phys. 2002, 70, 345–362. [Google Scholar] [CrossRef]
  7. Vandersypen, L.M.; Steffen, M.; Breyta, G.; Yannoni, C.S.; Sherwood, M.H.; Chuang, I.L. Experimental realization of Shor’s quantum factoring algorithm using nuclear magnetic resonance. Nature 2001, 414, 883–887. [Google Scholar] [CrossRef] [Green Version]
  8. Brace, C. Thermal Tumor Ablation in Clinical Use. IEEE Pulse 2011, 2, 28–38. [Google Scholar] [CrossRef] [Green Version]
  9. Tseng, H.; Lin, S.-E.; Chang, Y.-L.; Chen, M.-H.; Hung, S.-H. Determining the critical effective temperature and heat dispersal pattern in monopolar radiofrequency ablation using temperature-time integration. Exp. Ther. Med. 2016, 11, 763–768. [Google Scholar] [CrossRef] [Green Version]
  10. Yuan, J.; Mei, C.-S.; Panych, L.P.; McDannold, N.J.; Madore, B. Towards fast and accurate temperature mapping with proton resonance frequency-based MR thermometry. Quant. Imaging Med. Surg. 2012, 2, 21–32. [Google Scholar]
  11. Van Rhoon, G.C.; Wust, P. Introduction: Non-invasive thermometry for thermotherapy. Int. J. Hyperth. 2005, 21, 489–495. [Google Scholar] [CrossRef]
  12. Levy, G.C.; Terry Bailey, J.; Wright, D.A. A sensitive NMR thermometer for multinuclei FT NMR. J. Magn. Reson. 1980, 37, 353–356. [Google Scholar] [CrossRef]
  13. Bornais, J.; Brownstein, S. A low-temperature thermometer for 1H, 19F, and 13C. J. Magn. Reson. 1978, 29, 207–211. [Google Scholar] [CrossRef]
  14. Quast, H.; Heubes, M.; Dunger, A.; Limbach, H.-H. A high-precision carbon-13 shift thermometer for the temperature range 100–300 K. J. Magn. Reson. 1998, 134, 236–244. [Google Scholar] [CrossRef] [PubMed]
  15. Zuo, C.S.; Bowers, J.L.; Metz, K.R.; Nosaka, T.; Sherry, A.D.; Clouse, M.E. TmDOTP5−: A substance for NMR temperature measurements in vivo. Magn. Reson. Med. 1996, 36, 955–959. [Google Scholar] [CrossRef]
  16. Sargeson, A.M. Developments in the synthesis and reactivity of encapsulated metal ions. Pure Appl. Chem. 1986, 58, 1511–1522. [Google Scholar] [CrossRef]
  17. Liu, S.; Li, D.; Huang, C.-W.; Yap, L.-P.; Park, R.; Shan, H.; Li, Z.; Conti, P.S. The Efficient Synthesis and Biological Evaluation of Novel Bi-Functionalized Sarcophagine for 64Cu Radiopharmaceuticals. Theranostics 2012, 2, 589–596. [Google Scholar] [CrossRef]
  18. Liu, S.; Li, Z.; Conti, P.S. Development of Multi-Functional Chelators Based on Sarcophagine Cages. Molecules 2014, 19, 4246–4255. [Google Scholar] [CrossRef] [Green Version]
  19. Ozvat, T.M.; Peña, M.E.; Zadrozny, J.M. Influence of ligand encapsulation on cobalt-59 chemical-shift thermometry. Chem. Sci. 2019, 10, 6727–6734. [Google Scholar] [CrossRef] [Green Version]
  20. Krause, R.; Megargel, E. Student synthesis of tris(ethylenediamine)cobalt(III) chloride. J. Chem. Educ. 1976, 53, 667. [Google Scholar] [CrossRef]
  21. Bailar, J.C.; Work, J.B. Some Coördination Compounds of Cobalt Containing Trimethylenediamine and Neopentanediamine. J. Am. Chem. Soc. 1946, 68, 232–235. [Google Scholar] [CrossRef]
  22. Geue, R.J.; Snow, M.R. Structure, conformational analysis and optical activity of a bis(tridentate)cobalt(III) complex. (+)589-Δλλ-Bis[1,1,1-tris(aminomethyl)ethane]cobalt(III) chloride (+)589-(R,R)-tartrate hydrate. Inorg. Chem. 1977, 16, 231–241. [Google Scholar] [CrossRef]
  23. Qin, C.-J.; James, L.; Chartres, J.D.; Alcock, L.J.; Davis, K.J.; Willis, A.C.; Sargeson, A.M.; Bernhardt, P.V.; Ralph, S.F. An Unusually Flexible Expanded Hexaamine Cage and Its CuII Complexes: Variable Coordination Modes and Incomplete Encapsulation. Inorg. Chem. 2011, 50, 9131–9140. [Google Scholar] [CrossRef] [PubMed] [Green Version]
  24. Bottomley, G.; Clark, I.; Creaser, I.; Engelhardt, L.; Geue, R.; Hagen, K.; Harrowfield, J.; Lawrance, G.; Lay, P.; Sargeson, A.; et al. The Synthesis and Structure of Encapsulating Ligands: Properties of Bicyclic Hexamines. Aust. J. Chem. 1994, 47, 143–179. [Google Scholar] [CrossRef]
  25. Carr, H.Y.; Purcell, E.M. Effects of Diffusion on Free Precession in Nuclear Magnetic Resonance Experiments. Phys. Rev. 1954, 94, 630–638. [Google Scholar] [CrossRef]
  26. Meiboom, S.; Gill, D. Modified Spin-Echo Method for Measuring Nuclear Relaxation Times. Rev. Sci. Instrum. 1958, 29, 688–691. [Google Scholar] [CrossRef] [Green Version]
  27. Ozvat, T.M.; Sterbinsky, G.E.; Campanella, A.J.; Rappé, A.K.; Zadrozny, J.M. EXAFS investigations of temperature-dependent structure in cobalt-59 molecular NMR thermometers. Dalton Trans. 2020. [Google Scholar] [CrossRef]
  28. Frisch, M.J.; Trucks, G.W.; Schlegel, H.B.; Scuseria, G.E.; Robb, M.A.; Cheeseman, J.R.; Scalmani, G.; Barone, V.; Petersson, G.A.; Nakatsuji, H.; et al. Gaussian 16 Rev. C.01; Gaussian, Inc.: Wallingford, CT, USA, 2016. [Google Scholar]
  29. Neese, F. The ORCA program system. WIREs Comput. Mol. Sci. 2012, 2, 73–78. [Google Scholar] [CrossRef]
  30. Kirby, C.W.; Puranda, C.M.; Power, W.P. Cobalt-59 nuclear magnetic relaxation studies of aqueous octahedral cobalt(III) complexes. J. Phys. Chem. 1996, 100, 14618–14624. [Google Scholar] [CrossRef]
  31. Ader, R.; Loewenstein, A. Nuclear magnetic relaxation studies in solutions of symmetric cobalt (III) complexes. J. Magn. Reson. 1969 1971, 5, 248–261. [Google Scholar] [CrossRef]
  32. Chacko, V.P.; Bryant, R.G. Electric field gradient modulation and nuclear magnetic relaxation in hexacyanocobaltate ion. J. Magn. Reson. 1984, 57, 79–84. [Google Scholar] [CrossRef]
  33. Doddrell, D.M.; Bendall, M.R.; Healy, P.C.; Smith, G.; Kennard, C.H.L.; Raston, C.L.; White, A.H. 59Co and 13C Nuclear Spin Relaxation Studies in Solutions of Symmetric, Bidentate Cobalt(III) Complexes. On the Mechanism of 59Co Spin Relaxation. Crystal Structure Determination of Tris(tropolonato)cobalt(III). Aust. J. Chem. 1979, 32, 1219–1230. [Google Scholar] [CrossRef]
  34. Boeré, R.T.; Kidd, R.G. Rotational Correlation Times in Nuclear Magnetic Relaxation. In Annual Reports on NMR Spectroscopy; Elsevier: Amsterdam, The Netherlands, 1983; Volume 13, pp. 319–385. ISBN 978-0-12-505313-6. [Google Scholar]
  35. Foster, R.J.; Damion, R.A.; Ries, M.E.; Smye, S.W.; McGonagle, D.G.; Binks, D.A.; Radjenovic, A. Imaging of nuclear magnetic resonance spin–lattice relaxation activation energy in cartilage. R. Soc. Open Sci. 2018, 5, 180221. [Google Scholar] [CrossRef] [PubMed]
  36. Rieke, V.; Pauly, K.B. MR Thermometry. J. Magn. Reson. Imaging 2008, 27, 376–390. [Google Scholar] [CrossRef] [PubMed]
  37. Anet, F.A.L.; O’leary, D.J. The shielding tensor part II: Understanding its strange effects on relaxation. Concepts Magn. Reson. 1992, 4, 35–52. [Google Scholar] [CrossRef]
Figure 1. Chemical structure series of low-spin octahedral cobalt(III) complexes. Complexes 2–6 make up the series of progressively encapsulated 59Co nuclei by greater degrees of chelation in a common Co–N6 coordination environment. Arrows represent the I = 7/2 nuclear spin of the 59Co nuclei in each complex. Hydrogens bound to carbons are omitted for clarity.
Magnetochemistry 06 00058 g001
Figure 2. (a) Experimental variable-temperature (10–60 °C) inversion recovery measurements (circles) with exponential recovery fits (traces) for [Co(tn)3]Cl3 (4) on logarithmic scale. Temperature-specific T1 values were extracted from exponential decay fits. The general pulse sequence for the inversion recovery experiment is depicted. (b) Variable-temperature T1 plots of 16 on logarithmic scale showing relative changes. Error bars are within the width of the data points. Traces are guides for the eye. (c) Temperature-specific T1 spin–lattice relaxation times with error for 16 from 10–60 °C with absolute values of ΔT1 and relative values of ΔT1T temperature sensitivities.
Magnetochemistry 06 00058 g002
Figure 3. (a) Variable-temperature T2 plots of 14 on logarithmic scale showing relative changes in T2 spin–spin relaxation times. Error bars for K3[Co(CN)6] (1) are within the width of the data points. Traces in both plots are mean to guide the eye. (b) Variable-temperature T2* trends from linewidth analyses of 16 from 1D 59Co NMR spectra. (c) Temperature-specific T2 spin–spin relaxation times with error for 14 with absolute values of ΔT2 and relative values of ΔT2T temperature sensitivities.
Magnetochemistry 06 00058 g003
Figure 4. (a) Trends in predicted quadrupolar coupling parameters, e2qQ, from variable-temperature predicted structures of 26. (b) Temperature-specific quadrupolar coupling parameters at each temperature-specific structure and Δe2qQ over the ~50 °C range.
Magnetochemistry 06 00058 g004
Figure 5. Arrhenius plots of variable-temperature T1 relaxation. Solid grey lines indicate linear regressions for 1–6. Values of R2 from each fit (Table S2) are used to determine temperature linearity for each complex.
Magnetochemistry 06 00058 g005
Publisher’s Note: MDPI stays neutral with regard to jurisdictional claims in published maps and institutional affiliations.