Abstract
In this paper, the predictive power of diffracxtive magneto-optics concerning domain structure and reversal mechanisms in ordered arrays of magnetic elements is demonstrated. A simple theoretical model based on Fraunhoffer diffraction theory is used to predict the magnetisation reversal mechanisms in an array of magnetic elements. Different domain structures and simplified models (or educated guesses) of the associated reversal mechanisms produce marked differences in the spatial distributions of the magnetisation. These differences and the associated magnetisation distribution moments are experimentally accessible through conventional and diffractive magneto-optical Kerr effect measurements. The domain and magnetisation reversal predictions are corroborated with Magnetic Force Microscopy (MFM) measurements.
1. Introduction
Arrays of sub-micron magnetic elements are the basis for further development of magnetic memory and storage media. Special attention has been paid to size effects on the magnetic and magneto-optical properties of periodic arrays of micron and sub-micron elements. Recent studies have shown that Magneto-optic techniques, and in particular Diffraction Magneto-Optic Kerr Effect (DMOKE), are most suited to experimentally investigate such effects as they possess the high sensitivity needed to monitor the magnetisation changes of thin films and very small elements. The importance of DMOKE is growing over recent years as it supplies valuable information on both the magnetisation distribution [1,2] and magnetic anisotropy [3] due to its high sensitivity to magnetic inhomogeneities. This high sensitivity may provide the magnitude of the anisotropy constants analysing the array response on both the reflected and diffracted spots [3]. Not only positive [4] but also negative arrays [5] have been studied using magneto-optic (MO) techniques. This technique has been also used to study patterned 1D [6,7,8,9] and 2D [8,10,11,12] thin films, and also for negative magnetic arrays [13,14,15]. MO hysteresis loops measured in different diffraction orders reveal marked differences with the loops measured at the reflected (0th order) beam [16,17]. These differences are more marked as the elements are placed closer and, when combining the information about the magnetisation contained in the conventional MOKE signal with the one contained in the DMOKE signal, valuable information about the magnetisation distribution and the magnetisation reversal might be obtained [2]. This information is related to the global magnetisation behaviour within the array and might be locally corroborated by Magnetic Force Microscopy (MFM) measurements.
2. Results and Discussion
The sample considered for this work consists of a square array of 5 μm edged 30 nm thick magnetic square elements separated 1 μm. The square arrays are fabricated in a 400 × 400 μm2 field patterned as follows; the Si substrate is spin-coated by a thin copolymer (AR P617.08) film, followed by a polymethylmethacrylate (PMMA) film, which are subsequently irradiated in a scanning electron microscope and developed. This resist bilayer is used as a mask in the deposition by triode sputtering at room temperature (RT) of amorphous Fe80B20 30 nm thick film. Once the resist is chemically removed, a patterned array is obtained. In order to compare with the patterned samples, a continuous thin film with the same thickness (30 nm) has been made. Such a film exhibits a uniaxial anisotropy whose easy axis is parallel to the plasma confining field during deposition, with an anisotropy field of 4 Oe. The magnetic properties of the amorphous Fe80B20 thin film are totally consistent with a Stoner–Wohlfarth model, i.e., the hysteresis loop depends on the angle of the applied magnetic field with respect to the anisotropy axis, being square with a 4 Oe coercive field when the external field is applied along the easy magnetisation axis, and linear with a saturation field of 13 Oe when the external field is applied along the hard magnetisation axis.
In order to characterise the patterned samples, the transversal magneto-optical Kerr effect (MOKE) and the diffracted magneto-optical Kerr effect (DMOKE) are used. A complete scheme and description of the MOKE set-up can be found in [2].
When illuminating the pattern with the laser beam, a diffraction pattern appears. Following the notation in [2], the diffraction spots perpendicular to the plane of incidence are termed mY and the ones in the plane of incidence and perpendicular to the laser propagation direction are termed nX, where n and m are integers representing the diffraction order. The measured hysteresis loops are plotted in Figure 1.
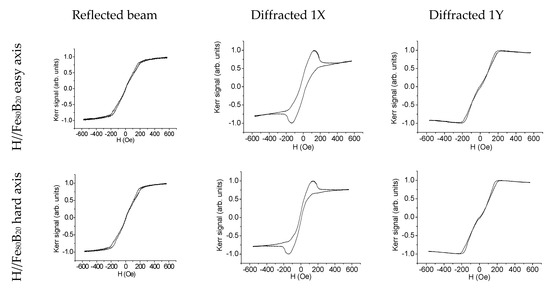
Figure 1.
Hysteresis loops, both for the 0th order (reflected) and 1st X and Y diffracted orders, for arrays of 5 μm edged Fe80B20 squares separated 1 μm with external field H parallel to the Fe80B20 easy and hard axes.
Both the reflected and the diffracted signals contain valuable information concerning the magnetisation reversal in the magnetic elements. The direct reflected hysteresis loops represent the value of the average magnetisation vs. the value of the external field. On the other hand, under our measurement conditions, the behaviour of the diffracted signal is ruled by the Kerr formula [1,2]:
In this formula, n and m represent, respectively, the diffraction orders in the X and Y directions; my(x,y) is the magnetisation along the unit cell of the array; T is the period of the cell; a is the size of the square magnetic element; and B is a complex parameter that depends on the material, light wavelength and incidence angle.
In order to show the limitations of the model, it is interesting to know how the Kerr formula is obtained; it is obtained using the Fraunhoffer diffraction theory, taking into account not only the non-magnetic contributions (due to both the shape of the elements and the lattice), but also the magnetic contributions. Thus, the intensity in the nth diffracted is In = End(End)* [10], where End is the electric field value in the nth diffraction order. For the transversal Kerr configuration, End = E0(rppfn + rmpp fnm) where E0 is the incident electric field, rpp and rmpp are the non-magnetic and magnetic reflectivity coefficients (see in [18] for an expression of rpp) and fn and fnm are the non-magnetic and magnetic form factors of the considered lattice.
The reflectivity coefficients depend on the magnetic material’s complex refraction indexes, on the substrate, on the incidence and diffraction angles and on the complex magneto-optic constants.
The non-magnetic form factor depends only on the element shape whereas the magnetic form factor depends also on the spatial distribution of the magnetisation in the unit cell. As the experimental data have been obtained in the transversal Kerr configuration, the magnetic form factor depends on the my component of the magnetisation.
where G is a generic reciprocal lattice vector.
On the other hand, the magnetic elements of the array are centrosymmetric, so the magnetic component of the intensity in the nth diffracted is proportional to
ΔInm∝2 fn Re[(rmpp/rpp) fnm]
Using the notation K = K′ + iK″ = (rmpp/rpp) [18], the magnetic component of the intensity in the nth diffracted may be rewritten as
ΔInm∝{Re[fnm] − (K″/K′)Im[fnm]}
There is no theory in the literature capable of describing the behaviour of K in the diffracted beams, so K″/K′ is considered to be proportional to the diffraction order [18] and its value may be estimated by an agreement between theory and experiments. For instance, the value of |K″/K′| for permalloy, a soft magnetic material similar to the amorphous Fe80B20 used herein, is in the range of 0 to 0.3 [10].
This way, the performed calculations are only valid for centrosymmetric magnetic elements embedded in a orthogonal array made of materials in which the value |K″/K′| is close to zero.
If |K″/K′| is tentatively set to zero in order to simplify the Kerr formula, some simple theoretical Kerr signals might be obtained for given magnetisation distributions [2]. Thus, assuming a given reversal path, simulated DMOKE vs. MOKE curves can be obtained by plotting the diffracted signal corresponding to the average magnetisation for each field value. Some illustrative examples are shown in Figure 2 and more examples can be found in [2].
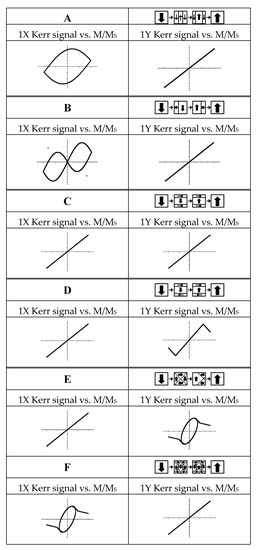
Figure 2.
Diffracted signal 1X (left) and 1Y (right) vs. magnetization for different inversion processes: (A) Propagation of two 180° domain wall parallel to the applied field. (B) Two consecutive propagations of a single 90° domain wall. (C) S state with domain walls situated at 1/6 square length of the edge. (D) C state with domain walls situated at 1/6 square length of the edge. (E) Vortex displacement along X axis (the so-called Landau domain structure). (F) Seven domains structure.
Our samples and measurements are within the limits of the theoretical model, so the Kerr formula is applicable. This way, plotting the Kerr signal vs. the average magnetisation, some reversal plots are obtained (Figure 3). If the assumption of |K″/K′|~0 is correct, comparing our experimental data from Figure 3 with the theoretical plots on Figure 2, the reversal mechanism that present our samples can be determined.
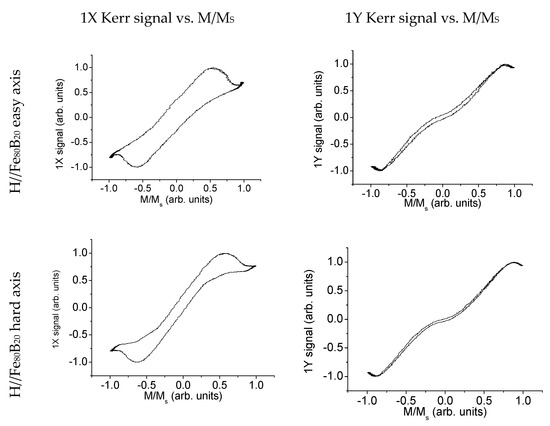
Figure 3.
Experimental 1st order diffracted magneto-optic (MO) signal vs. average magnetisation for arrays of 5 μm edged Fe80B20 squares separated 1 μm. Data are shown when the field is applied both along the easy (top row) and the hard Fe80B20 axis (bottom row) and parallel to the square edges.
According to the data in both Figure 2 and Figure 3, the magnetic elements of our sample should present a reversal mainly driven by a mixture of the Landau domain distribution (Figure 2E) and the seven domain structure (Figure 2F). In order to corroborate this statement, MFM measurements have been performed using a microscope (Nanotec Electrónica S.L., Madrid, Spain), operating at ambient conditions. The double scan method in non-contact mode was used to acquire the topography of the surface and the magnetic signal from the force gradient, which is a map of the magnetic poles at the sample surface. As no external field has been applied during the experiments, the obtained MFM images show the magnetic domain structure of the magnetic elements at remanence. Low moment probes from Veeco (main characteristics: CoCr coating, force constant ~3 N/m, resonant frequency ~75 kHz and tip radius ~25 nm) and a relatively large distance between tip and sample (about 70 nm) have been used to minimise tip-induced perturbations [19]. Although during the first scan (the acquisition of topography) the tip was closer to the surface of the sample, perturbations or instabilities during the second scan (the acquisition of the magnetic signal) would have been observed if the tip-stray field had induced magnetic switching or domain wall displacements [20,21], phenomena that never appeared in our experiments.
As shown in Figure 4, with no applied field, the square elements of the array exhibit flux-closure remnant states with zero net magnetisation in any plane direction. About two-thirds of the elements exhibit the seven domain configuration shown in Figure 4d,f, i.e., having three large domains and four closure domains. As can be seen in Figure 4b for all the elements exhibiting such a seven domain state, the large domains are always aligned in the same direction, as a result of the small uniaxial anisotropy induced during the sample growth. If no anisotropy had been induced, probably the majority of the dots would exhibit the flux closure configuration with four domains shown in Figure 4c,e, the so-called Landau state. In this case, the sense of rotation of magnetisation can be clockwise or counter clockwise (Figure 4b).
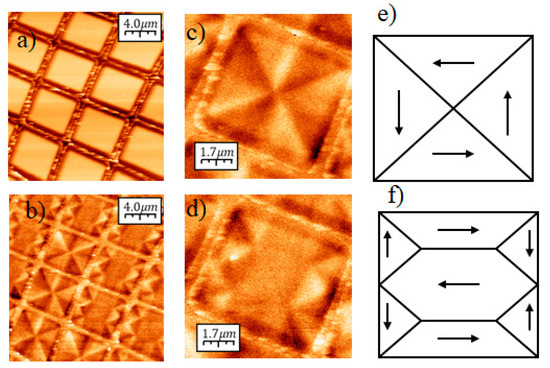
Figure 4.
(a,b) Topographic and magnetic images, respectively, simultaneously obtained by Magnetic Force Microscopy (MFM), of an array of square 5 μm edged dots. (c,d) Magnetic images of representative square dots exhibiting flux-closure magnetic structures with four and seven domains, respectively. These are the only two flux-closure magnetic structures present in the sample at remanence. (e,f) Schematic domain structures deduced from images (c,d), respectively.
Measurements performed at different areas of the array show that no other domain configurations are present. It is worth mentioning that the flux closure structures found herein—the Landau domain distribution and the seven domain structure (also called diamond state)—are the two magnetisation patterns with the lowest energies for magnetic elements with these dimensions [22]. Besides, they exhibit energies that are quite similar [23], so the elements can drop in one state or the other when coming from a saturated state, i.e., when the applied field was first high enough to saturate them and then was later reduced to zero [24]. In our case, as mentioned above, the small uniaxial anisotropy induced during the sample growth is able to induce a preferential path, and as a result 2/3 of the elements end in the diamond state.
3. Conclusions
It has been demonstrated that, under certain conditions, it is possible to deduce the magnetisation distribution and guess the process of the magnetisation reversal using the information provided by both MOKE and DMOKE signals. This is demonstrated for the particular case of arrays of Fe80B20 5 µm edged magnetic elements separated 1 µm. For these arrays, the magneto-optical response is measured both at reflected and diffracted beams. From the hysteresis loops at both the reflected and the diffracted signal, Kerr signal vs. average magnetisation plots are made up. These plots are then compared with the ones obtained applying the Kerr formula to some well-known reversal mechanisms. The comparison between theory and experiments allows for the prediction of the reversal mechanisms present in the magnetic elements of the sample. These predictions are then validated with experimental magnetic domain MFM images at remanence.
In summary, diffractive magneto-optic measurements can be used to obtain information on the global magnetic behaviour of an array of magnetic elements, which in turn is the global response of the contributions from the magnetic state of each individual element that are revealed by local microscopy techniques.
Author Contributions
R.Á.-S. and J.L.C.-K. fabricated the samples and performed the magneto-optical measurements, J.M.G.-M. performed the magnetic force microscopy experiments. F.B. and J.L.C.-K. built and optimized the DMOKE measurement setup, and all authors wrote the manuscript. All authors have read and agreed to the published version of the manuscript.
Funding
The authors acknowledge the service from the MiNa Laboratory at IMN funded by Comunidad de Madrid (S2018/NMT-4291 TEC2SPACE), MINECO (CSIC13-4E-1794) and the European Union (FEDER, FSE).
Conflicts of Interest
The authors declare no conflict of interest.
References
- García-Mochales, P.; Costa-Krämer, J.L.; Armelles, G.; Briones, F. Simulations and experiments on magneto-optical diffraction by an array of epitaxial Fe (001) microsquares. Appl. Phys. Lett. 2002, 81, 3206. [Google Scholar] [CrossRef]
- Costa-Krämer, J.L.; Alvarez-Sánchez, R.; Bengoechea, A.; Torres, F.; García-Mochales, P.; Briones, F. Diffractive magneto-optics, magnetic interactions, and reversal mechanisms in Co microsquare arrays. Phys. Rev. B 2005, 71, 104420. [Google Scholar] [CrossRef]
- Jaque, D.; Martín, J.I.; Armelles, G.; Costa-Krämer, J.L.; Briones, F.; Vicent, J.L. Nanopatterning effects on magnetic anisotropy of epitaxial Fe(001) micrometric squares. J. Appl. Phys. 2002, 91, 382. [Google Scholar] [CrossRef][Green Version]
- Vavassori, P.; Grimsditch, M.; Novosad, V.; Metlushko, V.; Ilic, B. Metastable states during magnetization reversal in square permalloy rings. Phys. Rev. B 2003, 67, 134429. [Google Scholar] [CrossRef]
- Guedes, I.; Grimsditch, M.; Novosad, V.; Vavassori, P.; Camley, R.; Ilic, B.; Kumar, R. Magnetization reversal in an Fe film with an array of elliptical holes on a square lattice. Phys. Rev. B 2003, 67, 024428. [Google Scholar] [CrossRef]
- Schmitte, T.; Schemberg, T.; Westerholt, K.; Zabel, H. Magneto-optical Kerr effects of ferromagnetic Ni-gratings. J. Appl. Phys. 2000, 87, 5630. [Google Scholar] [CrossRef]
- Souche, Y.; Geoffroy, O.; Novosad, V.; Pishko, V.; Pannetier, B. Magneto-optical diffraction by a relief grating. J. Magn. Soc. Jpn. 1996, 20, 393. [Google Scholar] [CrossRef]
- Schmitte, T.; Westerholt, K.; Zabel, H. Magneto-optical Kerr effect in the diffracted light of Fe gratings. J. Appl. Phys. 2002, 92, 4524. [Google Scholar] [CrossRef]
- Costa-Krämer, J.L.; Rao, K.V. Influence of magnetostiction on magneto impedance in soft ferromafnetic wires. IEEE Trans. Mag. 1995, 31, 1261. [Google Scholar] [CrossRef]
- Grimsditch, M.; Vavassori, P.; Novosad, V.; Metlushko, V.; Shima, H.; Otani, Y.; Fukamichi, K. Vortex chirality in an array of ferromagnetic dots. Phys. Rev. B 2002, 65, 172419. [Google Scholar] [CrossRef]
- Geoffroy, O.; Givord, D.; Otani, Y.; Pannetier, B.; Santos, A.D.; Schlenker, M.; Souche, Y. TMOKE hysteresis loops in Bragg diffraction from 2D patterns. J. Magn. Magn. Mater. 1993, 121, 516. [Google Scholar] [CrossRef]
- Vavassori, P.; Metlushko, V.; Grimsditch, M.; Ilic, B.; Neuzil, P.; Kumar, R. Magneto-optical studies of superlattice dot arrays. Phys. Rev. B 2000, 61, 5895. [Google Scholar]
- Guedes, I.; Zaluzec, N.J.; Grimsditch, M.; Metlushko, V.; Vavassori, P.; Ilic, B.; Neuzil, P.; Kumar, R. Magnetization of negative magnetic arrays: Elliptical holes on a square lattice. Phys. Rev. B 2000, 62, 11719. [Google Scholar]
- Guedes, I.; Grimsditch, M.; Metlushko, V.; Vavassori, P.; Camley, R.; Ilic, B.; Neuzil, P.; Kumar, R. Domain formation in arrays of square holes in an Fe film. Phys. Rev. B 2002, 66, 014434. [Google Scholar] [CrossRef]
- Vavassori, P.; Metlushko, V.; Osgood, R.M.; Grimsditch, M.; Welp, U.; Crabtree, G.; Fan, W.; Brueck, S.R.J.; Ilic, B.; Hesketh, P.J. Magnetic information in the light diffracted by a negative dot array of Fe. Phys. Rev. B 1999, 59, 6337. [Google Scholar] [CrossRef]
- Costa-Krämer, J.L.; Martín, J.I.; Menéndez, J.L.; Cebollada, A.; Anguita, J.V.; Briones, F.; Vicent, J.L. Epitaxial Fe (001) micro tiling: Size and interaction effects. Appl. Phys. Lett. 2000, 76, 3091. [Google Scholar] [CrossRef]
- Grimsditch, M.; Vavassori, P. The diffracted magneto-optic Kerr effect: What does it tell you? J. Phys. Condens. Matter 2004, 16, R275. [Google Scholar] [CrossRef]
- Qiu, Z.Q.; Bader, S.D. Surface magneto-optic Kerr effect. Rev. Sci. Instrum. 2000, 71, 1243. [Google Scholar] [CrossRef]
- García, J.M.; Thiaville, A.; Miltat, J.; Kirk, K.J.; Chapman, J.N. Quantitative interpretation of magnetic force microscopy images from soft patterned elements. Appl. Phys. Lett. 2001, 79, 656. [Google Scholar] [CrossRef][Green Version]
- García, J.M.; Thiaville, A.; Miltat, J.; Kirk, K.J.; Chapman, J.N. MFM imaging of patterned permalloy elements under an external applied field. J. Magn. Magn. Mater. 2002, 242, 1267. [Google Scholar]
- García, J.M.; Thiaville, A.; Miltat, J. MFM imaging of nanowires and elongated patterned elements. J. Magn. Magn. Mater. 2002, 249, 163. [Google Scholar] [CrossRef]
- Meier, G.; Halverscheid, M.; Matsuyama, T.; Merkt, U. Investigation of ferromagnetic microstructures as electrodes for spin-polarized transport experiments. J. Appl. Phys. 2001, 89, 7469. [Google Scholar] [CrossRef]
- Hertel, R. Thickness dependence of magnetization structures in thin Permalloy rectangles. Zeitschrift für Metallkunde 2002, 93, 957. [Google Scholar] [CrossRef][Green Version]
- Gomez, R.D.; Luu, T.V.; Pak, A.O.; Mayergoyz, I.D. Domain wall motion in micron-sized permalloy elements. J. Appl. Phys. 1999, 85, 4598. [Google Scholar] [CrossRef]


© 2020 by the authors. Licensee MDPI, Basel, Switzerland. This article is an open access article distributed under the terms and conditions of the Creative Commons Attribution (CC BY) license (http://creativecommons.org/licenses/by/4.0/).