Spin-Crossover Complexes in Direct Contact with Surfaces


Abstract
1. Introduction
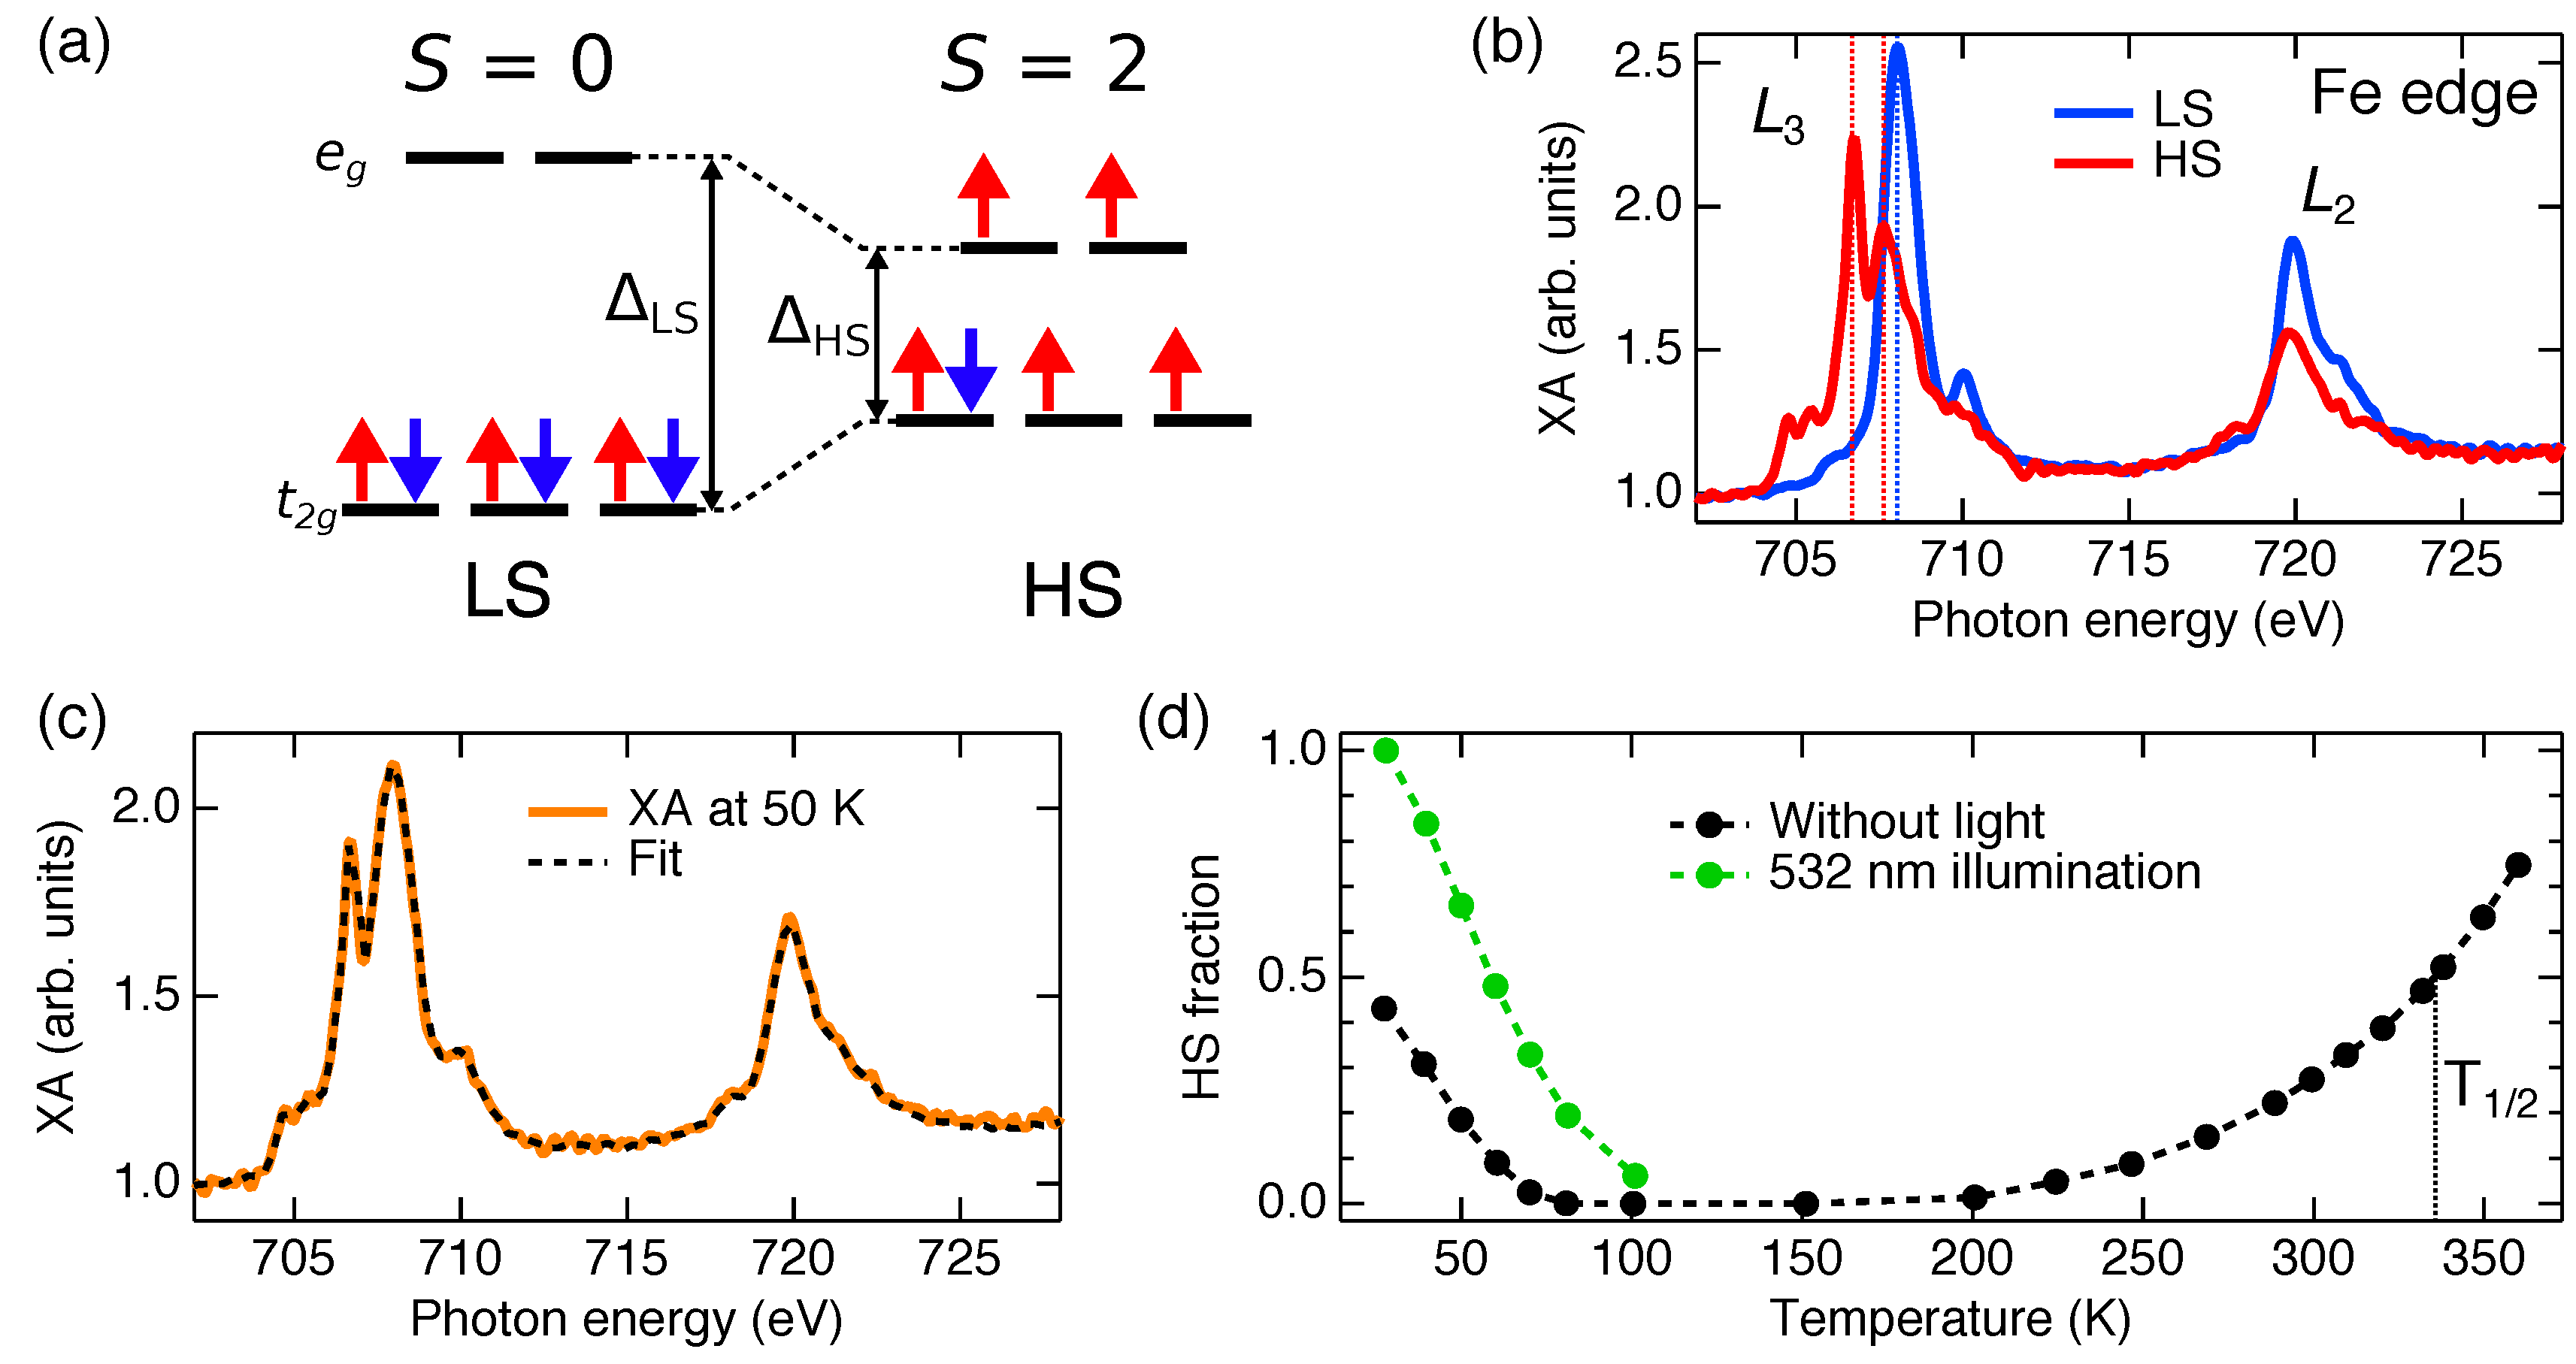
2. NEXAFS Methodology for Spin-State Determination and Related Challenges
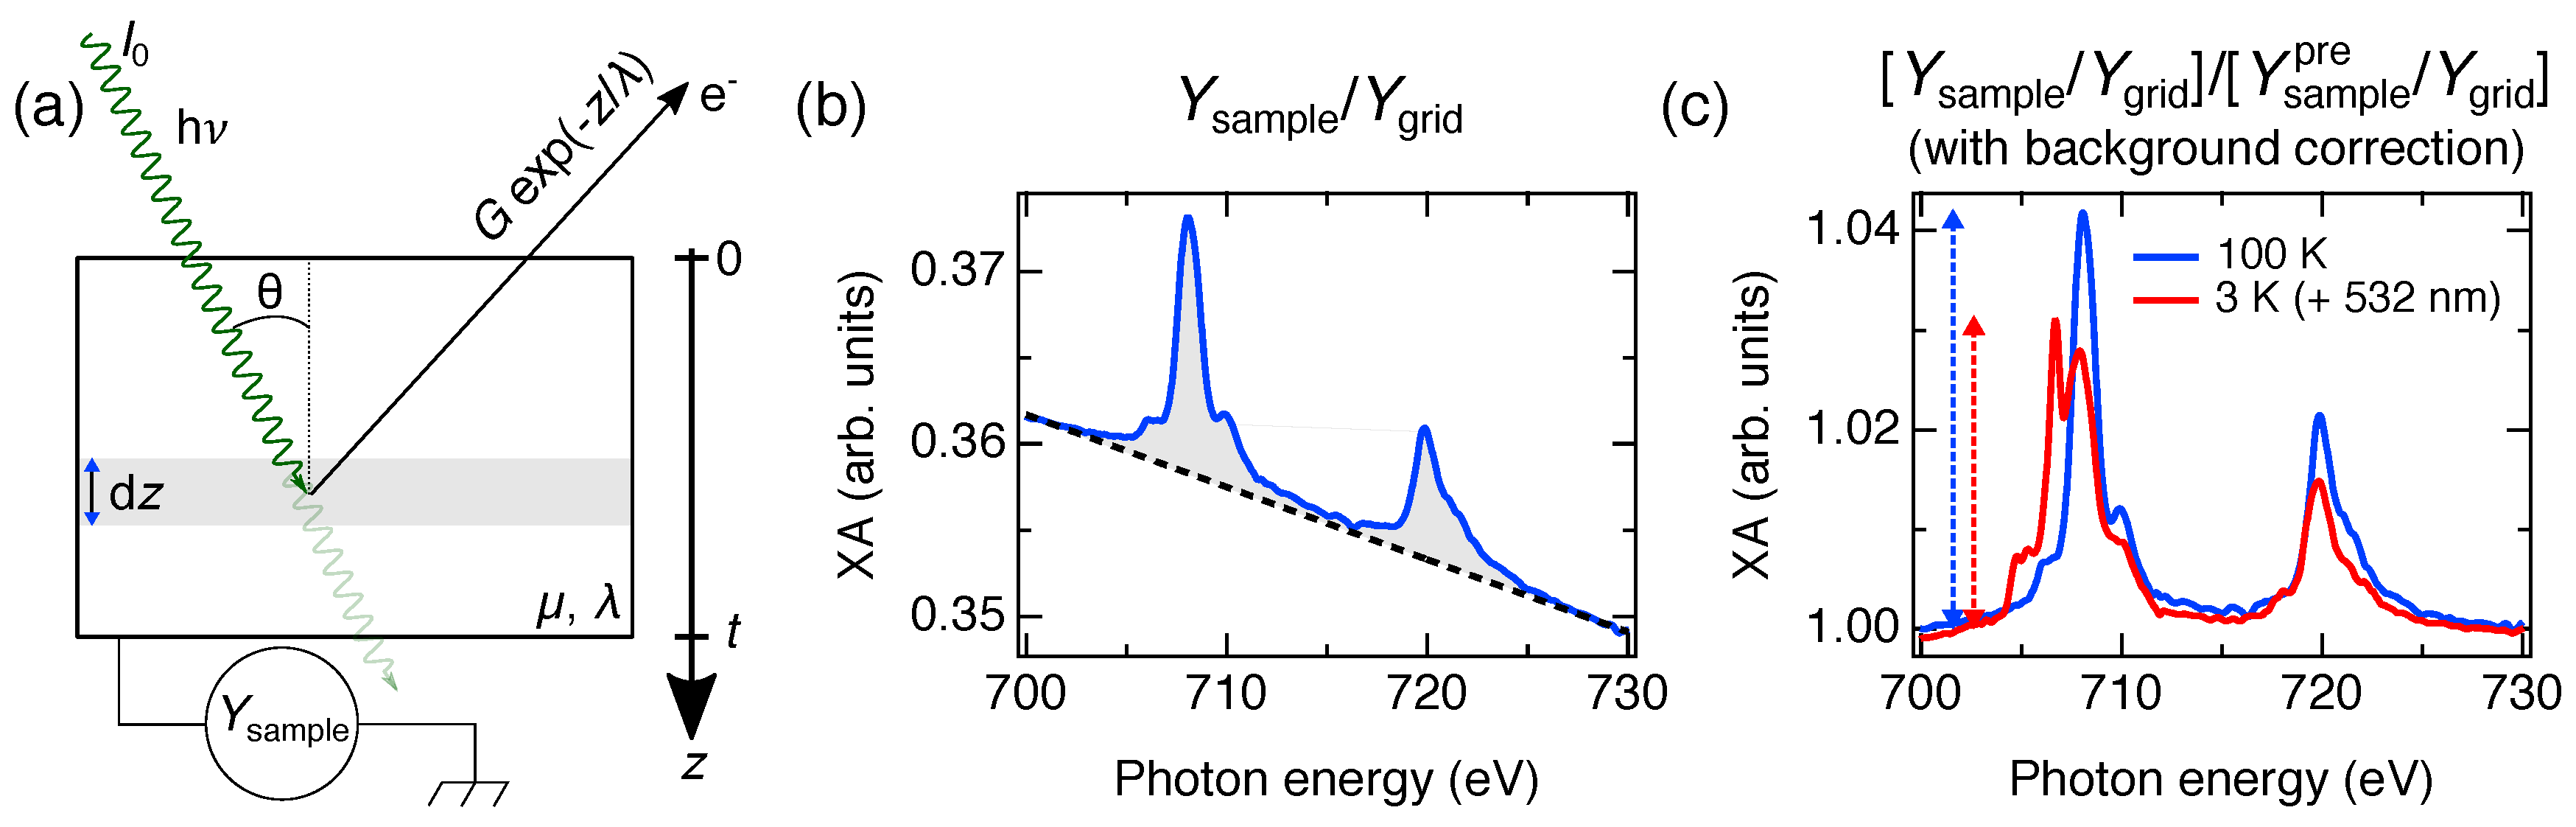
3. Thickness Determination in NEXAFS Experiments
4. Fragmentation of SCO Complexes on Metal Substrates
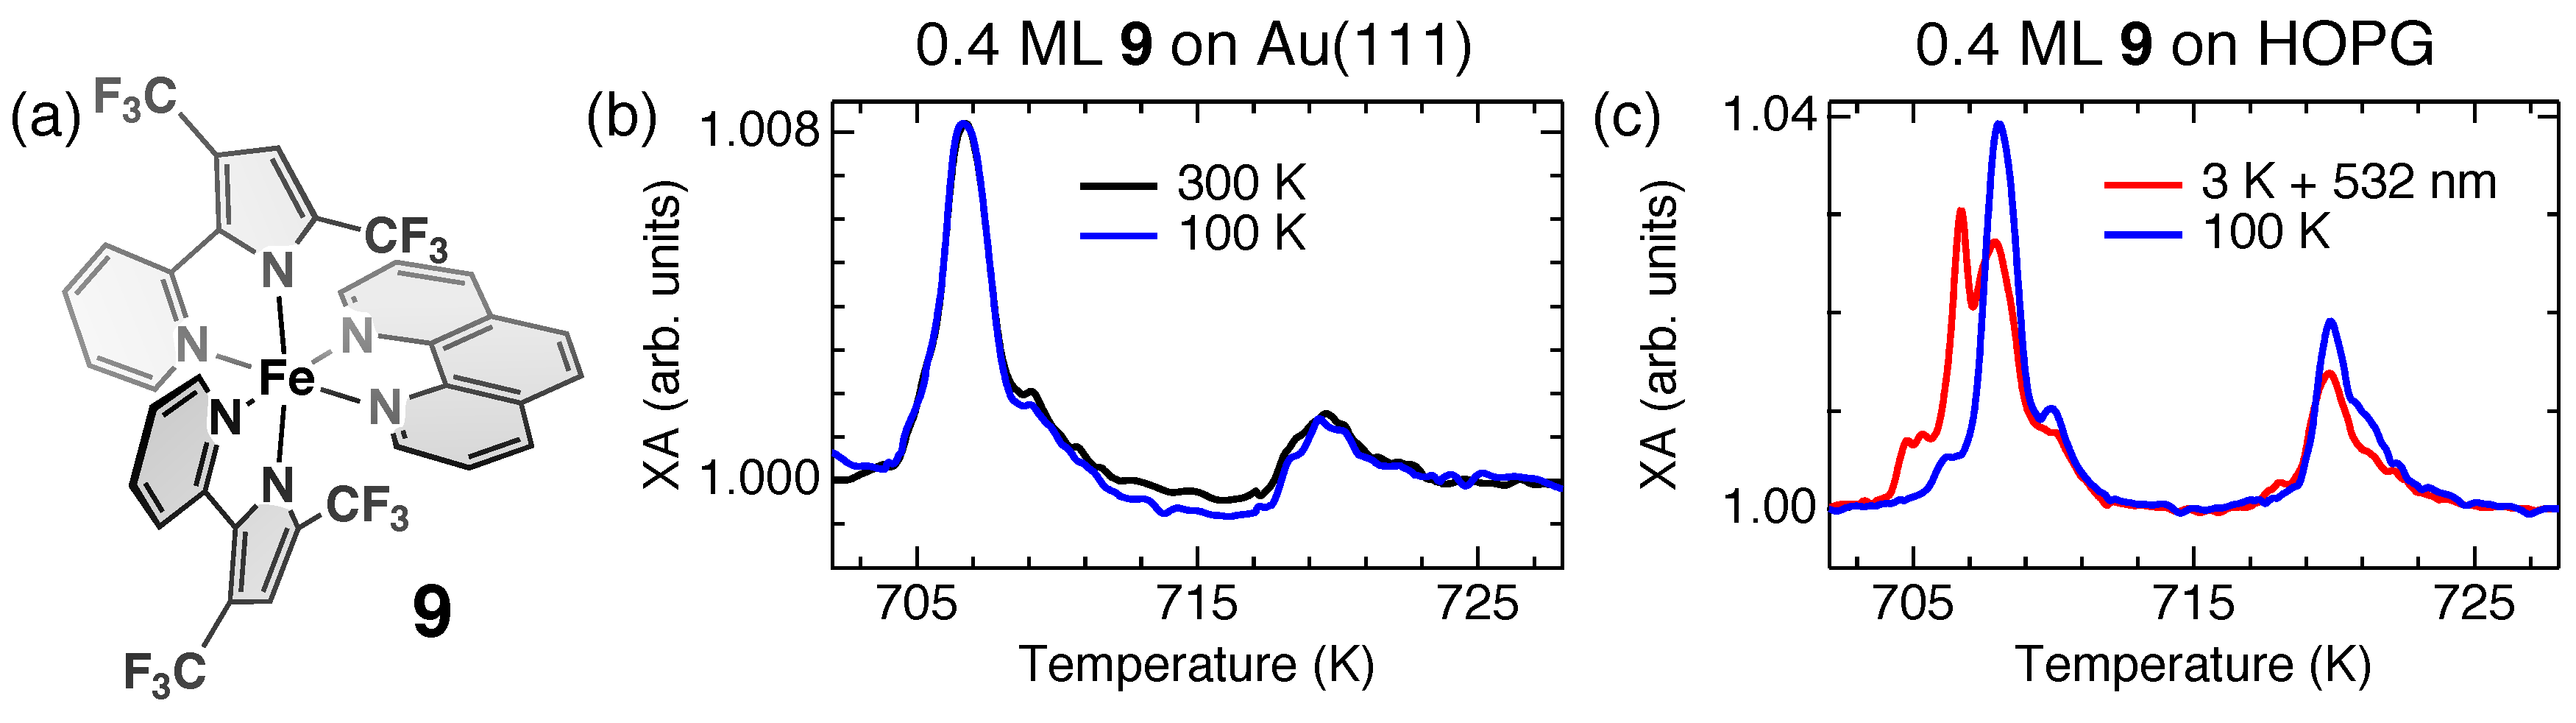
5. Spin-State Coexistence
6. Distinction between Fragmentation and Spin-State Coexistence
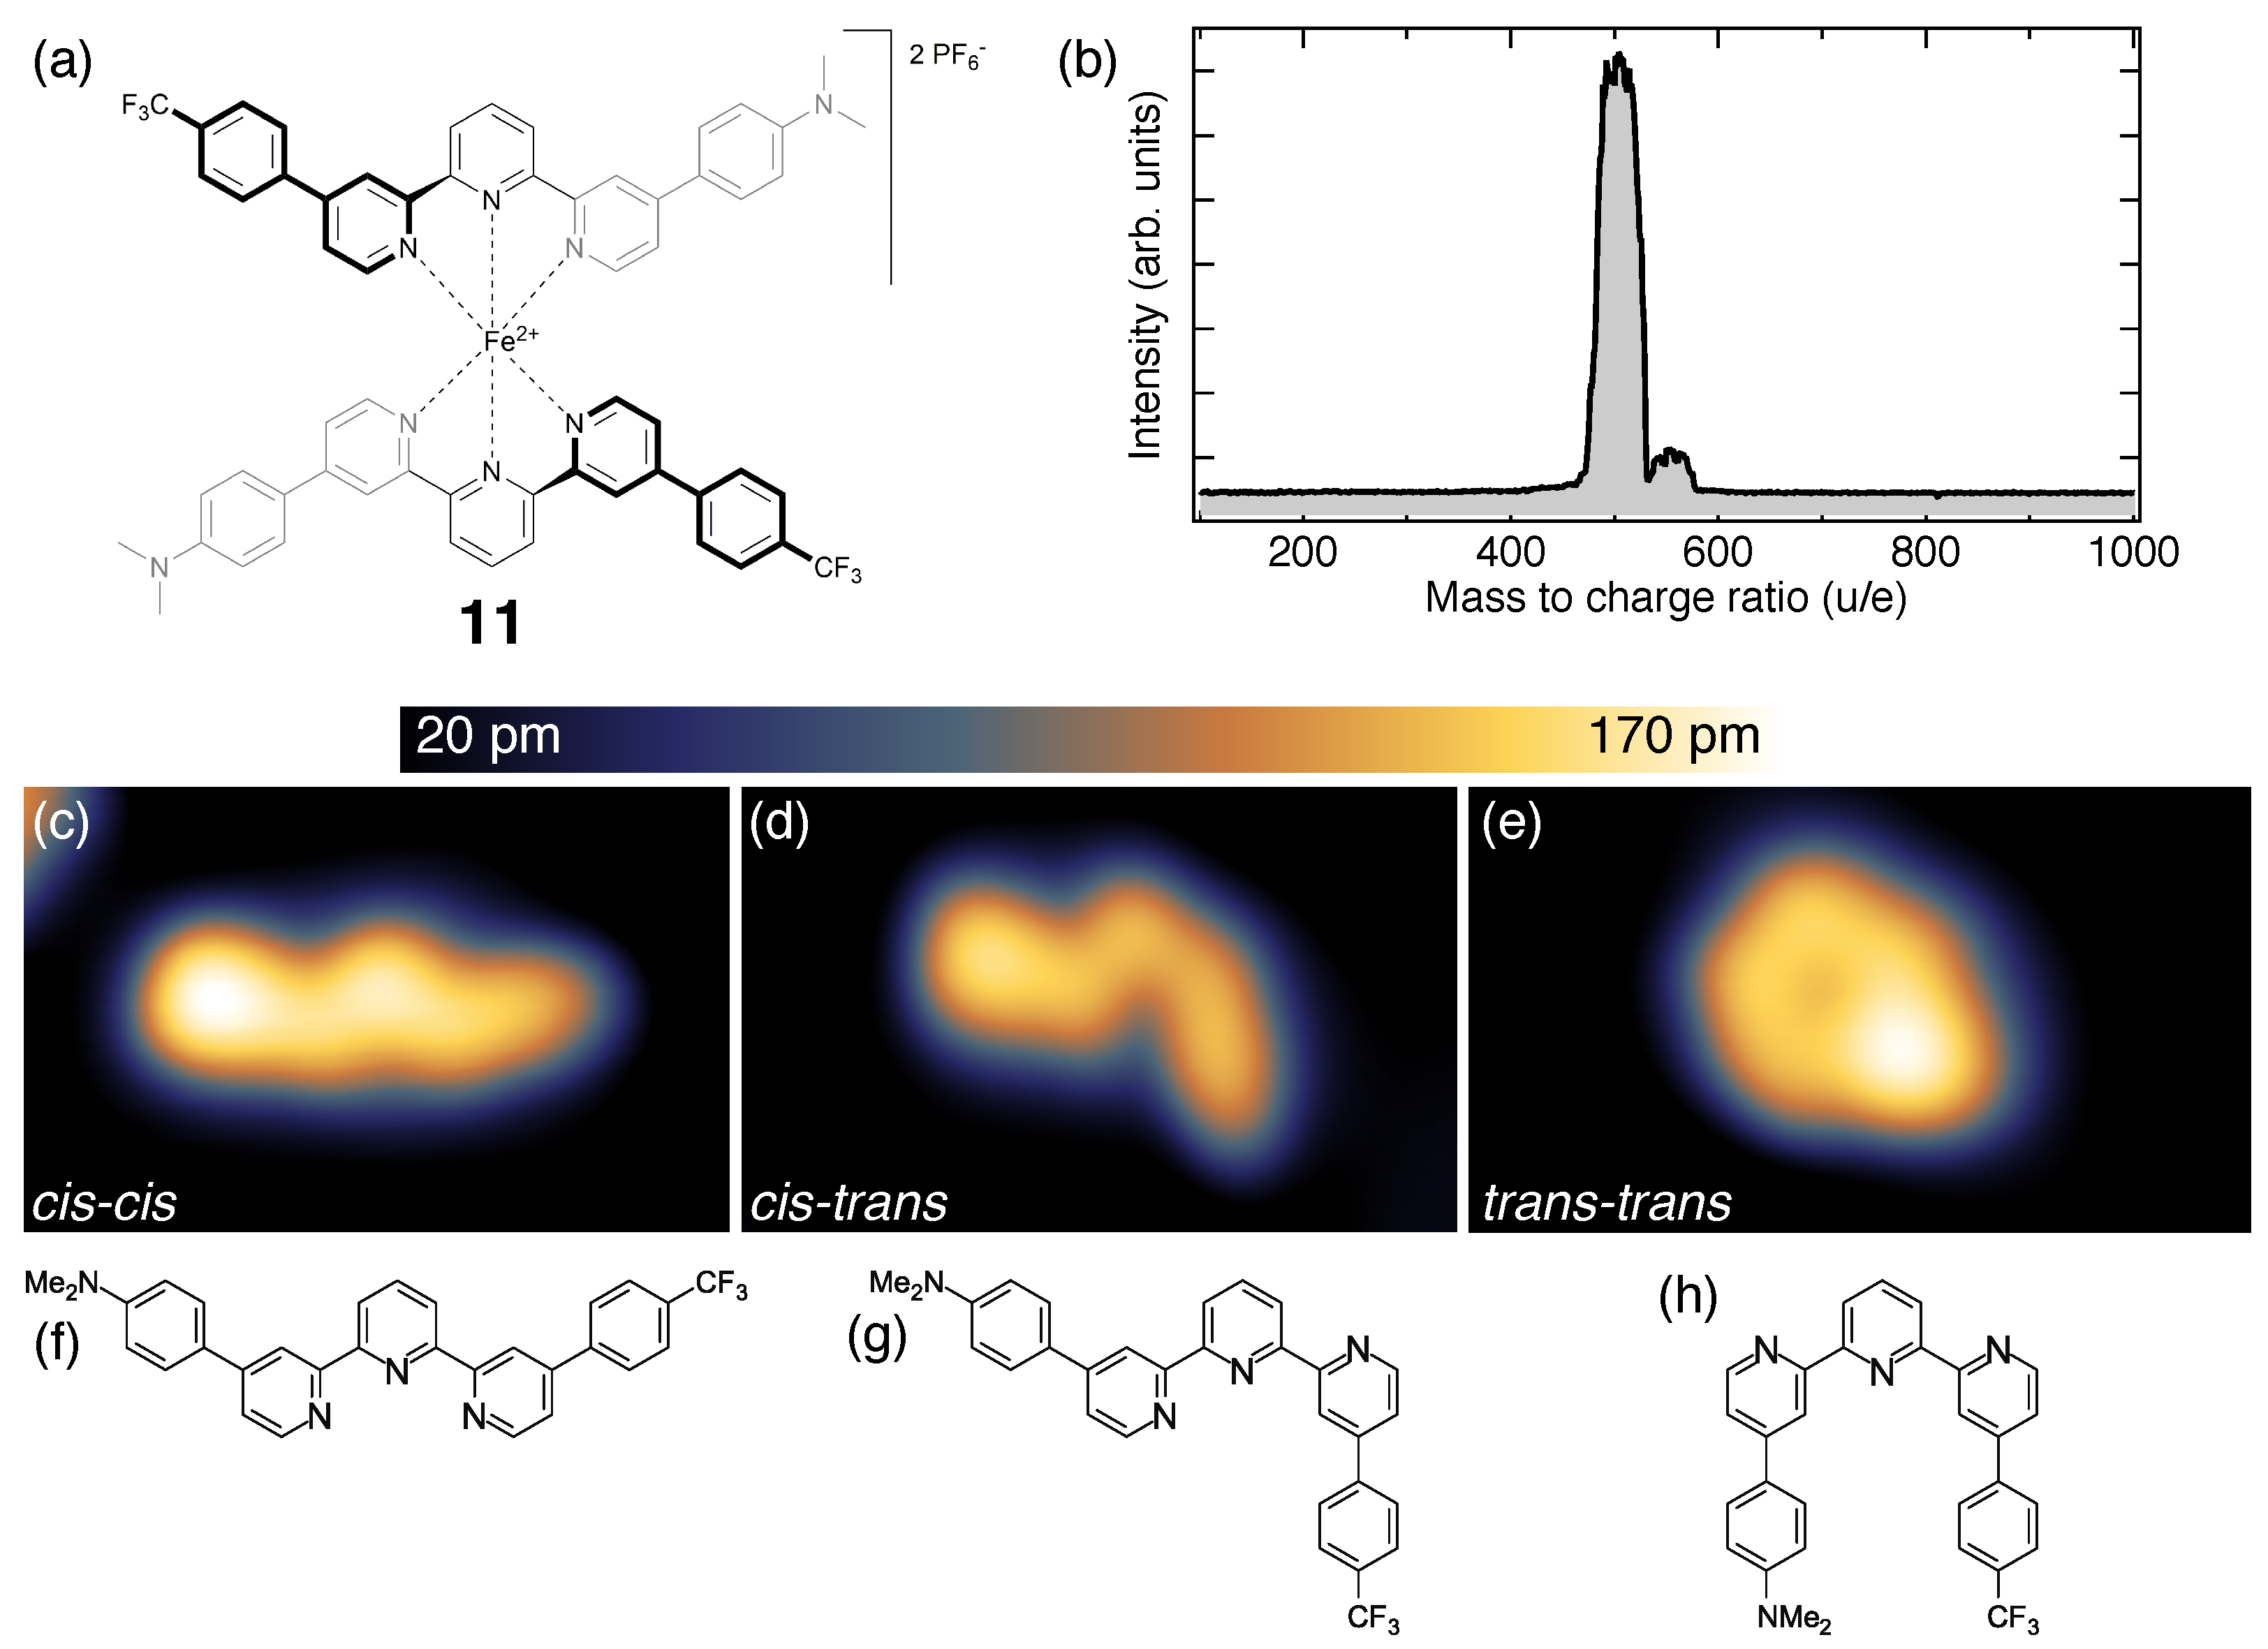
7. Identification of the Spin States with STM
8. Conclusions
Funding
Acknowledgments
Conflicts of Interest
Abbreviations
| HOPG | Highly oriented pyrolytic graphite |
| HS | High spin |
| LIESST | Light-induced excited spin-state trapping |
| LS | Low spin |
| ML | Monolayer |
| NEXAFS | Near-edge X-ray absorption fine structure |
| SCO | Spin crossover |
| SOXIESST | Soft X-ray induced excited spin-state trapping |
| STM | Scanning tunneling microscopy |
| TEY | Total electron yield |
Appendix A

References
- Gütlich, P.; Garcia, Y.; Goodwin, H.A. Spin crossover phenomena in Fe (II) complexes. Chem. Soc. Rev. 2000, 29, 419–427. [Google Scholar] [CrossRef]
- Halcrow, M.A. Spin-Crossover Materials: Properties and Applications, 1st ed.; Wiley: Chichester, UK, 2013. [Google Scholar]
- Kahn, O.; Kröber, J.; Jay, C. Spin Transition Molecular Materials for displays and data recording. Adv. Mater. 1992, 4, 718–728. [Google Scholar] [CrossRef]
- Shepherd, H.J.; Molnár, G.; Nicolazzi, W.; Salmon, L.; Bousseksou, A. Spin Crossover at the Nanometre Scale. Eur. J. Inorg. Chem. 2012, 2013, 653–661. [Google Scholar] [CrossRef]
- Molnár, G.; Salmon, L.; Nicolazzi, W.; Terki, F.; Bousseksou, A. Emerging properties and applications of spin crossover nanomaterials. J. Mater. Chem. 2014, 2, 1360. [Google Scholar] [CrossRef]
- Molnár, G.; Rat, S.; Salmon, L.; Nicolazzi, W.; Bousseksou, A. Spin Crossover Nanomaterials: From Fundamental Concepts to Devices. Adv. Mater. 2017, 2017, 17003862. [Google Scholar] [CrossRef] [PubMed]
- Shepherd, H.J.; Gural’skiy, I.A.; Quintero, C.M.; Tricard, S.; Salmon, L.; Molnár, G.; Bousseksou, A. Molecular actuators driven by cooperative spin-state switching. Nat. Commun. 2013, 4, 2607. [Google Scholar] [CrossRef] [PubMed]
- Diaconu, A.; Lupu, S.L.; Rusu, I.; Risca, I.M.; Salmon, L.; Molnár, G.; Bousseksou, A.; Demont, P.; Rotaru, A. Piezoresistive Effect in the [Fe(Htrz)2(trz)](BF4) Spin Crossover Complex. J. Phys. Chem. Lett. 2017, 8, 3147–3151. [Google Scholar] [CrossRef]
- Kahn, O.; Martinez, C.J. Spin-transition polymers: From molecular materials toward memory devices. Science 1998, 279, 44–48. [Google Scholar] [CrossRef]
- Shalabaeva, V.; Ridier, K.; Rat, S.; Manrique-Juarez, M.D.; Salmon, L.; Séguy, I.; Rotaru, A.; Molnár, G.; Bousseksou, A. Room temperature current modulation in large area electronic junctions of spin crossover thin films. Appl. Phys. Lett. 2018, 112, 013301. [Google Scholar] [CrossRef]
- Hao, G.; Mosey, A.; Jiang, X.; Yost, A.J.; Sapkota, K.R.; Wang, G.T.; Zhang, X.; Zhang, J.; N’Diaye, A.T.; Cheng, R.; et al. Nonvolatile voltage controlled molecular spin state switching. Appl. Phys. Lett. 2019, 114, 032901. [Google Scholar] [CrossRef]
- Gee, A.; Jaafar, A.H.; Brachňaková, B.; Massey, J.; Marrows, C.H.; Šalitroš, I.; Kemp, N.T. Multilevel Resistance Switching and Enhanced Spin Transition Temperature in Single- and Double-Molecule Spin Crossover Nanogap Devices. J. Phys. Chem. C 2020, 124, 13393–13399. [Google Scholar] [CrossRef]
- Zhang, Y.; Séguy, I.; Ridier, K.; Shalabaeva, V.; Piedrahita-Bello, M.; Rotaru, A.; Salmon, L.; Molnár, G.; Bousseksou, A. Resistance switching in large-area vertical junctions of the molecular spin crossover complex [Fe(HB(tz)3)2]: ON/OFF ratios and device stability. J. Phys. Condens. Matter 2020, 32, 214010. [Google Scholar] [CrossRef] [PubMed]
- Geest, E.P.; Shakouri, K.; Fu, W.; Robert, V.; Tudor, V.; Bonnet, S.; Schneider, G.F. Contactless Spin Switch Sensing by Chemo-Electric Gating of Graphene. Adv. Mater. 2020, 32, 1903575. [Google Scholar] [CrossRef] [PubMed]
- Linares, J.; Codjovi, E.; Garcia, Y. Pressure and Temperature Spin Crossover Sensors with Optical Detection. Sensors 2012, 12, 4479–4492. [Google Scholar] [CrossRef] [PubMed]
- Bartual-Murgui, C.; Akou, A.; Thibault, C.; Molnár, G.; Vieu, C.; Salmon, L.; Bousseksou, A. Spin-crossover metal–organic frameworks: Promising materials for designing gas sensors. J. Mater. Chem. C 2015, 3, 1277–1285. [Google Scholar] [CrossRef]
- Jureschi, C.; Linares, J.; Rotaru, A.; Ritti, M.; Parlier, M.; Dîrtu, M.; Wolff, M.; Garcia, Y. Pressure Sensor via Optical Detection Based on a 1D Spin Transition Coordination Polymer. Sensors 2015, 15, 2388–2398. [Google Scholar] [CrossRef]
- Jureschi, C.M.; Linares, J.; Boulmaali, A.; Dahoo, P.; Rotaru, A.; Garcia, Y. Pressure and Temperature Sensors Using Two Spin Crossover Materials. Sensors 2016, 16, 187. [Google Scholar] [CrossRef]
- Boukheddaden, K.; Ritti, M.H.; Bouchez, G.; Sy, M.; Dîrtu, M.M.; Parlier, M.; Linares, J.; Garcia, Y. Quantitative Contact Pressure Sensor Based on Spin Crossover Mechanism for Civil Security Applications. J. Phys. Chem. C 2018, 122, 7597–7604. [Google Scholar] [CrossRef]
- Benaicha, B.; Van Do, K.; Yangui, A.; Pittala, N.; Lusson, A.; Sy, M.; Bouchez, G.; Fourati, H.; Gómez-García, C.J.; Triki, S.; et al. Interplay between spin-crossover and luminescence in a multifunctional single crystal iron(ii) complex: Towards a new generation of molecular sensors. Chem. Sci. 2019, 10, 6791–6798. [Google Scholar] [CrossRef]
- Bousseksou, A.; Molnár, G.; Tuchagues, J.P.; Menéndez, N.; Codjovi, É.; Varret, F. Triggering the spin-crossover of Fe(phen)2(NCS)2 by a pressure pulse. Pressure and magnetic field induce mirror effects. C. R. Chim. 2003, 6, 329–335. [Google Scholar] [CrossRef]
- Halcrow, M.A. Manipulating metal spin states for biomimetic, catalytic and molecular materials chemistry. Dalton Trans. 2020. [Google Scholar] [CrossRef] [PubMed]
- Rohlf, S.; Gruber, M.; Flöser, B.M.; Grunwald, J.; Jarausch, S.; Diekmann, F.; Kalläne, M.; Jasper-Toennies, T.; Buchholz, A.; Plass, W.; et al. Light-Induced Spin Crossover in an Fe(II) Low-Spin Complex Enabled by Surface Adsorption. J. Phys. Chem. Lett. 2018, 9, 1491–1496. [Google Scholar] [CrossRef] [PubMed]
- Rohlf, S.; Grunwald, J.; Jasper-Toennies, T.; Johannsen, S.; Diekmann, F.; Studniarek, M.; Berndt, R.; Tuczek, F.; Rossnagel, K.; Gruber, M. Influence of Substrate Electronic Properties on the Integrity and Functionality of an Adsorbed Fe(II) Spin-Crossover Compound. J. Phys. Chem. 2019, 123, 17774. [Google Scholar] [CrossRef]
- Brandl, T.; Johannsen, S.; Häussinger, D.; Suryadevara, N.; Prescimone, A.; Bernhard, S.; Gruber, M.; Ruben, M.; Berndt, R.; Mayor, M. Iron in a cage: Fixation of a Fe(II)tpy2 complex by fourfold interlinking. Angew. Chem. Int. Ed. 2020. [Google Scholar] [CrossRef]
- Hamann, C.; Woltmann, R.; Hong, I.P.; Hauptmann, N.; Karan, S.; Berndt, R. Ultrahigh vacuum deposition of organic molecules by electrospray ionization. Rev. Sci. Instrum. 2011, 82, 033903. [Google Scholar] [CrossRef]
- Shi, S.; Schmerber, G.; Arabski, J.; Beaufrand, J.B.; Kim, D.J.; Boukari, S.; Bowen, M.; Kemp, N.T.; Viart, N.; Rogez, G.; et al. Study of molecular spin-crossover complex Fe(phen)2(NCS)2 thin films. Appl. Phys. Lett. 2009, 95, 043303. [Google Scholar] [CrossRef]
- Kumar, K.S.; Ruben, M. Sublimable Spin Crossover Complexes: From Spin-State Switching to Molecular Devices. Angew. Chem. 2019. [Google Scholar] [CrossRef]
- Jasper-Tönnies, T.; Gruber, M.; Karan, S.; Jacob, H.; Tuczek, F.; Berndt, R. Deposition of a Cationic FeIII Spin-Crossover Complex on Au(111): Impact of the Counter Ion. J. Phys. Chem. Lett. 2017, 8, 1569–1573. [Google Scholar] [CrossRef]
- Miyamachi, T.; Gruber, M.; Davesne, V.; Bowen, M.; Boukari, S.; Joly, L.; Scheurer, F.; Rogez, G.; Yamada, T.K.; Ohresser, P.; et al. Robust spin crossover and memristance across a single molecule. Nat. Commun. 2012, 3, 938. [Google Scholar] [CrossRef]
- Gruber, M.; Davesne, V.; Bowen, M.; Boukari, S.; Beaurepaire, E.; Wulfhekel, W.; Miyamachi, T. Spin state of spin-crossover complexes: From single molecules to ultrathin films. Phys. Rev. B 2014, 89, 195415. [Google Scholar] [CrossRef]
- Gruber, M. Electronic and Magnetic Properties of Hybrid Interfaces. From Single Molecules to Ultra-Thin Molecular Films on Metallic Substrates. Ph.D. Thesis, Univeristy of Strasbourg and Karlsruhe Institute of Technology, Strasbourg, France, 2014. [Google Scholar]
- Gueddida, S.; Gruber, M.; Miyamachi, T.; Beaurepaire, E.; Wulfhekel, W.; Alouani, M. Exchange Coupling of Spin-Crossover Molecules to Ferromagnetic Co Islands. J. Phys. Chem. Lett. 2016, 7, 900–904. [Google Scholar] [CrossRef] [PubMed]
- Gruber, M.; Miyamachi, T.; Davesne, V.; Bowen, M.; Boukari, S.; Wulfhekel, W.; Alouani, M.; Beaurepaire, E. Spin crossover in Fe(phen)2(NCS)2 complexes on metallic surfaces. J. Chem. Phys. 2017, 146, 092312. [Google Scholar] [CrossRef]
- Beniwal, S.; Sarkar, S.; Baier, F.; Weber, B.; Dowben, P.A.; Enders, A. Site selective adsorption of the spin crossover complex Fe(phen)2(NCS) on Au(111). J. Phys. Condens. Matter 2020, 32, 324003. [Google Scholar] [CrossRef] [PubMed]
- Naggert, H.; Bannwarth, A.; Chemnitz, S.; von Hofe, T.; Quandt, E.; Tuczek, F. First observation of light-induced spin change in vacuum deposited thin films of iron spin crossover complexes. Dalton Trans. 2011, 40, 6364–6366. [Google Scholar] [CrossRef] [PubMed]
- Palamarciuc, T.; Oberg, J.C.; El Hallak, F.; Hirjibehedin, C.F.; Serri, M.; Heutz, S.; Létard, J.F.; Rosa, P. Spin crossover materials evaporated under clean high vacuum and ultra-high vacuum conditions: From thin films to single molecules. J. Mater. Chem. 2012, 22, 9690–9695. [Google Scholar] [CrossRef]
- Gopakumar, T.G.; Matino, F.; Naggert, H.; Bannwarth, A.; Tuczek, F.; Berndt, R. Electron-Induced Spin Crossover of Single Molecules in a Bilayer on Gold. Angew. Chem. Int. Ed. 2012, 51, 6262–6266. [Google Scholar] [CrossRef]
- Gopakumar, T.G.; Bernien, M.; Naggert, H.; Matino, F.; Hermanns, C.F.; Bannwarth, A.; Mühlenberend, S.; Krüger, A.; Krüger, D.; Nickel, F.; et al. Spin-Crossover Complex on Au(111): Structural and Electronic Differences Between Mono- and Multilayers. Chem. A Eur. J. 2013, 19, 15702–15709. [Google Scholar] [CrossRef]
- Naggert, H.; Rudnik, J.; Kipgen, L.; Bernien, M.; Nickel, F.; Arruda, L.M.; Kuch, W.; Näther, C.; Tuczek, F. Vacuum-evaporable spin-crossover complexes: Physicochemical properties in the crystalline bulk and in thin films deposited from the gas phase. J. Mater. Chem. C 2015, 3, 7870–7877. [Google Scholar] [CrossRef]
- Bernien, M.; Naggert, H.; Arruda, L.M.; Kipgen, L.; Nickel, F.; Miguel, J.; Hermanns, C.F.; Krüger, A.; Krüger, D.; Schierle, E.; et al. Highly Efficient Thermal and Light-Induced Spin-State Switching of an Fe(II) Complex in Direct Contact with a Solid Surface. ACS Nano 2015, 9, 8960–8966. [Google Scholar] [CrossRef]
- Ossinger, S.; Naggert, H.; Kipgen, L.; Jasper-Toennies, T.; Rai, A.; Rudnik, J.; Nickel, F.; Arruda, L.M.; Bernien, M.; Kuch, W.; et al. Vacuum-Evaporable Spin-Crossover Complexes in Direct Contact with a Solid Surface: Bismuth versus Gold. J. Phys. Chem. C 2017, 121, 1210–1219. [Google Scholar] [CrossRef]
- Schleicher, F.; Studniarek, M.; Kumar, K.S.; Urbain, E.; Katcko, K.; Chen, J.; Frauhammer, T.; Hervé, M.; Halisdemir, U.; Kandpal, L.M.; et al. Linking Electronic Transport through a Spin Crossover Thin Film to the Molecular Spin State Using X-ray Absorption Spectroscopy Operando Techniques. ACS Appl. Mater. Interfaces 2018, 10, 31580–31585. [Google Scholar] [CrossRef] [PubMed]
- Poggini, L.; Milek, M.; Londi, G.; Naim, A.; Poneti, G.; Squillantini, L.; Magnani, A.; Totti, F.; Rosa, P.; Khusniyarov, M.; et al. Room temperature control of spin states in a thin film of a photochromic iron(ii) complex. Mater. Horizons 2018, 5, 506–513. [Google Scholar] [CrossRef]
- Poggini, L.; Londi, G.; Milek, M.; Naim, A.; Lanzilotto, V.; Cortigiani, B.; Bondino, F.; Magnano, E.; Otero, E.; Sainctavit, P.; et al. Surface effects on a photochromic spin-crossover iron II molecular switch adsorbed on highly oriented pyrolytic graphite. Nanoscale 2019, 11, 20006–20014. [Google Scholar] [CrossRef]
- Ossinger, S.; Kipgen, L.; Naggert, H.; Bernien, M.; Britton, A.J.; Nickel, F.; Arruda, L.M.; Kumberg, I.; Engesser, T.A.; Golias, E.; et al. Effect of ligand methylation on the spin-switching properties of surface-supported spin-crossover molecules. J. Phys. Condens. Matter 2020, 32, 114003. [Google Scholar] [CrossRef] [PubMed]
- Pronschinske, A.; Bruce, R.C.; Lewis, G.; Chen, Y.; Calzolari, A.; Buongiorno-Nardelli, M.; Shultz, D.A.; You, W.; Dougherty, D.B. Iron(II) spin crossover films on Au(111): Scanning probe microscopy and photoelectron spectroscopy. Chem. Commun. 2013, 49, 10446–10452. [Google Scholar] [CrossRef] [PubMed]
- Warner, B.; Oberg, J.C.; Gill, T.G.; El Hallak, F.; Hirjibehedin, C.F.; Serri, M.; Heutz, S.; Arrio, M.A.; Sainctavit, P.; Mannini, M.; et al. Temperature- and Light-Induced Spin Crossover Observed by X-ray Spectroscopy on Isolated Fe(II) Complexes on Gold. J. Phys. Chem. Lett. 2013, 4, 1546–1552. [Google Scholar] [CrossRef]
- Pronschinske, A.; Chen, Y.; Lewis, G.F.; Shultz, D.A.; Calzolari, A.; Buongiorno Nardelli, M.; Dougherty, D.B. Modification of Molecular Spin Crossover in Ultrathin Films. Nano Lett. 2013, 13, 1429–1434. [Google Scholar] [CrossRef]
- Zhang, X.; Palamarciuc, T.; Létard, J.F.; Rosa, P.; Lozada, E.V.; Torres, F.; Rosa, L.G.; Doudin, B.; Dowben, P.A. The spin state of a molecular adsorbate driven by the ferroelectric substrate polarization. Chem. Commun. 2014, 50, 2255–2257. [Google Scholar] [CrossRef]
- Zhang, X.; Costa, P.S.; Hooper, J.; Miller, D.P.; N’Diaye, A.T.; Beniwal, S.; Jiang, X.; Yin, Y.; Rosa, P.; Routaboul, L.; et al. Locking and Unlocking the Molecular Spin Crossover Transition. Adv. Mater. 2017, 29, 1702257. [Google Scholar] [CrossRef]
- Kipgen, L.; Bernien, M.; Nickel, F.; Naggert, H.; Britton, A.J.; Arruda, L.M.; Schierle, E.; Weschke, E.; Tuczek, F.; Kuch, W. Soft-X-ray-induced spin-state switching of an adsorbed Fe(II) spin-crossover complex. J. Phys. Condens. Matter 2017, 29, 394003. [Google Scholar] [CrossRef]
- Kumar, K.S.; Studniarek, M.; Heinrich, B.; Arabski, J.; Schmerber, G.; Bowen, M.; Boukari, S.; Beaurepaire, E.; Dreiser, J.; Ruben, M. Engineering On-Surface Spin Crossover: Spin-State Switching in a Self-Assembled Film of Vacuum-Sublimable Functional Molecule. Adv. Mater. 2018, 30, 1705416. [Google Scholar] [CrossRef] [PubMed]
- Wäckerlin, C.; Donati, F.; Singha, A.; Baltic, R.; Decurtins, S.; Liu, S.X.; Rusponi, S.; Dreiser, J. Excited Spin-State Trapping in Spin Crossover Complexes on Ferroelectric Substrates. J. Phys. Chem. C 2018, 122, 8202–8208. [Google Scholar] [CrossRef]
- Zhang, X.; N’Diaye, A.T.; Jiang, X.; Zhang, X.; Yin, Y.; Chen, X.; Hong, X.; Xu, X.; Dowben, P.A. Indications of magnetic coupling effects in spin cross-over molecular thin films. Chem. Commun. 2018, 54, 944–947. [Google Scholar] [CrossRef] [PubMed]
- Mahfoud, T.; Molnár, G.; Cobo, S.; Salmon, L.; Thibault, C.; Vieu, C.; Demont, P.; Bousseksou, A. Electrical properties and non-volatile memory effect of the [Fe(HB(pz)3)2] spin crossover complex integrated in a microelectrode device. Appl. Phys. Lett. 2011, 99, 053307. [Google Scholar] [CrossRef]
- Bernien, M.; Wiedemann, D.; Hermanns, C.F.; Krüger, A.; Rolf, D.; Kroener, W.; Müller, P.; Grohmann, A.; Kuch, W. Spin Crossover in a Vacuum-Deposited Submonolayer of a Molecular Iron(II) Complex. J. Phys. Chem. Lett. 2012, 3, 3431–3434. [Google Scholar] [CrossRef]
- Davesne, V.; Gruber, M.; Studniarek, M.; Doh, W.H.; Zafeiratos, S.; Joly, L.; Sirotti, F.; Silly, M.G.; Gaspar, A.B.; Real, J.A.; et al. Hysteresis and change of transition temperature in thin films of Fe{[Me2Pyrz3]BH}2, a new sublimable spin-crossover molecule. J. Chem. Phys. 2015, 142, 194702. [Google Scholar] [CrossRef]
- Bairagi, K.; Iasco, O.; Bellec, A.; Kartsev, A.; Li, D.; Lagoute, J.; Chacon, C.; Girard, Y.; Rousset, S.; Miserque, F.; et al. Molecular-scale dynamics of light-induced spin cross-over in a two-dimensional layer. Nat. Commun. 2016, 7, 12212. [Google Scholar] [CrossRef]
- Bairagi, K.; Bellec, A.; Fourmental, C.; Iasco, O.; Lagoute, J.; Chacon, C.; Girard, Y.; Rousset, S.; Choueikani, F.; Otero, E.; et al. Temperature-, Light-, and Soft X-ray-Induced Spin Crossover in a Single Layer of FeII-Pyrazolylborate Molecules in Direct Contact with Gold. J. Phys. Chem. C 2017, 122, 727. [Google Scholar] [CrossRef]
- Iasco, O.; Boillot, M.L.; Bellec, A.; Guillot, R.; Rivière, E.; Mazerat, S.; Nowak, S.; Morineau, D.; Brosseau, A.; Miserque, F.; et al. The disentangling of hysteretic spin transition, polymorphism and metastability in bistable thin films formed by sublimation of bis(scorpionate) Fe(II) molecules. J. Mater. Chem. C 2017, 5, 11067. [Google Scholar] [CrossRef]
- Fourmental, C.; Mondal, S.; Banerjee, R.; Bellec, A.; Garreau, Y.; Coati, A.; Chacon, C.; Girard, Y.; Lagoute, J.; Rousset, S.; et al. Importance of Epitaxial Strain at a Spin-Crossover Molecule–Metal Interface. J. Phys. Chem. Lett. 2019, 10, 4103–4109. [Google Scholar] [CrossRef]
- Zhang, L.; Tong, Y.; Kelai, M.; Bellec, A.; Lagoute, J.; Chacon, C.; Girard, Y.; Rousset, S.; Boillot, M.; Rivière, E.; et al. Anomalous Light-Induced Spin-State Switching for Iron(II) Spin-Crossover Molecules in Direct Contact with Metal Surfaces. Angew. Chem. Int. Ed. 2020, 59, 13341–13346. [Google Scholar] [CrossRef] [PubMed]
- Shalabaeva, V.; Rat, S.; Manrique-Juarez, M.D.; Bas, A.C.; Vendier, L.; Salmon, L.; Molnár, G.; Bousseksou, A. Vacuum deposition of high-quality thin films displaying spin transition near room temperature. J. Mater. Chem. C 2017, 5, 4419–4425. [Google Scholar] [CrossRef]
- Ridier, K.; Bas, A.; Shalabaeva, V.; Nicolazzi, W.; Salmon, L.; Molnár, G.; Bousseksou, A.; Lorenc, M.; Bertoni, R.; Collet, E.; et al. Finite Size Effects on the Switching Dynamics of Spin-Crossover Thin Films Photoexcited by a Femtosecond Laser Pulse. Adv. Mater. 2019, 31, 1901361. [Google Scholar] [CrossRef]
- Ridier, K.; Zhang, Y.; Piedrahita-Bello, M.; Quintero, C.M.; Salmon, L.; Molnár, G.; Bergaud, C.; Bousseksou, A. Heat Capacity and Thermal Damping Properties of Spin-Crossover Molecules: A New Look at an Old Topic. Adv. Mater. 2020, 32, 2000987. [Google Scholar] [CrossRef] [PubMed]
- Jasper-Toennies, T.; Gruber, M.; Karan, S.; Jacob, H.; Tuczek, F.; Berndt, R. Robust and Selective Switching of an FeIII Spin-Crossover Compound on Cu2N/Cu(100) with Memristance Behavior. Nano Lett. 2017, 17, 6613. [Google Scholar] [CrossRef] [PubMed]
- Atzori, M.; Poggini, L.; Squillantini, L.; Cortigiani, B.; Gonidec, M.; Bencok, P.; Sessoli, R.; Mannini, M. Thermal and light-induced spin transition in a nanometric film of a new high-vacuum processable spin crossover complex. J. Mater. Chem. C 2018, 6, 8885–8889. [Google Scholar] [CrossRef]
- Kipgen, L.; Bernien, M.; Ossinger, S.; Nickel, F.; Britton, A.J.; Arruda, L.M.; Naggert, H.; Luo, C.; Lotze, C.; Ryll, H.; et al. Evolution of cooperativity in the spin transition of an iron(II) complex on a graphite surface. Nat. Commun. 2018, 9, 2984. [Google Scholar] [CrossRef]
- Knaak, T.; González, C.; Dappe, Y.J.; Harzmann, G.D.; Brandl, T.; Mayor, M.; Berndt, R.; Gruber, M. Fragmentation and Distortion of Terpyridine-Based Spin-Crossover Complexes on Au(111). J. Phys. Chem. C 2019, 123, 4178–4185. [Google Scholar] [CrossRef]
- Kumar, K.S.; Ruben, M. Emerging trends in spin crossover (SCO) based functional materials and devices. Coord. Chem. Rev. 2017, 346, 176–205. [Google Scholar] [CrossRef]
- Kuch, W.; Bernien, M. Controlling the magnetism of adsorbed metal–organic molecules. J. Phys. Condens. Matter 2017, 29, 023001. [Google Scholar] [CrossRef]
- Collison, D.; Garner, C.D.; McGrath, C.M.; Mosselmans, J.F.W.; Roper, M.D.; Seddon, J.M.W.; Sinn, E.; Young, N.A. Soft X-ray induced excited spin state trapping and soft X-ray photochemistry at the iron L2,3 edge in [Fe(phen)2(NCS)2] and [Fe(phen)2(NCSe)2] (phen = 1,10-phenanthroline). J. Chem. Soc. Dalton Trans. 1997, 4371–4376. [Google Scholar] [CrossRef]
- Davesne, V.; Gruber, M.; Miyamachi, T.; Da Costa, V.; Boukari, S.; Scheurer, F.; Joly, L.; Ohresser, P.; Otero, E.; Choueikani, F.; et al. First glimpse of the soft X-ray induced excited spin-state trapping effect dynamics on spin cross-over molecules. J. Chem. Phys. 2013, 139, 074708. [Google Scholar] [CrossRef] [PubMed]
- Hauser, A. Light-Induced Spin Crossover and the High-Spin→Low-Spin Relaxation. In Spin Crossover in Transition Metal Compounds II; Number 234 in Topics in Current Chemistry; Springer: Berlin/Heidelberg, Germany, 2004; pp. 155–198. [Google Scholar]
- Hauser, A. Reversibility of light-induced excited spin state trapping in the Fe (ptz)6(BF4)2, and the Zn1−xFex(ptz)6(BF4)2 spin-crossover systems. Chem. Phys. Lett. 1986, 124, 543–548. [Google Scholar] [CrossRef]
- Nakajima, R.; Stöhr, J.; Idzerda, Y.U. Electron-yield saturation effects in L-edge X-ray magnetic circular dichroism spectra of Fe, Co, and Ni. Phys. Rev. B 1999, 59, 6421–6429. [Google Scholar] [CrossRef]
- Stöhr, J. Nexafs Spectroscopy; Springer: Berlin/Heidelberg, Germany, 1996. [Google Scholar]
- Akgül, G.; Aksoy, F.; Bozduman, A.; Ozkendir, O.; Ufuktepe, Y.; Lüning, J. Study of the L2,3 edges of 3d transition metals by X-ray absorption spectroscopy. Thin Solid Film 2008, 517, 1000–1004. [Google Scholar] [CrossRef]
- Costa Pinto, P.; Calatroni, S.; Neupert, H.; Letant-Delrieux, D.; Edwards, P.; Chiggiato, P.; Taborelli, M.; Vollenberg, W.; Yin-Vallgren, C.; Colaux, J.; et al. Carbon coatings with low secondary electron yield. Vacuum 2013, 98, 29–36. [Google Scholar] [CrossRef]
- Gonzalez, L.A.; Angelucci, M.; Larciprete, R.; Cimino, R. The secondary electron yield of noble metal surfaces. AIP Adv. 2017, 7, 115203. [Google Scholar] [CrossRef]
- Harzmann, G.D.; Frisenda, R.; van der Zant, H.S.J.; Mayor, M. Single-Molecule Spin Switch Based on Voltage-Triggered Distortion of the Coordination Sphere. Angew. Chem. Int. Ed. 2015, 54, 13425–13430. [Google Scholar] [CrossRef]
- Frisenda, R.; Harzmann, G.D.; Celis Gil, J.A.; Thijssen, J.M.; Mayor, M.; van der Zant, H.S.J. Stretching-Induced Conductance Increase in a Spin-Crossover Molecule. Nano Lett. 2016, 16, 4733–4737. [Google Scholar] [CrossRef]
- Jasper-Tönnies, T.; Poltavsky, I.; Ulrich, S.; Moje, T.; Tkatchenko, A.; Herges, R.; Berndt, R. Stability of functionalized platform molecules on Au(111). J. Chem. Phys. 2018, 149, 244705. [Google Scholar] [CrossRef]
- Jasper-Tönnies, T.; Gruber, M.; Ulrich, S.; Herges, R.; Berndt, R. Coverage-Controlled Superstructures of C3-Symmetric Molecules: Honeycomb versus Hexagonal Tiling. Angew. Chem. 2020, 132, 7074–7083. [Google Scholar] [CrossRef]
- Ludwig, E.; Naggert, H.; Kalläne, M.; Rohlf, S.; Kröger, E.; Bannwarth, A.; Quer, A.; Rossnagel, K.; Kipp, L.; Tuczek, F. Iron(II) Spin-Crossover Complexes in Ultrathin Films: Electronic Structure and Spin-State Switching by Visible and Vacuum-UV Light. Angew. Chem. Int. Ed. 2014, 53, 3019–3023. [Google Scholar] [CrossRef] [PubMed]
- Boldog, I.; Gaspar, A.B.; Martínez, V.; Pardo-Ibañez, P.; Ksenofontov, V.; Bhattacharjee, A.; Gütlich, P.; Real, J.A. Spin-Crossover Nanocrystals with Magnetic, Optical, and Structural Bistability Near Room Temperature. Angew. Chem. Int. Ed. 2008, 47, 6433–6437. [Google Scholar] [CrossRef] [PubMed]
- Volatron, F.; Catala, L.; Rivière, E.; Gloter, A.; Stéphan, O.; Mallah, T. Spin-Crossover Coordination Nanoparticles. Inorg. Chem. 2008, 47, 6584–6586. [Google Scholar] [CrossRef] [PubMed]
- Raza, Y.; Volatron, F.; Moldovan, S.; Ersen, O.; Huc, V.; Martini, C.; Brisset, F.; Gloter, A.; Stéphan, O.; Bousseksou, A.; et al. Matrix-dependent cooperativity in spin crossover Fe(pyrazine)Pt(CN)4 nanoparticles. Chem. Commun. 2011, 47, 11501. [Google Scholar] [CrossRef]
- Félix, G.; Nicolazzi, W.; Salmon, L.; Molnár, G.; Perrier, M.; Maurin, G.; Larionova, J.; Long, J.; Guari, Y.; Bousseksou, A. Enhanced Cooperative Interactions at the Nanoscale in Spin-Crossover Materials with a First-Order Phase Transition. Phys. Rev. Lett. 2013, 110, 235701. [Google Scholar] [CrossRef]
- Gueddida, S.; Alouani, M. Spin crossover in a single Fe(phen)2(NCS)2 molecule adsorbed onto metallic substrates: An ab initio calculation. Phys. Rev. B 2013, 87, 144413. [Google Scholar] [CrossRef]
- Gruber, M.; Berndt, R. Manipulation of Cyclohexene-Based Organic Molecules on Various Metallic Substrates. J. Phys. Chem. C 2016, 120, 18642–18650. [Google Scholar] [CrossRef]
- Hewson, A.C. The Kondo Problem to Heavy Fermions by Alexander Cyril Hewson. 1993. Available online: https://doi.org/10.1017/CBO9780511470752 (accessed on 1 January 1993).
- Ternes, M.; Heinrich, A.J.; Schneider, W.D. Spectroscopic manifestations of the Kondo effect on single adatoms. J. Phys. Condens. Matter 2008, 21, 053001. [Google Scholar] [CrossRef]
- Gruber, M.; Weismann, A.; Berndt, R. The Kondo resonance line shape in scanning tunnelling spectroscopy: Instrumental aspects. J. Phys. Condens. Matter 2018, 30, 424001. [Google Scholar] [CrossRef]
- Meded, V.; Bagrets, A.; Fink, K.; Chandrasekar, R.; Ruben, M.; Evers, F.; Bernand-Mantel, A.; Seldenthuis, J.S.; Beukman, A.; Van der Zant, H.S.J. Electrical control over the Fe (II) spin crossover in a single molecule: Theory and experiment. Phys. Rev. B 2011, 83, 245415. [Google Scholar] [CrossRef]
- Prins, F.; Monrabal-Capilla, M.; Osorio, E.A.; Coronado, E.; van der Zant, H.S.J. Room-Temperature Electrical Addressing of a Bistable Spin-Crossover Molecular System. Adv. Mater. 2011, 23, 1545–1549. [Google Scholar] [CrossRef]
- Rotaru, A.; Dugay, J.; Tan, R.P.; Guralskiy, I.A.; Salmon, L.; Demont, P.; Carrey, J.; Molnár, G.; Respaud, M.; Bousseksou, A. Nano-electromanipulation of Spin Crossover Nanorods: Towards Switchable Nanoelectronic Devices. Adv. Mater. 2013, 25, 1745–1749. [Google Scholar] [CrossRef] [PubMed]
- Lefter, C.; Davesne, V.; Salmon, L.; Molnár, G.; Demont, P.; Rotaru, A.; Bousseksou, A. Charge Transport and Electrical Properties of Spin Crossover Materials: Towards Nanoelectronic and Spintronic Devices. Magnetochemistry 2016, 2, 18. [Google Scholar] [CrossRef]
- Jasper-Tönnies, T.; Garcia-Lekue, A.; Frederiksen, T.; Ulrich, S.; Herges, R.; Berndt, R. Conductance of a Freestanding Conjugated Molecular Wire. Phys. Rev. Lett. 2017, 119, 066801. [Google Scholar] [CrossRef]
- Stipe, B.C.; Rezaei, M.A.; Ho, W. Single-Molecule Vibrational Spectroscopy and Microscopy. Science 1998, 280, 1732–1735. [Google Scholar] [CrossRef]
- Venkataramani, S.; Jana, U.; Dommaschk, M.; Sönnichsen, F.D.; Tuczek, F.; Herges, R. Magnetic Bistability of Molecules in Homogeneous Solution at Room Temperature. Science 2011, 331, 445–448. [Google Scholar] [CrossRef] [PubMed]
- Doistau, B.; Benda, L.; Hasenknopf, B.; Marvaud, V.; Vives, G. Switching Magnetic Properties by a Mechanical Motion. Magnetochemistry 2018, 4, 5. [Google Scholar] [CrossRef]
- Köbke, A.; Gutzeit, F.; Röhricht, F.; Schlimm, A.; Grunwald, J.; Tuczek, F.; Studniarek, M.; Longo, D.; Choueikani, F.; Otero, E.; et al. Reversible coordination-induced spin-state switching in complexes on metal surfaces. Nat. Nanotechnol. 2020, 15, 18–21. [Google Scholar] [CrossRef]
- Karan, S.; Li, N.; Zhang, Y.; He, Y.; Hong, I.P.; Song, H.; Lü, J.T.; Wang, Y.; Peng, L.; Wu, K.; et al. Spin Manipulation by Creation of Single-Molecule Radical Cations. Phys. Rev. Lett. 2016, 116, 027201. [Google Scholar] [CrossRef]
- Bocquet, M.L.; Lorente, N.; Berndt, R.; Gruber, M. Spin in a closed-shell organic molecule on a metal substrate generated by a sigmatropic reaction. Angew. Chem. Int. Ed. 2019, 58, 821–824. [Google Scholar] [CrossRef] [PubMed]


| Compound | Formula | Year | Ref(s). |
|---|---|---|---|
| 1 | [Fe(phen)2(NCS)2] | 2009 | [27,30,31,32,33,34,35] |
| 2 | [Fe(H2B(pz)2)2(phen)] | 2011 | [36,37,38,39,40,41,42,43,44,45,46] |
| 3 | [Fe(H2B(pz)2)2(bipy)] | 2011 | [11,36,37,46,47,48,49,50,51,52,53,54,55] |
| 4 | [Fe(HB(pz)3)2] | 2011 | [56] |
| 5 | [Fe(NCS)2L] | 2012 | [57] |
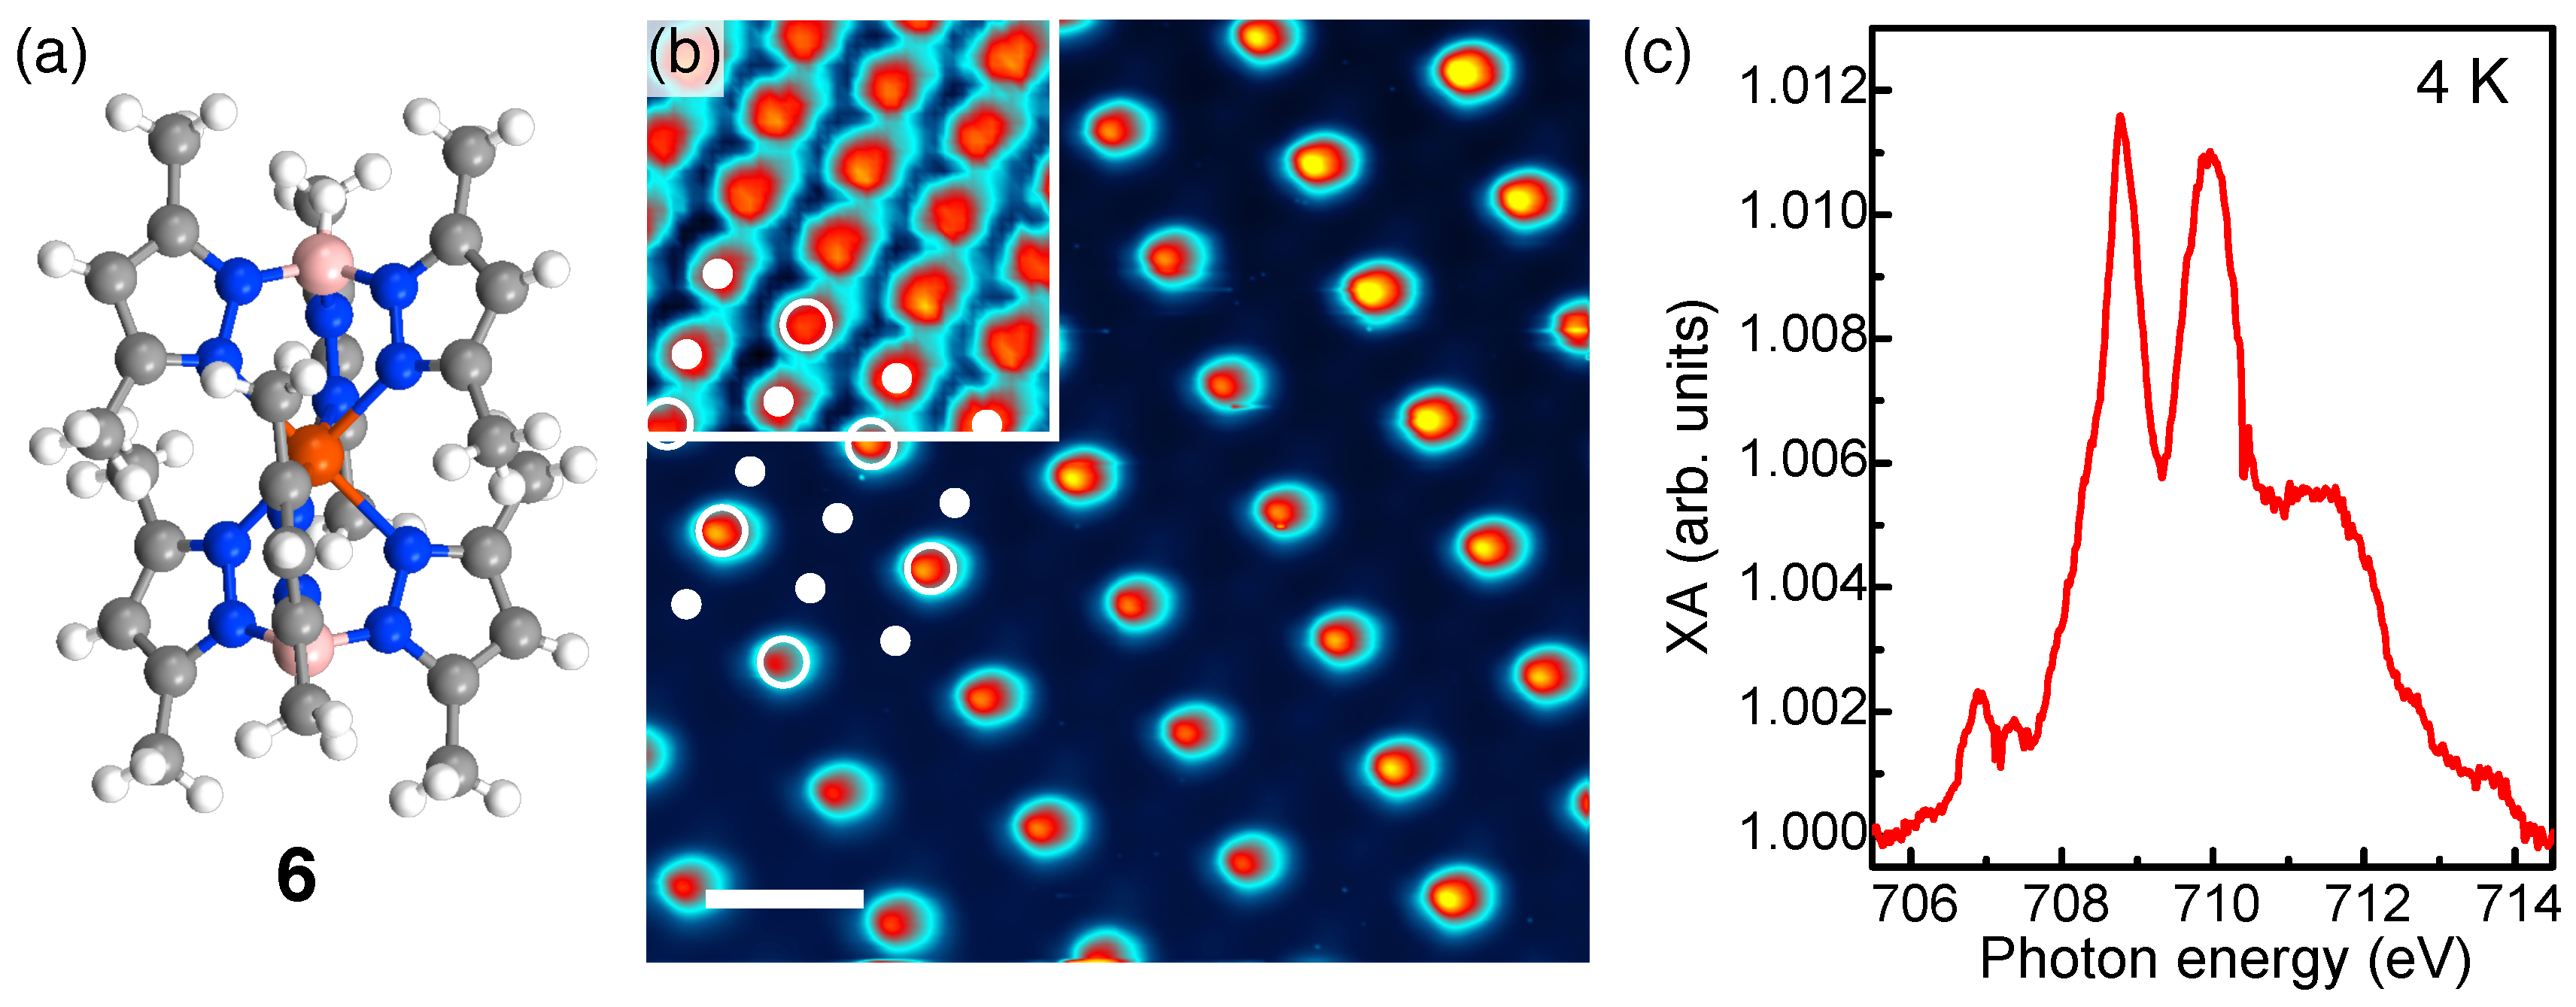
| 6 | [Fe((3,5−(CH3)2Pz)3BH)2] | 2015 | [58,59,60,61,62,63] |
| 7 | [Fe(HB(tz)3)2] | 2017 | [10,13,64,65,66] |
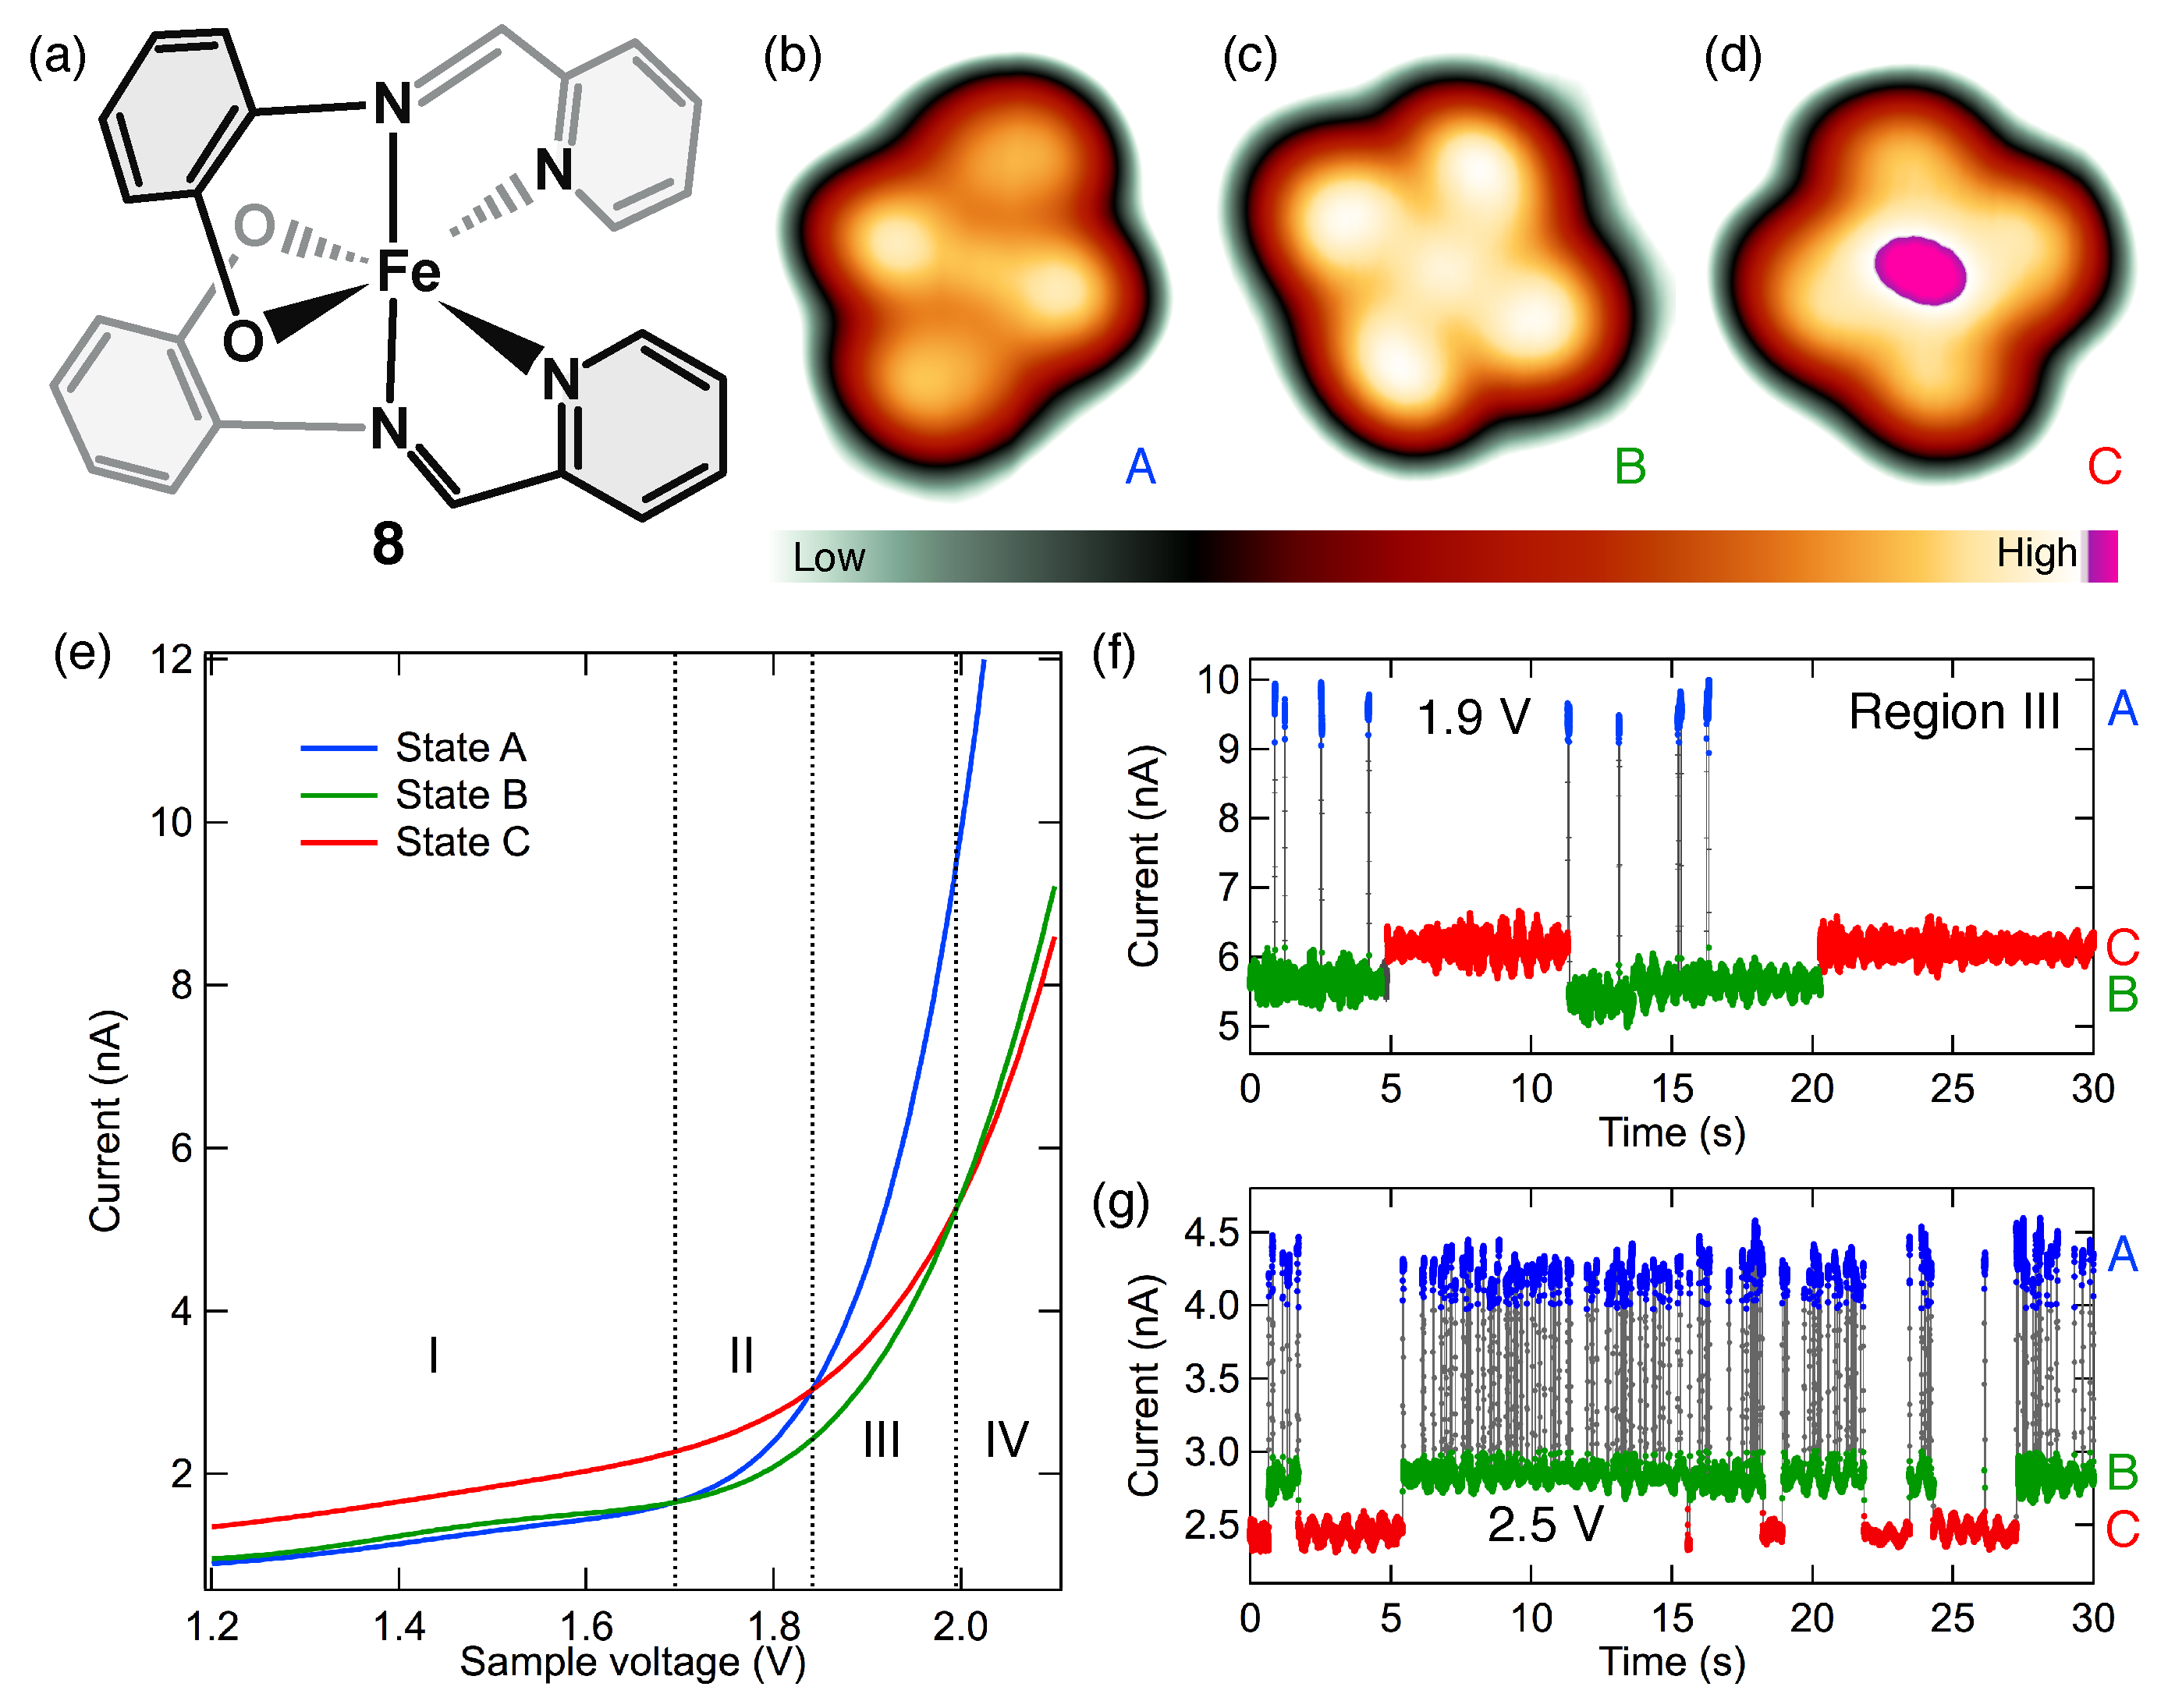
| 8 | [Fe(pap)2]+ | 2017 | [29,67] |
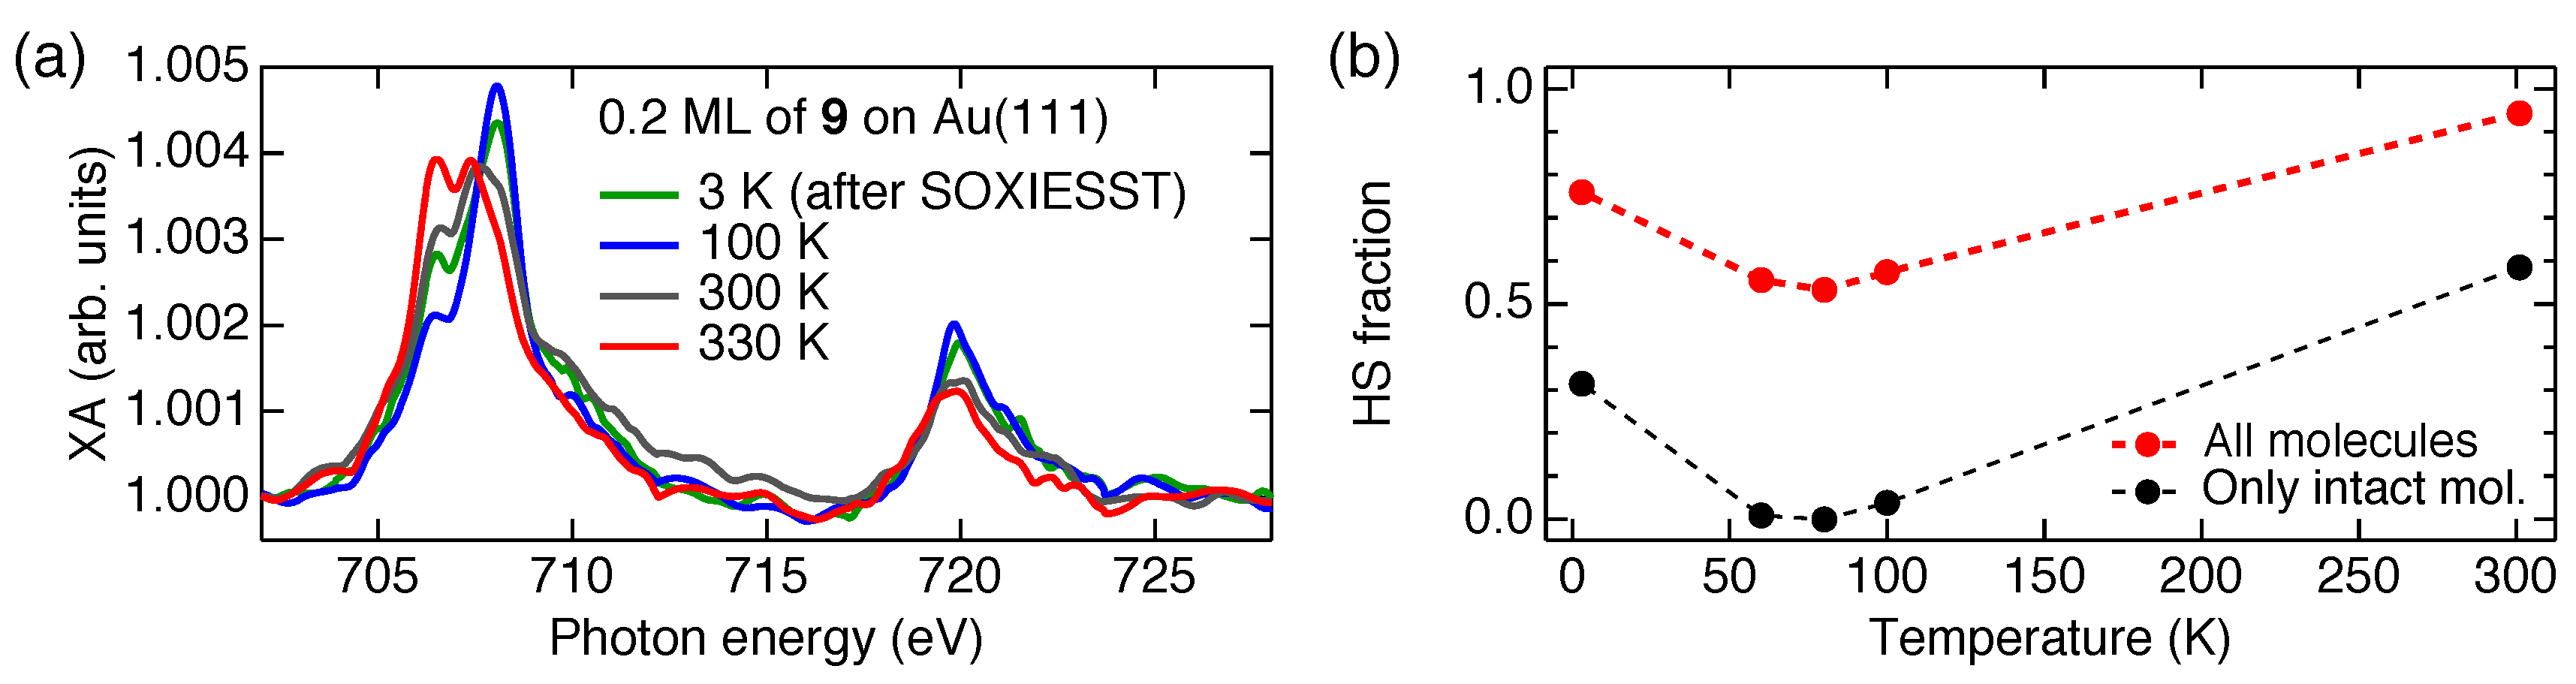
| 9 | [Fe(pypyr(CF3)2)2(phen)] | 2018 | [23,24] |
| 10 | [Fe(qnal)2] | 2018 | [68] |
© 2020 by the authors. Licensee MDPI, Basel, Switzerland. This article is an open access article distributed under the terms and conditions of the Creative Commons Attribution (CC BY) license (http://creativecommons.org/licenses/by/4.0/).
Share and Cite
Gruber, M.; Berndt, R. Spin-Crossover Complexes in Direct Contact with Surfaces. Magnetochemistry 2020, 6, 35. https://doi.org/10.3390/magnetochemistry6030035
Gruber M, Berndt R. Spin-Crossover Complexes in Direct Contact with Surfaces. Magnetochemistry. 2020; 6(3):35. https://doi.org/10.3390/magnetochemistry6030035
Chicago/Turabian StyleGruber, Manuel, and Richard Berndt. 2020. "Spin-Crossover Complexes in Direct Contact with Surfaces" Magnetochemistry 6, no. 3: 35. https://doi.org/10.3390/magnetochemistry6030035
APA StyleGruber, M., & Berndt, R. (2020). Spin-Crossover Complexes in Direct Contact with Surfaces. Magnetochemistry, 6(3), 35. https://doi.org/10.3390/magnetochemistry6030035