Article

Correlation between Slow Magnetic Relaxations and Molecular Structures of Dy(III) Complexes with N5O4 Nona-Coordination

1
Department of Chemistry, Biology, and Environmental Science, Faculty of Science, Nara Women’s University, Kita-uoya Nishi-machi, Nara 630-8506, Japan
2
Department of Materials Engineering Science, Graduate School of Engineering Science, Osaka University, Toyonaka, Osaka 560-8531, Japan
3
Institute for Molecular Science, Myodaiji, Okazaki 444-8585, Japan
*
Authors to whom correspondence should be addressed.
Magnetochemistry 2019, 5(2), 27; https://doi.org/10.3390/magnetochemistry5020027
Submission received: 30 March 2019 / Revised: 10 April 2019 / Accepted: 13 April 2019 / Published: 18 April 2019

Abstract

:
A series of Dy(III) mononuclear complexes [DyA2L]+ (L denotes Schiff base N5 ligand that occupies equatorial positions and A denotes bidentate anionic O-donor ligands such as NO3 (1), AcO (2), and acac (3)) were synthesized to investigate the correlation between the slow magnetic relaxation phenomena and the coordination structures around Dy(III). The Dy(III) ion in each complex is in a nona-coordination with the anionic O-donor ligand occupying up- and down-side positions of the N5 equatorial plane. 2 and 3 show slow magnetic relaxation phenomena under a zero bias-field condition, and all complexes showed slow magnetic relaxation under the applied 1000-Oe bias-field conditions. Arrhenius analyses revealed that the ΔE/kB, the barrier height for magnetization flipping, increases in this order, with the values of 24.1(6), 85(3), and 140(15) K. The effects of the exchanging axial ligands on the magnetic anisotropy were discussed together with the DFT calculations.

1. Introduction

Single-molecule magnets (SMMs) are fascinating molecule-based nanomaterials, which are characterized by slow relaxation of magnetization at low temperatures [1,2,3,4,5,6,7,8,9,10]. Magnetic anisotropy plays an essential role in preventing the magnetization flipping; as the orbital angular momentum of 4f electrons is unquenched in the complex formations, each lanthanide(III) (Ln(III)) ion possesses a large magnetic moment correlated with the total angular momentum J, which is defined by the length of the vector summation of the spin angular momentum S and the orbital angular momentum L. The Dy(III) ion is the most fascinating lanthanide ion due to a large total angular momentum of J = 15/2, accompanied by the Kramers characteristic and an oblate type electronic distribution [11,12,13,14,15,16,17,18,19]. The magnetic anisotropy of lanthanide ions is strongly correlated with the electronic repulsion with the crystal field of an appropriate anisotropy; this means an axially stressed crystal field is advantageous for realizing an easy axis anisotropy of the oblate type lanthanide ion. The J ground state splits into 2J + 1 numbered substates with different components along the z axis, i.e., Jz. In an appropriate anisotropic crystal field, the pair of substates with the highest Ising character was relatively stabilized compared with those of less Ising type pairs to give an easy axial magnetic anisotropy. To achieve such an anisotropic crystal field, the combination of neutral and anionic ligands, with the former located at equatorial positions and the latter located along the z axis, is simple but powerful [18,20,21,22,23]. This strategy is effective both for light and heavy lanthanide ions with oblate type electronic distributions, such as Ce(III), Nd(III) [24,25], Tb(III), and Dy(III). To this effect, we have previously reported several mononuclear Ln(III) complexes (Ln = Ce, Pr, and Nd) incorporated with neutral and anionic ligand pairs, such as 18-crown-6 and NO3, 1,10-diaza-18-crown-6, and NO3 [26], and a single helical N6 ligand (Figure 1, L′) and NO3 [21], respectively. In all these complexes, the central Ln(III) ion is surrounded by an (aza)crown ether or a helical ligand L′ in an equatorial manner, and axial positions are occupied by two or three nitrate anions; this leads to an easy-axial magnetic anisotropy and slow magnetic relaxation phenomena of Ce(III) and Nd(III) as Kramers ions. The radii of the macrocyclic and helical ligands are slightly larger than the ionic radii of the lanthanide ions, and hence the ligands show distortion [20,26] or helication [27] in the complex formation, hence the coordination distances are rather long and the coordination itself is weak. The mismatching between ligand radius and lanthanide radius becomes larger for heavy lanthanide ions and, for the case of macrocyclic ligands, we have not succeeded in synthesizing heavy lanthanide complexes with macrocyclic ligands to reveal the correlation between slow magnetic relaxation phenomena and the molecular structure accompanied with a series of axial ligands. In this study, we decided to introduce a smaller N5 ligand L as an equatorial ligand, shown in Figure 1. The molecular radius of L is smaller than those of the macrocyclic ligands and the helical ligand L′. Complexes of L with heavy lanthanide ions, such as Tb(III) or Dy(III), will be sufficiently stable to exchange axial ligands with different donating abilities. Moreover, it is expected that L can occupy equatorial positions in a flatter manner than L′, being free from helication. In this study, we synthesized a family of Dy(III) complexes with the general formula of [DyA2L]+ (A = bidentate anionic O-donor ligand), such as [Dy(NO3)2L]NO3 (1), [Dy(AcO)2L]CF3SO3 (2), and [Dy(acac)2L]CF3SO3 (3), to investigate the correlation between the axial ligand nature and slow magnetic relaxation phenomena. Syntheses, crystal structures, magnetic properties, and DFT calculation results of these complexes are discussed.

2. Results

2.1. Synthesis and Characterization

We have newly synthesized three Dy(III) complexes by the reaction of an appropriate dysprosium salt with L in an organic solvent, such as Dy(NO3)3·5H2O in MeCN for 1, Dy(AcO)3·4H2O and Dy(CF3SO3)3 in a 2:1 molar ratio in EtOH for 2, and Dy(acac)3 and Dy(CF3SO3)3 in a 2:1 molar ratio in 2-propanol for 3, to obtain crystals suitable for single X-ray crystallography. Their structures were revealed from the crystallographic analyses both for single crystals and microcrystalline samples (Powder X-ray diffraction (PXRD) data are given as Figure S1, in the Supplementary Information).
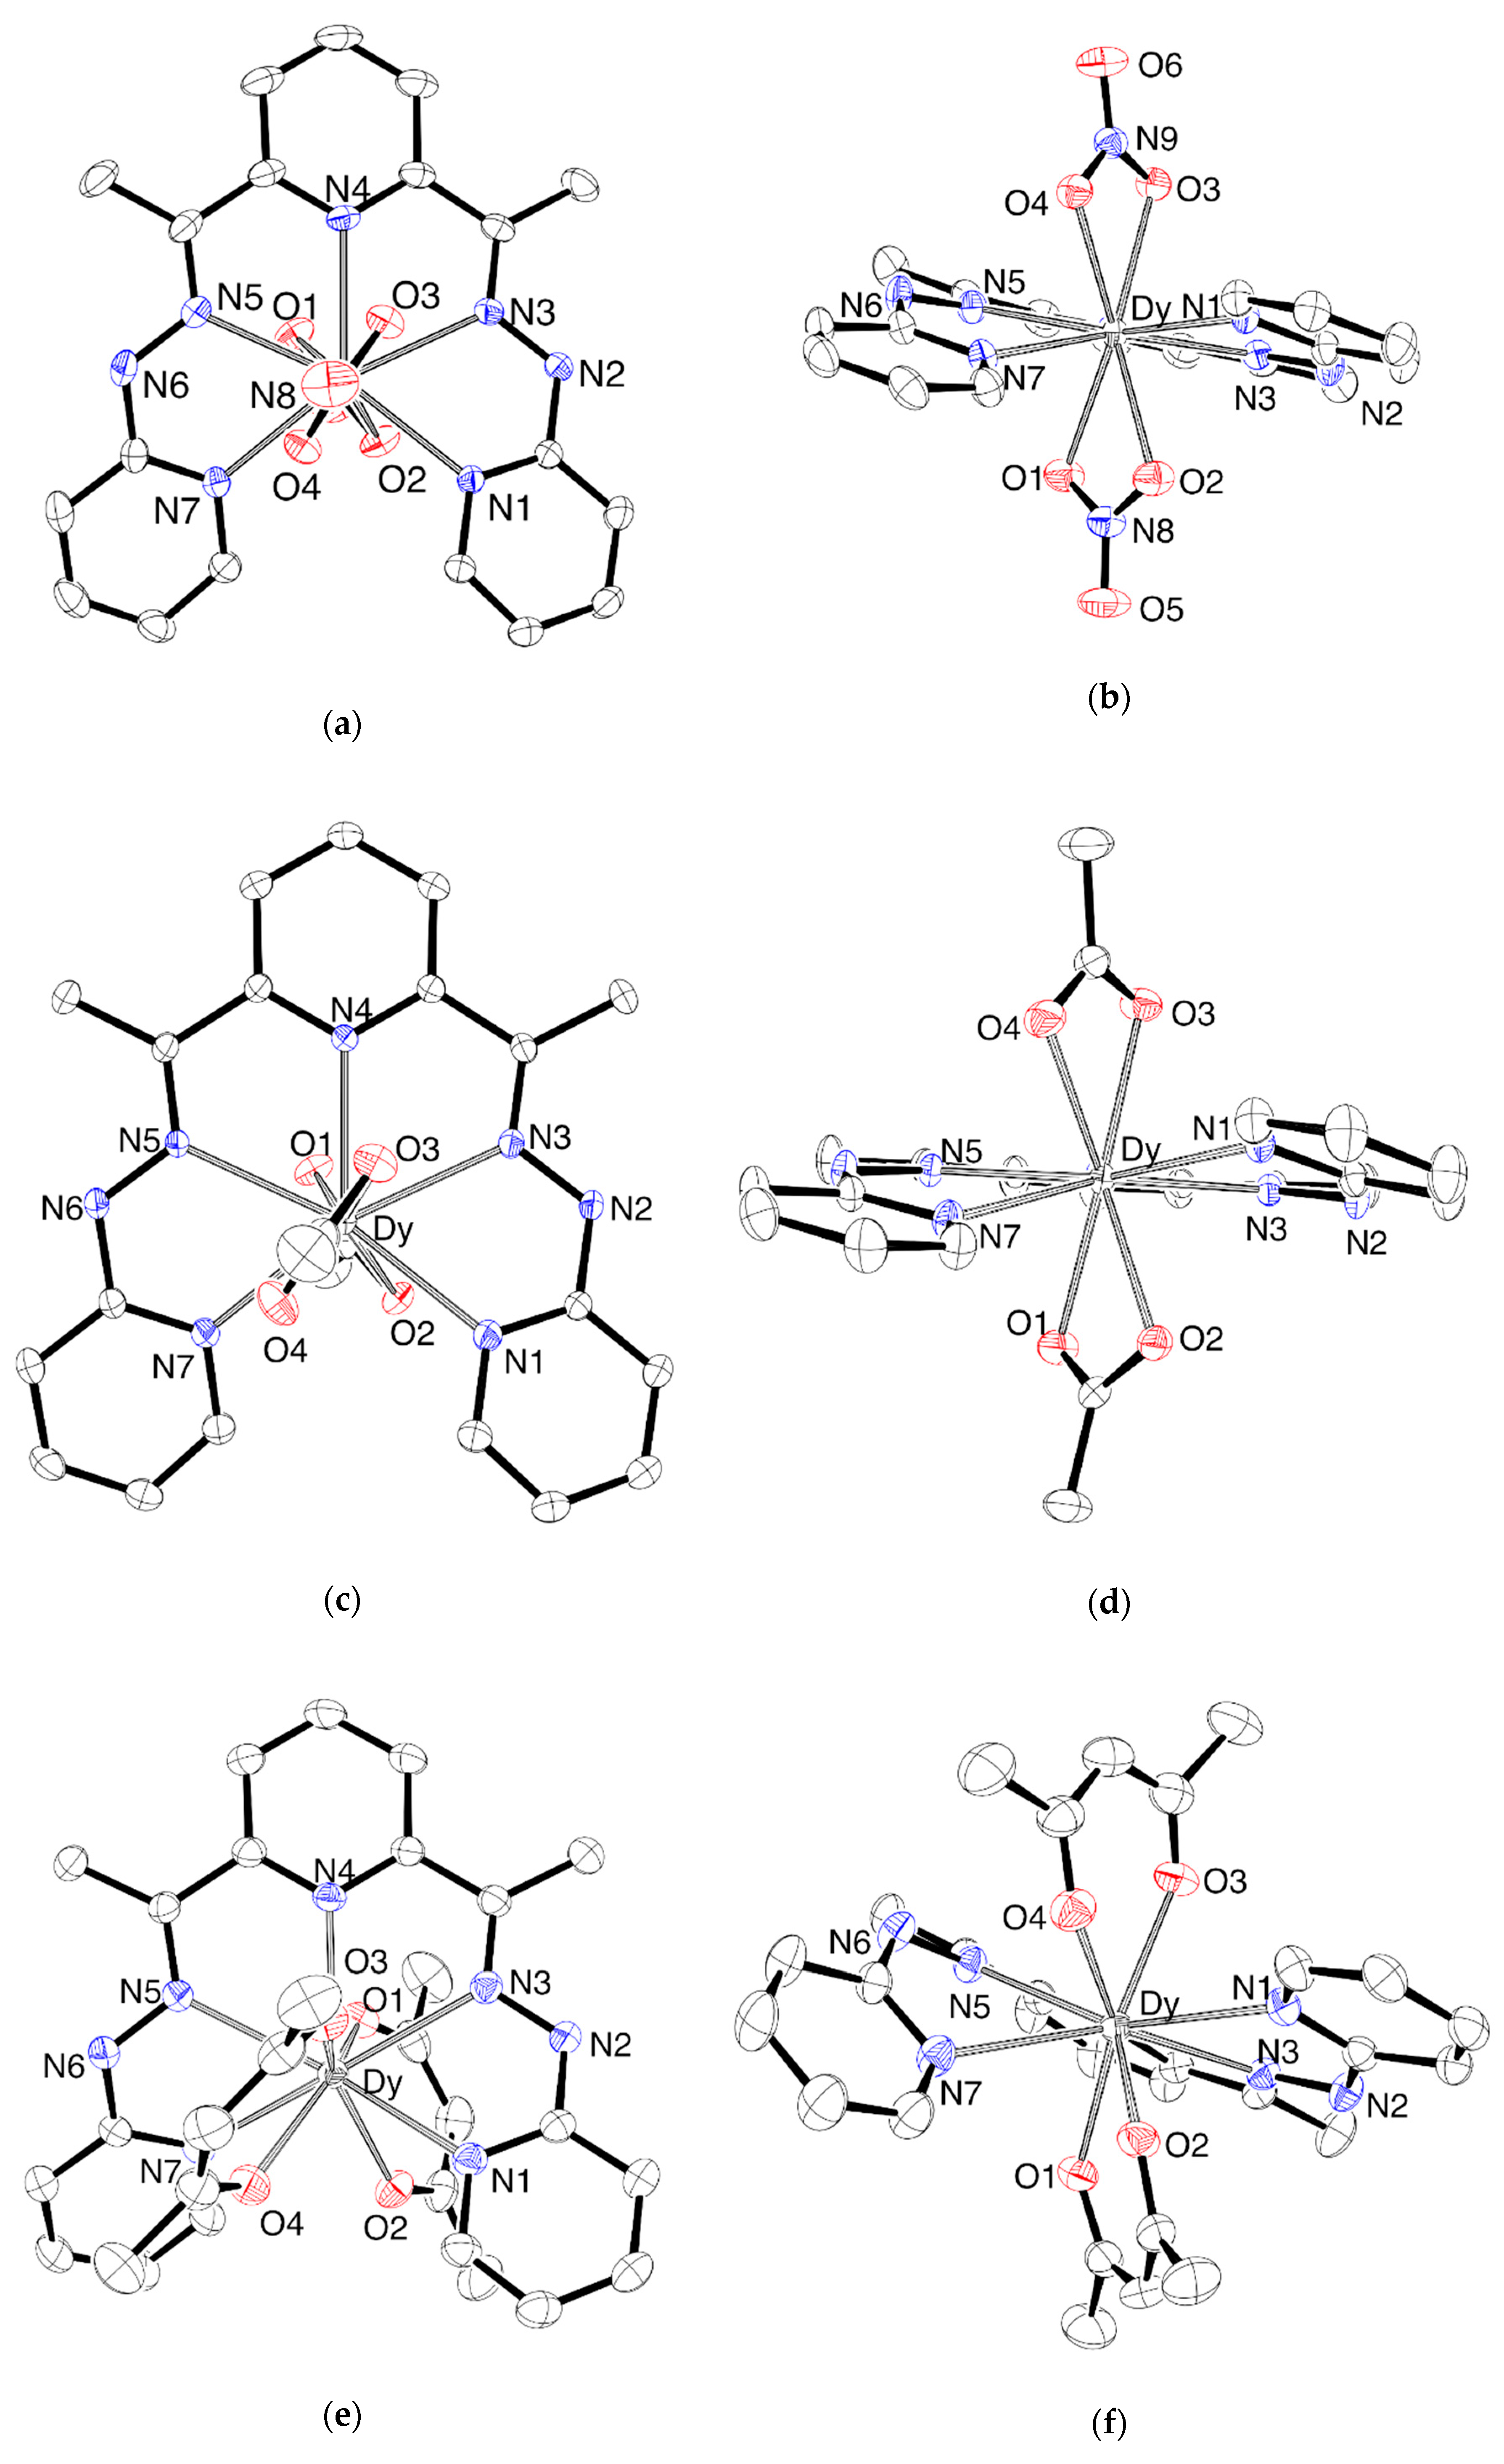
Crystal structures of the cationic part of three complexes are shown in Figure 2 and Figures S2–S5. Crystallographic data, accompanied by the selected distances and angles, are summarized in Tables S1 and S2. 1 and 2 crystallized in a triclinic crystal system with a P-1 space group, whereas 3 crystallized in monoclinic P21/n. In the complexes, a neutral L ligates as a pentadentate ligand which occupies equatorial positions forming four pentagonal chelate rings. Two anionic ligands, such as NO3 in 1, AcO in 2, or acac in 3, occupy the positions above and below the lanthanide ion in a bidentate fashion, to complete the N5O4 nona-coordination of the Dy(III) ion. In all cases, one whole molecule is crystallographically independent; however, each has pseudo two-fold symmetry along the axis passing through Dy and N4 of the central pyridine ring. L shows twist distortion around the pseudo two-fold axis, which can be evaluated from the values of the dihedral angles between the two terminal pyridine rings involving N1 and N7. The estimated angles were 25.45(11)°, 19.92(13)°, and 57.40(11)°, for 1, 2, and 3, respectively, and strongly correlated with the axial ligands. The nitrate and acetate ligands coordinated with the formation of four-membered chelate rings and they were less bulky than acetylacetonate, which had coordinated forming six-membered chelate rings. In all complexes, the shortest contacts between O-donor and N-donor atoms (i.e., O2···N1 and O4···N7) were very similar within the range of 2.692(3) to 2.837(2) Å, indicating the presence of van der Waals contacts. The steric repulsion among axial nitrate or acetate ligands and equatorial L was small, and 1 and 2 had similar small values of dihedral angles. The steric repulsion in 3 is expected to be larger leading to a larger twisting of L. The twisting of L is also defined by the planarity of the five equatorially coordinating N-donors. The maximum deviations of the N-donor from the ideal planes defined by N5Dy were estimated as 0.3534(11) Å, 0.3330(10) Å, and 0.6594(19) Å, respectively. The coordination distances in the complexes show a systematic difference in the series of 1, 2, and 3. Dy–N distances elongated along this order: Dy–N distances were 2.4184(17)–2.4939(18) Å for 1, 2.4547(16)–2.5018(18) Å for 2, and 2.536(2)–2.696(3) Å for 3. On the contrary, Dy–O distances shortened in this order: 2.3903(16)–2.4657(16) Å for 1, 2.3923(16)–2.4357(16) Å for 2, and 2.287(2)–2.370(2) Å for 3. The longest Dy–N distances in 3 resulted from the twisting of L. The coordination distances of O-donors and N-donors in 1 were almost similar, whereas in 2, Dy–O distances were slightly shorter than those of Dy–N. The molecular structures of 1 and 2 were very similar, with twisting of L, and the difference in coordination distances reflects the difference in negative charge distributions between nitrate and acetate O-donor atoms. Because a negative charge in the nitrate delocalized among three oxygen atoms, the charge density of O-donor atoms in the nitrate is slightly smaller than those of the acetate anion. Larger negative charges in the O-donor enforced a slight shortening of the coordination distance in 2, and it also enforced a slight elongation of the Dy–N distances. The anisotropic ligand field is defined by both the difference in coordination distances and the difference in negative charge distributions of donor atoms. The overall ligand field geometries of 13 were similar, and could lead to an axially stressed ligand field by sandwiching the Dy(III) ion between negatively charged O-donor ligands. The observed structural trend suggests that the magnetic anisotropy is enhanced in the order of 1, 2, and 3 because the difference in the coordination distances become larger in this order. The larger negative charges and the shorter coordination distances of O-donors lead to a larger stress along z-axis, and this is likely to enhance the easy-axial magnetic anisotropy for Dy(III) as an oblate ion.
In 2, crystalline solvent molecules showed heavy disordering. They were assigned as two EtOH and one H2O, with 50%, 25%, and 50% occupancies according to the elemental analyses. These solvent molecules were closely located to O3 (~2.85 Å) suggesting the hydrogen bond formation, however, π electrons of the acetate ligand are symmetrically delocalized (O3-C22 = 1.263(3) Å and O4-C22 = 1.265(3) Å), and hence the negative charge distributions of O3 and O4 would be similar. Therefore we assumed that the influence of the hydrogen bond formations on the ligand field anisotropy around Dy(III) ion would be negligible.
The shortest Dy···Dy distances were estimated as 7.2871(13) Å (symmetry code: 1 - x, 1 - y, 1- z), 7.9634(10) Å (symmetry code: 1 - x, -y, 1 - z), and 9.1817(8) Å (symmetry code: 1 - x, 1 - y, -z). The Dy···Dy separations were long enough to avoid through-space magnetic interactions. The packing diagrams in the unit cell are given as Figures S2–S4.

2.2. Magnetic Properties of the Complexes

2.2.1. DC Susceptibility of the Complexes

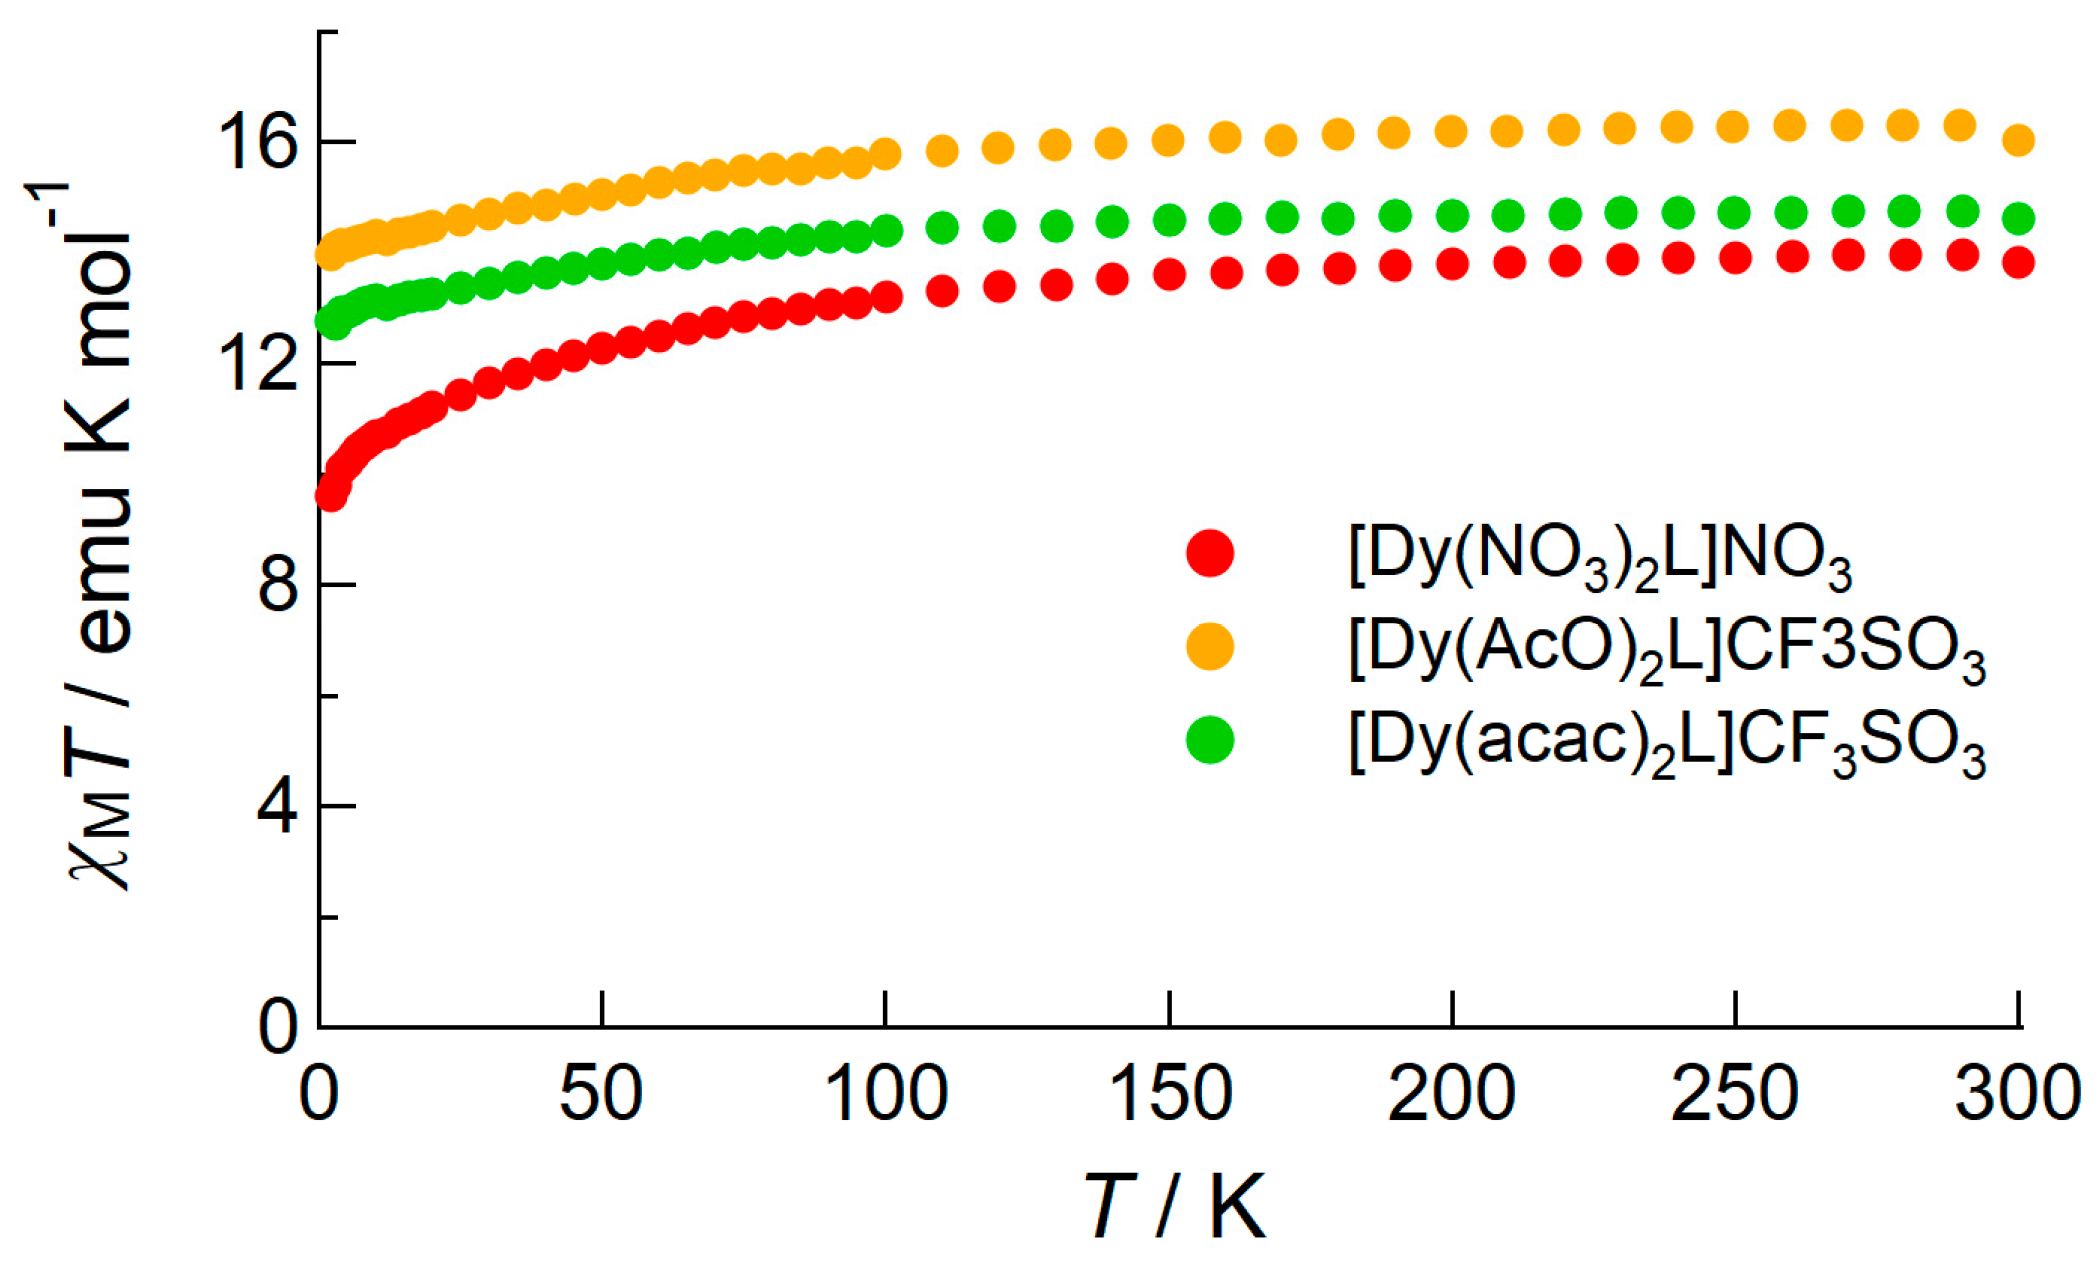
DC susceptibility data were recorded at various temperatures for all complexes under an application of 1000 Oe DC field. Figure 3 shows the temperature dependence of χMT products. The Curie constant for Dy(III) ion in an isotropic ligand field was estimated as 14.2 emu K mol−1 (J = 15/2, g = 4/3), and the observed values at 300 K, 13.8, 16.0, and 14.6 emu K mol−1, respectively, were close to the expected values. This may indicate that the magnetic anisotropy is small in these complexes. The χMT values were almost constant down to 150 K (for 1) or 100 K (for 2 and 3), and then χMT gradually decreased as the temperature was cooled, due to the thermal depopulation among the substates arising from the 6H15/2 ground state which split under the anisotropic crystal field.

2.2.2. AC Susceptibility of the Complexes

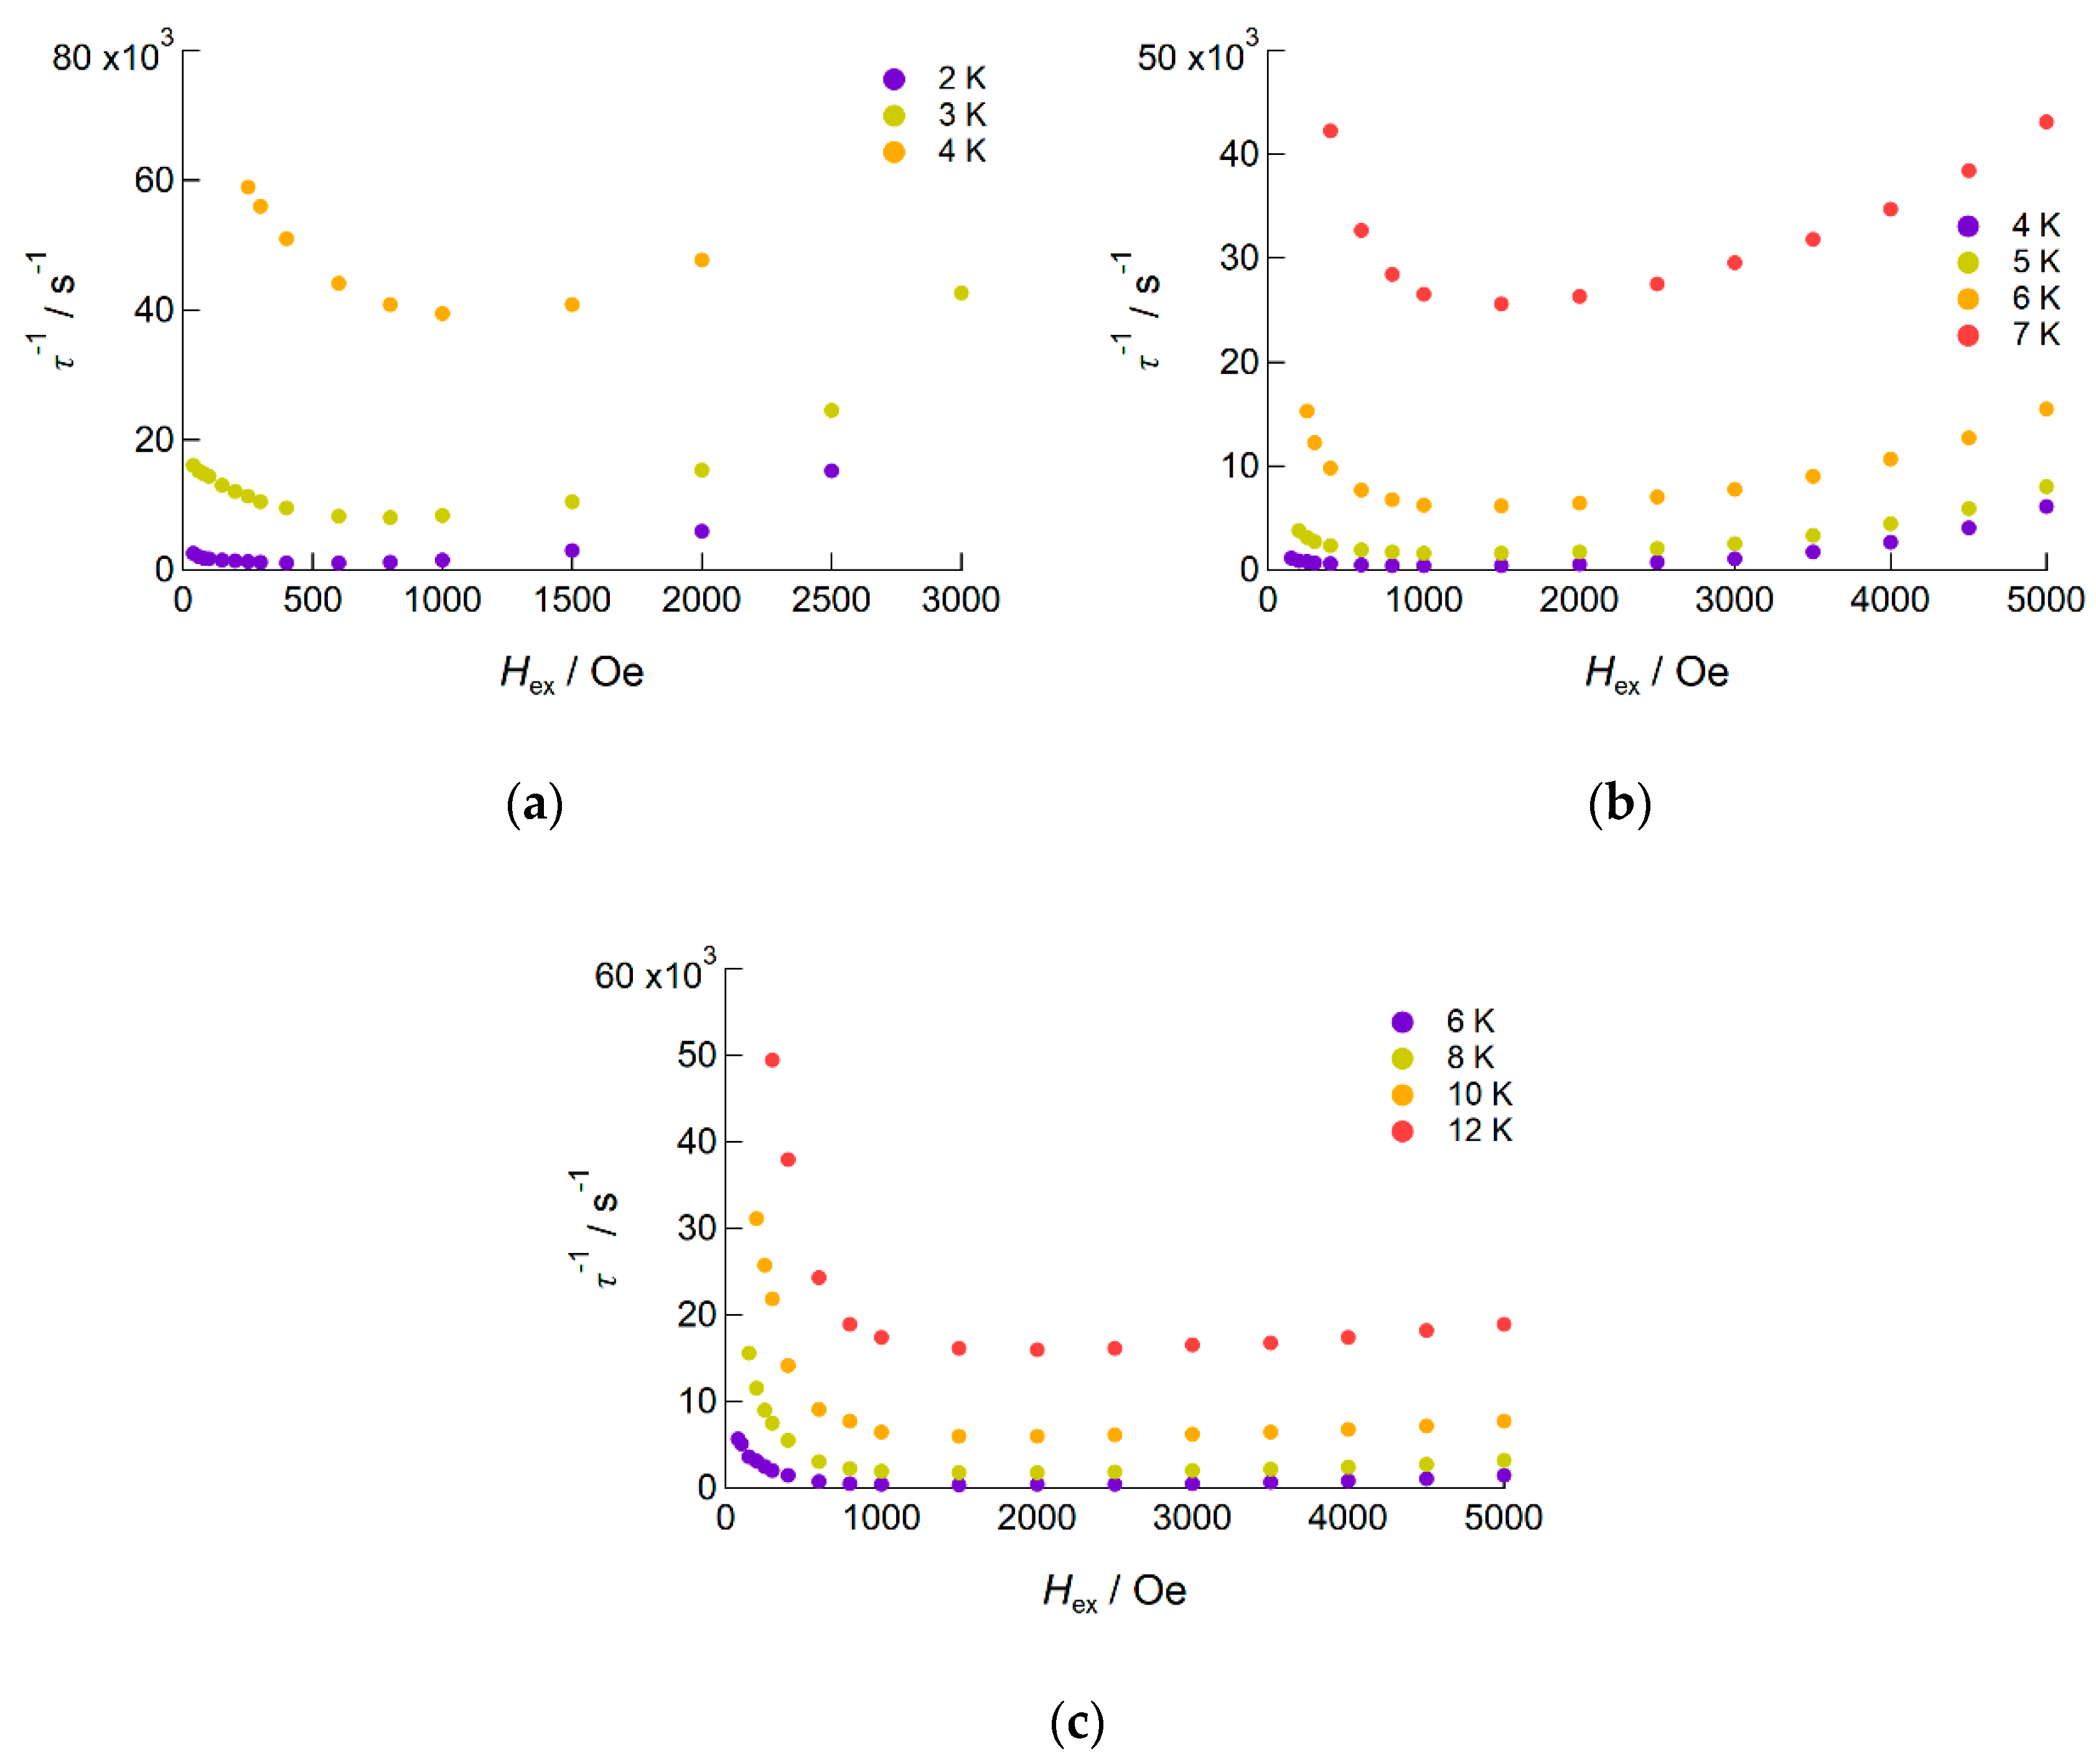
The slow magnetic relaxation of the complexes was revealed by measuring the alternating current (AC) magnetic susceptibility under the applied conditions of zero field or direct current (DC) field. For all complexes, slow magnetic relaxation phenomena were initially analyzed under a zero DC bias field (Figure S6), which exhibited no out-of-phase signals χM″ for 1, and weak signals for 2 and 3 owing to the quantum-tunneling magnetization (QTM) relaxation process, which was faster for 1 and 3 than the flipping of the magnetic field. For 2, χM″ shows a peak at ~6000 Hz, which is almost constant in the temperature range up to 6.0 K. This indicates that the magnetization relaxation occurs via QTM in this temperature range. The frequency dependences of χM″ were analyzed on the basis of the Cole–Cole equation (see below), and the QTM relaxation rate τQTM was estimated as 2.70(9) × 10−5 s. Upon applying the DC bias field, fast relaxation via the QTM process was suppressed and slow magnetic relaxations were observed for all complexes. To reveal the effects of the bias field on slow magnetic relaxations, the bias field dependences of the out-of-phase susceptibilities were measured under the DC field in the ranges of 0 to 3000 Oe and 0 to 5000 Oe for several temperatures (Figure 4).
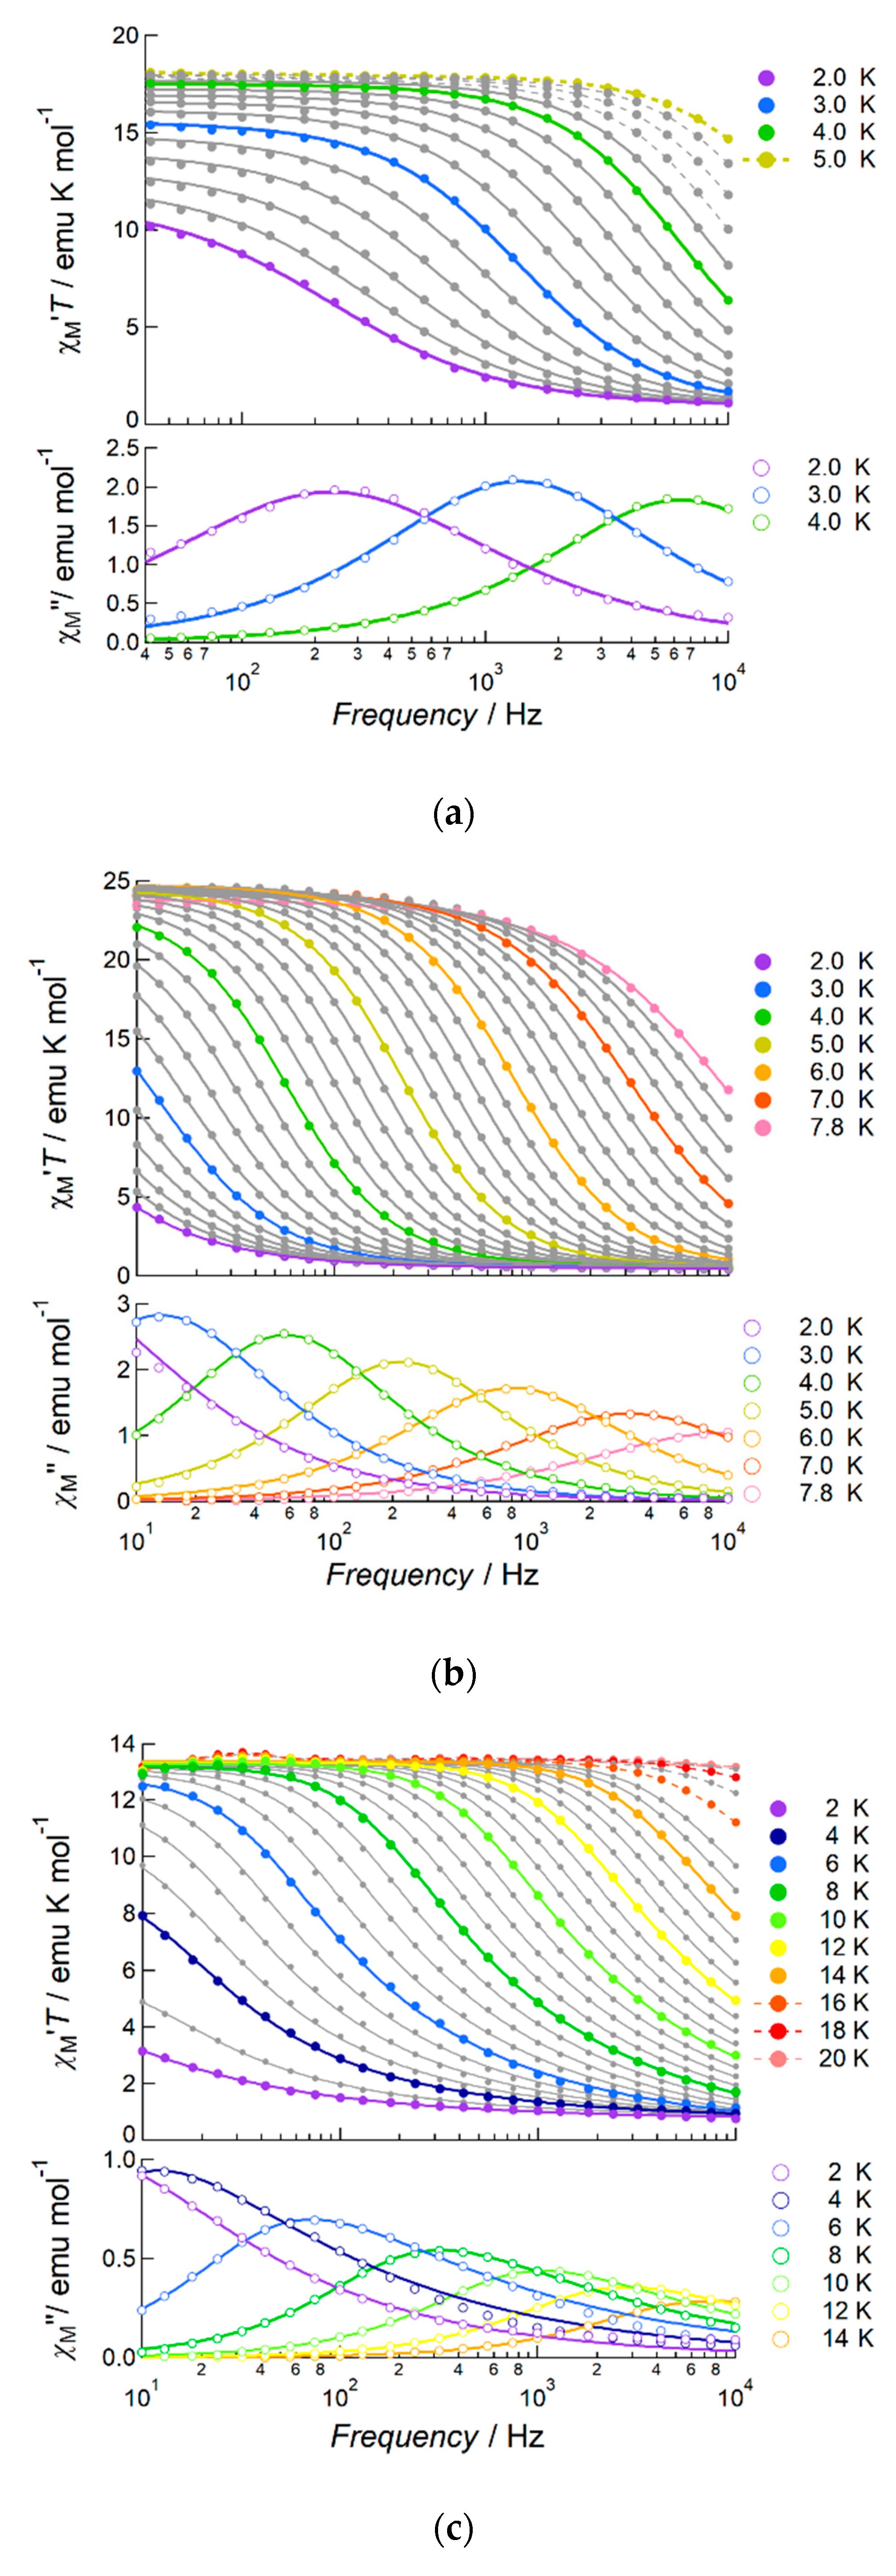
In all complexes, slow magnetic relaxation occurred when a weak DC field of 200 Oe was applied, and it became slower as the applied field increased. The relaxation rate reached a minimum under a DC field of 1000 to 2000 Oe, and was enhanced again when the field was further strengthened, mainly due to the direct process of relaxation becoming predominant. Hence, the dynamic magnetic property of each complex was revealed under the application of 1000 Oe DC, where the QTM and direct processes were effectively suppressed. Under this condition, all complexes exhibited frequency-dependent in-phase (χM′) and out-of-phase (χM″) susceptibilities at temperatures up to 4.2 K, 7.8 K, and 14 K, for 1, 2, and 3 respectively, with an AC frequency up to 10,000 Hz. Figure 5 shows the frequency dependence of the χMT products and χM″ values.
1 and 2 showed bilaterally symmetric shapes of out-of-phase signals, and hence the AC susceptibility data were analyzed with the Cole–Cole Equation (1) given below [28].
χ * ( ω ) = χ S + χ T χ S 1 + ( i ω τ ) 1 α
Here χT and χS denote the isothermal and the adiabatic susceptibilities, respectively, τ denotes the relaxation time at each temperature, and α denotes the distribution of τ (Tables S3 and S4). At first, the frequency dependence of χMT products was fitted using these four parameters, and the frequency dependences of χM″ were reproduced using the estimated parameters, which showed good agreement with the observations. The estimated α values were small enough, and hence the slow magnetic relaxations occurred via a single process.
3 showed slightly asymmetric signals both for χMT and χM″, which obeyed the Cole–Davidson Equation (2) given below [29].
χ * ( ω ) = χ S + χ T χ S ( 1 + i ω τ ) 1 β
Here β denotes the distribution of τ. The analyses were carried out similarly to those for 1 and 2; the frequency dependences of χMT products were fitted with Equation (2) first, of which the estimated parameters were listed in Table S5, and then the frequency dependence of χM″ were reproduced. The β values were large at low temperature, with the largest value of 0.53 at 3.0–4.0 K; these became smaller at higher temperatures, reaching down to 0.41 at 13 K. Both α and β parameters describe the distributions of τ from the ideal value; however, their scales were slightly different. Figure 6 shows the theoretical calculations of χ″ for the different α and β values. In both cases, α = 0 and β = 0 mean that the distribution of relaxation time is zero and all molecules flip with a unique relaxation time. This obeys the Debye equation. The peaks of both plots were normalized as 1.0 at α = 0 and β = 0. When the distribution of τ becomes wider, the number of molecules which flip in the different relaxation time increases, and hence the peak height becomes lower depending on α and β. For the same height of the χ″ plots, β takes a value 2.0–2.8 times larger than that of α. Considering this relationship, the β values for 3 correspond to the α values at around 0.2, and hence the distribution of τ is regarded to be sufficiently small. Hence, we assumed 3 to be a field-induced SMM.
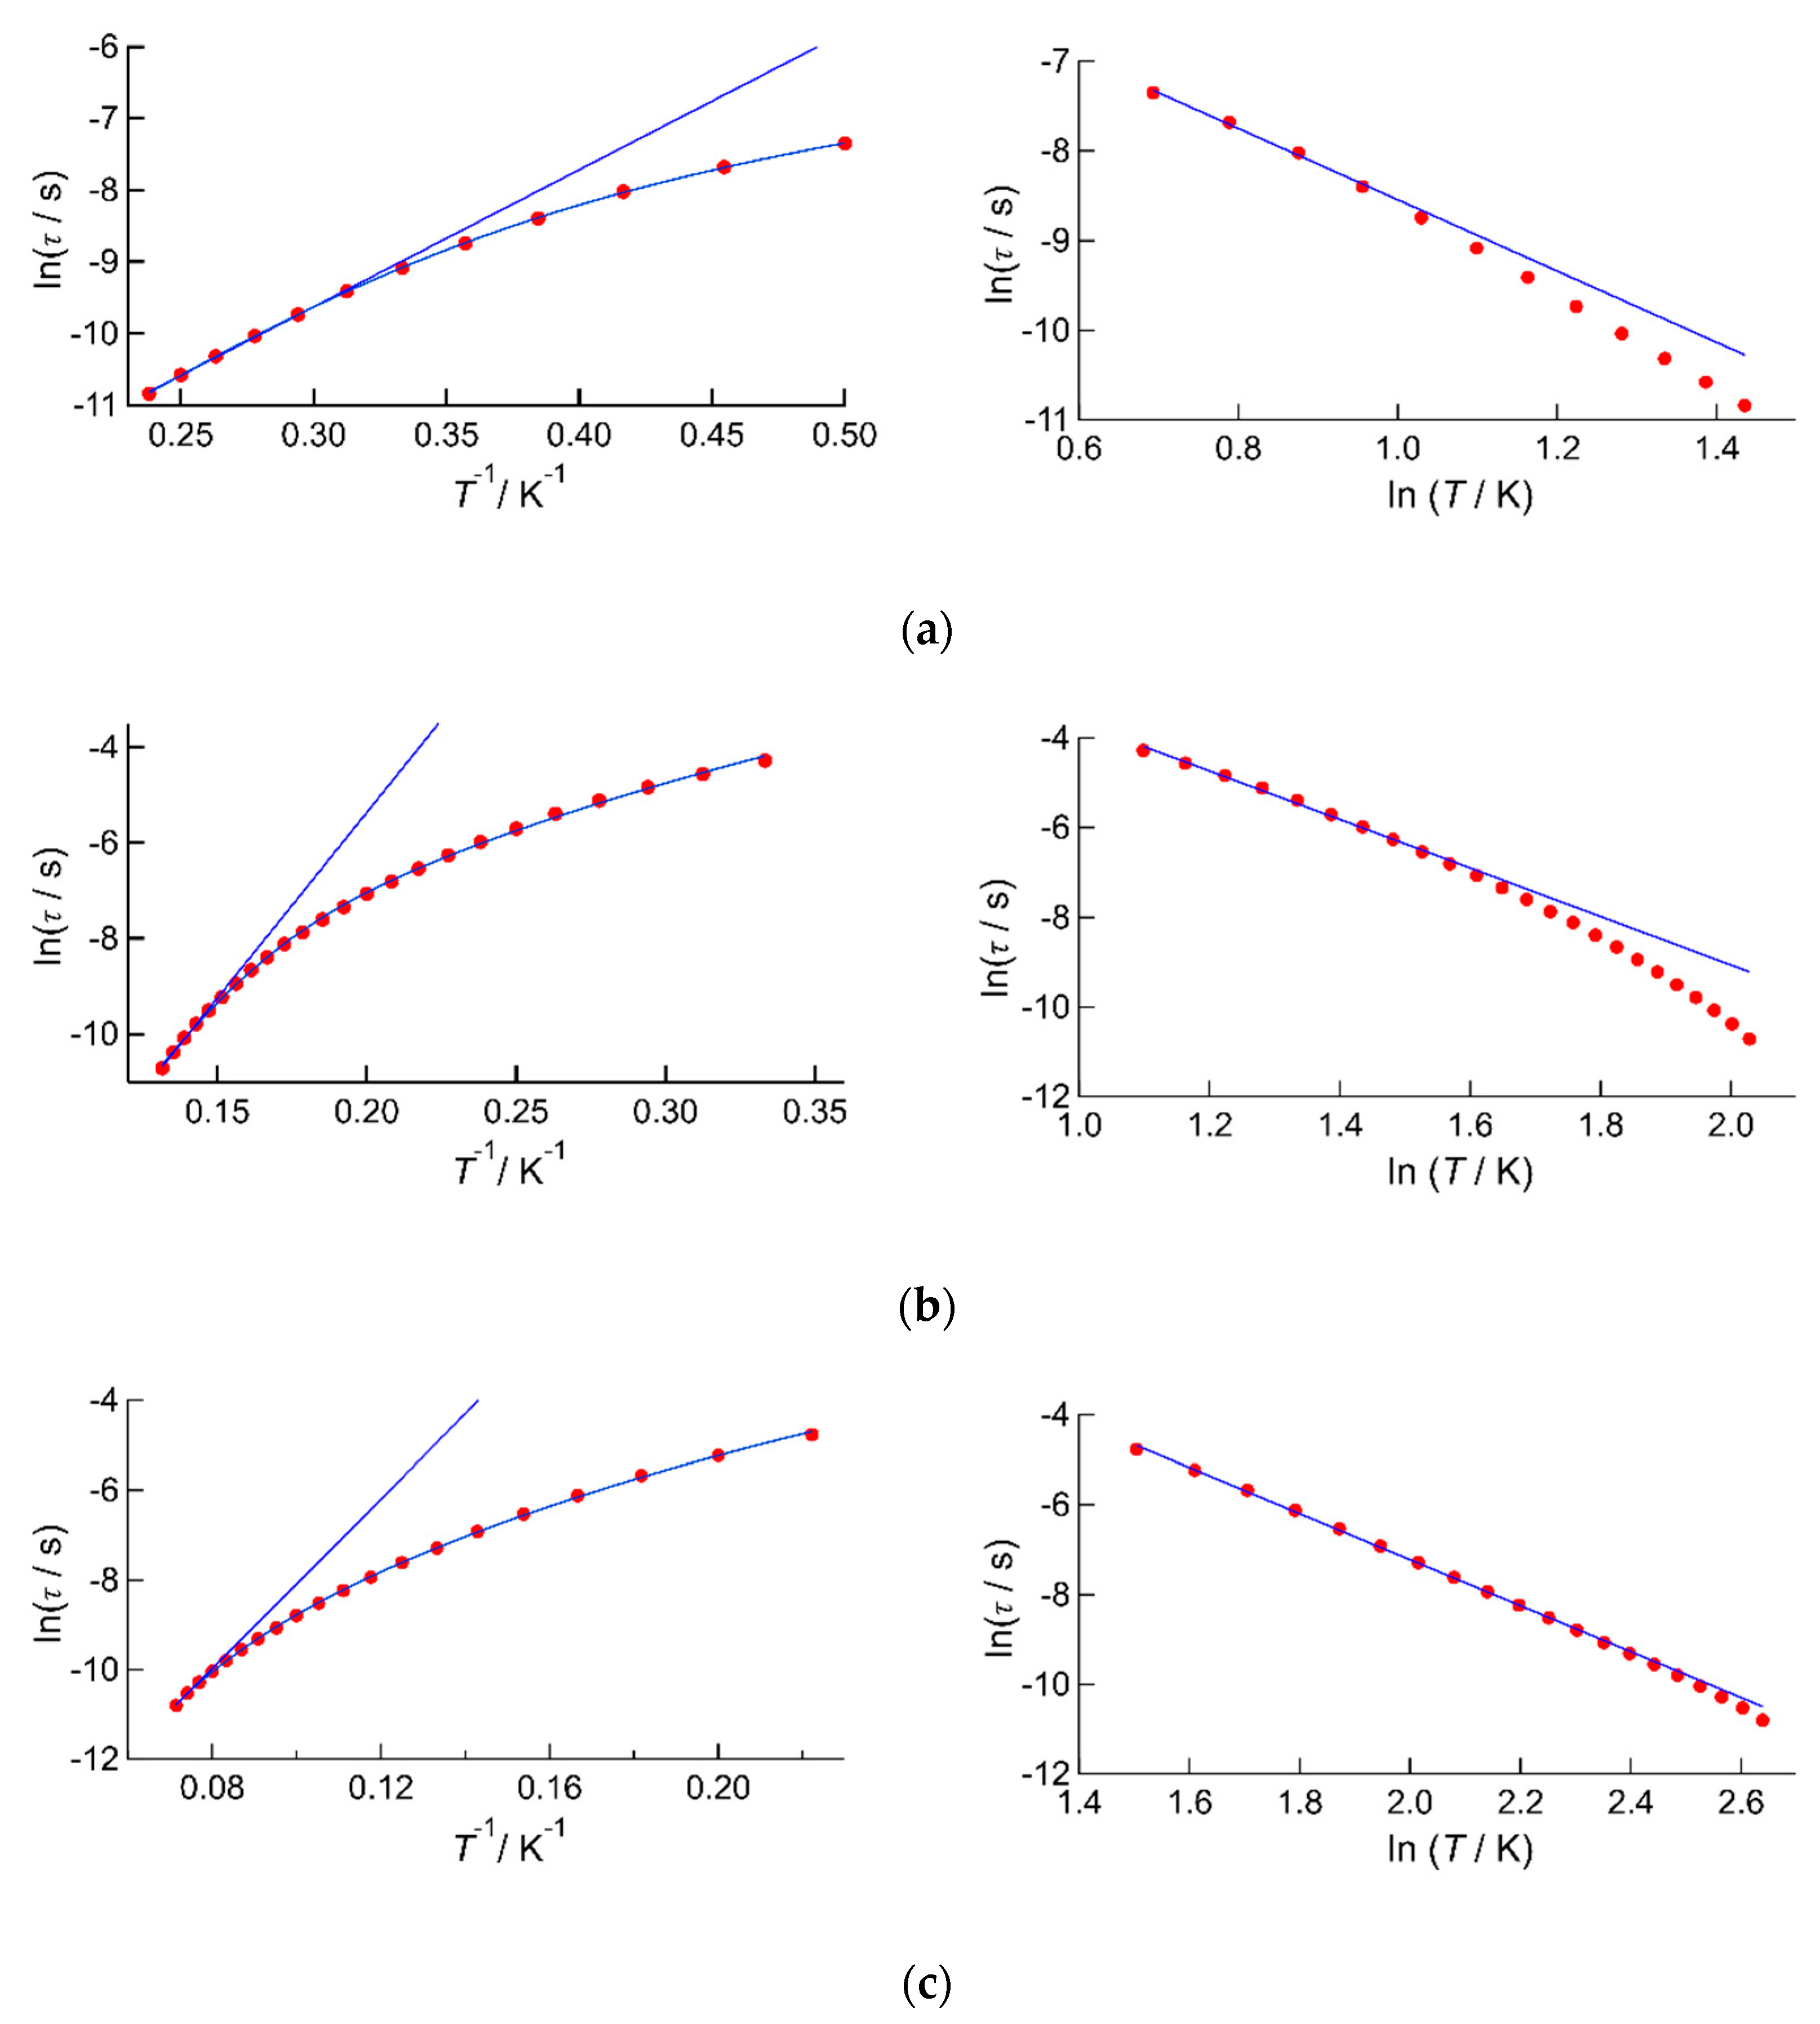
Next we examined the temperature dependence of relaxation time τ using two methods. The left column in Figure 7 shows the Arrhenius plots for three complexes measured under a 1000 Oe DC applied field. Bent plots were obtained for all complexes over the entire temperature range. The QTM and direct processes were effectively suppressed under these conditions (Figure 4), and hence the bent shaped plots were due to the presence of Raman and Orbach processes; these two processes dominate in different temperature ranges. The data were first analyzed using the linear Arrhenius equation for the data in high temperature regions, where the Orbach process is predominant. This gave the best fit parameters of ΔE/kB = 19.1(3) K and τ0−1 = 2.1(2) × 10−7 s for 1, 82(3) K and 5(2) × 10−10 s for 2, and 84(3) K and 5(1) × 10−8 s for 3.
The right column in Figure 7 shows the temperature dependence of τ in double logarithm plots. It is known that the Raman process dominates in low temperature regions and that it obeys Equation (3) below. In plots of ln(τ) vs. ln(T), relaxation via the Raman process is easily identified as a linear region found at low temperatures. The data here were analyzed using Equation (3), which gave the best fit parameters of C = 96(15) s−1 K−4.0 and n = 4.0(2) for 1, C = 0.17(3) s−1 K−5.42 and n = 5.42(13) for 2, and C = 0.048(4) s−1 K−5.12 and n = 5.12(4) for 3.
τ 1 = C T n ,   ln τ = ln C n ln T
Finally, the whole dataset was analyzed using Equation (4) which considers both Raman and Orbach processes [30,31].
τ 1 = C T n + τ 0 1 exp ( Δ E k B T ) ,
The estimated values are summarized in Table 1. Some parameters differ from the values based on the simple Raman or Orbach process. This may be due to the narrow range of temperatures where slow magnetic relaxation was observed.
From the structural analyses, the crystal field anisotropy as well as the magnetic anisotropy is enhanced in the order of 1 to 3, and the kinetic parameters in Table 1 clearly support the idea. This result indicates that magnetic relaxation phenomena are strongly dependent on the nature of axial ligands, and that the increase of negative charge distributions on O-donor atoms plays a primitive role in enhancing the magnetic anisotropy. However, the structural changes from complex 1 with NO3 axial ligands to 2 with AcO axial ligands were small, while the increase of ΔE/kB values was rather drastic. This may suggest the presence of other factors enhancing the barrier height of the magnetization flipping; hence we examined the electronic structures of the complexes with the DFT technique shown below.

2.3. Molecular Orbital Analyses

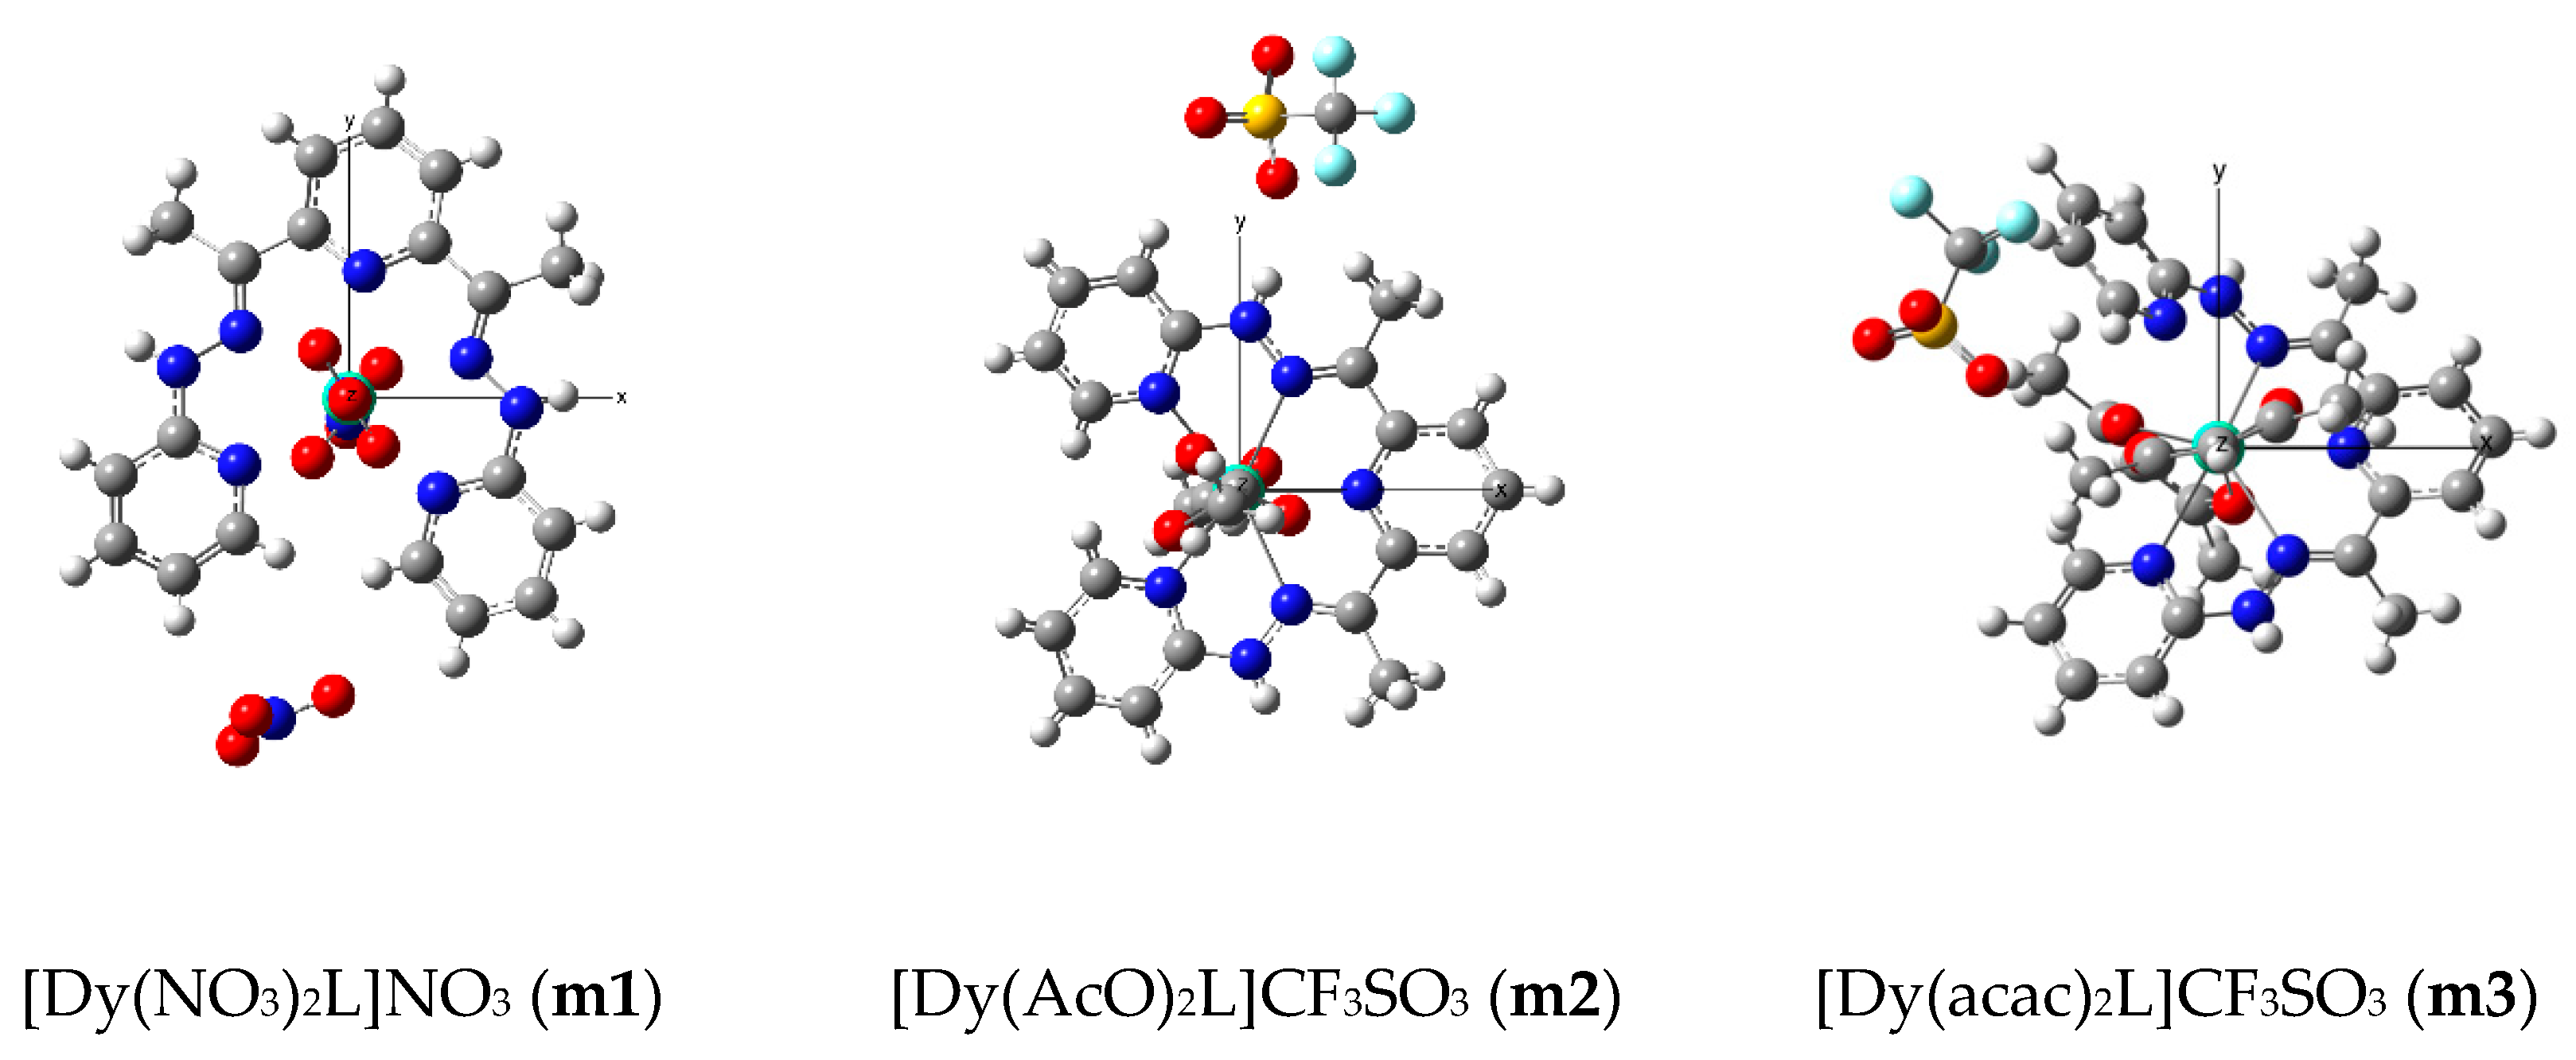
To elucidate the electronic structures of these complexes, we performed density functional theory (DFT) calculations for three model structures m1m3, pertaining to complexes 13, respectively, as illustrated in Figure 8. Calculated atomic spin densities of the Dy(III) ions in each model summarized in Table 2 are confirmed to be ~5.0, showing that the appropriate electronic configurations are obtained. Kohn-Sham orbital shapes and the energies of f orbitals are summarized in Figure S7 in the Supplementary Information, together with orbital energies of the highest occupied molecular orbital (HOMO). The energy level of occupied f electrons is approximately −10 to −13 eV, much lower than those of HOMO; this suggests that those are independent of the effects of frontier orbitals. On the other hand, those energy levels are comparable to the levels of coordinating σ orbitals and the stable π orbitals of ligands. As a consequence, some f orbitals can be hybridized with those ligand orbitals, although it is usually assumed that the f orbitals do not interact with ligand orbitals. As depicted in Figure S7, the f orbitals of m1 are almost localized, except for HOMO-39(a) and HOMO-46(a) that are also found in equatorial ligand, while those of m2 and m3 are more delocalized by hybridization especially with σ and π orbitals of axial AcO and acac ligands, respectively. In addition, the atomic spin densities of the Dy(III) ions in m2 and m3 are slightly smaller than those in m1. The result also indicates that the f spins are slightly delocalized to the ligands in m2 and m3. Hence, the f electrons are considered to interact with axial ligand orbitals in m2 and m3 but not in m1, suggesting that the magnetic anisotropy of m2 and m3 can be affected by such hybridization between f and ligand orbitals.

3. Materials and Methods

3.1. General Procedures and Methods

All chemicals and reagents were of reagent grade and used without further purification. All chemical reactions and sample preparations for physical measurements were performed in an ambient atmosphere. Variable temperature magnetic susceptibility measurements were performed on PPMS-9 and MPMS-XL magnetometers (Quantum Design). Diamagnetic corrections for each sample were applied using Pascal’s constants. Elemental analyses were carried out with the help of the Research and Analytical Centre for Giant Molecules, Graduate School of Science, Tohoku University.

3.2. Synthesis of Complexes

Synthesis of L: The ligand L was prepared according to a previously reported method [32]. 10 mmol of 2,6-diacetylpyridine and 20 mmol of 2-pyridylhydrazine were dissolved into 25 mL of EtOH and one drop of conc. HCl solution was added. The resulting solution was stirred at 60 °C for 1 h to give a pale-yellow precipitate. The solution was left to stand for one night at room temperature to complete the reaction, and then the precipitate was filtrated under reduced pressure, washed with EtOH, and dried in vacuo. Yield 3.01 g (8.7 mmol, 87%).
Synthesis of [DyL(NO3)2]NO3 (1): To the suspension of L (34.3 mg, 0.1 mmol) in MeCN (5 mL), 5 mL of 0.02 M Dy(NO3)3·5H2O solution in MeCN was added. The resulting yellow-orange solution was left to stand for several days to give yellow prismatic crystals of 1 suitable for X-ray crystallography. Yield 52 mg, 75%. Elemental Anal. Calcd. for [Dy(L)(NO3)2]NO3 (C19H19DyN10O9) C, 32.89; H, 2.76; N, 20.19. Found C, 32.92; H 2.78; N, 20.07.
Synthesis of [DyL(AcO)2]CF3SO3 (2): With the suspension of L (20.7 mg, 0.06 mmol) in EtOH (2 mL), 0.8 mL of 0.05 M ethanolic solution of Dy(AcO)3·4H2O and 0.2 mL of 0.1 M ethanolic solution of Dy(CF3SO3)3 were reacted. The resulting yellow-orange solution was sealed and left to stand for several days, giving yellow cubic crystals of 2 suitable for X-ray crystallography. Yield 35 mg, 72%. Elemental Anal. Calcd. for [Dy(L)(AcO)2]CF3SO3·0.75EtOH·0.5H2O (C25.5H30.5DyF3N7O8.25S) C, 37.41; H, 3.76; N, 11.98. Found C, 37.49; H 3.66; N, 12.15.
Synthesis of [DyL(acac)2]CF3SO3 (3): To the suspension of L (20.6 mg, 0.06 mmol) in 2-propanol (2 mL), 0.8 mL of 0.05 M Dy(acac)3 and 0.2 mL of 0.1 M Dy(CF3SO3)3 solutions in the same solvent were added. The resulting yellow-orange solution was sealed and left to stand for several days to give yellow prismatic crystals of 3 suitable for X-ray crystallography. Yield 15 mg, 29%. Elemental Anal. Calcd. for [Dy(L)(acac)2]CF3SO3·H2O (C30H35DyF3N7O8S) C, 41.26; H, 4.04; N, 11.23. Found C, 41.16; H 3.95; N, 11.24.

3.3. Crystallography

A single crystal of each complex was mounted on a Rigaku Varimax Saturn area detector for data collection using confocal monochromated MoKα radiation at low temperature (153 K). Intensity data were corrected for absorption using an empirical method included in the Crystal Clear software [33]. The structures were solved by direct methods with SIR-97 [34], and structure refinement was carried out using the full-matrix least-squares method on SHELXL-2013 [35]. Non-hydrogen atoms were anisotropically refined and hydrogen atoms were treated using the riding model. Crystallographic data are summarized in Tables S1 and S2 of the Supplementary Information. The complete crystal structure results, including bond lengths, angles, and atomic coordinates, are available as a CIF file in the Supplementary Information. The CCDC numbers are 1903775, 1903776, and 1903777 for compounds 1, 2, and 3, respectively.

3.4. DFT Calculation

DFT calculations were performed for the model structures of m1m3. Cartesian coordinates of the models summarized in Table S7 in the Supplementary Information are taken from the results of the above X-ray crystallographic analyses. All calculations were carried out using a Becke 3-parameter Lee-Yang-Parr hybrid functional set (B3LYP) [36] with a spin-unrestricted method under the gas phase condition. As a basis set, the Stuttgart RSC 1997 effective core potential [37] was used for the Dy atom in all models. 6-31+G* and 6-31G* were used for NO3 in m1 and the other ligands, respectively. All calculations were performed using Gaussian09 [38].

4. Conclusions

Using N5 ligand L, three Dy(III) complexes with similar coordination structures were synthesized. In each complex, equatorial positions of Dy(III) ion were occupied by five N-donor atoms from L, and the up- and down-sides were occupied by anionic O-donor atoms aiming to achieve the easy-axis magnetic anisotropy of an oblate type Dy(III) ion. In an anisotropic crystal field, the oblate shaped electronic cloud of the Kramers pair with the most Ising character was relatively stable. The complexes showed slow magnetic relaxation phenomena under application of a 1000 Oe bias DC field, and the barrier heights for the magnetization flipping were estimated as ΔE/kB = 24.1(6) K, 85(3) K, and 140(15) K from the Arrhenius analyses, considering both Orbach and Raman relaxation processes. This order of barrier height is consistent with the strength of the crystal field anisotropy assessed from structural analysis of characteristics such as the Dy-O and Dy-N distances. However, the difference of the ΔE/kB values between 1 and 2 were unexpectedly greater than the difference in coordinating structures. From the DFT calculations, it was found that the π character of the axial ligand plays significant role in the enhancement of magnetic anisotropy. In 2 and 3, the results indicated that the interactions between f orbitals of Dy(III) and both σ and π orbitals of AcO and acac ligands were small but not ignorable, and that this may cause the presence of stronger magnetic anisotropy than in 1. Our calculation results are not quantitative at present, and the prediction requires experimental confirmation; however, the idea could give a new perspective in designing SMMs with lanthanide(III) ions. Such an investigation is in progress in our group.

Supplementary Materials

The following are available online at https://www.mdpi.com/2312-7481/5/2/27/s1, Figure S1: PXRD patterns of 13, Figures S2–S4: crystal packing of 13, Figure S5: Ortep drawings of 13, Figure S6: frequency dependence of χMT and χM″ of 13 measured under zero bias field condition, Figure S7: Kohn–Sham orbitals of f orbitals for models m1m3, Table S1: crystallographic data for 13, Table S2: selected bond distances and angles for 13, Table S3: best fitted parameters using Cole–Cole equation for 1, Table S4: best fitted parameters using Cole–Cole equation for 2, Table S5: best fitted parameters using Cole–Davidson equation for 3, Table S6: Cartesian coordinates of m1m3 for DFT calculations.

Author Contributions

K.K. and Y.H. prepared and characterized the complexes. K.K. and T.K. performed the magnetic measurements and analyzed the data. K.I., M.N., and Y.K. performed the DFT calculations and analyzed the results. All the authors reviewed the paper.

Funding

This work was supported in part by grant-in-aid for Scientific Research (C) (No. 17K05811) from JSPS, Japan (T.K.)

Conflicts of Interest

The authors declare no conflicts of interest.

Abbreviations

ORTEPOak Ridge Thermal-Ellipsoid Plot program

References

  1. Gatteschi, D.; Sessoli, R.; Villain, J. Molecular Nanomagnets; Oxford University Press: New York, NY, USA, 2006. [Google Scholar]
  2. Layfield, R.A. Organometallic Single-Molecule Magnets. Organometallics 2014, 33, 1084–1099. [Google Scholar] [CrossRef]
  3. Madhu, N.T.; Tang, J.-K.; Hewitt, I.J.; Clérac, R.; Wernsdorfer, W.; van Slageren, J.; Anson, C.E.; Powell, A.K. What makes a single molecule magnet? Polyhedron 2005, 24, 2864–2869. [Google Scholar] [CrossRef]
  4. Glaser, T. Rational design of single-molecule magnets: A supramolecular approach. Chem. Commun. 2011, 47, 116–130. [Google Scholar] [CrossRef]
  5. Woodruff, D.N.; Winpenny, R.E.; Layfield, R.A. Lanthanide single-molecule magnets. Chem. Rev. 2013, 113, 5110–5148. [Google Scholar] [CrossRef] [PubMed]
  6. Zhang, P.; Guo, Y.-N.; Tang, J. Recent advances in dysprosium-based single molecule magnets: Structural overview and synthetic strategies. Coord. Chem. Rev. 2013, 257, 1728–1763. [Google Scholar] [CrossRef]
  7. Feltham, H.L.C.; Brooker, S. Review of purely 4f and mixed-metal nd-4f single-molecule magnets containing only one lanthanide ion. Coord. Chem. Rev. 2014, 276, 1–33. [Google Scholar] [CrossRef]
  8. Liddle, S.T.; van Slageren, J. Improving f-element single molecule magnets. Chem. Soc. Rev. 2015, 44, 6655–6669. [Google Scholar] [CrossRef] [Green Version]
  9. Meng, Y.S.; Jiang, S.D.; Wang, B.W.; Gao, S. Understanding the Magnetic Anisotropy toward Single-Ion Magnets. Acc. Chem. Res. 2016, 49, 2381–2389. [Google Scholar] [CrossRef] [PubMed]
  10. Day, B.M.; Guo, F.S.; Layfield, R.A. Cyclopentadienyl Ligands in Lanthanide Single-Molecule Magnets: One Ring to Rule Them All? Acc. Chem. Res. 2018, 51, 1880–1889. [Google Scholar] [CrossRef] [PubMed]
  11. Chen, Y.C.; Liu, J.L.; Ungur, L.; Liu, J.; Li, Q.W.; Wang, L.F.; Ni, Z.P.; Chibotaru, L.F.; Chen, X.M.; Tong, M.L. Symmetry-Supported Magnetic Blocking at 20 K in Pentagonal Bipyramidal Dy(III) Single-Ion Magnets. J. Am. Chem. Soc. 2016, 138, 2829–2837. [Google Scholar] [CrossRef]
  12. Goodwin, C.A.P.; Ortu, F.; Reta, D.; Chilton, N.F.; Mills, D.P. Molecular magnetic hysteresis at 60 kelvin in dysprosocenium. Nature 2017, 548, 439–442. [Google Scholar] [CrossRef] [Green Version]
  13. Yu, S.; Hu, Z.; Chen, Z.; Li, B.; Zhang, Y.Q.; Liang, Y.; Liu, D.; Yao, D.; Liang, F. Two Dy(III) Single-Molecule Magnets with Their Performance Tuned by Schiff Base Ligands. Inorg. Chem. 2019. [Google Scholar] [CrossRef] [PubMed]
  14. Yang, J.W.; Tian, Y.M.; Tao, J.; Chen, P.; Li, H.F.; Zhang, Y.Q.; Yan, P.F.; Sun, W.B. Modulation of the Coordination Environment around the Magnetic Easy Axis Leads to Significant Magnetic Relaxations in a Series of 3d-4f Schiff Complexes. Inorg. Chem. 2018, 57, 8065–8077. [Google Scholar] [CrossRef] [PubMed]
  15. Shen, F.X.; Li, H.Q.; Miao, H.; Shao, D.; Wei, X.Q.; Shi, L.; Zhang, Y.Q.; Wang, X.Y. Heterometallic M(II)Ln(III) (M = Co/Zn; Ln = Dy/Y) Complexes with Pentagonal Bipyramidal 3d Centers: Syntheses, Structures, and Magnetic Properties. Inorg. Chem. 2018. [Google Scholar] [CrossRef] [PubMed]
  16. Ehama, K.; Ohmichi, Y.; Sakamoto, S.; Fujinami, T.; Matsumoto, N.; Mochida, N.; Ishida, T.; Sunatsuki, Y.; Tsuchimoto, M.; Re, N. Synthesis, structure, luminescent, and magnetic properties of carbonato-bridged Zn(II)2Ln(III)2 complexes [(m4-CO3)2{Zn(II)L(n)Ln(III)(NO3)}2] (Ln(III) = Gd(III), Tb(III), Dy(III); L(1) = N,N′-bis(3-methoxy-2-oxybenzylidene)-1,3-propanediaminato, L(2) = N,N′-bis(3-ethoxy-2-oxybenzylidene)-1,3-propanediaminato). Inorg. Chem. 2013, 52, 12828–12841. [Google Scholar] [CrossRef] [PubMed]
  17. Long, J.; Basalov, I.V.; Forosenko, N.V.; Lyssenko, K.A.; Mamontova, E.; Cherkasov, A.V.; Damjanovic, M.; Chibotaru, L.F.; Guari, Y.; Larionova, J.; et al. Dysprosium Single-Molecule Magnets with Bulky Schiff Base Ligands: Modification of the Slow Relaxation of the Magnetization by Substituent Change. Chemistry 2019, 25, 474–478. [Google Scholar] [CrossRef]
  18. Bar, A.K.; Kalita, P.; Sutter, J.P.; Chandrasekhar, V. Pentagonal-Bipyramid Ln(III) Complexes Exhibiting Single-Ion-Magnet Behavior: A Rational Synthetic Approach for a Rigid Equatorial Plane. Inorg. Chem. 2018, 57, 2398–2401. [Google Scholar] [CrossRef] [PubMed]
  19. Long, J.; Tolpygin, A.O.; Cherkasov, A.V.; Lyssenko, K.A.; Guari, Y.; Larionova, J.; Trifonov, A.A. Single-Molecule Magnet Behavior in Dy3+ Half-Sandwich Complexes Based on Ene-Diamido and Cp* Ligands. Organometallics 2019, 38, 748–752. [Google Scholar] [CrossRef]
  20. Maxwell, L.; Amoza, M.; Ruiz, E. Mononuclear Lanthanide Complexes with 18-Crown-6 Ether: Synthesis, Characterization, Magnetic Properties, and Theoretical Studies. Inorg. Chem. 2018, 57, 13225–13234. [Google Scholar] [CrossRef]
  21. Wada, H.; Ooka, S.; Iwasawa, D.; Hasegawa, M.; Kajiwara, T. Slow Magnetic Relaxation of Lanthanide(III) Complexes with a Helical Ligand. Magnetochemistry 2016, 2, 43. [Google Scholar] [CrossRef]
  22. Ji, C.-L.; Jiang, Y.-X.; Zhang, J.-C.; Qi, Z.-Y.; Kong, J.-J.; Huang, X.-C. Field-induced Slow Magnetic Relaxation Behavior in a Mononuclear Dy(III) Complex based on 8-Hydroxyquinoline Derivate Ligand. Zeitschrift für Anorganische und Allgemeine Chemie 2018, 644, 1635–1640. [Google Scholar] [CrossRef]
  23. Then, P.L.; Takehara, C.; Kataoka, Y.; Nakano, M.; Yamamura, T.; Kajiwara, T. Structural switching from paramagnetic to single-molecule magnet behaviour of LnZn2 trinuclear complexes. Dalton Trans. 2015, 44, 18038–18048. [Google Scholar] [CrossRef] [PubMed]
  24. Hino, S.; Maeda, M.; Yamashita, K.; Kataoka, Y.; Nakano, M.; Yamamura, T.; Nojiri, H.; Kofu, M.; Yamamuro, O.; Kajiwara, T. Linear trinuclear Zn(II)-Ce(III)-Zn(II) complex which behaves as a single-molecule magnet. Dalton Trans. 2013, 42, 2683–2686. [Google Scholar] [CrossRef] [PubMed]
  25. Takehara, C.; Then, P.L.; Kataoka, Y.; Nakano, M.; Yamamura, T.; Kajiwara, T. Slow magnetic relaxation of light lanthanide-based linear LnZn2 trinuclear complexes. Dalton Trans. 2015, 44, 18276–18283. [Google Scholar] [CrossRef] [PubMed]
  26. Wada, H.; Ooka, S.; Yamamura, T.; Kajiwara, T. Light Lanthanide Complexes with Crown Ether and Its Aza Derivative Which Show Slow Magnetic Relaxation Behaviors. Inorg. Chem. 2017, 56, 147–155. [Google Scholar] [CrossRef]
  27. Hasegawa, M.; Ohtsu, H.; Kodama, D.; Kasai, T.; Sakurai, S.; Ishii, A.; Suzuki, K. Luminescence behaviour in acetonitrile and in the solid state of a series of lanthanide complexes with a single helical ligand. New J. Chem. 2014, 38, 1225–1234. [Google Scholar] [CrossRef] [Green Version]
  28. Cole, K.S.; Cole, R.H. Dispersion and Absorption in Dielectrics I. Alternating Current Characteristics. J. Chem. Phys. 1941, 9, 341–351. [Google Scholar] [CrossRef]
  29. Davidson, D.W.; Cole, R.H. Dielectric Relaxation in Glycerol, Propylene Glycol, andn-Propanol. J. Chem. Phys. 1951, 19, 1484–1490. [Google Scholar] [CrossRef]
  30. Abragam, A.; Bleaney, B. Electron Paramagnetic Resonance of Transition Ions; Oxford University Press: Oxford, UK, 1970. [Google Scholar]
  31. Carlin, R.L. Magnetochemistry; Springer: Berlin/Heidelberg, Germany, 1986. [Google Scholar]
  32. Sakamoto, M.; Matsumoto, N.; Okawa, H. Synthesis and Molecular Structure of Europium(III) Complex with 2,6-Diacetylpyridine Bis(2-pyridylhydrazone). Bull. Chem. Soc. Jpn. 1991, 64, 691–693. [Google Scholar] [CrossRef]
  33. Crystal Clear, Operating Software for the CCD Detector System; Version 1.3.5; Rigaku and Molecular Structure Corp.: Tokyo, Japan; The Woodlands, TX, USA, 2003.
  34. Altomare, A.; Burla, M.C.; Camalli, M.; Cascarano, G.L.; Giacovazzo, C.; Guagliardi, A.; Moliterni, A.G.G.; Polidori, G.; Spagna, R. SIR97: A new tool for crystal structure determination and refinement. J. Appl. Crystallogr. 1999, 32, 115–119. [Google Scholar] [CrossRef]
  35. Sheldrick, G. Crystal structure refinement with SHELXL. Acta Crystallogr. Sect. C Struct. Chem. 2015, 71, 3–8. [Google Scholar] [CrossRef] [PubMed]
  36. Becke, A. Density-functional thermochemistry. III. The role of exact exchange. J. Chem. Phys. 1993, 98, 5648–5652. [Google Scholar] [CrossRef]
  37. Andrae, D.; Häußermann, U.; Dolg, M.; Stoll, H.; Preuß, H. Energy-adjustedab initio pseudopotentials for the second and third row transition elements. Theor. Chim. Acta 1990, 77, 123–141, Note that this basis set is quasi-relativistic and sometimes called MWB28 or SDD. [Google Scholar] [CrossRef]
  38. Frisch, M.J.; Trucks, G.W.; Schlegel, H.B.; Scuseria, G.E.; Robb, M.A.; Cheeseman, J.R.; Scalmani, G.; Barone, V.; Mennucci, B.; Petersson, G.A.; et al. Gaussian 09; Revision C01; Gaussian, Inc.: Wallingford, CT, USA, 2009. [Google Scholar]
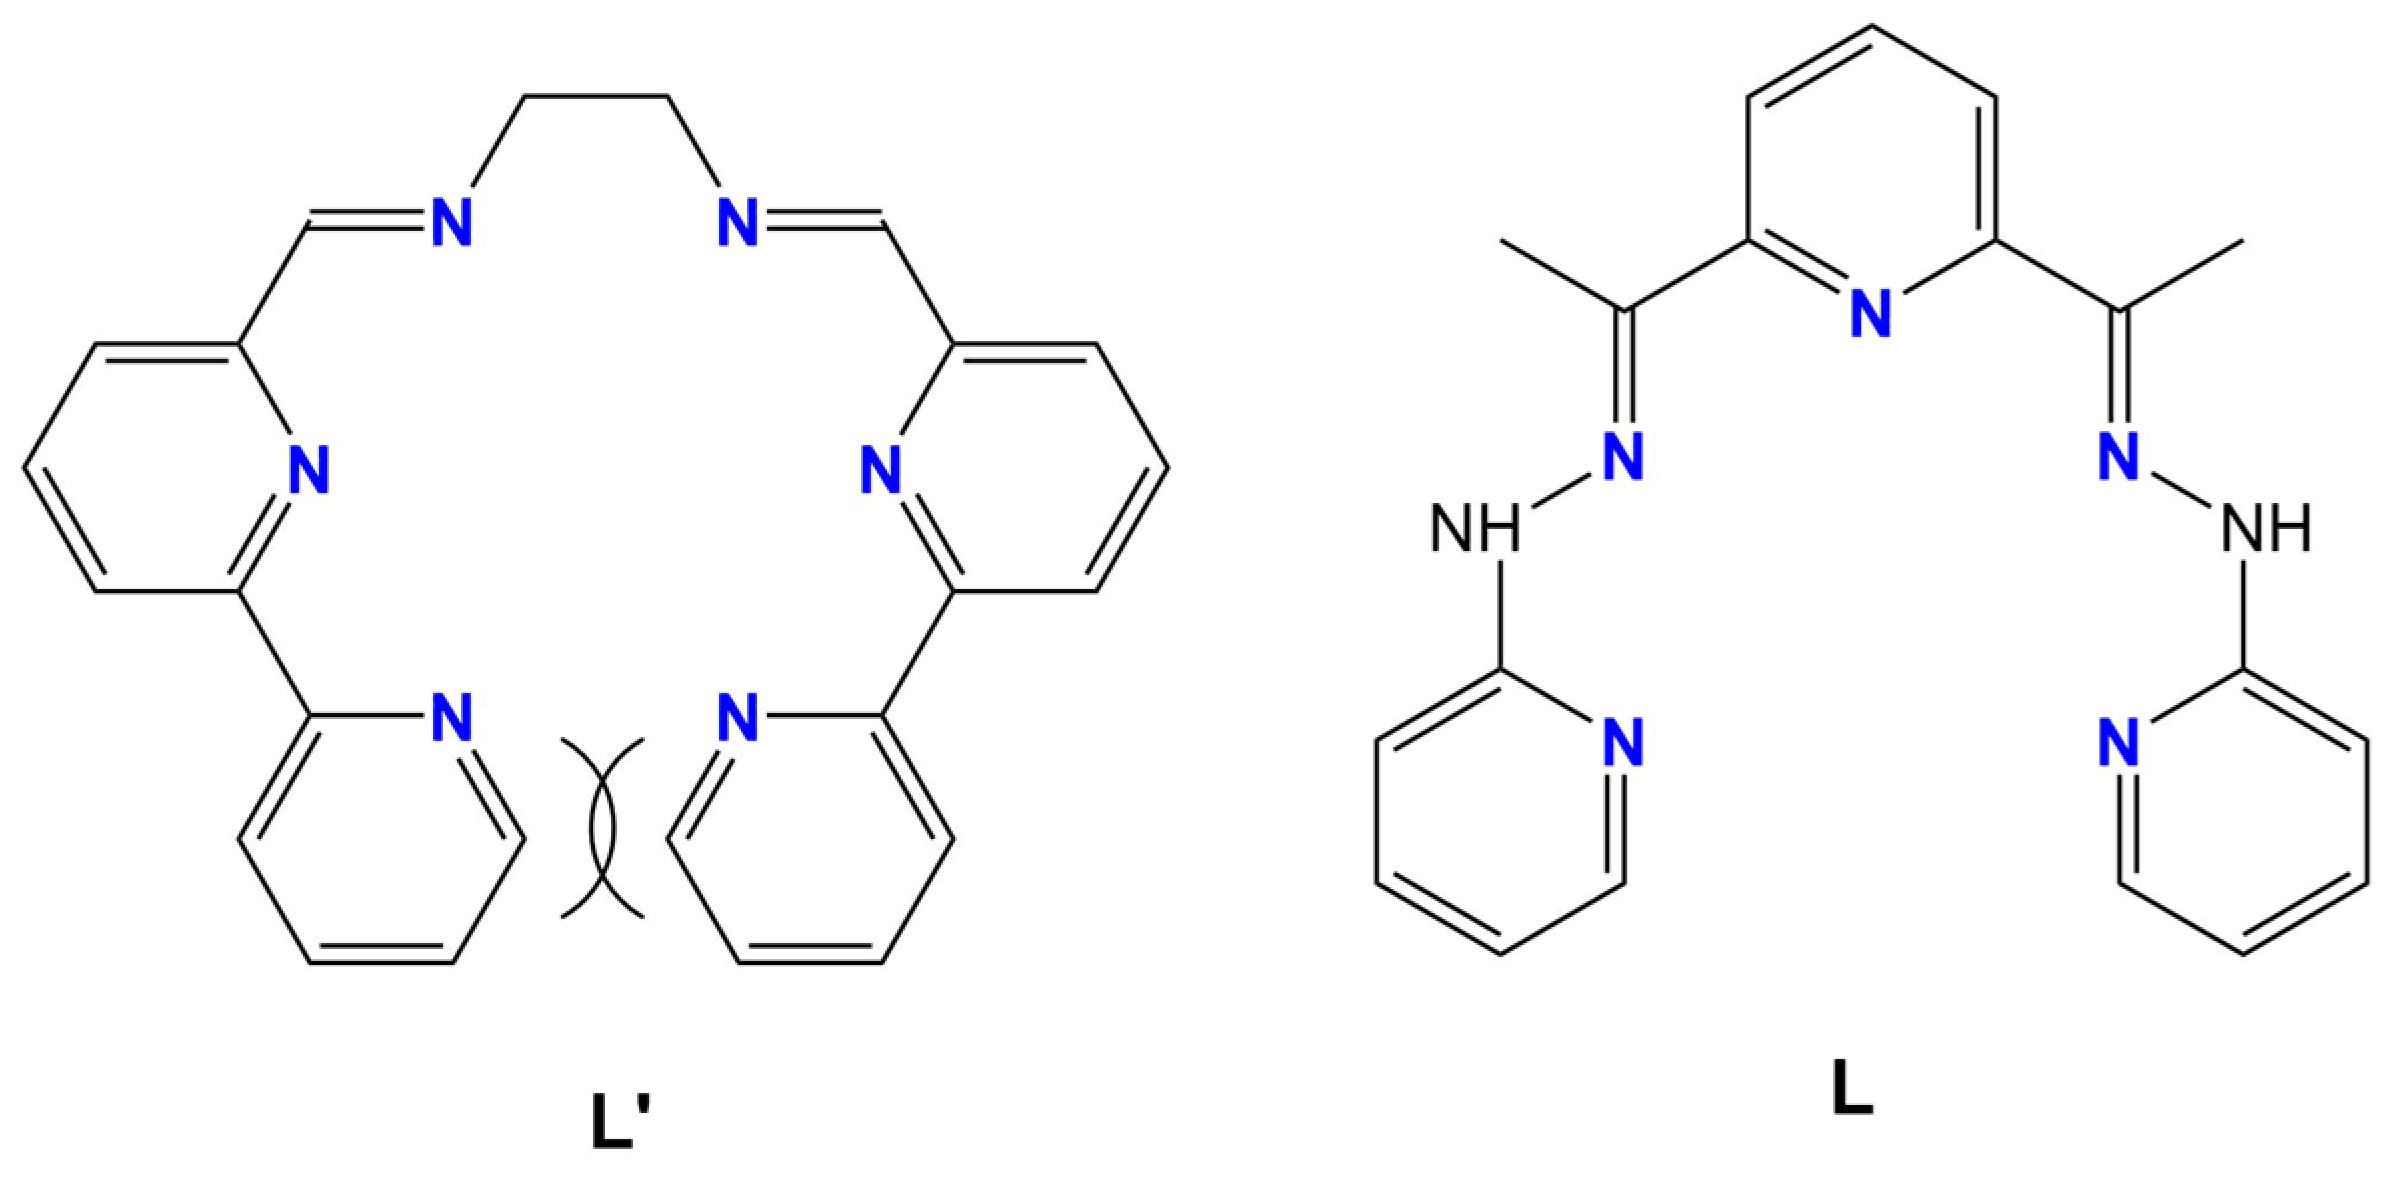
Figure 1. Structure of N6 ligand L′ and N5 ligand L.
Magnetochemistry 05 00027 g001
Figure 2. ORTEP drawing of the cationic parts of 1 (top), 2 (central), and 3 (bottom) at the 50% probability level. Hydrogen atoms are omitted for clarity: (a,c,e) Top view and (b,d,f) side view of the molecules.
Magnetochemistry 05 00027 g002
Figure 3. Temperature dependence of the χMT product for each complex measured under a 1000 Oe DC field applied condition.
Magnetochemistry 05 00027 g003
Figure 4. DC field dependence of the relaxation rate τ−1 of (a) 1, (b) 2, and (c) 3 measured in the temperature ranges of 2 to 4 K, 4 to 7 K, and 6 to 12 K, respectively.
Magnetochemistry 05 00027 g004
Figure 5. AC susceptibility data of (a) 1, (b) 2, and (c) 3 measured under an application of 1000 Oe bias field: frequency dependence of the products of temperature and in-phase susceptibility (closed circles) and out-of-phase susceptibility (open circles) measured at several temperatures. Solid curves represent theoretical calculations on the basis of the Cole–Cole equation for 1 and 2, or the Cole–Davidson equation for 3, of which the estimated parameters are listed in Tables S3–S5.
Magnetochemistry 05 00027 g005
Figure 6. Theoretical curves of the out-of-phase susceptibility χ″ as a function of ωτ for several α values (left) or β values (right), calculated on the basis of the Cole–Cole and Cole–Davidson equations. At α = 0 and β = 0, both plots obey Debye equation. The value of χ″ was normalized as 1.0 at ωτ = 0 and α = 0 for the left plot and at ωτ = 0 and = 0 for the right plot.
Magnetochemistry 05 00027 g006
Figure 7. Temperature dependence of the flipping time of magnetization τ measured for (a) 1, (b) 2, and (c) 3 under an application of 1000 Oe DC field. (left) Arrhenius plots and (right) ln(τ) vs. ln(T) plots. The blue lines represent theoretical calculations based on the linear Arrhenius equation for the Orbach process (left) or based on Equation (3) for the Raman process (right). The blue curves represent theoretical calculations considering both Orbach and Raman processes, expressed as Equation (4).
Magnetochemistry 05 00027 g007
Figure 8. Model structures m1m3 for complexes 13, respectively.
Magnetochemistry 05 00027 g008
Table 1. Best fit kinetic parameters for magnetization flipping estimated for complexes 13 on the basis of the Equation (4).
Complex123
ΔE kB‒1/K24.1(6)85(3)140(15)
τ0/s9.0(9) × 10−85(2) × 10−103(3) × 10−9
n3.09(15)5.4(1)5.06(4)
C/s‒1 Kn174(18)0.17(2)0.054(4)
Table 2. Calculated atomic spin densities assigned to each f orbitals.
Orbitalsm1m2m3
f00.490.430.80
f+10.980.720.64
f−10.880.840.35
f+20.510.860.73
f−20.550.210.72
f+30.610.850.74
f−30.930.510.44
Sum of f orbitals4.964.424.41