Abstract
Multifunctional Single-Molecule Magnets (SMMs) or Single-Ion Magnets (SIMs) are intriguing molecule-based materials presenting an association of the slow magnetic relaxation with other physical properties. In this article, we present an example of a very simple molecule based on Dy3+ ion exhibiting a field induced SIM property and a characteristic Dy3+ based emission. The [Dy(NO3)3(H2O)4]·2H2O (1) complex is characterized by the means of single crystal X-Ray diffraction and their magnetic and photo-luminescent properties are investigated. We demonstrate here that it is possible to correlate the magnetic and luminescent properties and to obtain the Orbach barrier from the low temperature emission spectra, which is often difficult to properly extract from the magnetic measurements, especially in the case of field induced SIMs.
1. Introduction
Single-Ion Magnets (SIMs) are intriguing mononuclear coordination complexes which represent one of the smallest magnetically bistable units since they are composed of a single paramagnetic transition metal or lanthanide ion [1,2,3]. Consequently, such molecular objects appear as promising candidates for high-density data storage or quantum computing [1,4]. In the case of lanthanide ions, the magnitude of the anisotropic barrier responsible for the reversal of the magnetization arises from the intrinsic electronic structure and in particular from the sub-levels structure of the Stark components. Such energetic considerations rely on numerous parameters including the nature of the lanthanide ion (Kramers/non-Kramers character, oblate/prolate electronic density), its geometry as well as the overall coordination environment often governed by the donor strength of the ligands [5]. In addition, the relaxation of the magnetization may be governed by various mechanisms that are either spin-lattice processes (Orbach, Raman and direct relaxations) or the Quantum Tunneling of the Magnetization (QTM). The latter is known to depend also on numerous parameters such as the occurrence of magnetic exchange interactions, hyperfine coupling or dipolar interactions [6]. Understanding the mechanisms that govern the relaxation of the magnetization and the parameters that affect these relaxation processes is particularly important to ultimately optimize the SIM features.
In this line of scope, luminescent SIMs are particularly appropriate for these investigations since the photo-luminescence measurements permit determining spectroscopically the Stark sub-level structure of the lanthanides ions and comparing it with the magnetic data. However, examples of such magneto-optical correlations are rather scarce [7,8,9,10,11,12,13,14,15,16,17,18] in comparison with the large number of reported lanthanides-based SIMs. This fact is often due to the weak or completely quenched emission in these complexes. In order to overcome this problem, antenna ligands are used to enhance the lanthanide emission. Thus, in all cases of magneto-luminescent SIM, the observed lanthanide luminescence relies on the use of coordinated ligands or complexes as sensitizers to enhance the lanthanide luminescence via an energy transfer mechanism [19]. We report in this article that such magneto-optical correlations can be extended to a textbook dysprosium(III) nitrate coordination complex by direct excitation in the f–f transitions of the lanthanide ion. Surprisingly, this complex behaves as a field induced SIM allowing to perform a magneto-optical correlation.
2. Results
2.1. Structure
X-Ray Single Crystal diffraction indicates that [Dy(NO3)3(H2O)4]·2H2O (1) crystallizes in the triclinic P-1 space group (Table S1) with a unique crystallographic molecule. The coordination sphere of the Dy3+ ion is constituted by three bidentate nitrate and four water molecules leading to an overall coordination number of 10 (Figure 1). The Dy–O distances are comprised between 2.357(6) and 2.792(5) Å. The analysis of the geometry using the SHAPE software [20] indicates that it is close to a spherocorona (Table S2). Study of the crystal packing reveals a complex hydrogen bonds network involving oxygen nitrates and both coordinated and uncoordinated water molecules giving rise to a three-dimensional supramolecular network. The shortest Dy–Dy distance in the crystal is found to be 6.3282(7) Å.
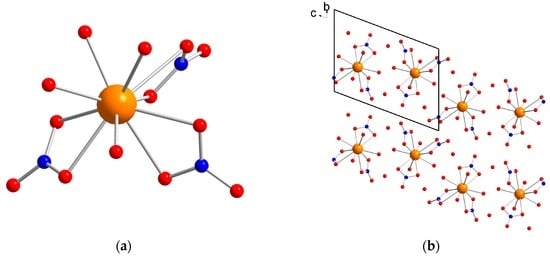
Figure 1.
(a) molecular structure of 1. Color code: orange, Dy; red, O; blue, N; light grey, C. Hydrogen atoms are omitted for clarity; and (b) view of the packing arrangement along the a crystallographic axis.
2.2. Magnetic Properties
The magnetic properties of 1 were investigated using a Superconducting QUantum Interference Device (SQUID) magnetometer (Quantum Design, San Diego, CA, USA) working in the temperature range 1.8–350 K up to 7 T in direct current (DC) and alternating currents (AC) modes.
2.2.1. DC Magnetic Properties
The room temperature value of χT is equal to 14.04 cm3·K·mol−1, which is in a good agreement with the value of 14.17 cm3·K·mol−1 expected for a Dy3+ ion using the free-ion approximation. Upon cooling, χT remains constant down to 50 K before decreasing to reach the value of 11.87 cm3·K·mol−1 at 1.8 K (Figure 2). Such a phenomenon can be ascribed to the thermal depopulation of the Stark sublevels. The field dependence of the magnetization measured at 1.8 K reaches the value of 5.85 μB under 70 kOe without evidence of a clear saturation (inset of Figure 2).
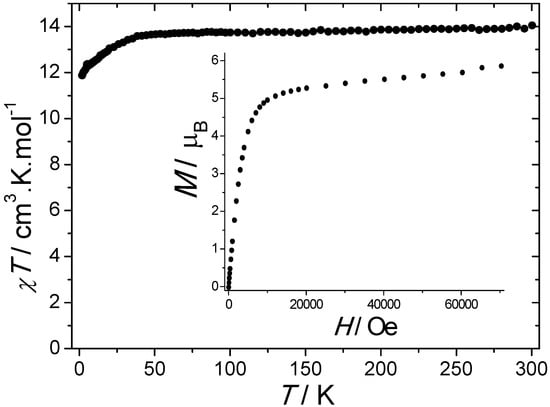
Figure 2.
Temperature dependence of χT measured under a 1000 Oe DC field. Inset: field dependence of the magnetization measured at 1.8 K.
2.2.2. AC Magnetic Properties
AC magnetic properties were performed in order to investigate the occurrence of a slow relaxation of the magnetization. Under a zero DC field, no significant out-of-phase susceptibility, χ′′, can be observed. This directly reflects a strong QTM which may arise from external factors such as dipolar interactions, intrinsic effects due to hyperfine interactions or symmetry deviations [6]. Applying DC fields induce a short-cut of this QTM and allow the observation of an out-of-phase component. The highest relaxation time, τ, is found at 4.0 K around 1500–2000 Oe DC fields (Figure 3). For higher field values, a decrease of τ is observed and can be imputed to the direct process that becomes predominant. Thermally activated and Raman processes are not field dependent but cannot be neglected even at 4.0 K, and the field dependence of the relaxation time can be fitted by using the following equation [21]:
τ−1 = DH4T + B1/(1 + B2H2) + τ0−1exp(−∆/kT) + CTm.
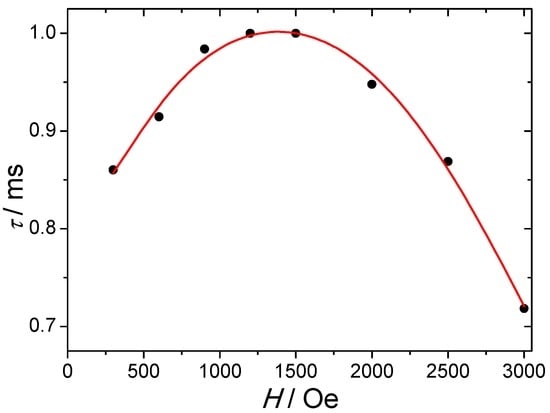
Figure 3.
Field dependence of the relaxation time measured at 4.0 K. The red solid line represents the fit using Equation (1).
The first term accounts for the direct process (for Kramers-ion), the second one stands for the QTM while the third and fourth are relative to thermally activated and Raman processes, respectively. The best fit leads to the following values: D = 1.37 × 10⁻¹² s−1·K−1·Oe−4; B1 = 293 s−1, B2 = 2.6 × 10⁻⁶ Oe−2; C = 0.0005 s−1·K−9; ∆ = 39 cm−1; τ0 = 8 × 10⁻¹⁰ s. The magnitudes of the B1 and B2 parameters directly reflect the degree of mixing between the ±mJ levels and consequently are a sign of the magnitude of the QTM process.
The frequency dependence of χ′′ for various temperatures under a 2000 Oe DC field reveals a frequency dependent asymmetric peak (Figure 4a). The maximum of the peak shifts to higher temperatures upon increasing frequency, which indicates a field-induced slow relaxation of the magnetization. At low temperature, a plateau at low frequencies can be observed demonstrating the occurrence of a second relaxation process. We note that this process is essentially frequency independent, suggesting that it results from a collective behavior mediated by dipolar interactions and/or hydrogen bond network. As regards the frequency dependent process, it can be noticed that the magnitude of the out-of-phase signals increases with frequency, which is usually ascribed to the presence of intermolecular interactions or spin-glass behavior [22]. The same feature can also be observed on the temperature dependence of the out-of-phase susceptibility with various frequencies (Figure 4b).
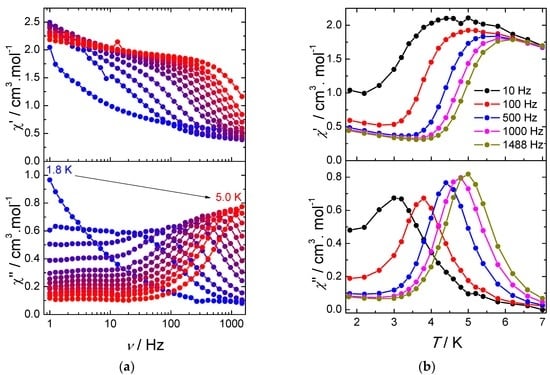
Figure 4.
(a) frequency dependence of the in-phase (χ′) and out-of-phase (χ′′) components of the AC susceptibility under an optimal magnetic DC field of 2000 Oe for 1; and (b) temperature dependence of the in-phase (χ′) and out-of-phase (χ′′) components of the AC susceptibility under a 2000 Oe DC field for 1. Solid lines are guides to the eye.
The presence of a second relaxation process at a low temperature becomes evident when looking at the Cole–Cole plots (Figure 5a). Although a second semi-circle is not observed, a plateau is present. Therefore, the Cole–Cole plots were fitted by taking into account only the data of the semi-circle corresponding to the high-temperature process (Table S3). The values of the α parameter are ranging between 0.114 and 0.227, indicating a narrow distribution of the relaxation processes. Further insights into the mechanisms of the slow relaxation of the magnetization can be obtained by studying the temperature dependence of τ (Figure 5b). It turns out that a deviation from the thermally activated behavior can be observed at low temperatures and originates from the occurrence of other relaxation processes, such as Raman and/or direct. Fitting the temperature dependence of the relaxation time was performed using the following model: [23]
for which the first term accounts for a thermally activated process such as Orbach or direct spin–phonon transitions involving higher excited states [24], while the second and third ones stand for two-phonon Raman and direct relaxation processes, respectively. To avoid the over-parameterization, the values of m = 9 and n = 1 were fixed to the values found for two-phonon Raman (for Kramers ions) and direct processes [25,26].
τ−1 = τ0−1exp(−∆/kT) + CTm + ATn,
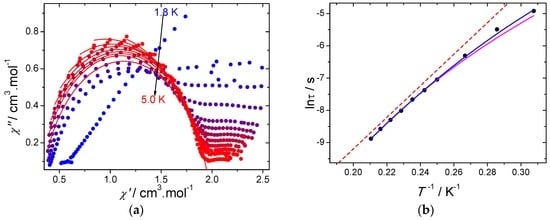
Figure 5.
(a) Cole–Cole plots using the AC data performed under a 2000 Oe DC field. The red solid lines correspond to the fit with a generalized Debye model; (b) temperature dependence of the relaxation time using the AC data under a 2000 Oe DC field. The blue solid line corresponds to the fit with Equation (2), the purple solid line represents the fit with Equation (2) by fixing the ∆Orbach parameter from photoluminescence, while the red dashed line represents the Orbach process and (∆Orbach fixed from photoluminescence and τ0 obtained from Equation (2)).
The best fit parameters give ∆ = 40 ± 4 cm−1; τ0 = (1.38 ± 0.09) × 10−9 s and C = 0.003 ± 0.001 s−1·K−9 while the value for A is found negligible. Consequently, the deviation from linearity observed in Figure 5b can be explained by the overlap between thermally activated and Raman processes at low temperature. Fitting the temperature dependence of the relaxation time with only a Raman process (m being free) did not provide meaningful results with an m exponent value larger (10.7) than the expected value for the Kramers ion. Consequently, the thermally activated relaxation process seems to dominate in the high-temperature region.
2.3. Luminescence
The photoluminescence properties of 1 were investigated at 14 K and at 300 K, Figure 6a,b. Independently of the temperature, the emission spectra reveal the characteristic luminescence of the Dy3+ ions ascribed to the 4F9/2→6H15/2–11/2 transitions. By decreasing the temperature from 300 K to 14 K, a decrease in the full-width-at-half-maximum (fwhm) is observed, as well as the Stark splitting of the intra-4f9 lines. The excitation spectra monitored within the more intense 4F9/2→6H13/2 transition reveal a series of intra-4f9 straight lines attributed to transitions between the 4K15/2,17/2, 4I9/2–13/2, 4G9/2–11/2, 4M15/2–21/2, 6P3/2–7/2, 4F7/2–9/2, and 4H15/2 excited levels and the 6H11/2 ground multiplet. Similarly to what is found for the emission spectra, apart from a decrease of the fwhm, the intra-4f9 lines, the excitation spectrum observed at 14 K resembles that measured at 300 K. The 4F9/2 emission decay curves were measured under UV excitation at 355 nm (Figure S1) for 1. Both decay curves are well-described by a single-exponential function yielding lifetime values of τ = (7.7 ± 0.2) × 10−9 s (14 K) and τ = (5.9 ± 0.3) × 10−9 s (300 K).
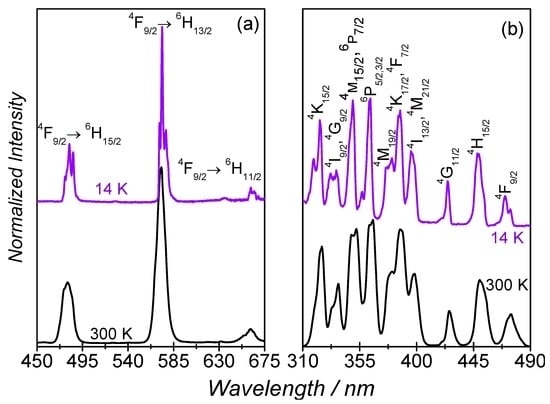
Figure 6.
(a) emission; and (b) excitation spectra (14 K and 300 K) excited at 385 nm and monitored at 573 nm, respectively. In (b), the 6H11/2 ground state is omitted and only the excited state is represented for clarity.
In order to gain additional insight into the correlation between SIM behaviour and luminescence properties, the crystal field splitting of the ground state of the Dy(III) ion in 1 was studied. The low temperature (14 K) high-resolution emission spectrum in the spectral region showing the 4F9/2→6H15/2 transitions was acquired for several crystals (Figure 7 and Figure S2). Apart from changes in the relative intensity of the Stark components, all the spectra reveal the presence of 11 components, as illustrated in Figure 7 for a selected ensemble of crystals.
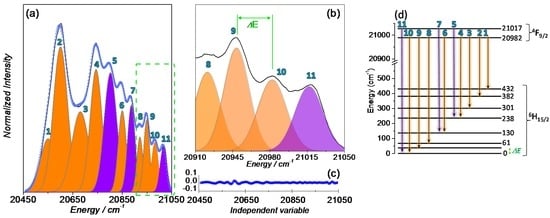
Figure 7.
(a,b) magnification of the 4F9/2→6H15/2 transition at 14 K and excited at 385 nm. Multi-Gaussian functions envelope fit (circles) and the components arising from the (orange shadow) first and (purple shadow) second 4F9/2 Stark sublevels to the 6H15/2 multiplet; (c) fit regular residual plot; and (d) schematic diagram of the radiative transitions between the Stark sublevels of the 4F9/2 and 6H15/2 multiplets of the Dy(III) ion.
Attending to the fact that the Dy(III) ions occupy a low-symmetry group, the splitting of the electronic levels (4F9/2 and 6H15/2) into the maximum number of allowed components to (2J + 1)/2 Kramers doublets is expected, leading to five and eight components for 4F9/2 and 6H15/2, respectively. Thus, at least eight Stark components are expected for the 4F9/2→6H15/2 transitions assuming that only the lower-energy Stark component of the 4F9/2 excited state is populated and all the transitions end at the Stark components of the ground multiplet 6H15/2. Since 11 components are clearly expressed, it readily points out that the second Stark component of the 4F9/2 excited state must also be populated. This is a feasible situation due to the low-energetic difference between the first Stark component and the second one (35 ± 5 cm−1) which enables the population of the second Stark component of the 4F9/2 at 14 K. The high-resolution emission spectrum was fitted with 11 components using Gaussian functions, whose energy was constrained to the peak position analysis based on the spectrum observation taking into account the experimental uncertainty (±5 cm−1); the fwhm and the relative intensity were free to vary. From the emission spectra best fit, an energy diagram of the Stark-sub-levels is proposed in Figure 7d. From the data acquired for the three distinct ensemble of crystals (Figure S2), an average energy barrier, ∆Orbach = 34 ± 5 cm−1 is estimated, which is in excellent agreement with that obtained from the AC magnetic susceptibility data.
3. Discussion
Compound 1 behaves as a field induced SIM showing two relaxation processes. Multiple relaxation processes have been widely observed in lanthanide zero-field or field induced SIMs [3,27,28]. For 1, the independent frequency process observed in the low frequency range most likely arises from a collective behavior resulting from strong dipolar interactions or hydrogen bond network involving water molecules. Such intermolecular interactions may also affect the frequency dependent process associated with a slow relaxation of the magnetization. Indeed, a clear increase of the out-of-phase signal are observed with increasing frequencies. This fact is frequently viewed as the signature for either spin-glass or superparamagnetic systems with strong intermolecular interactions [29]. Dilution into a diamagnetic matrix would have been the ultimate proof to confirm the origin of the frequency independent relaxation process. However, attempts to grow crystals of a solid solution of Y3+/Dy3+ ions were unsuccessful.
The field-induced SIM character of 1 appears at first glance rather surprising regarding the coordination environment of the dysprosium site. Based on the electrostatic proposed by Rinehardt and Long [5] and later extended by Chilton et al. [30], the stabilization of the oblate electronic density of the Dy3+ ion requires an axial crystal field. Although this model only relies on the charge of the atoms belonging to the ligands (it does not take into account the donor strength), it allows for estimating the orientation of the anisotropic axis by using the MAGELLAN software [30]. The orientation of the latter is highly dependent on the magnitude of the interaction between the negatively charged atom of the ligand and the Dy3+ ion. It turns out that the anisotropic axis (Figure 8) is found nearly collinear (deviation of 23.62° with respect to the central nitrogen atom) to the nitrate anion presenting the shortest Dy–O distance (Dy–O8 = 2.463 Å). The ideal stabilization of oblate density would have been to place two nitrate in trans fashion. However, the three nitrate are located in cis fashion to each others, forming a pseudo-triangular arrangement. We note also that the second shortest Dy–O4 = 2.491 Å distance forms an angle of 32.48° with the anisotropic axis. The deviation of the anisotropic axis with respect to the O4–Dy–O8 bond most likely relies on the effect of the positively charged nitrogen that attracts the electron density of the lanthanide ions. Significant longer Dy–O bonds (Dy–O1 2.529 Å and Dy–O5 = 2.568 Å) are found almost perpendicular to the anisotropic axis in order to limit the repulsion with the radial plane of the oblate electron density from the Dy3+ ion.
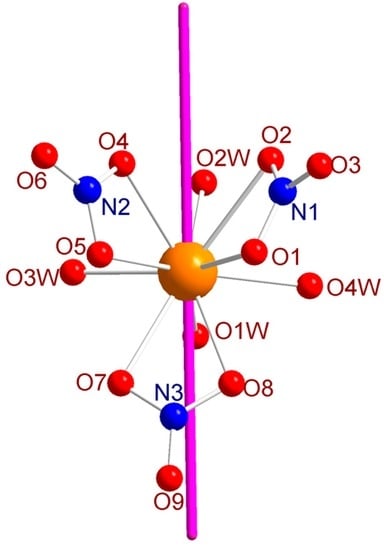
Figure 8.
Arrangement of the anisotropic axis (purple) obtained with the MAGELLAN software.
Photoluminescence studies show that the characteristic emission of Dy3+ ion in 1 can be obtained without any sensitizer ligands by direct excitation into the f–f transitions. To our knowledge, this constitutes the first example of a luminescent SIM showing such an excitation process. The magneto-optical correlation shows that ∆ obtained by magnetism (i.e., 40 ± 4 cm−1) is very close to the energy gap between the ground and first-excited Kramers doublet extracted from photoluminescence measurements (i.e., 34 ± 5 cm−1), indicating that the dominant relaxation pathways in the high temperature region is of the Orbach type. The observed slight deviation most likely arises from the overlap between Orbach and Raman processes due to the limited frequency of the oscillating field by standard SQUID magnetometry (i.e., 1488 Hz), even in the highest temperature range. The energy gap between the ground and first-excited Kramers doublet obtained from photoluminescence corresponds definitely to the correct value. Consequently, fitting of the temperature dependence of the relaxation time with Equation (2) can be performed by fixing ∆Orbach to the one obtained by luminescence (~34 cm−1). The best fit parameters obtained are τ0 = (5.7 ± 0.4) × 10−9 s and C = 0.0009 ± 0.0003 s−1·K−9, while the value for A is still negligible. Attempts to let the m parameter free does not improve significantly the quality of the fit, and the m parameter is found slightly higher than its theoretical value of nine (fit m = 10.7) [31]. From these results, the C parameter is found lowered with respect to the fit without fixing ∆Orbach. This confirms that the main source of relaxation is clearly an Orbach process (red dashed line, Figure 5b). This constitutes a rare example of a luminescent SIM without an underestimation of ∆ obtained by magnetism as frequently observed in luminescent SIMs [7,8,9,10,11,12,13,14,15,16,17,18].
4. Materials and Methods
4.1. Synthesis and Crystal Structure
The compound was purchased from Alfa Aesar and used as received. Single crystals of 1 were selected and measured on an Xcalibur, Onyx diffractometer (Oxford Diffraction, Oxford, UK). The crystal was kept at 300 K during data collection. Using Olex2 [32], the structure was solved with the Superflip [33] structure solution program using Charge Flipping and refined with the olex2.refine [34] refinement package using Gauss–Newton minimisation.
4.2. Magnetic Measurements
Magnetic susceptibility data were collected with a Quantum Design (San Diego, CA, USA) MPMS-XL SQUID magnetometer working between 1.8 and 350 K with the magnetic field up to 7 Tesla. The data were corrected for the sample holder and the diamagnetic contributions calculated from Pascal's constants. The AC magnetic susceptibility measurements were carried out in the presence of a 3 Oe oscillating field in zero or applied external DC field.
4.3. Photoluminescence Measurements
The photoluminescence spectra were recorded at 14 K and at 300 K with a modular double grating excitation spectrofluorimeter with a TRIAX 320 emission monochromator (Fluorolog-3, Horiba Scientific (Kyoto, Japan)) coupled to a R928 photomultiplier (Hamamatsu) using a front face acquisition mode. The excitation source was a 450 W Xe arc lamp. All the emission spectra were measured under vaccum conditions (10−7 bar) and corrected for detection and optical spectral response of the spectrofluorimeter, and the excitation spectra were corrected for the spectral distribution of the lamp intensity using a photodiode reference detector. The nominal spectral dispersion response of the spectrofluorimeter is 2.64 nm·cm−1, yielding a spectral resolution of 0.1 nm (±5 cm−1) for the high-resolution emission spectra (slits width of 5 × 10⁻² mm). The emission decay curves were measured at 14 K and at 300 K using a pulsed LED peaking at 355 nm (SpectraLED-355, Horiba Scientific (Kyoto, Japan)) coupled to a TBX-04 photomultiplier tube module. The emission spectrum of the SpectraLED-355 displays a Gaussian profile with a fwmh of ca. 15 nm. The room temperature emission quantum yield was measured using the C9920-02 (Hamamatsu) setup with a 150 W Xe lamp coupled to a monochromator for wavelength discrimination, an integration sphere as sample chamber and a multichannel analyzer for signal detection. The accuracy is within 10% according to the manufacturer. Three measurements were made for each sample, revealing values below the detection limits of our experimental apparatus (0.01).
5. Conclusions
Although known for decades and thoroughly used for the synthesis of SIMs and SMMs, we have demonstrated that the dysprosium(III) nitrate salt, [Dy(NO3)3(H2O)4]·2H2O (1), behaves as a field-induced SIM. This can be rationalized by the presence of the negatively charged oxygen of the nitrate ions, which helps to stabilize the oblate electronic density of the Dy3+ ion. In addition, the excitation in the intra 4f transitions induces the characteristic luminescence of the Dy3+ ion and allows to perform a magneto-structural correlation, giving additional insights into the relaxation processes. In the high-temperature region, it proceeds via an Orbach mechanism, which overlaps with the Raman process upon lowering of the temperature.
Supplementary Materials
The following are available online at www.mdpi.com/2312-7481/2/4/41/s1, Table S1: Crystal and structure refinement data for compound 1; Table S2: SHAPE analysis for compound 1; Table S3: Fitting of the Cole–Cole plots with a generalized Debye model for temperature ranging from 1.8 to 4.1 K under a 2000 Oe DC field for 1; Figure S1: Emission decay curves; Figure S2: High-resolution emission spectra in the 4F9/2→6H15/2 transition acquired for distinct ensemble of crystals.
Acknowledgments
The authors thank the University of Montpellier, Centre Nationale de la Recherche Scientifique (CNRS) and Plateforme d'Analyse et de Caractérisation (PAC) Balard Institut Charles Gerhardt Montpellier (ICGM). E.M. acknowledges the financial support from the LABoratoire d'EXcellence (LABEX) CheMISyst Agence Nationale de la Recherche ANR-10-LABX-05-01. This work was developed within the scope of the project CICECO-Aveiro Institute of Materials, POCI-01-0145-FEDER-007679 (FCT Ref. UID /CTM /50011/2013) and I3N (UID/CTM/50025/2013) financed by national funds through the FCT/MEC and co-financed by Fonds Européen de Développement Régional (FEDER) under the PT2020 Partnership. A.M.P.B. thanks FCT for a PhD fellowship (SFRH/BD/104789/2014). The Portugal–France bilateral action, PESSOA Program (Hubert Curien) “Multifunctional magneto-luminescent molecular architectures” is also acknowledged.
Author Contributions
All authors contributed equally to this work. Rute A. S. Ferreira, Alexandre M. P. Botas and Luis D. Carlos performed, interpreted and wrote the luminescence part; Dominique Luneau resolved the crystal structure; Ekaterina Mamontova and Jérôme Long performed the magnetic characterization; Jérome Long wrote the draft of the article; Yannick Guari and Joulia Larionova discussed the results and implications and commented on the manuscript at all stages.
Conflicts of Interest
The authors declare no conflict of interest.
References
- Woodruff, D.N.; Winpenny, R.E.P.; Layfield, R.A. Lanthanide single-molecule magnets. Chem. Rev. 2013, 113, 5110–5148. [Google Scholar] [CrossRef] [PubMed]
- Layfield, R.A. Organometallic single-molecule magnets. Organometallics 2014, 33, 1084–1099. [Google Scholar] [CrossRef]
- Liddle, S.T.; van Slageren, J. Improving f-element single molecule magnets. Chem. Soc. Rev. 2015, 44, 6655–6669. [Google Scholar] [CrossRef] [PubMed]
- Luzon, J.; Sessoli, R. Lanthanides in molecular magnetism: So fascinating, so challenging. Dalton Trans. 2012, 41, 13556–13567. [Google Scholar] [CrossRef] [PubMed]
- Rinehart, J.D.; Long, J.R. Exploiting single-ion anisotropy in the design of f-element single-molecule magnets. Chem. Sci. 2011, 2, 2078–2085. [Google Scholar] [CrossRef]
- Pointillart, F.; Bernot, K.; Golhen, S.; Le Guennic, B.; Guizouarn, T.; Ouahab, L.; Cador, O. Magnetic memory in an isotopically enriched and magnetically isolated mononuclear dysprosium complex. Angew. Chem. Int. Ed. 2015, 54, 1504–1507. [Google Scholar] [CrossRef] [PubMed]
- Cucinotta, G.; Perfetti, M.; Luzon, J.; Etienne, M.; Car, P.-E.; Caneschi, A.; Calvez, G.; Bernot, K.; Sessoli, R. Magnetic anisotropy in a dysprosium/dota single-molecule magnet: Beyond simple magneto-structural correlations. Angew. Chem. Int. Ed. 2012, 51, 1606–1610. [Google Scholar] [CrossRef] [PubMed]
- Long, J.; Vallat, R.; Ferreira, R.A.S.; Carlos, L.D.; Almeida Paz, F.A.; Guari, Y.; Larionova, J. A bifunctional luminescent single-ion magnet: Towards correlation between luminescence studies and magnetic slow relaxation processes. Chem. Commun. 2012, 48, 9974–9976. [Google Scholar] [CrossRef] [PubMed]
- Yamashita, K.; Miyazaki, R.; Kataoka, Y.; Nakanishi, T.; Hasegawa, Y.; Nakano, M.; Yamamura, T.; Kajiwara, T. A luminescent single-molecule magnet: Observation of magnetic anisotropy using emission as a probe. Dalton Trans. 2013, 42, 1987–1990. [Google Scholar] [CrossRef] [PubMed]
- Pointillart, F.; Le Guennic, B.; Golhen, S.; Cador, O.; Maury, O.; Ouahab, L. A redox-active luminescent ytterbium-based single molecule magnet. Chem. Commun. 2013, 49, 615–617. [Google Scholar] [CrossRef] [PubMed]
- Gavey, E.L.; Al Hareri, M.; Regier, J.; Carlos, L.D.; Ferreira, R.A.S.; Razavi, F.S.; Rawson, J.M.; Pilkington, M. Placing a crown on dy(III)—A dual property lniii crown ether complex displaying optical properties and smm behaviour. J. Mater. Chem. C 2015, 3, 7738–7747. [Google Scholar] [CrossRef]
- Shintoyo, S.; Murakami, K.; Fujinami, T.; Matsumoto, N.; Mochida, N.; Ishida, T.; Sunatsuki, Y.; Watanabe, M.; Tsuchimoto, M.; Mrozinski, J.; et al. Crystal field splitting of the ground state of terbium(iii) and dysprosium(III) complexes with a triimidazolyl tripod ligand and an acetate determined by magnetic analysis and luminescence. Inorg. Chem. 2014, 53, 10359–10369. [Google Scholar] [CrossRef] [PubMed]
- Ren, M.; Bao, S.-S.; Ferreira, R.A.S.; Zheng, L.-M.; Carlos, L.D. A layered erbium phosphonate in pseudo-D5h symmetry exhibiting field-tunable magnetic relaxation and optical correlation. Chem. Commun. 2014, 50, 7621–7624. [Google Scholar] [CrossRef] [PubMed]
- Long, J.; Rouquette, J.; Thibaud, J.-M.; Ferreira, R.A.S.; Carlos, L.D.; Donnadieu, B.; Vieru, V.; Chibotaru, L.F.; Konczewicz, L.; Haines, J.; et al. A high-temperature molecular ferroelectric Zn/Dy complex exhibiting single-ion-magnet behavior and lanthanide luminescence. Angew. Chem. Int. Ed. 2015, 54, 2236–2240. [Google Scholar] [CrossRef] [PubMed]
- Rechkemmer, Y.; Fischer, J.E.; Marx, R.; Dörfel, M.; Neugebauer, P.; Horvath, S.; Gysler, M.; Brock-Nannestad, T.; Frey, W.; Reid, M.F.; et al. Comprehensive spectroscopic determination of the crystal field splitting in an erbium single-ion magnet. J. Am. Chem. Soc. 2015, 137, 13114–13120. [Google Scholar] [CrossRef] [PubMed]
- Gregson, M.; Chilton, N.F.; Ariciu, A.-M.; Tuna, F.; Crowe, I.F.; Lewis, W.; Blake, A.J.; Collison, D.; McInnes, E.J.L.; Winpenny, R.E.P.; et al. A monometallic lanthanide bis(methanediide) single molecule magnet with a large energy barrier and complex spin relaxation behaviour. Chem. Sci. 2016, 7, 155–165. [Google Scholar] [CrossRef]
- Bi, Y.; Chen, C.; Zhao, Y.-F.; Zhang, Y.-Q.; Jiang, S.-D.; Wang, B.-W.; Han, J.-B.; Sun, J.-L.; Bian, Z.-Q.; Wang, Z.-M.; et al. Thermostability and photoluminescence of dy(III) single-molecule magnets under a magnetic field. Chem. Sci. 2016, 7, 5026–5031. [Google Scholar] [CrossRef]
- Al Hareri, M.; Gavey, E.L.; Regier, J.; Ras Ali, Z.; Carlos, L.D.; Ferreira, R.A.S.; Pilkington, M. Encapsulation of a [Dy(OH2)8]3+ cation: Magneto-optical and theoretical studies of a caged, emissive smm. Chem. Commun. 2016, 52, 11335–11338. [Google Scholar] [CrossRef] [PubMed]
- Bunzli, J.-C.G.; Piguet, C. Taking advantage of luminescent lanthanide ions. Chem. Soc. Rev. 2005, 34, 1048–1077. [Google Scholar] [CrossRef] [PubMed]
- Casanova, D.; Llunell, M.; Alemany, P.; Alvarez, S. The rich stereochemistry of eight-vertex polyhedra: A continuous shape measures study. Chem. Eur. J. 2005, 11, 1479–1494. [Google Scholar] [CrossRef] [PubMed]
- Zadrozny, J.M.; Atanasov, M.; Bryan, A.M.; Lin, C.-Y.; Rekken, B.D.; Power, P.P.; Neese, F.; Long, J.R. Slow magnetization dynamics in a series of two-coordinate iron(II) complexes. Chem. Sci. 2013, 4, 125–138. [Google Scholar] [CrossRef]
- Bilyachenko, A.N.; Yalymov, A.I.; Korlyukov, A.A.; Long, J.; Larionova, J.; Guari, Y.; Zubavichus, Y.V.; Trigub, A.L.; Shubina, E.S.; Eremenko, I.L.; et al. Heterometallic Na6Co3 phenylsilsesquioxane exhibiting slow dynamic behavior in its magnetization. Chem. Eur. J. 2015, 21, 18563–18565. [Google Scholar] [CrossRef] [PubMed]
- Meihaus, K.R.; Minasian, S.G.; Lukens, W.W.; Kozimor, S.A.; Shuh, D.K.; Tyliszczak, T.; Long, J.R. Influence of pyrazolate vs. N-heterocyclic carbene ligands on the slow magnetic relaxation of homoleptic trischelate lanthanide(III) and uranium(III) complexes. J. Am. Chem. Soc. 2014, 136, 6056–6068. [Google Scholar] [CrossRef] [PubMed]
- Ungur, L.; Chibotaru, L.F. Strategies toward high-temperature lanthanide-based single-molecule magnets. Inorg. Chem. 2016, 55, 10043–10056. [Google Scholar] [CrossRef] [PubMed]
- Shrivastava, K.N. Theory of spin–lattice relaxation. Phys. Status Solidi B 1983, 117, 437–458. [Google Scholar] [CrossRef]
- Scott, P.L.; Jeffries, C.D. Spin-lattice relaxation in some rare-earth salts at helium temperatures; observation of the phonon bottleneck. Phys. Rev. 1962, 127, 32–51. [Google Scholar] [CrossRef]
- Blagg, R.J.; Ungur, L.; Tuna, F.; Speak, J.; Comar, P.; Collison, D.; Wernsdorfer, W.; McInnes, E.J.L.; Chibotaru, L.F.; Winpenny, R.E.P. Magnetic relaxation pathways in lanthanide single-molecule magnets. Nat. Chem. 2013, 5, 673–678. [Google Scholar] [CrossRef] [PubMed]
- Amjad, A.; Figuerola, A.; Caneschi, A.; Sorace, L. Multiple magnetization reversal channels observed in a 3d-4f single molecule magnet. Magnetochemistry 2016, 2. [Google Scholar] [CrossRef]
- Mydosh, J.A. Spin Glasses: An Experimental Introduction; Taylor & Francis: London, UK; Washington, DC, USA, 1993. [Google Scholar]
- Chilton, N.F.; Collison, D.; McInnes, E.J.L.; Winpenny, R.E.P.; Soncini, A. An electrostatic model for the determination of magnetic anisotropy in dysprosium complexes. Nat. Commun. 2013, 4. [Google Scholar] [CrossRef] [PubMed]
- Orbach, R.; Blume, M. Spin-lattice relaxation in multilevel spin systems. Phys. Rev. Lett. 1962, 8, 478–480. [Google Scholar] [CrossRef]
- Dolomanov, O.V.; Bourhis, L.J.; Gildea, R.J.; Howard, J.A.K.; Puschmann, H. Olex2: A complete structure solution, refinement and analysis program. J. Appl. Cryst. 2009, 42, 339–341. [Google Scholar] [CrossRef]
- Palatinus, L.; Prathapa, S.J.; van Smaalen, S. Edma: A computer program for topological analysis of discrete electron densities. J. Appl. Cryst. 2012, 45, 575–580. [Google Scholar] [CrossRef]
- Bourhis, L.J.; Dolomanov, O.V.; Gildea, R.J.; Howard, J.A.; Puschmann, H. The anatomy of a comprehensive constrained, restrained refinement program for the modern computing environment—Olex2 dissected. Acta Cryst. A 2015, 71, 59–75. [Google Scholar] [CrossRef] [PubMed]
© 2016 by the authors; licensee MDPI, Basel, Switzerland. This article is an open access article distributed under the terms and conditions of the Creative Commons Attribution (CC-BY) license (http://creativecommons.org/licenses/by/4.0/).