1. Introduction
Magnetic particle imaging (MPI) is an emerging molecular imaging modality that measures the location and concentration of superparamagnetic iron oxide nanoparticle tracers in vivo (typically iron oxide (SPIO)) by detecting their response to spatially dependent magnetic fields. Compared with other imaging modalities, magnetic particle imaging (MPI) is a relatively young imaging modality that was first introduced by B. Gleich and J. Weizenecker in 2005 [
1,
2]. MPI is capable of delivering quantitative imaging with exceptional tracer-to-background contrast and high specificity [
3,
4,
5,
6].
The quantification and localization of injectable tracers in MPI crucially depend on the purity of the signal source. However, owing to the nature of the method, any type of nanoscopic magnetic inclusion in tissues can lead to spurious MPI signals from intrinsic sources and may obfuscate the actual tracer distribution.
Several MPI tracer studies have specifically reported unwanted signals originating from the intestinal area in rodents, which are suspected to be the result of random magnetic constituents in some animal diets [
7,
8,
9,
10].
Magnetic inclusions in animal food can lead to considerable spurious MPI signals and can be expected to have irregular and agglomerated shapes. Such particle distributions can have extremely broad point-spread functions (PSFs) and may therefore cause significant long-range effects that potentially overshine injectable tracers.
While some reports have shown relatively low signals, others have shown that intestinal signals can reach signal levels similar to those of injectable tracers in areas with low probe deposition when studying slow-relaxation nanoparticles or tracking Fe-labeled cell lines [
9].
Sporadic attempts have been made to mitigate such effects by substituting the animal diet [
7] or fasting prior to imaging [
9,
11,
12,
13], but such proposals have followed a rather “ad hoc: approach”, and no systematic investigations of the effects of dietary changes on MPI signals in preclinical models have been reported thus far. Prolonged fasting presents limitations, particularly in studies where researchers are required to administer nanoprobe injections and subsequently assess biodistribution within several hours or days following injection, a necessity in various investigations [
14,
15,
16,
17], particularly in the domain of molecular imaging. Additionally, it is important to consider that subjecting mice to extended fasting regimens induces stress, potentially altering metabolic pathways, and prompts changes in their behavior and activity levels.
The aim of this study was to close this gap by systematically evaluating the in vivo MPI signals of various mouse diets and fasting for different periods of time prior to imaging.
We analyze the MPI response to a range of standard diets that are currently commercially available in Australia and discuss the benefits of substituting them with several specific low-iron diets, as well as with commonly used special diets such as the Western diet [
18] and the Gubra-Amylin NASH (GAN) diet, both of which are used to induce nonalcoholic fatty liver disease [
19]. We also compare the results with the in vivo MPI signal after fasting for up to 24 h.
2. Materials and Methods
This study investigated six different diets for laboratory mice in preclinical studies. We analyzed MPI signals from three different classes of diets (standard diet, low-iron diet, and high-fat diet) from two different suppliers. First, in vitro MPI signals of standard (1 g) amounts of each diet were investigated in flat-bottom glass vials (from Agilent Technologies, Santa Clara, CA, USA). Second, the resulting effect on the in vivo MPI signal was investigated over time when the respective diets were fed to the model mice. Third, we compared the signal alterations resulting from the use of specific diets to the alternative approach of fasting animals for durations ranging from 2 h to 24 h. All the investigated diets and supply sources are listed in
Table 1.
2.1. MPI Data Acquisition Procedures
All MPI experiments were performed via a MOMENTUM (Magnetic Insight Inc., Alameda, CA, USA) MPI scanner. The scanner uses a field-free line produced by a rotating electromagnet field gradient with a maximum amplitude of G = 5.7 mT. The MPI signal is generated by a homogeneous drive field with adjustable amplitude at f = 45 kHz via one or two orthogonal transmit channels (x and z).
Imaging experiments were performed in 2D high-sensitivity mode to acquire medium-resolution high-sensitivity projections of specimens or animals in the vertical direction. Isotropic projections were acquired via drive field channels with amplitudes Bx = 20 mT and Bz = 26 mT and a medium scanner gradient field of G = 3.0 T/m. All the acquisitions were performed with a maximum available field of view (FOV) of 120 × 60 mm to recruit all the signals from the whole sample or animal. Image reconstruction was performed via X-space filtered back-projection reconstruction on the scanner imaging platform, yielding projections with a nominal pixel resolution of 250 × 250 mm.
To acquire information about the relative signal intensity and spatial spread of food, we also acquired specimen-specific point spread functions (PSFs) of the bulk sample via the relaxation measurement capability of the scanner. The PSF reflects the specimen’s response to the drive field (including any response lag, governed by the particle relaxation behavior) and indicates the intensity and spread of the signal to be expected from specific particle inclusions. For PSF acquisition, we used the so-called “relaxation mode” of the scanner, in which the spatial encoding gradient field is removed and replaced by a DC offset field to sweep through the entire magnetization range of the particles from the negative saturated state to the positive saturated state. The PSF was recorded as the particle response to the superposition of the DC field with the drive field of a single channel with amplitude B
x = 20 mT [
21].
2.2. MPI Analysis
All the projection images were analyzed via the RadiAnt DICOM Viewer software package (version 4.6.7, Poznan, Poland). For all acquired projections, an elliptical region of interest (ROI) was delineated with fixed diameters of 25 × 35 mm (corresponding to 11,056 pixels, A = 6.912 cm2), centered around the peak signal value in the respective image. The signal mean was calculated for all the ROIs. As all the ROI sizes were kept constant, the calculated means can be viewed as ‘normalized signal integrals’ across the ellipsoid and can be compared across all the imaging experiments in this study. The ROI means were then statistically analyzed using a two-tailed unpaired (independent samples) Student’s t-test to determine significant signal differences.
PSFs from MPI relaxometry were analyzed for signal and resolution and compared to correlated PSFs from Vivotrax measurements (Magnetic Insight Inc., Alameda, CA, USA). The full width at half maximum (FWHM) was calculated in milli-Tesla (mT) and converted into a nominal signal extent of the magnetic inclusions in mm by normalizing field values to the gradient strength of the scanner G = 3.0 T/m [
22].
2.3. In Vitro MPI
For each diet, eight pellets were collected from the same badge and pulverized into a fine powder. Three standardized 1 g samples were prepared from each powder and added to standard flat-bottom glass vials (from Agilent Technologies, Santa Clara, CA, USA). As a reference for signal comparison, a separate vial was prepared by dispersing a standard amount, equivalent to 5 µg/mL Fe as a reference tracer, Ferucarbotran (Vivotrax), in 1 mL demineralized water. MPI projection images and relaxometry data were acquired as described above in independent scans for each vial via a 3D printed sample holder that was placed upright into the scanner isocenter.
2.4. In Vivo MPI
All procedures were conducted following the Australian Code of Practice for the Care and Use of Animals for Scientific Purposes and were approved by the University of New South Wales Animal Care and Ethics Committee (ACEC number 23/104B). The effects of dietary changes on the MPI background in vivo were assessed in female BALB/c mice that were 6–8 weeks of age. All the animals were treated in accordance with the standards approved by the Institutional Animal Care and Use Committee of the University of New South Wales. During an acclimatization period of 2 weeks, all the animals received the standard rodent diet used in the facility (Gordon’s standard diet) and water ad libitum. After acclimatization, all the animals underwent a first whole-body MPI scan to assess the signal baseline (t0 scan) with the facility standard diet. The animal diet was changed immediately after the baseline assessment by removing or changing food from the normal animal cage. For this purpose, the animals were separated into eight groups of three animals each. Six groups received the diets listed in
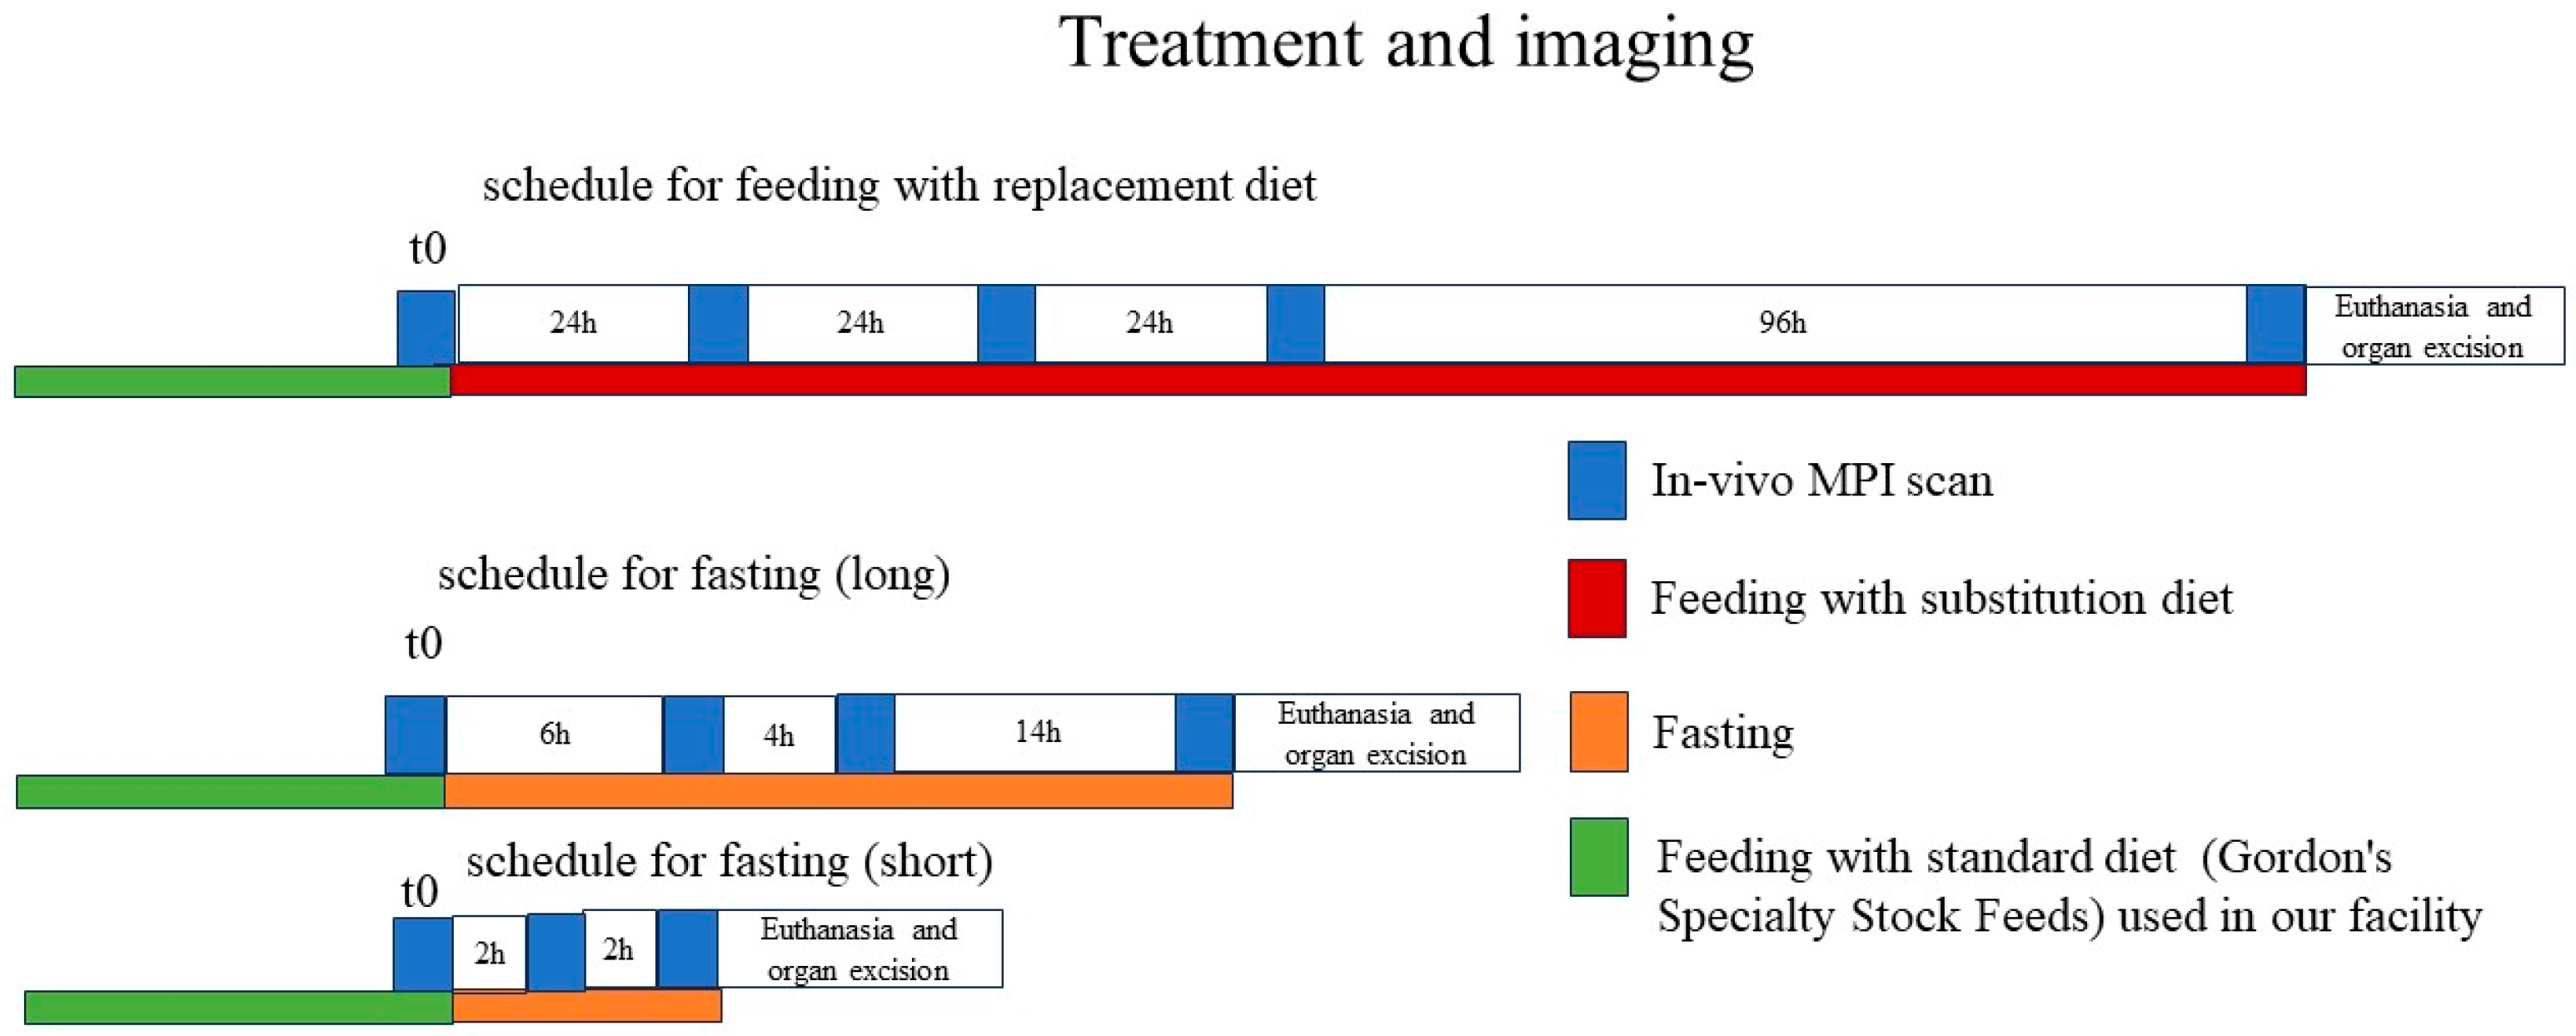
Table 1 for a total period of 1 week (168 h), and two groups were fasted for a period of 4 h or 24 h, respectively. The latter (fasting groups) only received water and were held in their standard bedding and nesting. No metabolic cages were used to mimic realistic conditions for animal pretreatment in realistic experiments. Animals with dietary changes were imaged at 24 h, 48 h, 72 h, and 168 h after diet alteration; animals that had fasted for 24 h (long-term fasting) were imaged at 6 h, 12 h, and 24 h; and short-term fasting animals were imaged at 2 h and 4 h after fasting onset. The experimental time schedule is depicted in
Figure 1. After the conclusion of the imaging experiment, the mice were euthanized, and the liver and spleen were harvested to determine the signal intensities in these organs. To determine the main metabolic pathways of the magnetic food inclusions, projection images from the excised liver, spleen, and collected feces were also acquired in glass tubes.
3. Results
3.1. In Vitro MPI
Figure 2 shows the signal intensities of all the investigated diets in vitro compared with a reference scan with a standard Ferucarbotran (Vivotrax) tracer (equivalent to 5 µg of Fe).
Figure 2 (on the left) shows the actual measured signal distribution from the diet in 10 mm flat-bottom vials. Images were cropped to sizes of 80 × 60 mm and dedicated in spectral colors to enable visualization of relative intensities.
Figure 2 (on the right) shows the corresponding mean intensities across the standard ROIs. As shown in the first 2 images and signal bars, the diet used as a standard diet in the UNSW animal facility presented an average base signal close to the reference scan, amounting to approximately 5 µg of total Fe.
An alternative standard diet (SF) even increases the total expected signal to almost 2 times that of the default diet. In comparison, a low-Fe diet from specialty feed (SF low Iron) reduces the average signal to only approximately 20% of the standard diet, equivalent to less than 1 µg of Fe inclusions, as measured in the reference scan. Interestingly, the corresponding low-iron diet from Manufacturer 1 does not lead to a reduction in the MPI signal. In our experiments, we observed signal levels in Gordon’s low-iron diets that were even greater than those recorded in Gordon’s standard diet. This finding might indicate that the overall signal from this manufacturer’s diet likely originates from their specific production features and not from actual iron contents in the food. In contrast, we detected the lowest signal intensities in the GAN and Western diets, which were produced in-house. The spurious signal was reduced by approximately 10–15 times compared with that of the standard diet and reference. This finding indicates that tightly controlling inclusions via in-house production of animal foods may help reduce unwanted signals in MPI.
As shown in
Figure 2, even bedding material and nesting papers could create signals due to iron contamination, which could interfere with fasting conditions; however, we kept them in the cage to ensure consistency across all the groups.
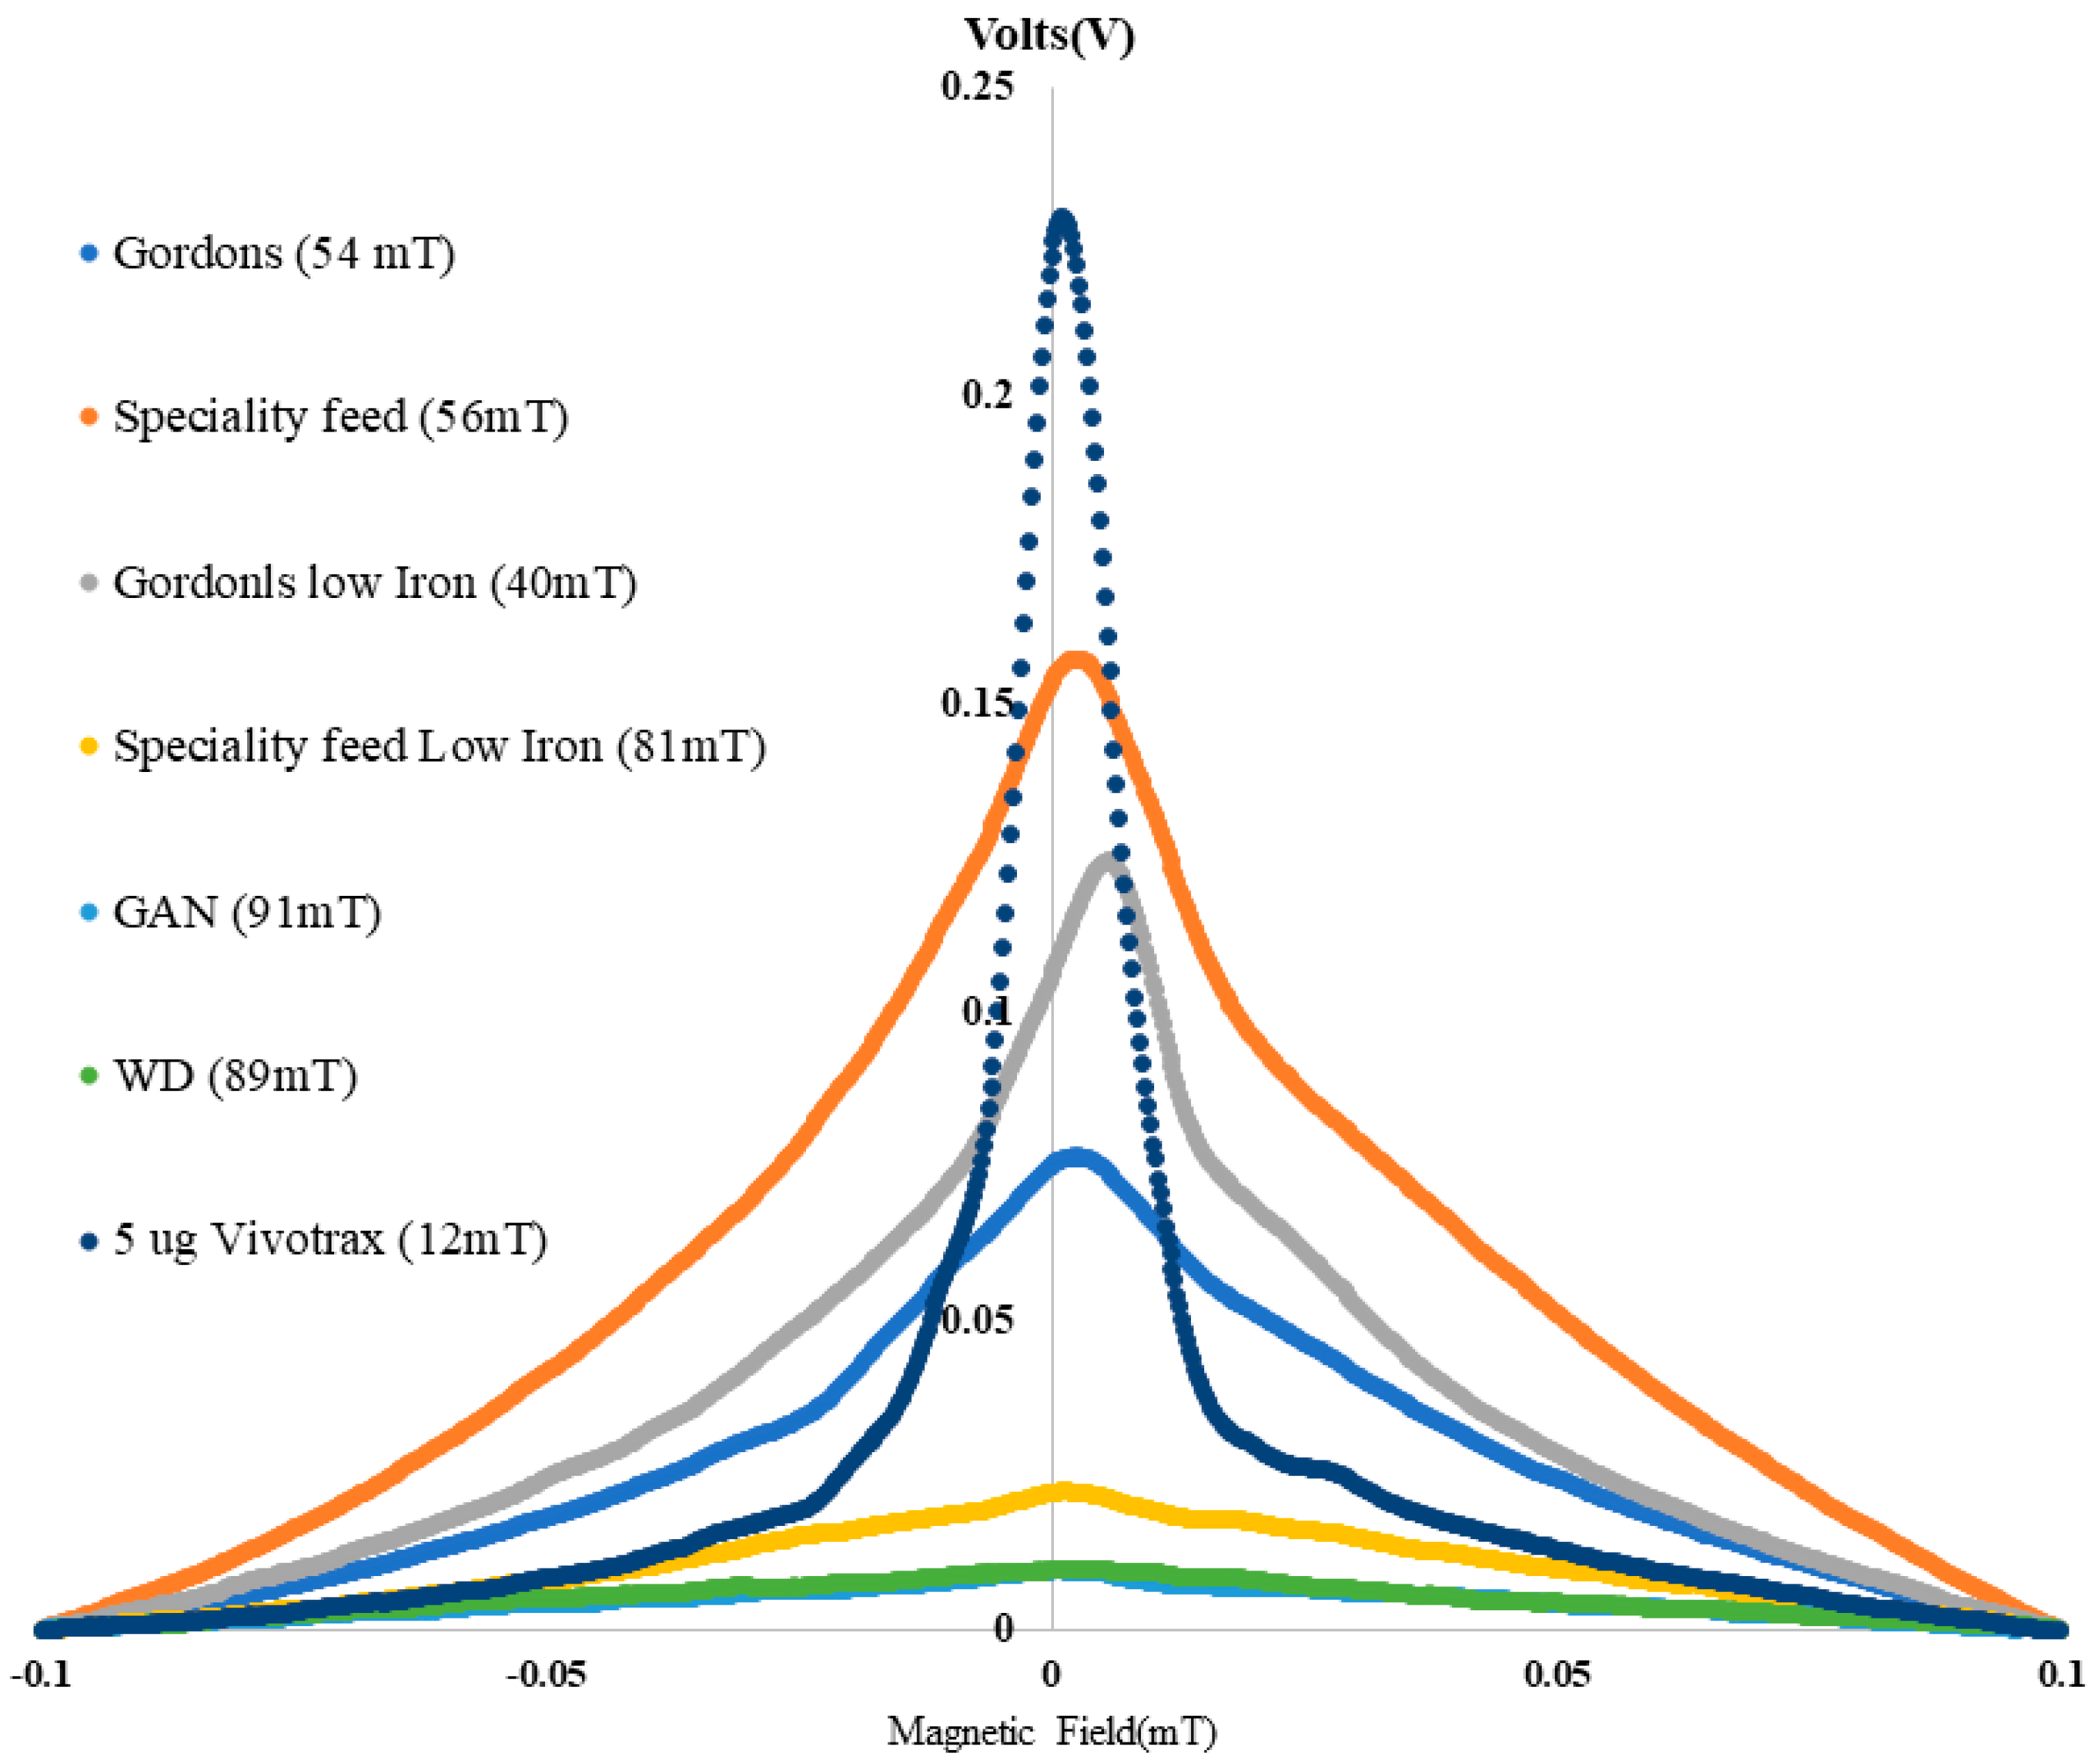
3.2. Relaxometry Data
Figure 3 shows the results from the relaxation measurements in sample vials, which draw a similar picture. From these scans, the relative width of the signal can also be determined. While the PSF measured in the reference tube (Vivotrax) shows a relatively narrow FWHM of approximately 12 mT, all the diet vials exhibit a very broad PSF with a FWHM of approximately 40 mT to 90 mT. This means that the effect of dietary inclusions can be very long compared with that of tracer signals and therefore might affect areas in regions far from the intestines.
3.3. In Vivo
Table 2a,b (please refer to the
Supplementary Materials) presents the signal intensities at different time points after changing the diets of the mice. In parallel with other studies, the signal intensities prior to starting any diets were broadly varied. The mean initial signal varied from 4.1 to 34.6 (a.u.), and the maximum signal intensity of the body varied from 7.9 to 73.3 (a.u.) among 24 mice, which resulted in an average mean signal of 12.9 ± 8.5 and an average maximum signal of 25.1 ± 19.2.
Figure 2 shows a broad range of signal intensities resulting from 2D isotropic images of normal diets (from Gordon’s specialty food) in high-sensitivity mode in MPI. As depicted in
Figure 2,
Figures S1 and S2 (in the
Supporting Information), the MPI signal intensities in the gut region ranged from 1 to more than 6 micrograms of Vivotrax for Gordon’s standard diet and from 4 to 12 micrograms for the specialty feed (SF diet).
Table 2a,b shows the details of the signal intensities at different time points after the different types of diets were changed and the mice were allowed to fast. As shown in
Table S2a, after switching to the GAN or Western diet, even after 24 h, the mean signal intensities decreased by a factor of 10, which was similar to the results obtained after the animals had fasted for up to 24 h (
Table 2b).
Our results revealed that there were no statistically significant differences in signal intensities among the mice that fasted for 24 h and the mice that were fed a GAN, a Western diet, or a low-iron diet (AIN93G) for 7 days (
p value > 0.05). Our results confirmed that the use of a GAN, a Western diet, or a low-iron diet from SF caused a significant decrease in signal intensity even 24 h after the initiation of those diets (
p value < 0.05). As the initial signal intensities were broadly varied, we decided to represent the data on the basis of the percentage of signal increments/decrements relative to the initial signal.
Tables S2 and S3 show the percentages of relative signal changes among different diets and fasting periods, respectively.
3.4. Statistical Analysis
The results obtained from the analysis, as depicted in
Table 2a,b, demonstrated a significant reduction in the mean signal intensities within the gut area after a 24 h period following the transition to a GAN, Western diet, or low-iron diet (AIN93G). Statistical analysis revealed a notable decrease in signal intensity, with a
p value < 0.05. Our results confirmed that the use of a GAN or Western diet caused a significant decrease in signal intensity even at 24 h after the initiation of those diets (
p value < 0.05).
Furthermore, our investigation extended to the 48 h time point following the initiation of these diets. Compared with the data obtained at 24 h, the mean signal intensities exhibited no statistically significant alterations. Similarly, when we conducted a comparative analysis between the 48 h time point and the 72-h time point, as well as between the 7-day and 72 h time points, our findings revealed no statistically significant decrease in signal intensity.
In summary, our results consistently demonstrated that the mean signal intensities within the gut area did not significantly change beyond the initial 24 h period following the implementation of dietary modifications. This stability was evident when comparing the 48 h and 72 h time points, as well as when comparing the 7-day and 72 h time points, with all p values exceeding the threshold of 0.1.
These results suggest that the impact on signal intensity within the gut area stabilizes or remains consistent beyond the initial 24 h period following the adoption of these dietary changes.
As shown in
Figure 4 and
Table 2a,b, our results revealed that fasting for 12 h for up to 24 h led to weight loss rates of −5.6% and −11.5%, respectively. However, the use of the GAN diet increased their weight by 4.9% after one week, and the use of the Western diet increased their weight by 10.7% after one week.
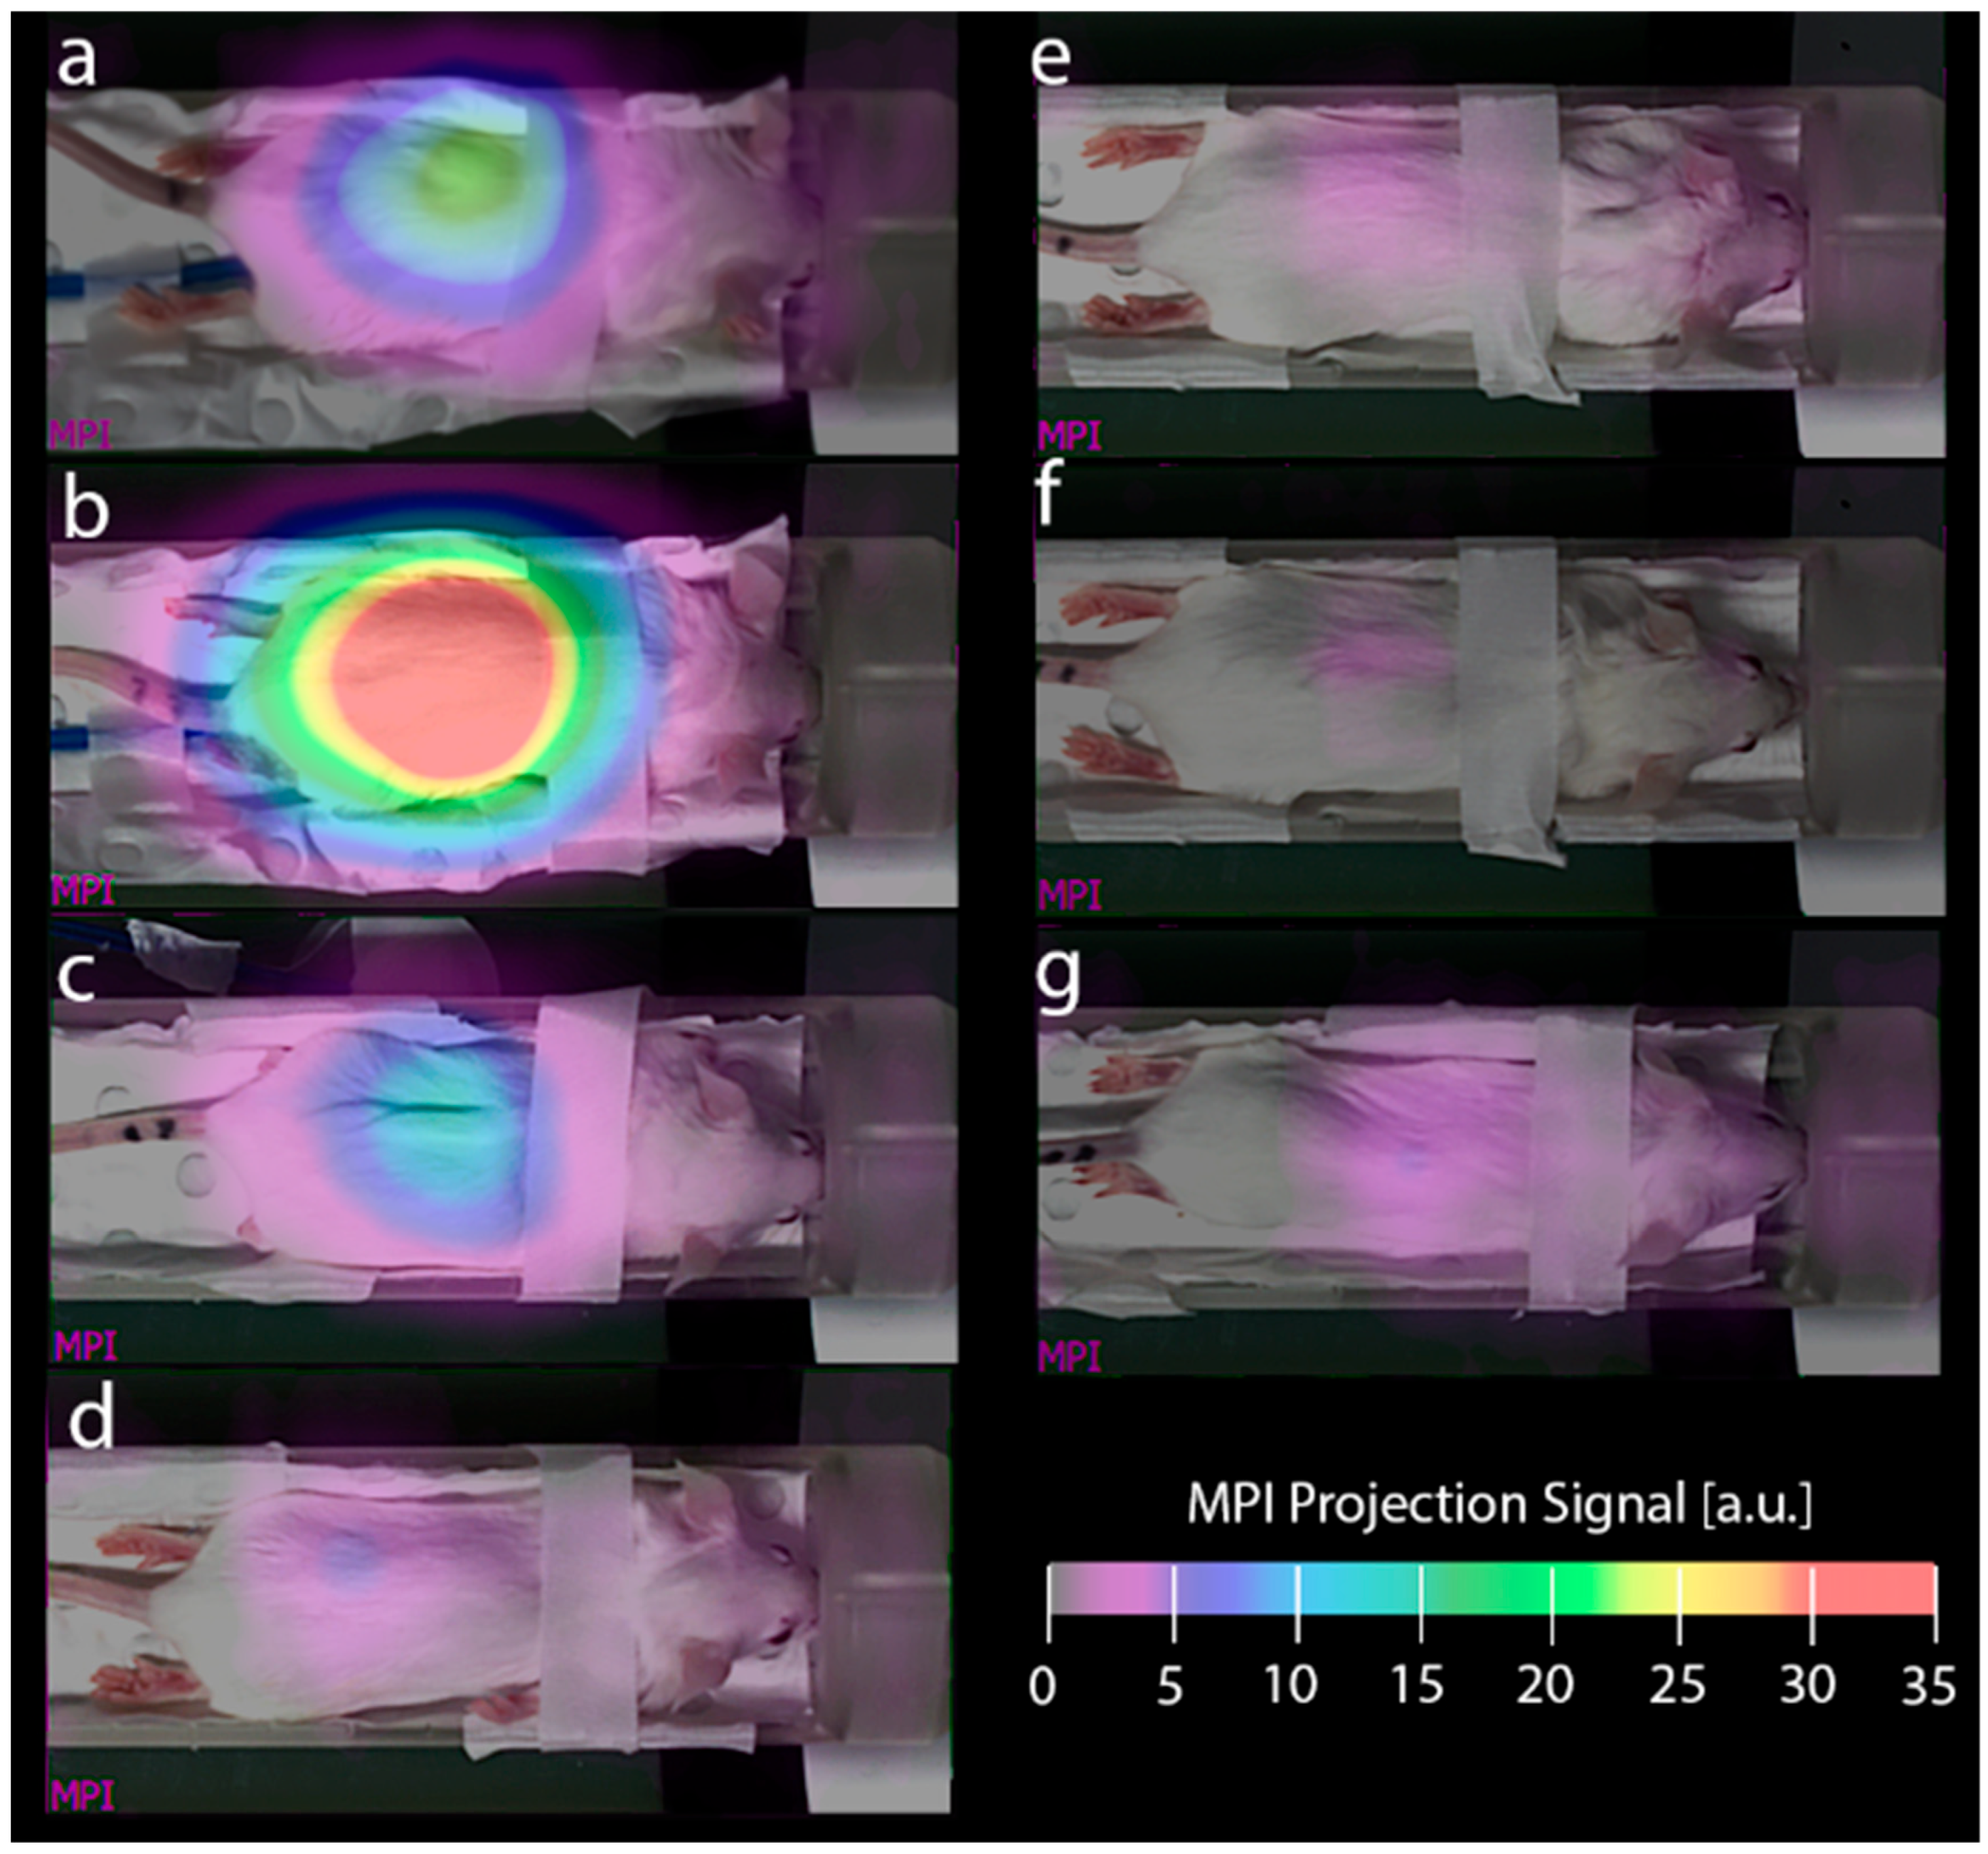
The effects of altering the diet to one of the six substitution options and animal fasting on the image background are shown in
Figure 5. The figure shows the MPI projection of the animal that showed the median effect in each group, as measured 24 h after the dietary change. Alternatives a-c, i.e., both standard diets and the low-iron option of Gordon’s manufacture, presented strong and widespread intestinal signals. Interestingly, the signal strongly increased when the default diet was substituted with an alternative standard diet (
Figure 5b) and remained high when the default diet was substituted with a diet with a nominally low iron content. On the other hand, replacing the standard diet with a low-iron-containing diet from specialty feeds or in-house-produced high-metabolic (GAN and Western) diets yielded a substantially reduced background (
Figure 5e,f), which was close to or lower than the background after animal fasting (
Figure 5g).
As the initial signal intensities varied widely (see
Figures S1 and S2 in the
Supplementary Materials, which illustrate the broad distribution of gut signal intensities following consumption of Gordon’s diet and specialty feeds standard diet, respectively), we opted to present the data as percentages of signal increase or decrease relative to the initial signal.
Tables S2 and S3 summarize the relative percentage changes in signal intensities across different diets and fasting periods, respectively. To more effectively illustrate the impact of dietary modifications, we selected one mouse from each group that demonstrated the most pronounced response to the diet change. These representative images, all displayed using the same window and level settings, are shown in
Figure S3.
Our ex vivo results revealed no statistically significant differences in signal intensities among the spleens or livers in the different groups (
p value > 0.05). However, we observed that the spleen signal was notably lower in the Western diet group than in the standard diet group, as shown in
Table 3. These ex vivo results confirm that the magnetic dipoles present in the food pellets are not digested or taken up by the liver or spleen.
All the diets in this study, after seven days of administration, did not result in significant changes in mouse body weight (less than 5% variation). However, fasting the mice for 24 h led to a weight loss of approximately 12%, which should be taken into consideration. Detailed data are provided in
Table S4 in the
Supplementary Materials.
4. Discussion
Quantification is a fundamental aspect of MPI. Our preliminary data indicate the presence of numerous magnetic dipoles in our current mouse food, which results in a substantial signal within the gut area during MPI imaging. The equivalent signal strength varied from 1 µg to 12 µg of VivoTrax. As current contrast agents in MPI are intended for diagnostic and research applications in preclinical imaging, precise quantification is essential.
The primary objective of this study is to increase the signal accuracy and image quality achievable through MPI, with the additional goal of optimizing the imaging procedure by reducing the required injection dose of existing contrast agents used as MPI tracers. The resolution and sensitivity of MPI images are significantly influenced by the performance of the injected tracer and the background signal from the body. This factor crucially impacts the detectability of targets, thereby influencing the outcomes of MPI imaging studies. Notably, previous studies have reported the detection of MPI signals in areas of the digestive system in mice due to the presence of iron in their feed [
9,
12,
23]. This gut signal can also pose challenges when it is in close proximity to other sources of iron [
9]. In studies where the region of interest is adjacent to the gastrointestinal signal (e.g., lower mammary fat pad tumor), distinguishing the signal associated with iron-labeled cells from the background can be a challenging task.
According to the literature, a BALB/c mouse can consume 6 g of food per 30 g of body weight [
24]. In our study, their weight ranged from 17 to 20 g, resulting in food intake ranging from 3.2 to 4 g. This substantial food intake can lead to a significant background signal in the intestinal and stomach areas. Without taking any measures to remove or reduce the gut signal, detecting MPI signals in the surrounding area becomes challenging. For example, the detection of nanoparticles in mesenteric lymph nodes has become more challenging [
13]. The daily intake of from 3 to 4 g of food can account for the significant signal differences observed in the gut area when we transition from our standard Gordon diet to a low-iron diet (AIN93G), a Western diet, or a GAN.
Fink et al. reported that, even after a 12 h fasting period, residual gut signals were still detectable, which they attributed to trace food remnants and iron content from the bedding materials consumed by the animals. They concluded that even when animals were housed with corn-based bedding—designed to minimize iron content—prior to MPI, background gut signals persisted and could interfere with the quantification of weaker signals, such as those from the popliteal lymph nodes [
12]. In alignment with this, our study also observed that during fasting, mice exhibited increased gnawing behavior toward both bedding and nesting materials, particularly after two hours into the fasting period. As demonstrated in
Figure 2, although the MPI signals from bedding and nesting materials were lower than those from standard commercial diets, their signals were comparable to those from low-iron diets such as GAN and the high-fat formulations. These findings underscore the importance of accounting for environmental sources of background signal—especially under fasting protocols—when designing MPI studies involving gastrointestinal imaging.
Other researchers, such as Foster et al. and Sehl et al., have suggested fasting mice overnight (approximately 12 h) as a solution to this issue [
11,
25]. While fasting overnight seems to be a viable approach, it may not be suitable for many studies where researchers need to inject the nanoprobe and investigate its biodistribution several hours or days postinjection [
26], especially in molecular imaging studies. Moreover, prolonged fasting can induce stress and potentially alter metabolic pathways, as well as affect the behavior and activities of mice. Makela et al. demonstrated that fasting animals overnight (12 h) reduced signal intensities from the gut area by 86%, which aligns with our findings, as presented in
Table S3 [
27]. In our study, despite fasting the animals for up to 24 h, the gut signal remained visible, although it had decreased by an average of 90%. This reduction can be attributed to two main factors, nesting and bedding materials, and an often-overlooked factor in many studies, coprophagia, which tends to be more prominent when mice have nothing else to eat (i.e., during fasting periods) [
28]. In our study, we attempted to minimize this effect during the first 6 h after initiating the fasting period by replacing the cages every hour. However, after this initial period, particularly overnight, we had no control over coprophagia. Additionally, we collected feces from the mice (0.2 g each time) and measured the signal intensities in high-sensitivity mode. Our data revealed a significant decrease in signal intensity over time. The initial signal was 40.6, which then decreased dramatically to 13.8 after 10 h and ultimately reached 5.0 (arbitrary units) at 24 h postfasting.
Our results demonstrate that we can effectively reduce signal intensities from the gut signal and diminish background noise by feeding mice low-iron diets. However, in all groups, including those on low-iron diets (AIN93G), GAN, or the Western diet, the gut signal remained visible even after 7 days of fasting and housing the animals with corn bedding containing minimal iron before MPI. This persistence of the gut signal is illustrated in
Figure 4 and S3. Notably, the intensity of this signal was approximately twice that of the background signal (which arises from bedding/noise).
Although our study did not include direct tracer injections in animals fed with different diets, the background signal generated by certain standard diets was comparable to or greater than signals from tracer doses used in molecular imaging. This highlights the practical impact of our findings, demonstrating the potential for diet-induced background to confound tracer signal interpretation in MPI studies.


