Article

Band Structure Calculations, Magnetic Properties and Magnetocaloric Effect of GdCo1.8M0.2 Compounds with M = Fe, Mn, Cu, Al

1
Faculty of Physics, Babes-Bolyai University, Kogalniceanu 1, 400084 Cluj-Napoca, Romania
2
Fachbereich Physik, University of Osnabrück, 49069 Osnabrück, Germany
3
National Center of Scientific Research, 54000 Nancy, France
*
Author to whom correspondence should be addressed.
Magnetochemistry 2024, 10(8), 53; https://doi.org/10.3390/magnetochemistry10080053
Submission received: 4 July 2024 / Revised: 16 July 2024 / Accepted: 21 July 2024 / Published: 24 July 2024
(This article belongs to the Special Issue Advance of Magnetocaloric Effect and Materials)

Abstract

:
The magnetic properties, band structure results, and magnetocaloric effect of GdCo1.8M0.2 with M = Fe, Mn, Cu, and Al are reported. The band structure calculations demonstrate that all the samples have a ferrimagnetically ordered ground state, in perfect agreement with the magnetic measurements. Calculated magnetic moments and variation with the alloy composition are strongly influenced by hybridisation mechanisms as sustained by an analysis of the orbital projected local density of states. The XPS measurements reveal no significant shift in the binding energy of the investigated Co core levels with a change in the dopant element. The Co 3s core-level spectra gave us direct evidence of the local magnetic moments on Co sites and an average magnetic moment of 1.3 µB/atom was found, being in good agreement with the theoretical estimation and magnetic measurements. From the Mn 3s core-level spectra, a value of 2.1 µB/Mn was obtained. The symmetric shapes of magnetic entropy changes, the Arrott plots, and the temperature dependence of Landau coefficients clearly indicate a second-order phase transition. The relative cooling power, RCP(S), normalized relative cooling power, RCP(∆S)/∆B, and temperature-averaged entropy change values indicate that these compounds could be promising candidates for applications in magnetic refrigeration devices.

1. Introduction

The rare-earth (R)-3d transition metals (M), intermetallic compounds, are intensively studied due to their interesting physical properties coupled with their many technical applications like permanent magnets, magnetostrictive devices, magneto-mechanical sensors, actuator hydrogen storage, magneto-optical storage media, magnetic refrigeration, etc. [1,2,3,4,5,6,7,8,9,10,11,12]. The magnetic behaviour of these compounds can be seen like a combination of the localized magnetism of rare-earth metals and the itinerant magnetism of 3d transition metals. The 4f shells of R metals give rise to high magnetic moments and strong magnetocrystalline anisotropy while the transition temperatures are, in principle, determined by 3d-3d exchange interactions [1,9,13]. Among these R-M materials, RM2 compounds, known as Laves phases, have attracted much interest for the study of the fundamental properties of intermetallic phases in general. Their crystalline structures are simple and have high symmetry compared with other R-M compounds and allow the deep understanding of their physical properties in terms of both basic aspects and possible technical applications. Open questions, like itinerant versus local moments, the role of the 3d band in magnetic properties, 4f-5d and 5d-3d hybridization, the onset of magnetism, spin fluctuations, etc., have come under debate and many models have been proposed [14,15,16,17,18,19,20,21,22,23,24,25]. It was shown that the RM2 band structure comes from the superposition of the high density of states of the M3d transition metal narrow band with an R5d(4d) rare-earth metal wide band having a low density of states [26]. In RCo2 compounds, the Co3d band is almost filled and the Stoner criterion for the onset of magnetism is nearly satisfied. In this case, the magnetic behaviour of the rare-earth element is very important, allowing different magnetic properties and consequently the Co magnetic moment is induced by the exchange field [26,27,28].
GdCo2 crystallizes in a cubic C15 structure; the Gd and Co atoms each occupy only one type of site. This compound is ferrimagnetically ordered, as expected for heavy rare-earth compounds. The magnetic ordering, magnetic moment, and transition temperature can be easily tuned by doping.
Previously, we have studied the magnetic properties of RCo2−xSix [29], GdCo2−xCux [30], and GdCo2−xNix [31]. We have found that in all compounds from these systems, the Gd and transition metal magnetic moments are antiparallelly oriented. The magnetic behaviour of cobalt in RCo2−xSix was described by the theory of spin fluctuations. Temperature-induced cobalt moments were evidenced in the paramagnetic range. These moments are affected by p-d hybridization as evidenced by the partial quenching of spin fluctuations by the internal field. The cobalt moments are hardly influenced by alloying with copper. The ratio between the number of spins determined from Curie constants and saturation magnetization was found to be 2, a value which indicates that cobalt can be described as a weak ferromagnet. Little variations in the effective magnetic moments were explained by the partial quenching of spin fluctuations with an increase in the exchange interactions involving cobalt atoms. The Gd5d band polarization was related to 4f-5d local exchange as well as to 5d-3d hybridization, the last one being essentially proportional to cobalt magnetization. The XPS measurements showed no important shifts in the binding energy of the Co core levels with a variation in Ni content. The exchange splitting of about 3.2 eV between the high-spin and the low-spin final states of the Co 3s core level demonstrate the local magnetic moments on Co sites. The Co magnetic moments were found to decrease due to Co-Ni hybridization and the filling of bands with electrons provided by Ni. A second-order magnetic phase transition was confirmed by the Arrott plots, the temperature dependence of the Landau coefficients, and the shapes of magnetic entropy changes [31]. The magnetocaloric effect of near-room-temperature magnetic refrigeration applications was studied in recent years on many materials, since it is supposed to be an energy-efficient and environmentally friendly alternative to vapour-compression refrigeration technology. There are some excellent papers and reviews on this matter, with the number of research papers in the field increasing exponentially—see the papers and references therein [32,33,34,35,36].
In this paper, we report the influence of Fe, Mn, Cu, and Al substitutions on the electronic properties, magnetic properties, and magnetocaloric effect of a GdCo2 compound. The dopant concentration was 0.2 for all studied systems. Band structure calculations allow us to explain the magnetic behaviours of different ions from these materials and to correlate the variations in cobalt magnetic moments with the atomic numbers of the substitutions. An extra magnetic moment on Gd was found. For a complete characterization of the physical properties of the transition metals, we used several analysis tools: magnetic measurements, X-ray photoelectron spectroscopy (XPS), and band structure calculations. The transitions from the paramagnetic state to the ferrimagnetic state were found to be of the second-order type. The magnetocaloric properties around transition temperatures for compounds with Al and Cu were also studied.

2. Materials and Methods

GdCo1.8M0.2 samples were prepared by arc-melting stoichiometric mixtures of high-purity (99.99%) ingots under a purified argon atmosphere. A 1.5% excess of Gd was added in order to avoid loss due to the evaporation of the rare earth during melting. The melted samples were turned and remelted 10 times in order to avoid the presence of small quantities of other crystal phases on the facets in contact with the furnace hearth and to ensure homogeneity. The samples were wrapped in tantalum foil and thermally treated in a vacuum at 850 °C for 7 days and slowly cooled to room temperature. X-ray diffraction (XRD) was performed at room temperature on the powder sample using a Bruker D8 Advance AXS diffractometer with Cu Κα radiation. Small bulk sample pieces were ground in order to obtain used powders. The XRD investigation revealed that all samples were single-phase with a cubic MgCu2—Laves-type structure.
A 12 T VSM from Cryogenics was used for magnetic measurements in the temperature range 5–550 K and with an external magnetic field up to 12 T. The magnetization isotherms registered between zero field and a maximum field (H0) were used in order to calculate the magnetic entropy changes using the thermodynamic relation:
Δ S m ( T , H 0 ) = S m ( T , H 0 ) S m ( T , 0 ) = 1 Δ T 0 H 0 [ M ( T + Δ T , H ) M ( T , H ) ] d H
with an increment in temperature between the measured magnetization isotherms of ΔT = 5 K. The refrigerant capacity or the relative cooling power (RCP), used to evaluate the magnetic refrigeration of materials, was calculated using the relation
R C P ( S ) = Δ S m ( T , H ) × δ T F W H M
where ΔSm is the maximum value of the magnetic entropy change and δTFWHM its full width at half-maximum.
The band structure calculations were performed using the full potential linearized augmented plane-wave method (LAPW) + local orbitals (lo) as implemented in the Wien2k ab initio code [37] within a fully relativistic scheme. The cut-off energy separating the core from the valence state was chosen to be equal to 7.84 Ry and the matrix size convergence fixed by R M T · k m a x = 7 , with k m a x being the plane-wave cut-off. The k-space integration was performed using a modified tetrahedron method with 1000 k-points within an irreducible Brillouin zone. For the computational resources, we involved parallel computation tools based on a 48 CPU HP840 (Intel® Xeon(R) Gold 5118 CPU @ 2.30 GHz ×48). The calculations were performed within an LSDA + U approach with an effective Hubbard term Ueff = 0.7Ry (U-J), where J is the on-site Coulomb interaction term. This value was chosen to obtain the f peak in the density of states of about 6 eV above the Fermi energy in agreement with XPS experiments. This adjusted U value is in the range of values reported in the literature for GdTM2 alloys [38,39].
The XPS spectra were recorded using an ESCA (PHI 5600ci) spectrometer from Physical electronics with monochromatized Al Kα radiation with hυ = 1486.6 eV. The measurements were performed on fresh surfaces which were obtained by cutting the samples in situ. The O 1s and C 1s core levels in the survey spectra were used to check the surface cleanness. The contamination was found to be negligible. The pressure in the main chamber was maintained below 10−10 mbar. All spectra were recorded at room temperature and calibrated using the Au 4f7/2 signal from a Au foil (84.0 eV).

3. Results and Discussion

3.1. X-ray Diffraction

The XRD patterns of the samples with M = Al, Cu, and Mn are shown in Figure 1. The crystal structure, the lattice parameters, the theoretical peak positions, and the differences between the experimental and calculated patterns—see Figure 1—were determined by performing Rietveld refinements on the experimental data using the FullProf software (Version 8) suite [40]. All studied samples were found to be single-phase, belonging to C15 Laves-type structures. The crystal structure is cubic, of MgCu2 type, with the space group Fd-3 m. The Gd atoms occupy −43 m sites while Co and M are randomly distributed in −3 m positions. We can assume that the dopant atoms occupy −3 m sites since the Gd atomic radius is higher, being 180.4 pm, compared with the Co, Al, and 3d transition metals. If the dopant atom occupies a −43 m site, one Gd atom must move to a Co site, but this is impossible due to the larger value of Gd radius. The lattice constant, calculated from Rietveld refinement, has the value of 7.31(2) Å for GdCo1.8Al0.2, 7.29(6) Å for GdCo1.8Mn0.2, and 7.27(8) Å for GdCo1.8Cu0.2. The variation in the lattice constant can be explained by considering the atomic radius of Cu (128 pm), Mn (140 pm), and Al (143 pm) compared with that of cobalt (125 pm).

3.2. Band Structure Calculations

The ab initio calculations for the GdCo1−xMx cubic Laves phases (C15), with M = Mn, Fe, Co, Ni, Cu, AND Al, were performed using the wien2k code [11], based on a full-potential (linearized) augmented plane-wave ((L)APW) + local orbitals (lo) method, implemented within a fully relativistic scheme. We used a supercell model, illustrated in Figure 2. In this picture, one can distinguish the Gd atoms (green) arranged in a diamond-like structure constituting two fcc lattices shifted by 1/4 of the diagonal length. The Co (blue) and M (red) atoms occupy rhombohedral sites in the tetrahedral arrangement of four Gd atoms. The Gd atoms are located at (1/8, 1/8, 1/8) and (7/8, 7/8, 7/8) and the Co and M atoms randomly occupy the (1/2, 1/2, 1/2), (1/2, 3/4, 3/4), (1/2, 3/4, 3/4) (3/4, 3/4, 1/2), and (3/4, 1/2, 3/4) sites. The supercell contains 24 atoms (8 Gd and 16 Co and M). In our calculations, x = 0.2, so that 3 M atoms randomly substitute the Co in the supercell. The lattice parameters (a = b = c) of the supercell were obtained by minimizing the total energy of the supercell (e.g., 7.3078 Å in case of GdCo1.8Al0.2, 7.2443 Å in case of GdCo1.8Cu0.2, etc.).
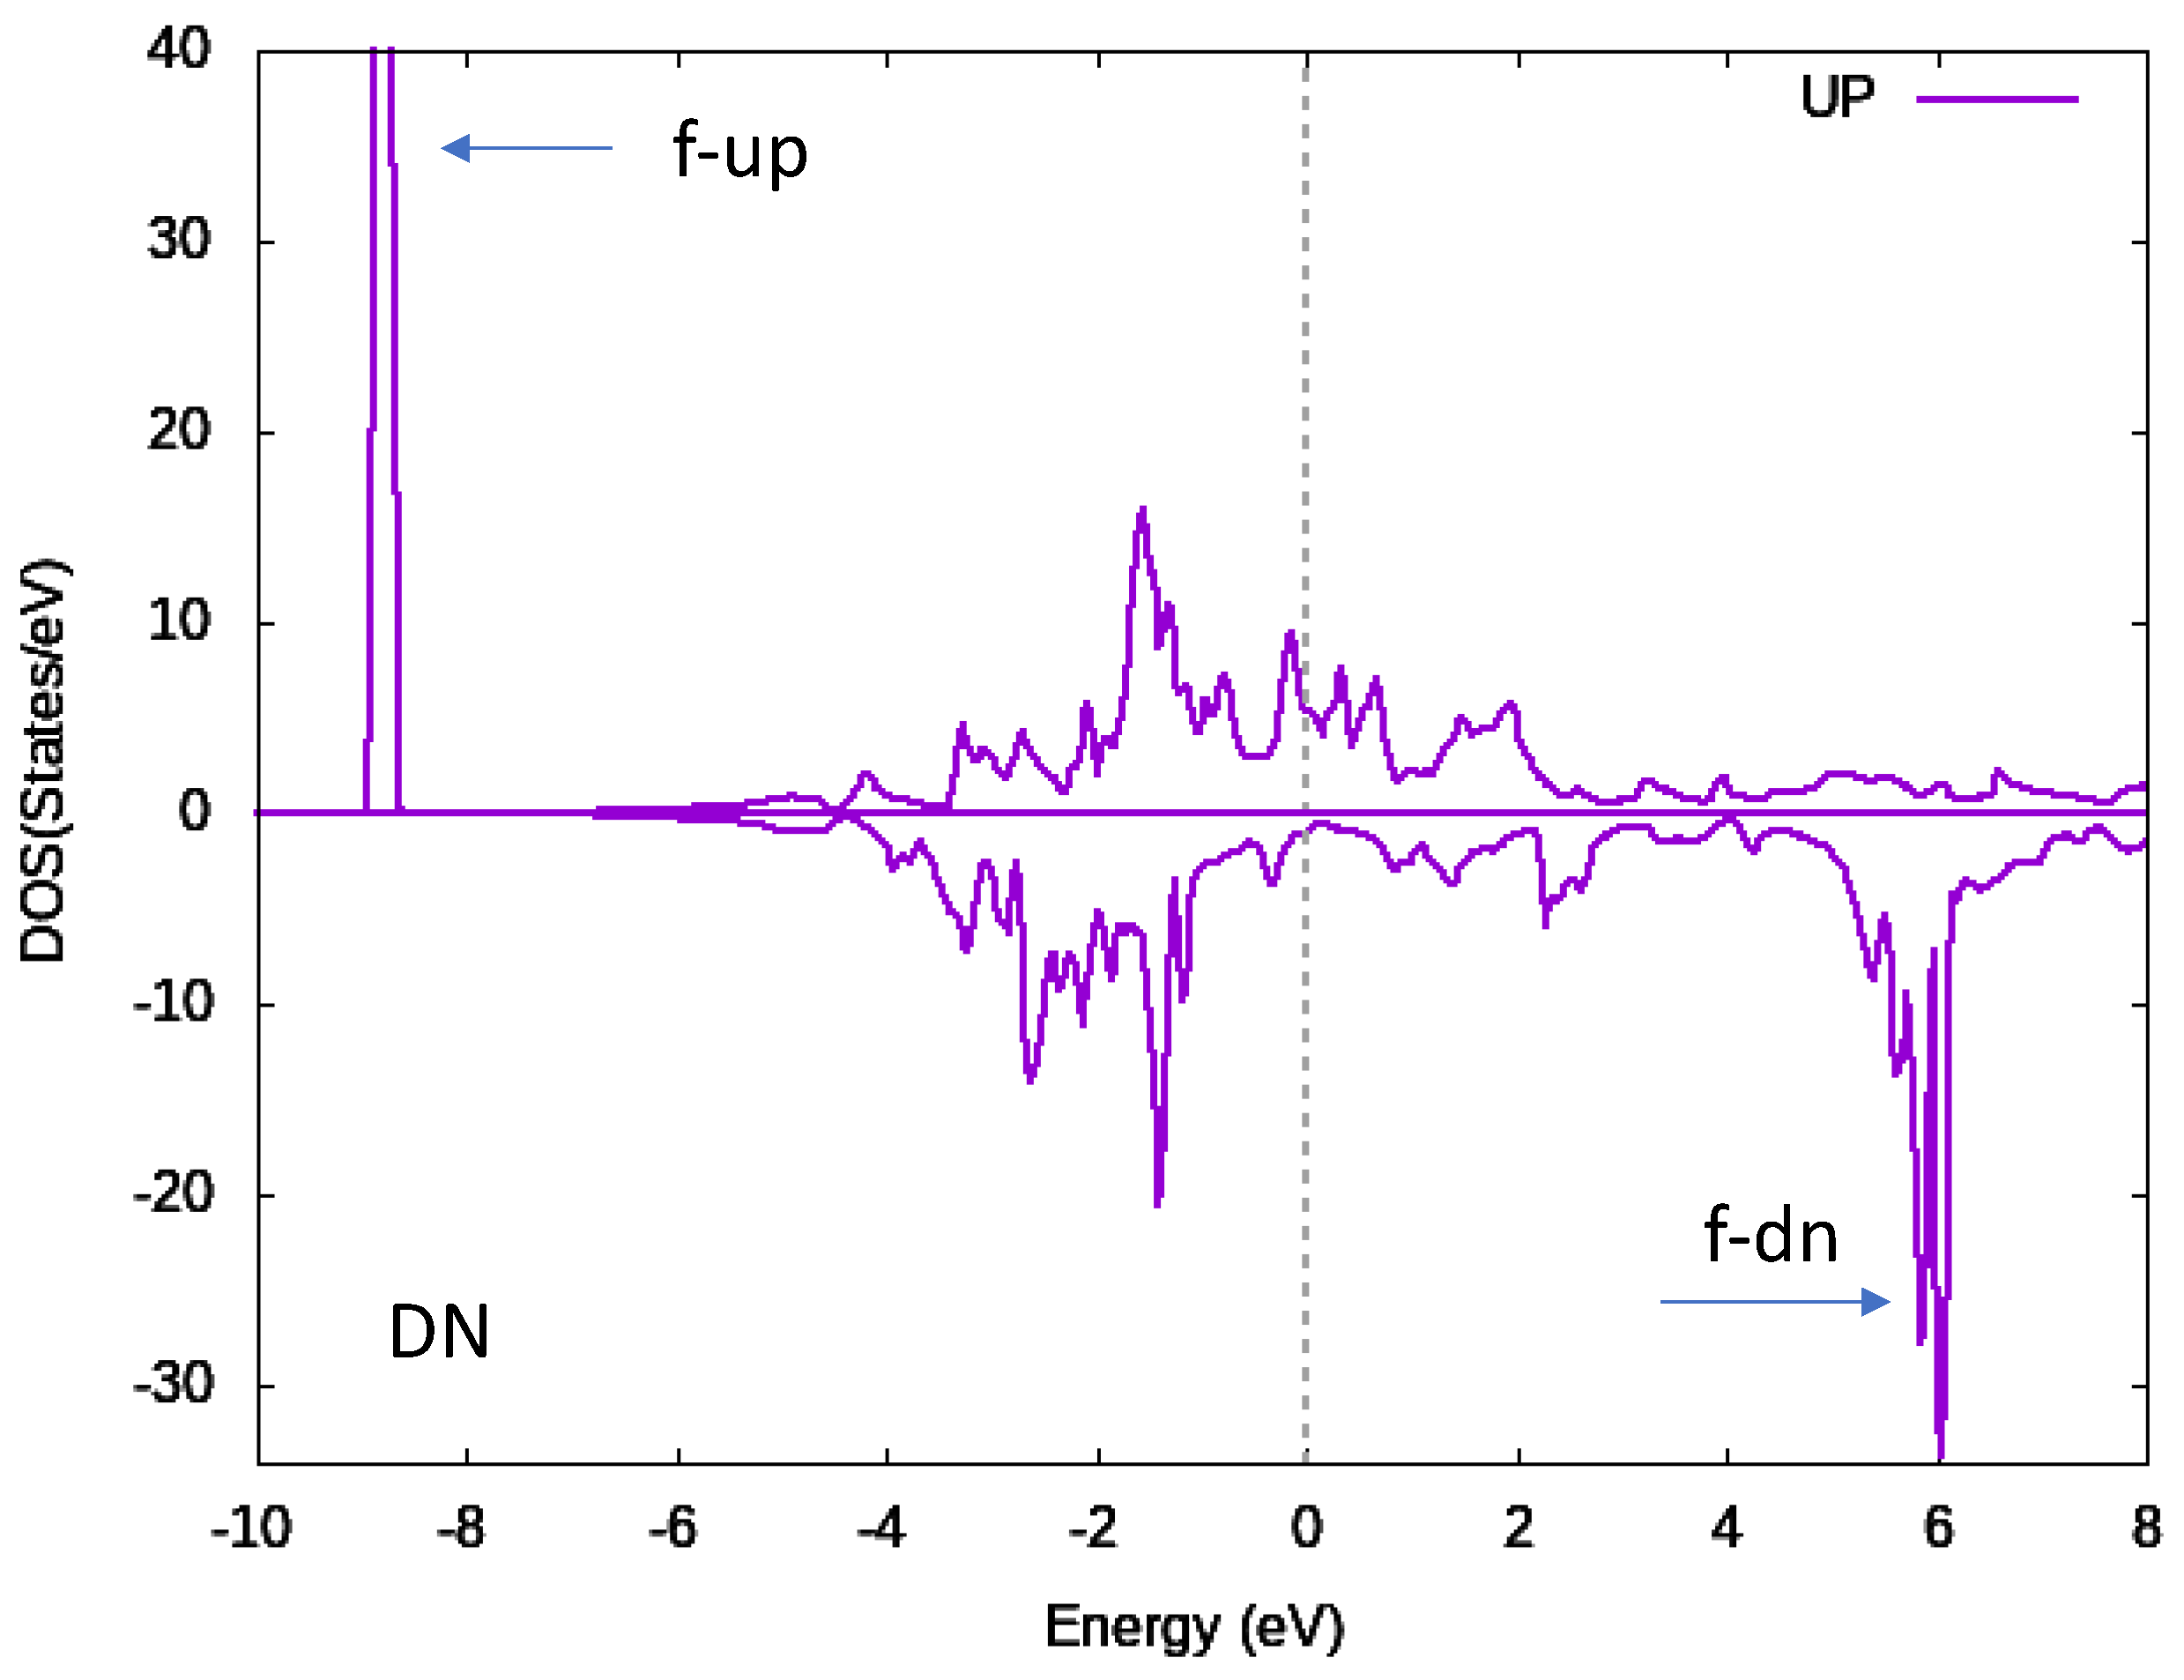
The muffin-tin radii used in the calculations were 2.5 a.u. for Gd; 2.29 a.u for Mn, Fe, Co, and Ni; and 2.13 a.u for Al. Figure 3 illustrates the position of the 4f Gd states for both majority and minority spins, and the role of the Hubbard U term in shifting these states out from the d-band energy range, spreading to few eV around the Fermi energy.
From the band structure calculation results, the following main features can be observed. First, the ground state of all the system is ferrimagnetic, and the magnetic moments of the Gd and the M (transition magnetic metal substitutions) are antiparallel. The ferrimagnetic state has a total energy/supercell about 1.5 eV lower with respect to the ferromagnetic state. When M = Al and Cu, the nonmagnetic substitution enhances the total ferrimagnetic moment in the unit cell by lowering the transition metal’s contribution to the total moment.
The computed magnetic moments of the Gd, Co, and M atoms are shown in Table 1. In this table, we also provide a theoretical estimation for the total magnetic moment per formula unit for each GdCo1.8M0.2 sample.
Beyond the data illustrated in Table 1, from the ab initio calculations we can extract further interesting theoretical results.
(i) Theoretically, the total magnetic moment of all the magnetic elements has two contributions: spin and orbital moment, which can be individually computed within the fully relativistic scheme available in wien2k by introducing a spin–orbit term in the Hamiltonian. Within this framework, we obtain the following conclusions. The orbital magnetic moment of Gd was found to be between −0.003 and 0.005 μB, or practically zero, in agreement with the Hund rules for the 4f7 (Gd) elements, i.e., Smax corresponds to zero ml. The orbital moments of Co are small, (−0.10–−0.11 μB), and parallel with the spin moments. For the Mn, the orbital moment is −0.001 μB, practically zero as expected with the Hundt rule for the 3d5 element with half-filled d states. Then, in the case of Ni, the orbital magnetic moment was found to be −0.03 μB, parallel with the spin moment, and about −0.07 μB for the Fe substitutions, also parallel with the spin, both being practically negligible with respect with the spin moments. Therefore, one can conclude that for all the elements—Gd, Co, and M—the main/dominant contribution to the total moment is the spin moment.
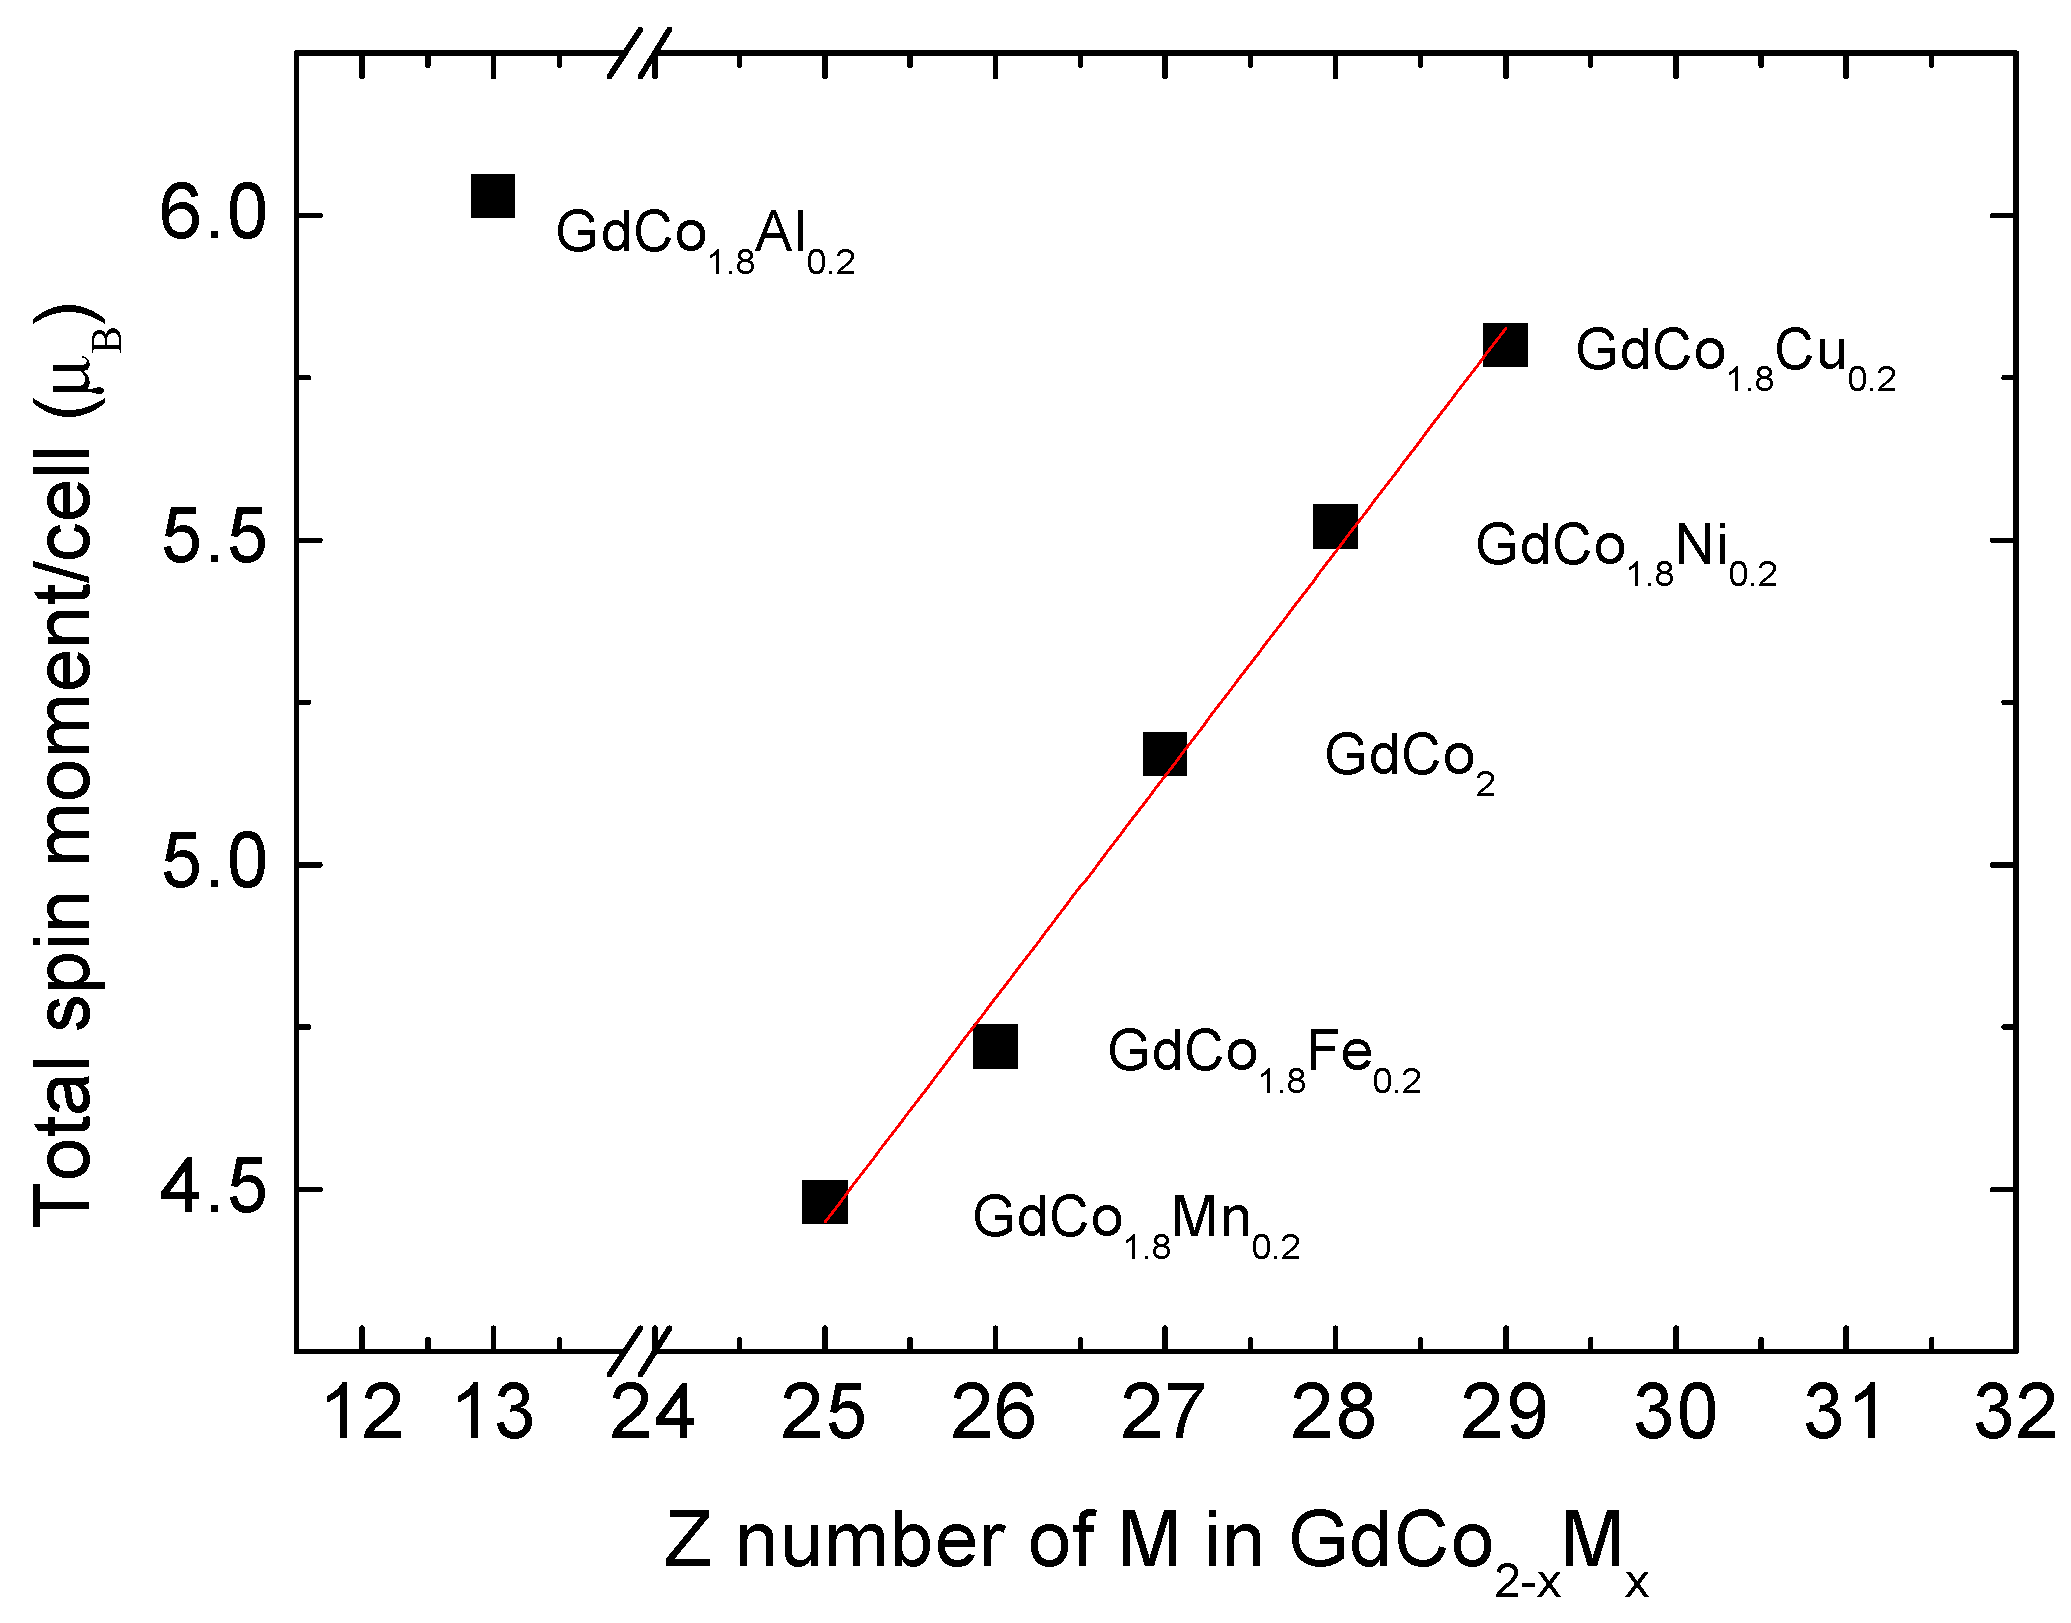
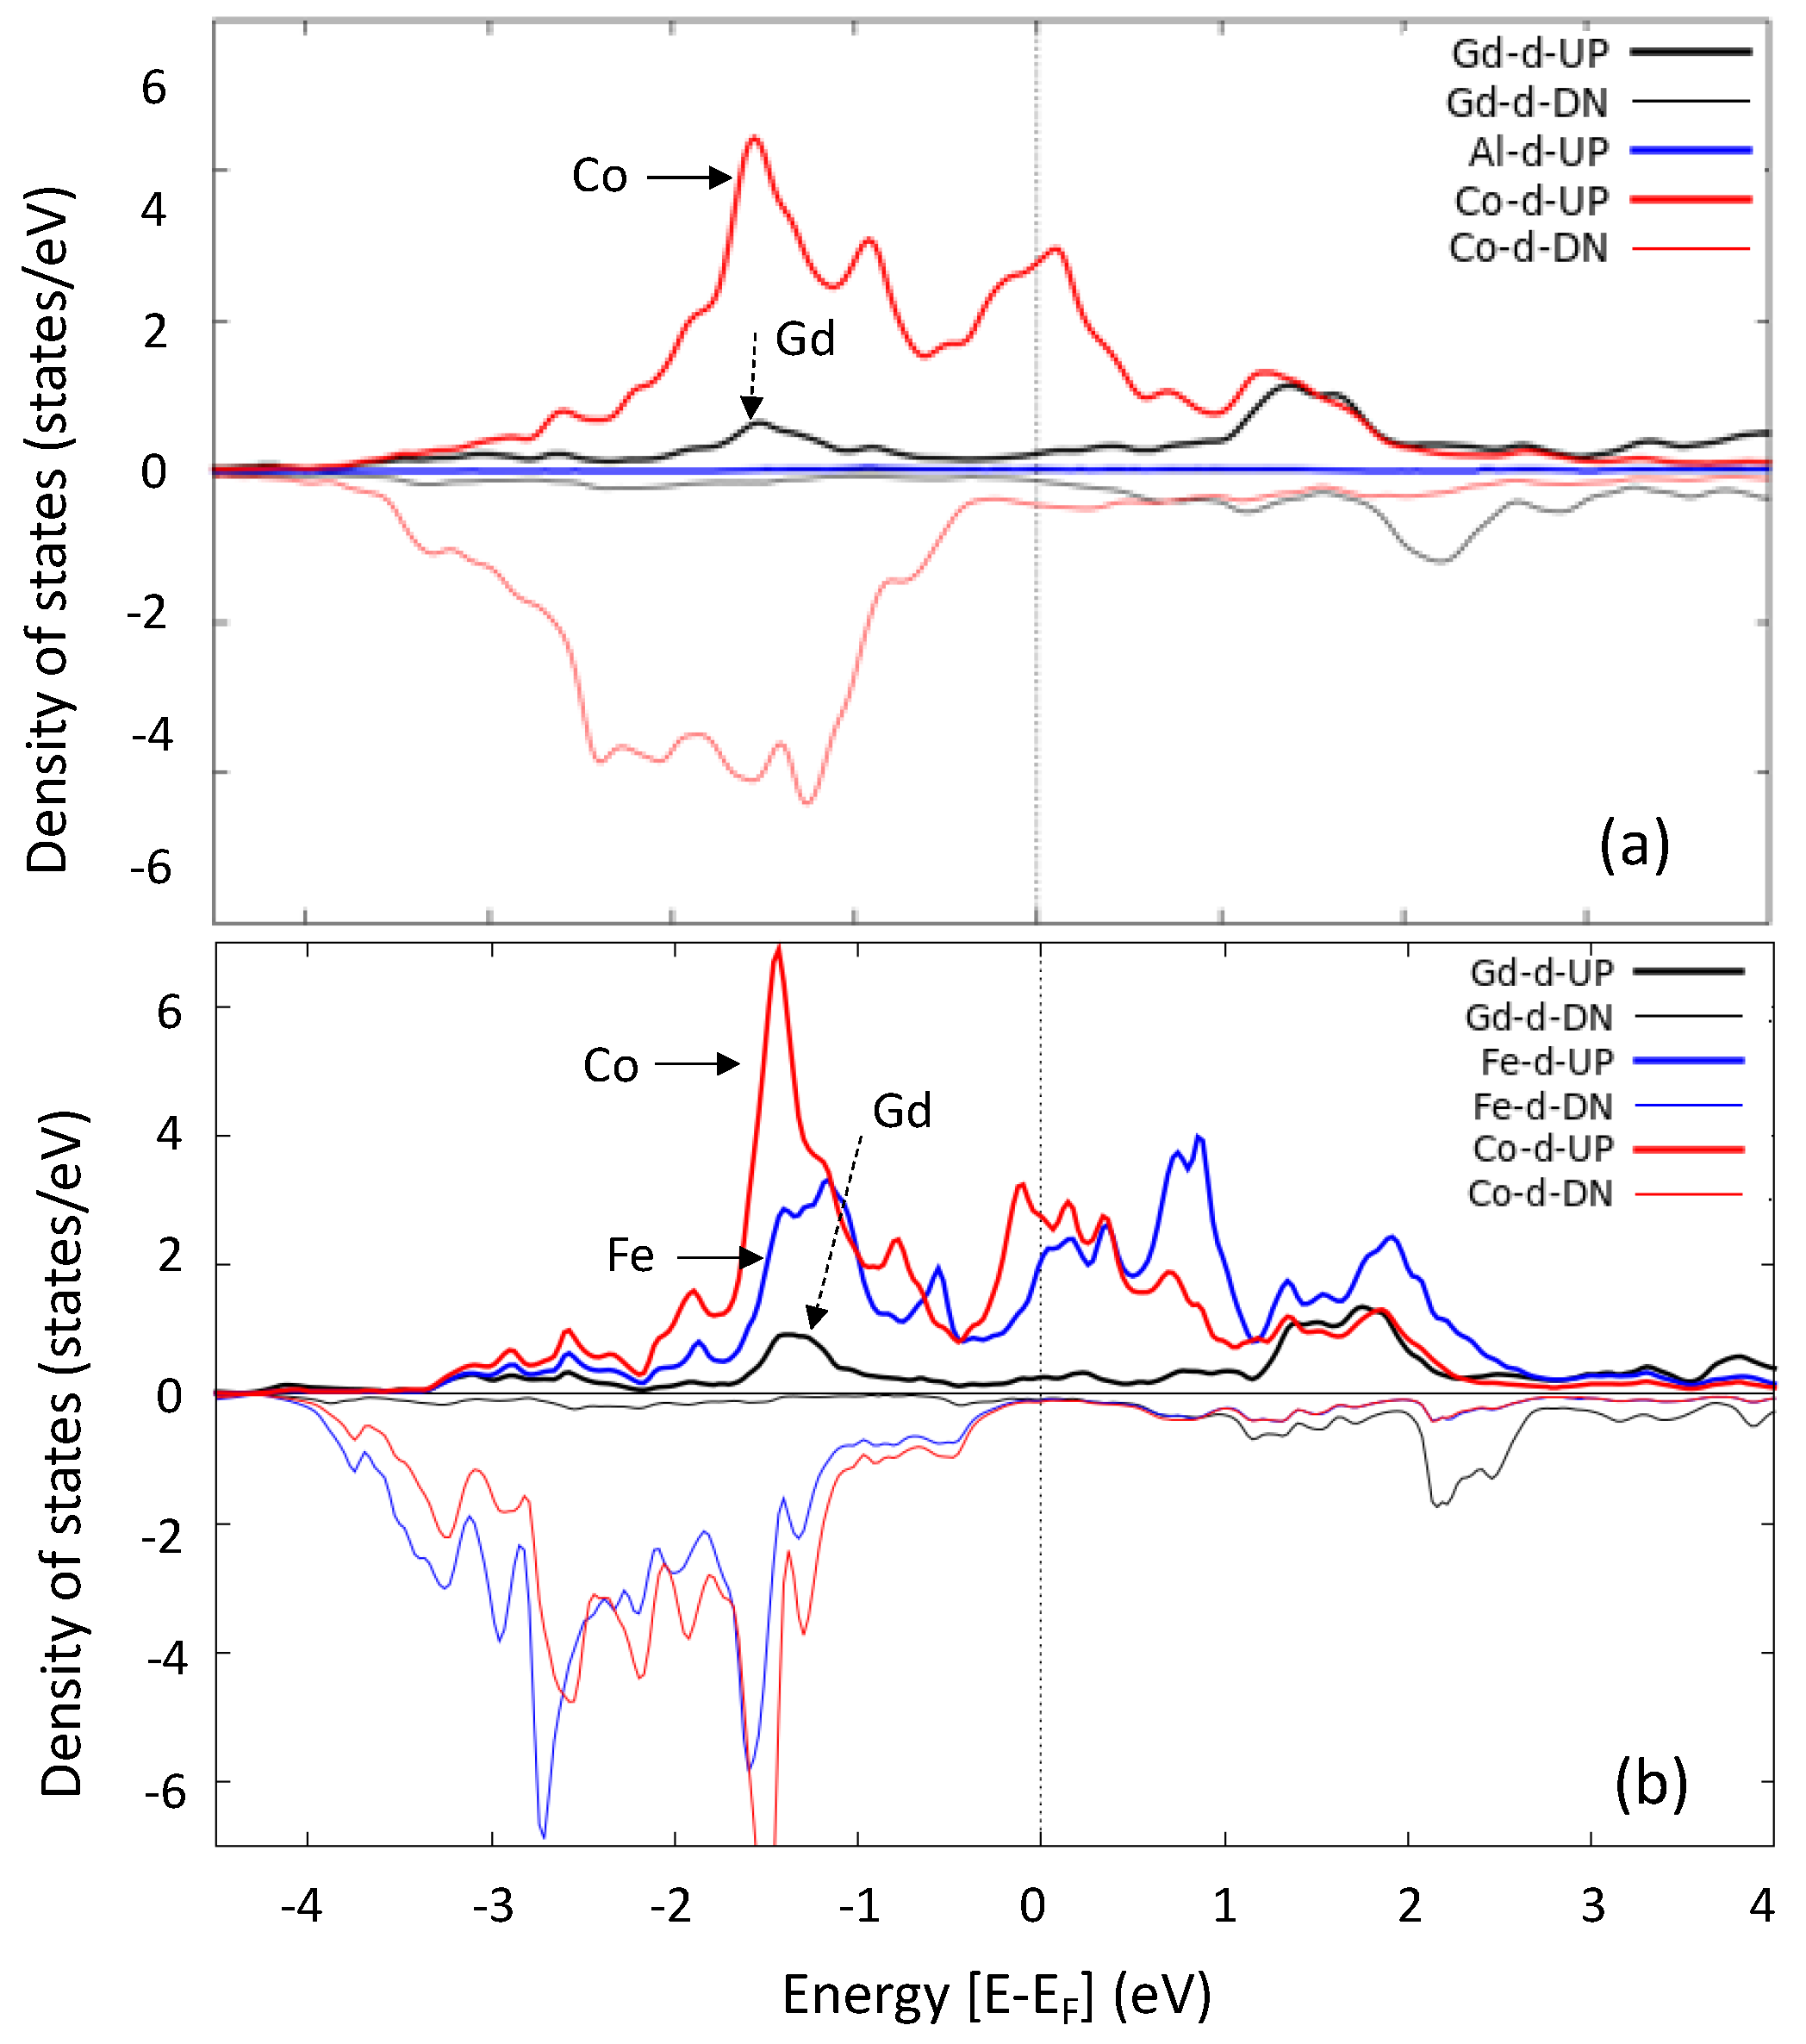
(ii) In Figure 4, we depict the variation in the total moment/unit cell with respect to the atomic Z number of the substitutional element in the GdCo1.8M0.2 compounds. In the cases of the transition metal substitutions: M = Mn, Fe, Ni, Cu, the linear variation agrees with the calculated magnetic moment of the substitutional element (see Table 1): the larger the antiferromagnetic moment of M with respect to that of Gd, the smaller the total magnetic moment per formula unit. However, an interesting result can be further seen in Figure 4. Even if the Cu is nonmagnetic, the total magnetic moment in the case of substitutions with Al is significantly larger. These results can be understood from a more detailed analysis of the orbital projected local density-of-state features. The Al with the [Ne] 3s2 3p1 configuration has no d bands, so no hybridisation is possible with Co and Gd d bands. The total magnetic moment per unit cell is drastically enhanced when substituting antiferromagnetically aligned Co atoms with respect to Gd by nonmagnetic Al. On the other hand, the nonmagnetic Cu symmetrically occupies the up and down d bands that can hybridize with those of Co and Gd, giving rise to covalent magnetism mechanisms that impact the variation in the magnetic moments of neighbouring Co and Gd atoms.
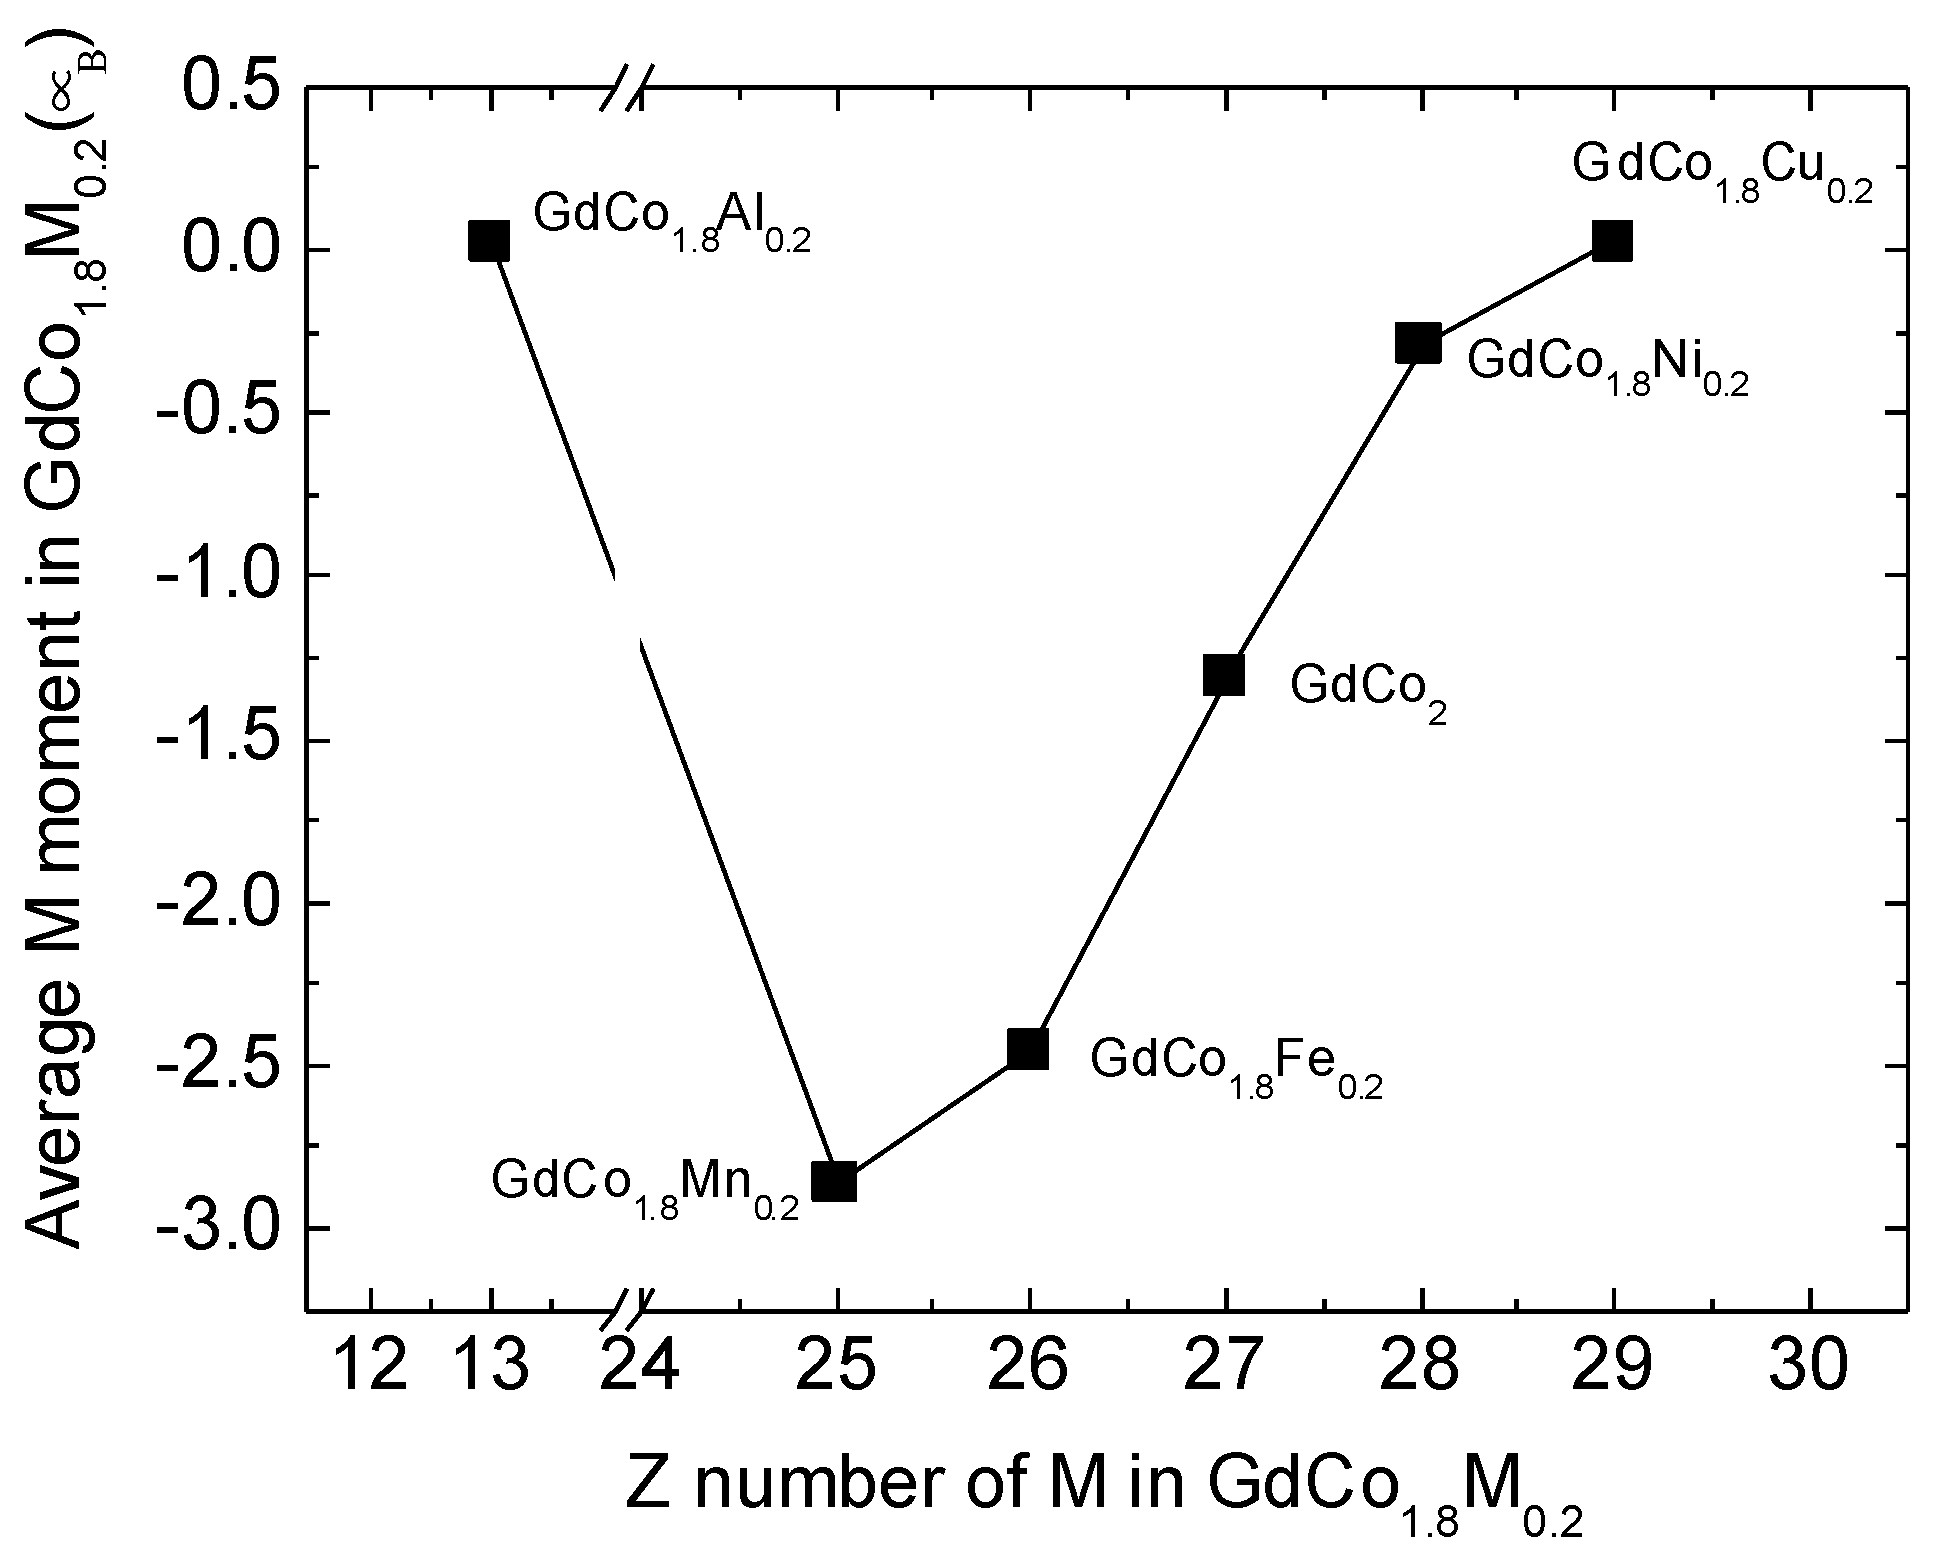
(iii) The variation in the average Co moment in GdCo1.8M0.2 compounds is illustrated in Figure 5. A maximum value is obtained in the case of a substitution with the nonmagnetic Al and this can be explained by the same mechanisms related to the absence of hybridization with the d bands. Then, the variation “roughly” shows a decrease in the cases of Fe and Mn and an increase for the Ni and Cu substitutions. Qualitatively and quantitatively, these results are controlled by hybridisation and covalent magnetism complex features between the d states of the Co and the neighbouring substitutional atoms. The same hybridisation mechanisms explain the theoretical values obtained for the average magnetic moment of the substitutional elements M (Figure 6) and Gd (Figure 7).
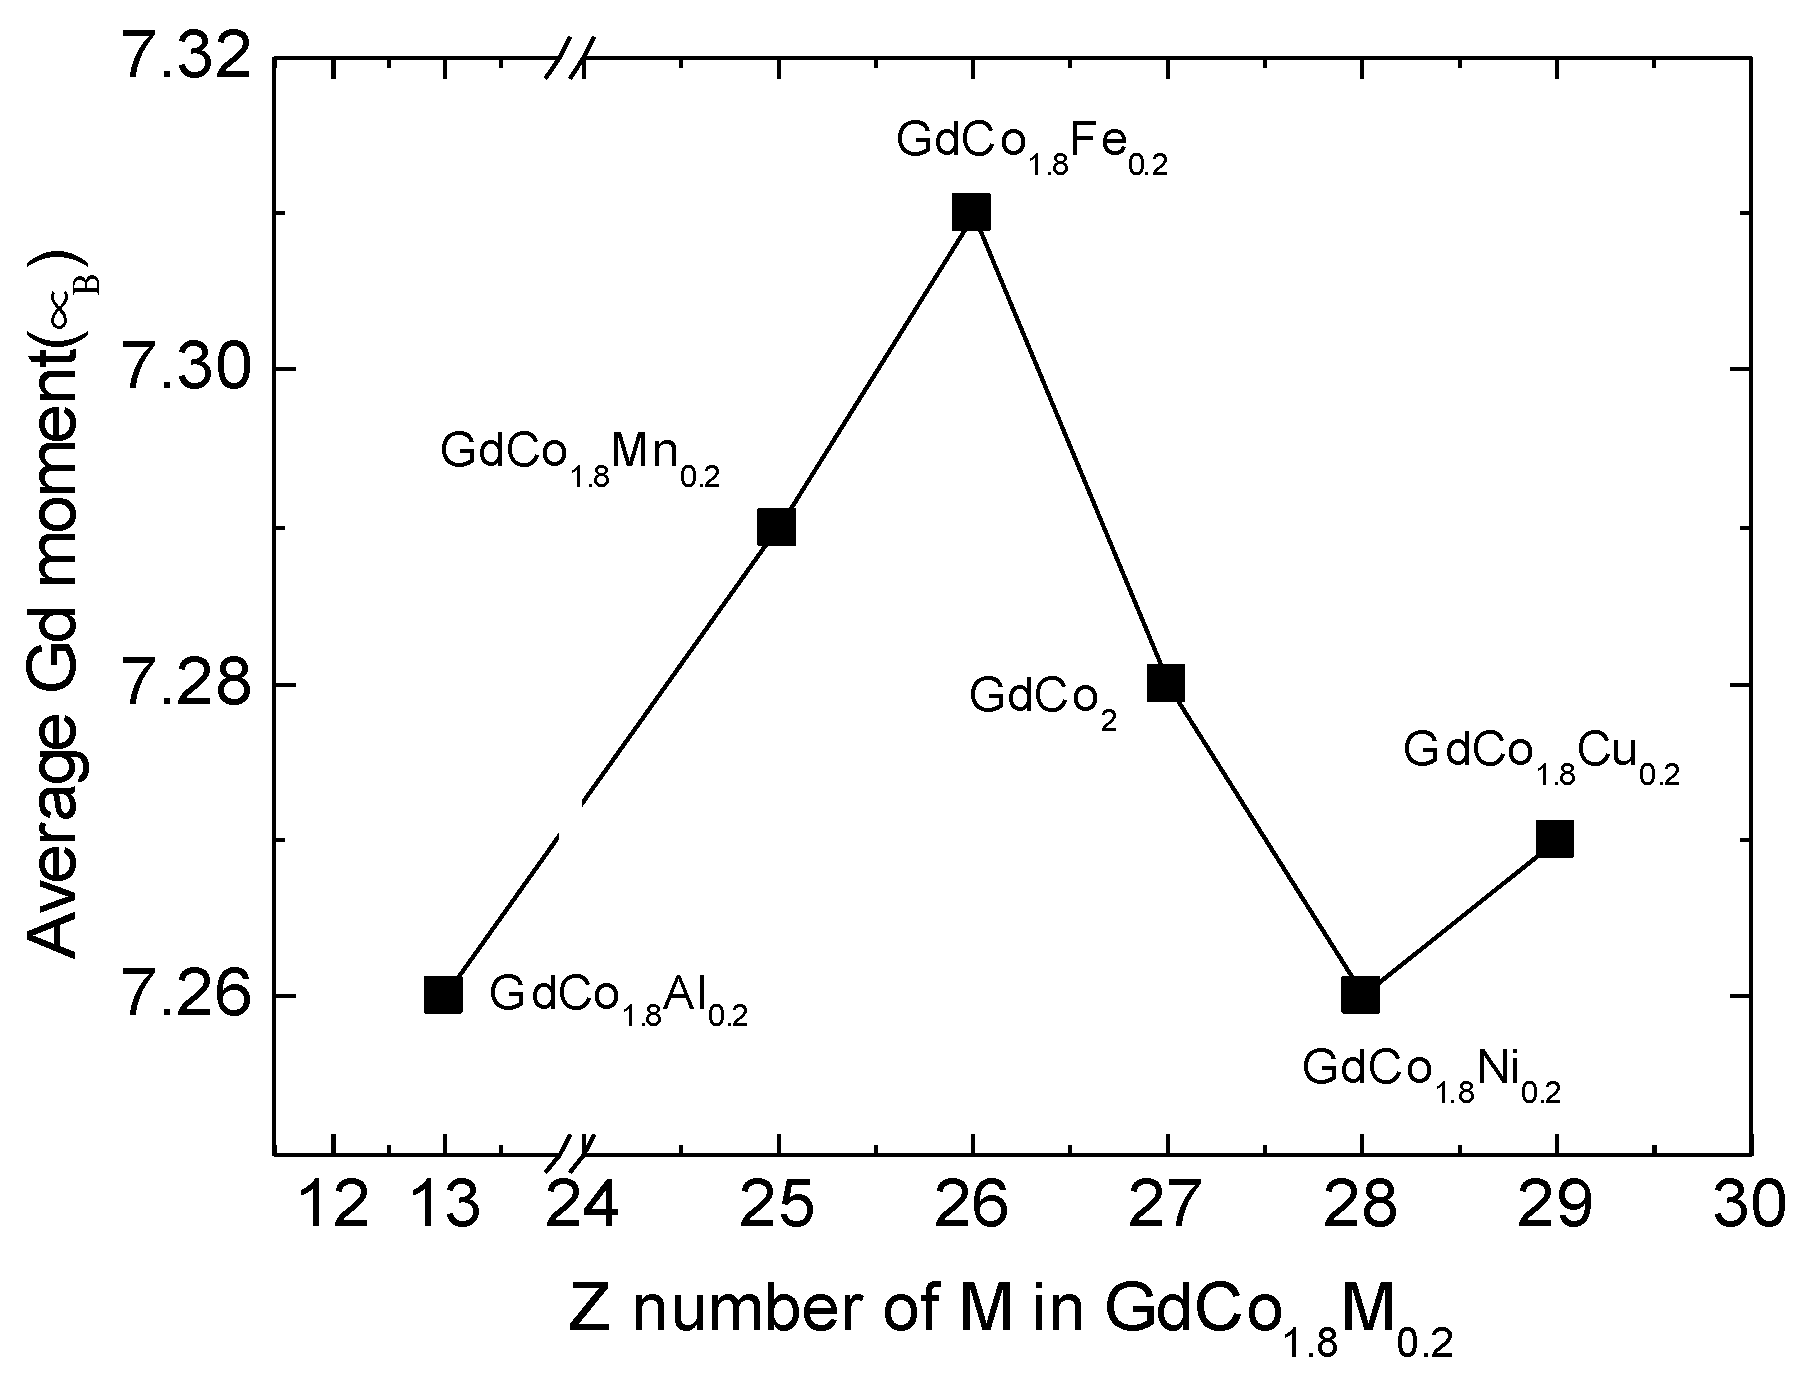
The average moment of M is naturally zero in the case of Al, and decreases to zero from a negative value (antiparallel with Gd) in the transition metal substitution scheme from Mn, Fe, Co, Ni, and Cu. The average moment of Gd has a complex non-monotonous behaviour, also driven by 3d-5d hybridisation and related covalent magnetism mechanisms with the substitutional elements. A maximum value (7.31 μB) is found for substitutions with Fe and minimum values (7.26 μB) in case of substitutions with Al and Ni.
(iv) The band structure/projected density-of-state analysis allows us to explain in detail the mechanisms responsible on the magnetic moment for each element and each site in the supercell. As illustrated by Figure 7, the larger magnetic moment of Gd compared to the theoretical atomic expectation (7 μB) and its non-monotonous variation with respect to the substitutional element points out the important role of the hybridisation of the Gd-5d and Co (or M) -3d orbitals, a hybridization that mediates the coupling between the Gd and the transition metal substitution. This coupling is absent in the case of Al. From the spin-resolved valence charge distribution analysis, one can extract exactly the additional contribution of the hybrid 5d-Gd orbital to the total Gd spin magnetic moment in each case. Moreover, the hybridization mechanisms are also responsible for the variation in the spin magnetic moment of Co when doping with transition metals M. The calculated variation is not simply related to a rigid band shift upwards or downwards, depending on the atomic number of M with respect to that of Co, but to complex covalent magnetism consequences of the 3d-3d hybridization, as illustrated in Figure 8. Such analysis was performed in detail for each substitutional element M = Al, Mn, Fe, Ni, and Cu, and compared with the reference GdCo2 system to obtain deep insight on the hybridisation mechanisms and influence on the individual magnetic moments contained in Table 1. A similar analysis focused on GdCo2−xNix concerning its electronic structure, magnetic properties, and magnetocaloric effects has been published in our paper [31]. We have performed similar calculations for other structural configurations where the substitutional position of M has been varied in the supercell. However, the differences obtained in the individual atom-projected moment due to the different local environment in the supercell are averaged to quite similar average magnetic moments for Gd, Co, and M and total magnetic moment per formula unit.
Beyond this good description of the substitutional alloys within an ab initio model provided by the periodical wien2k supercell scheme, a better description of the electronic structure (e.g., the density of states featured in a random alloy phase), random atomic positions can be generated using statistical tools. Such calculations can be performed using the “Special Quasirandom Structures (SQS)” formalism [41,42], leading to the smoothing of local peaks in DOS related to the periodicity of ordered alloy phases or using dedicated KKR-CPA methods for a better description of the fine features of disordered alloys.

3.3. XPS Spectra of GdCo1.8M0.2 Intermetallic Compounds

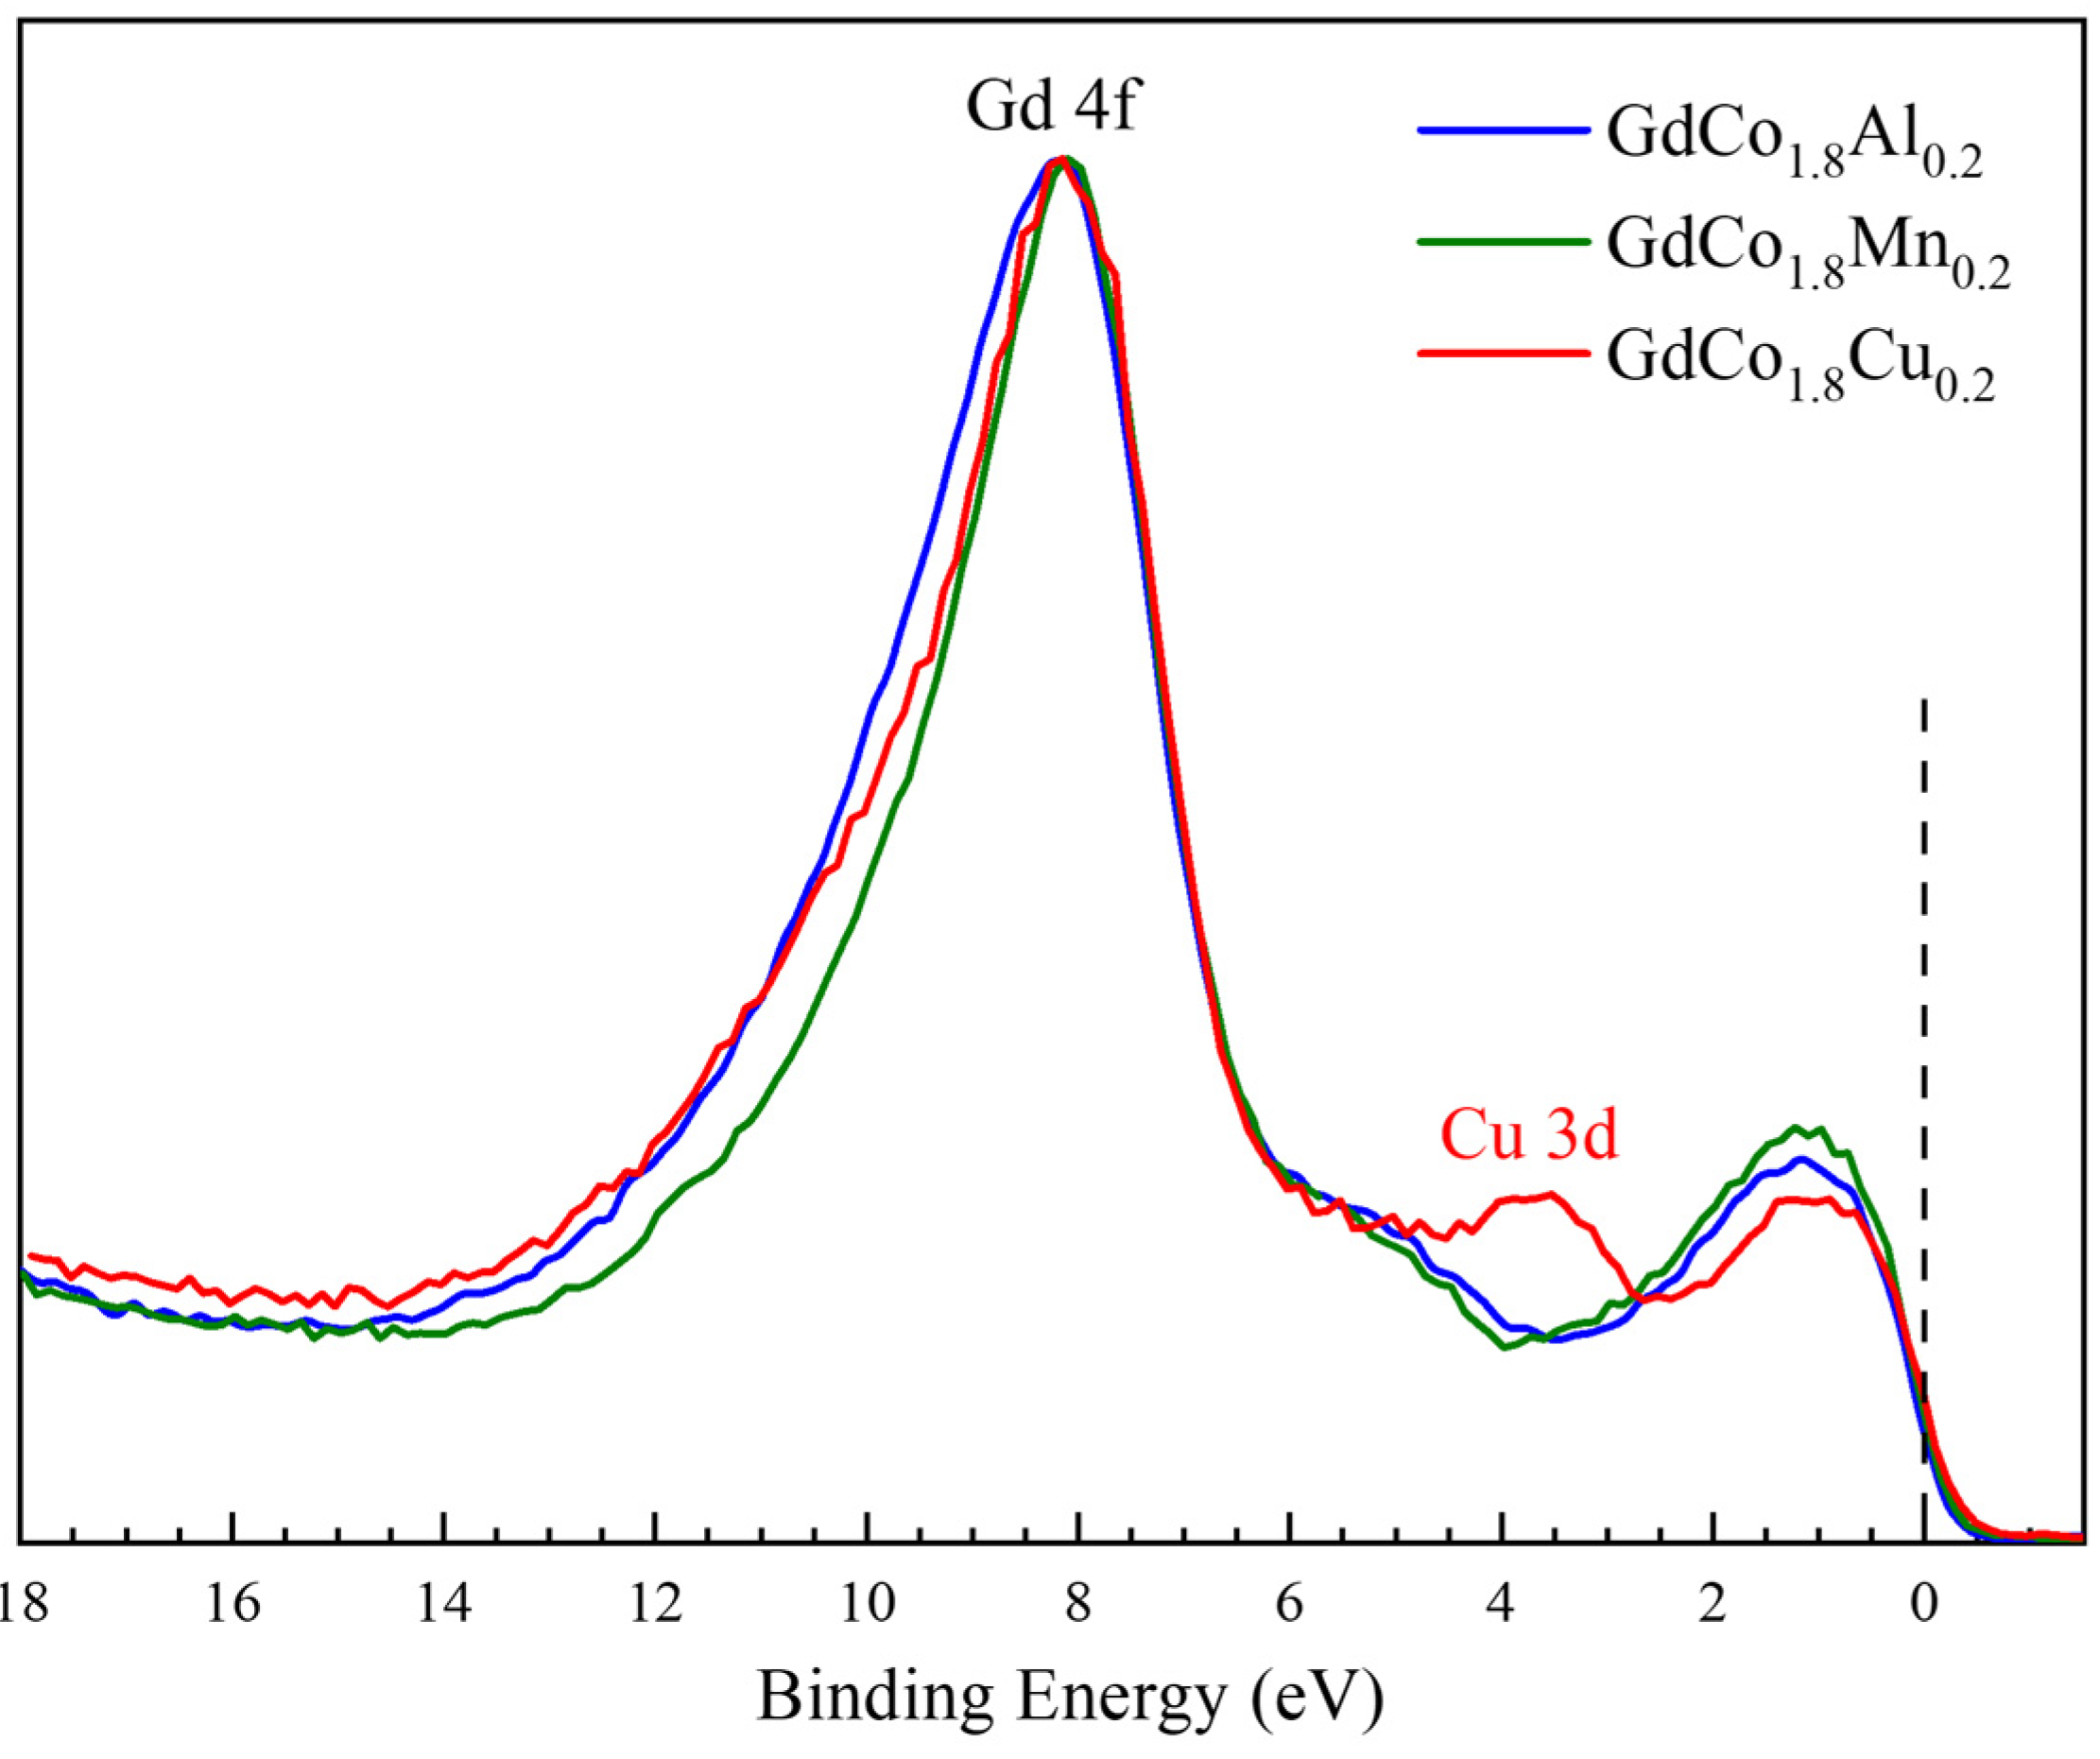
The XPS valence band spectra for the investigated compounds are presented in Figure 9 for a binding energy range up to 18 eV. The most intense peak, located at about 8.1 eV, is due to the Gd 4f electrons. For GdCo1.8Al0.2, the position is shifted to a slightly higher binding energy, at 8.2 eV. The spectra of GdCo1.8Cu0.2 show the Cu 3d states are centred at about 3.7 eV. The wide centroids located at about 1.1 eV are dominated by the Co 3d states for all samples, since at Al Kα radiation, the Co 3d cross-section is larger than the Mn 3d or Al 3p cross-sections, considering the numbers of the different atoms in the unit formula. The noticeable differences between the three spectra at a binding energy below 3 eV are due to the Mn 3d states situated in the 2.5–3 eV region and the Al 3s and Al 3p states located close to the Fermi level.
The electronic structure of the R-M intermetallic compounds can be revealed by XPS core-level spectra. More important information can be obtained in the case of 3d transition metal ions. In the presence of unpaired electrons in the valence levels, due to the interaction of the valence electrons with the core hole, a multiplet (exchange) splitting of the core-level lines appears. The exchange splitting appears due to the intra-atomic exchange coupling between the photo-hole and the unpaired 3d electrons in the final state of the system. The net spin in the valence band is proportional with the magnitude of the exchange splitting, ΔEex. We note that it is necessary to consider the contribution of core-hole screening in the final state of the photoemission and the charge-transfer effects between the 3d metal ion and the ligand atom. The multiplet exchange splitting of the 3s line of the 3d transition metals with a local magnetic moment allows us to find the local moment of the ground state in cases where the charge-transfer satellite in the 2p core level spectra is small.
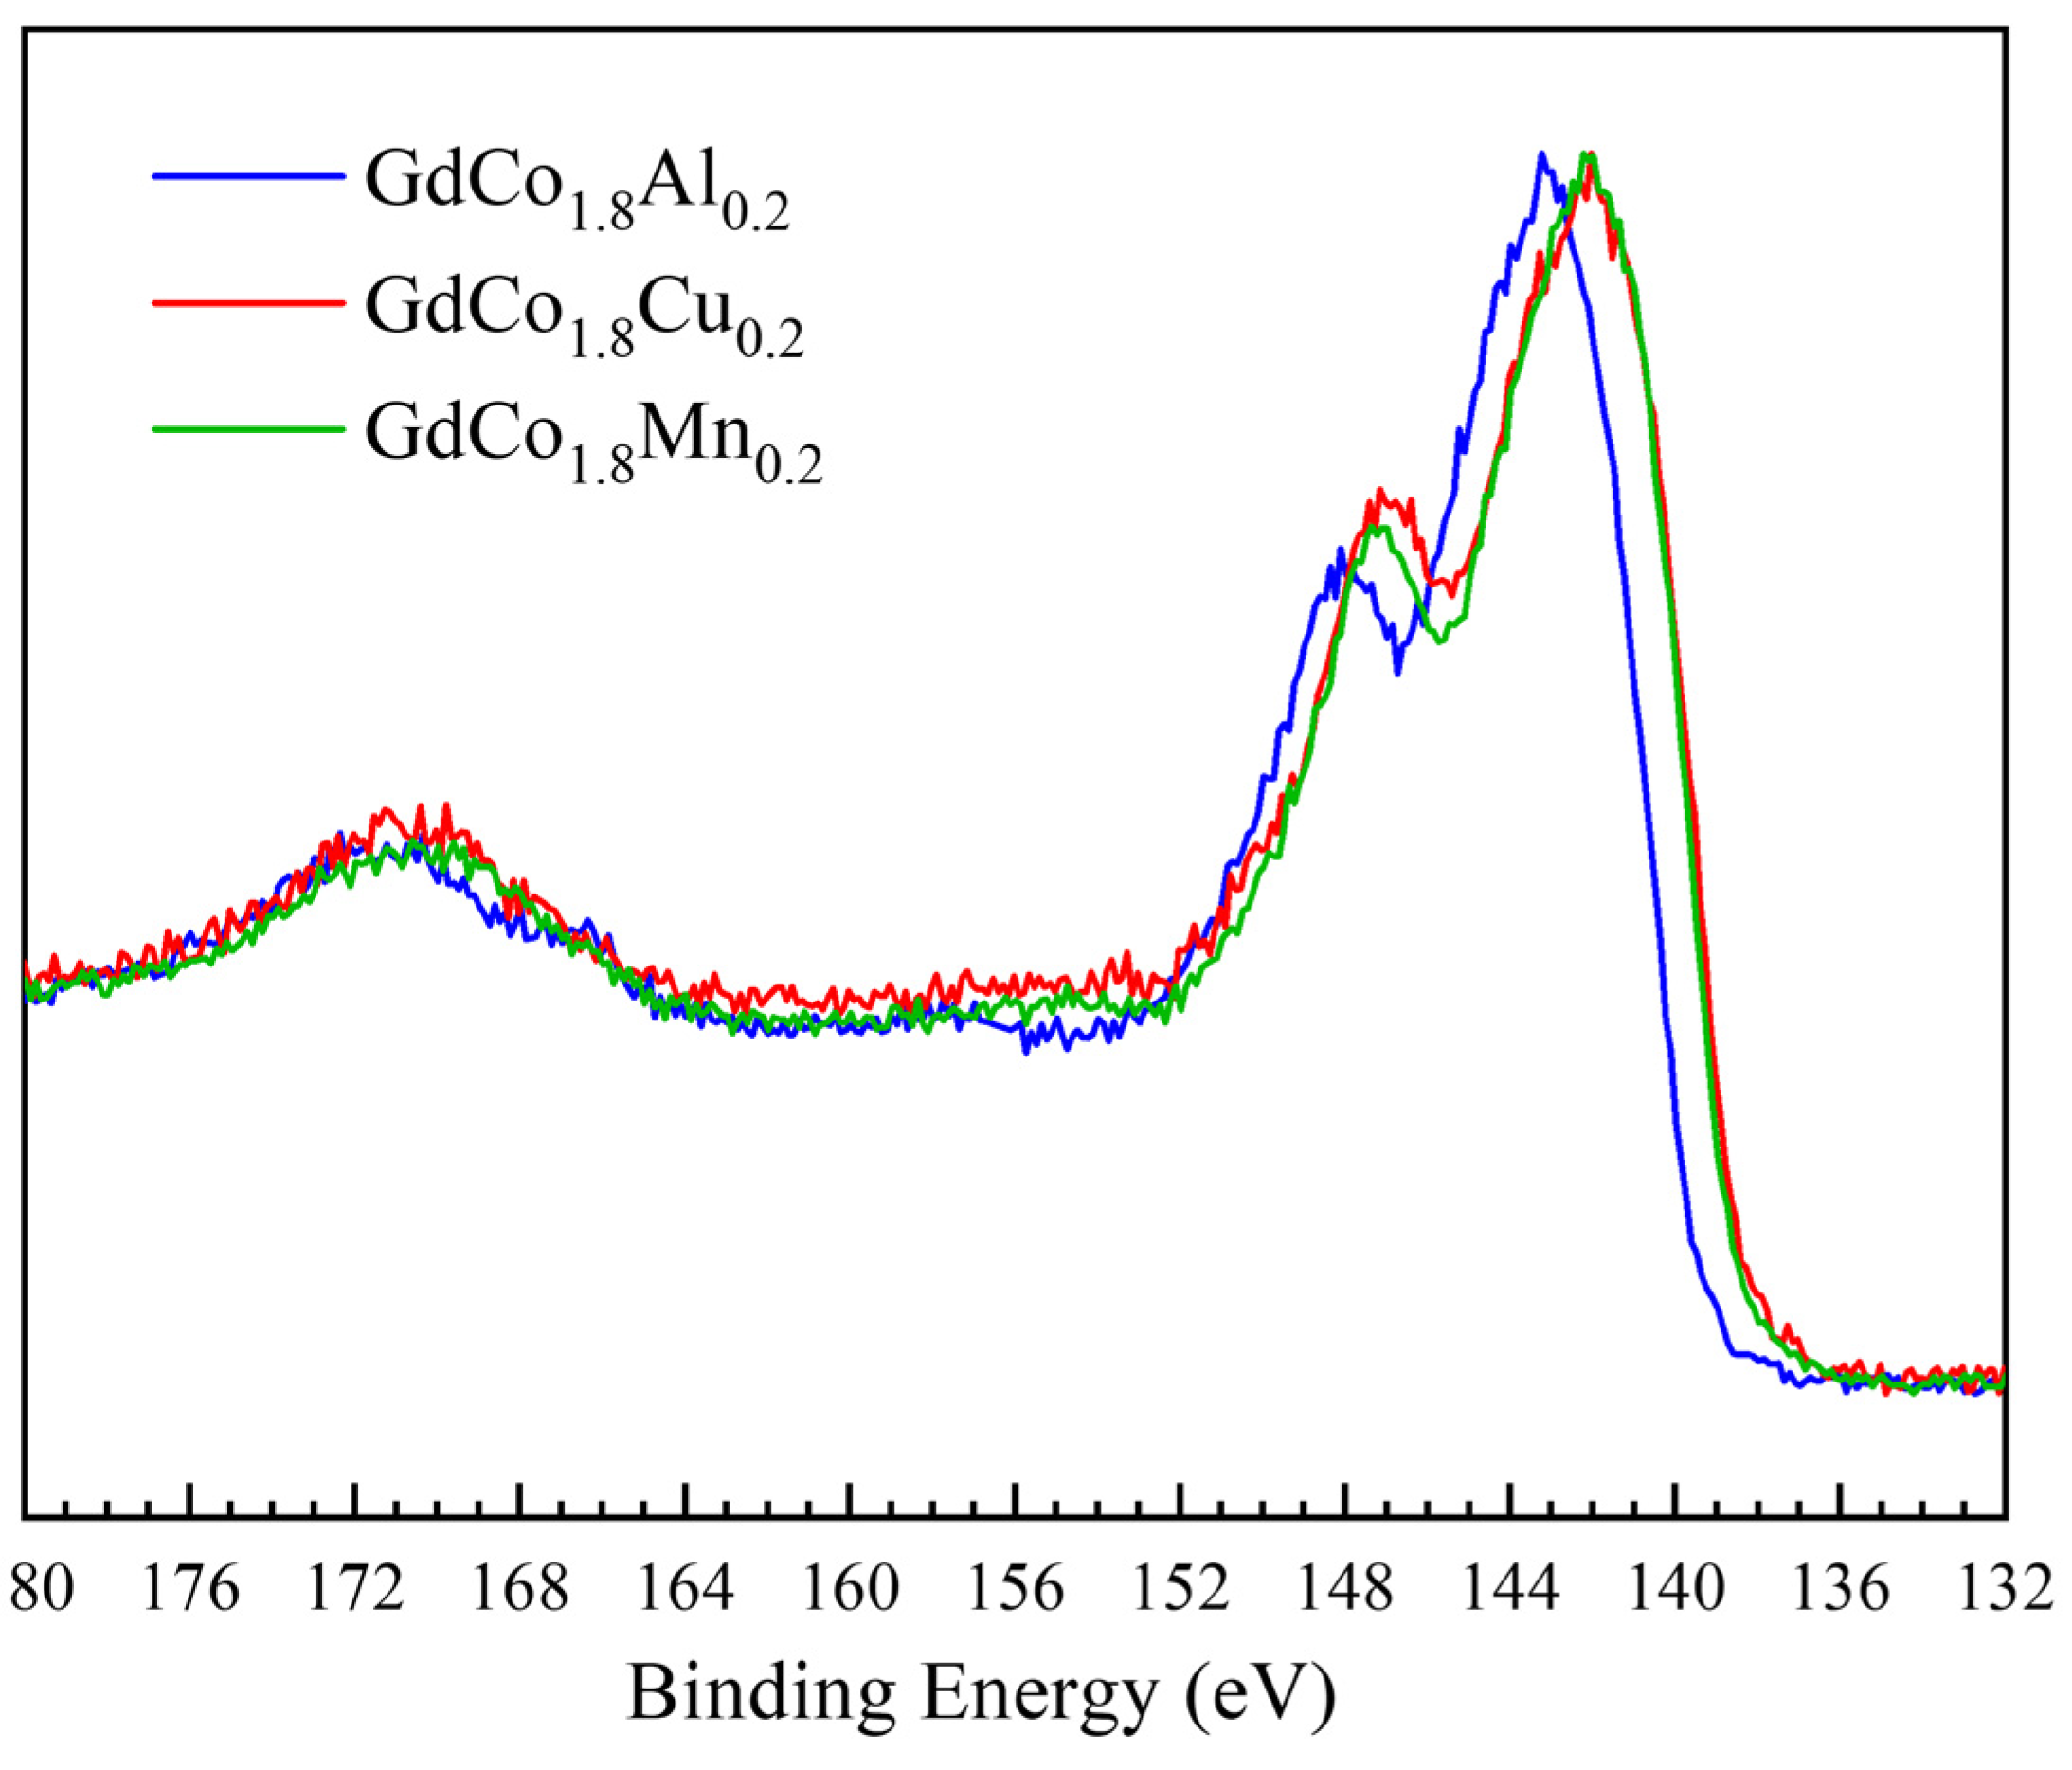
The Gd 4d XPS spectra presented in Figure 10 are characteristic of Gd type compounds as discussed previously for GdCo2−xNix [31]. The two broad features situated at about 142–143 eV and 147–148 eV are due to the different coupling of the 4d9 hole with the 8S term of the 4f shell leading to the 9D or the 7D terms. The spectral features at about 171 eV were found to be related to energy losses due to the excitation 5p level [43]. A shift in the Gd 4d peak position by about 1 eV towards a higher binding energy is observed for GdCo1.8Al0.2, which can be attributed to the charge transfer from Gd to neighbouring atoms.
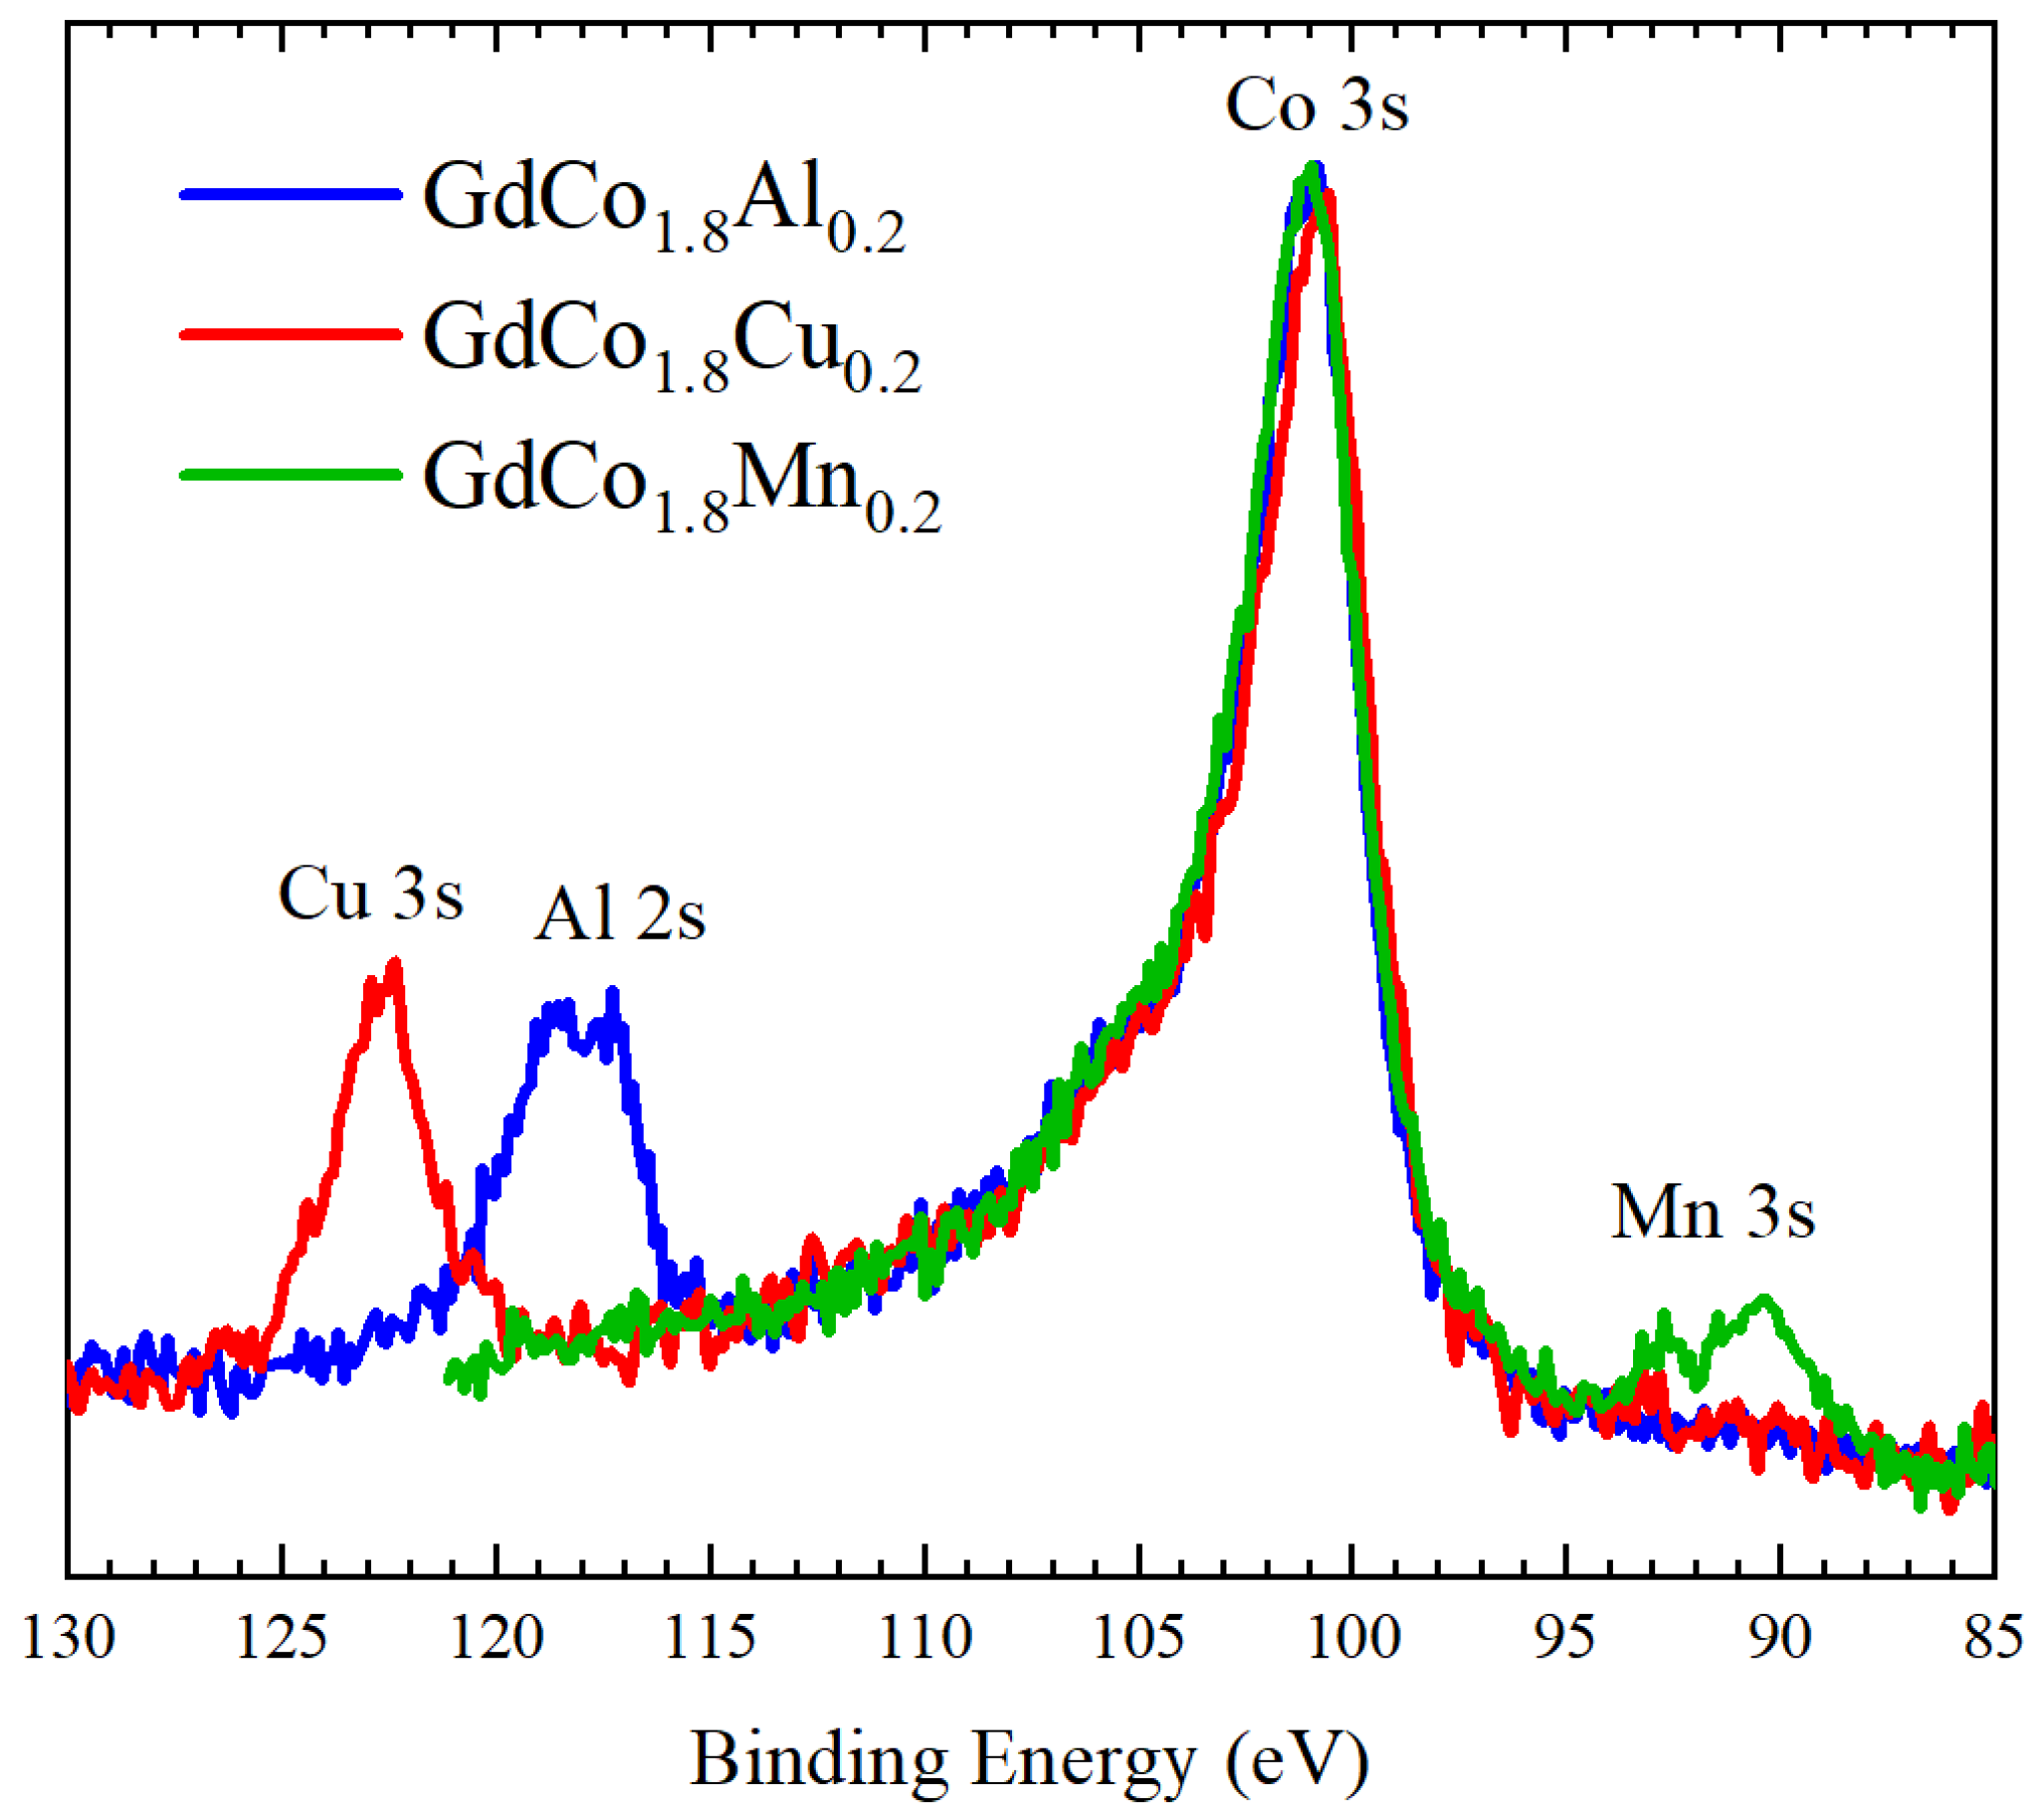
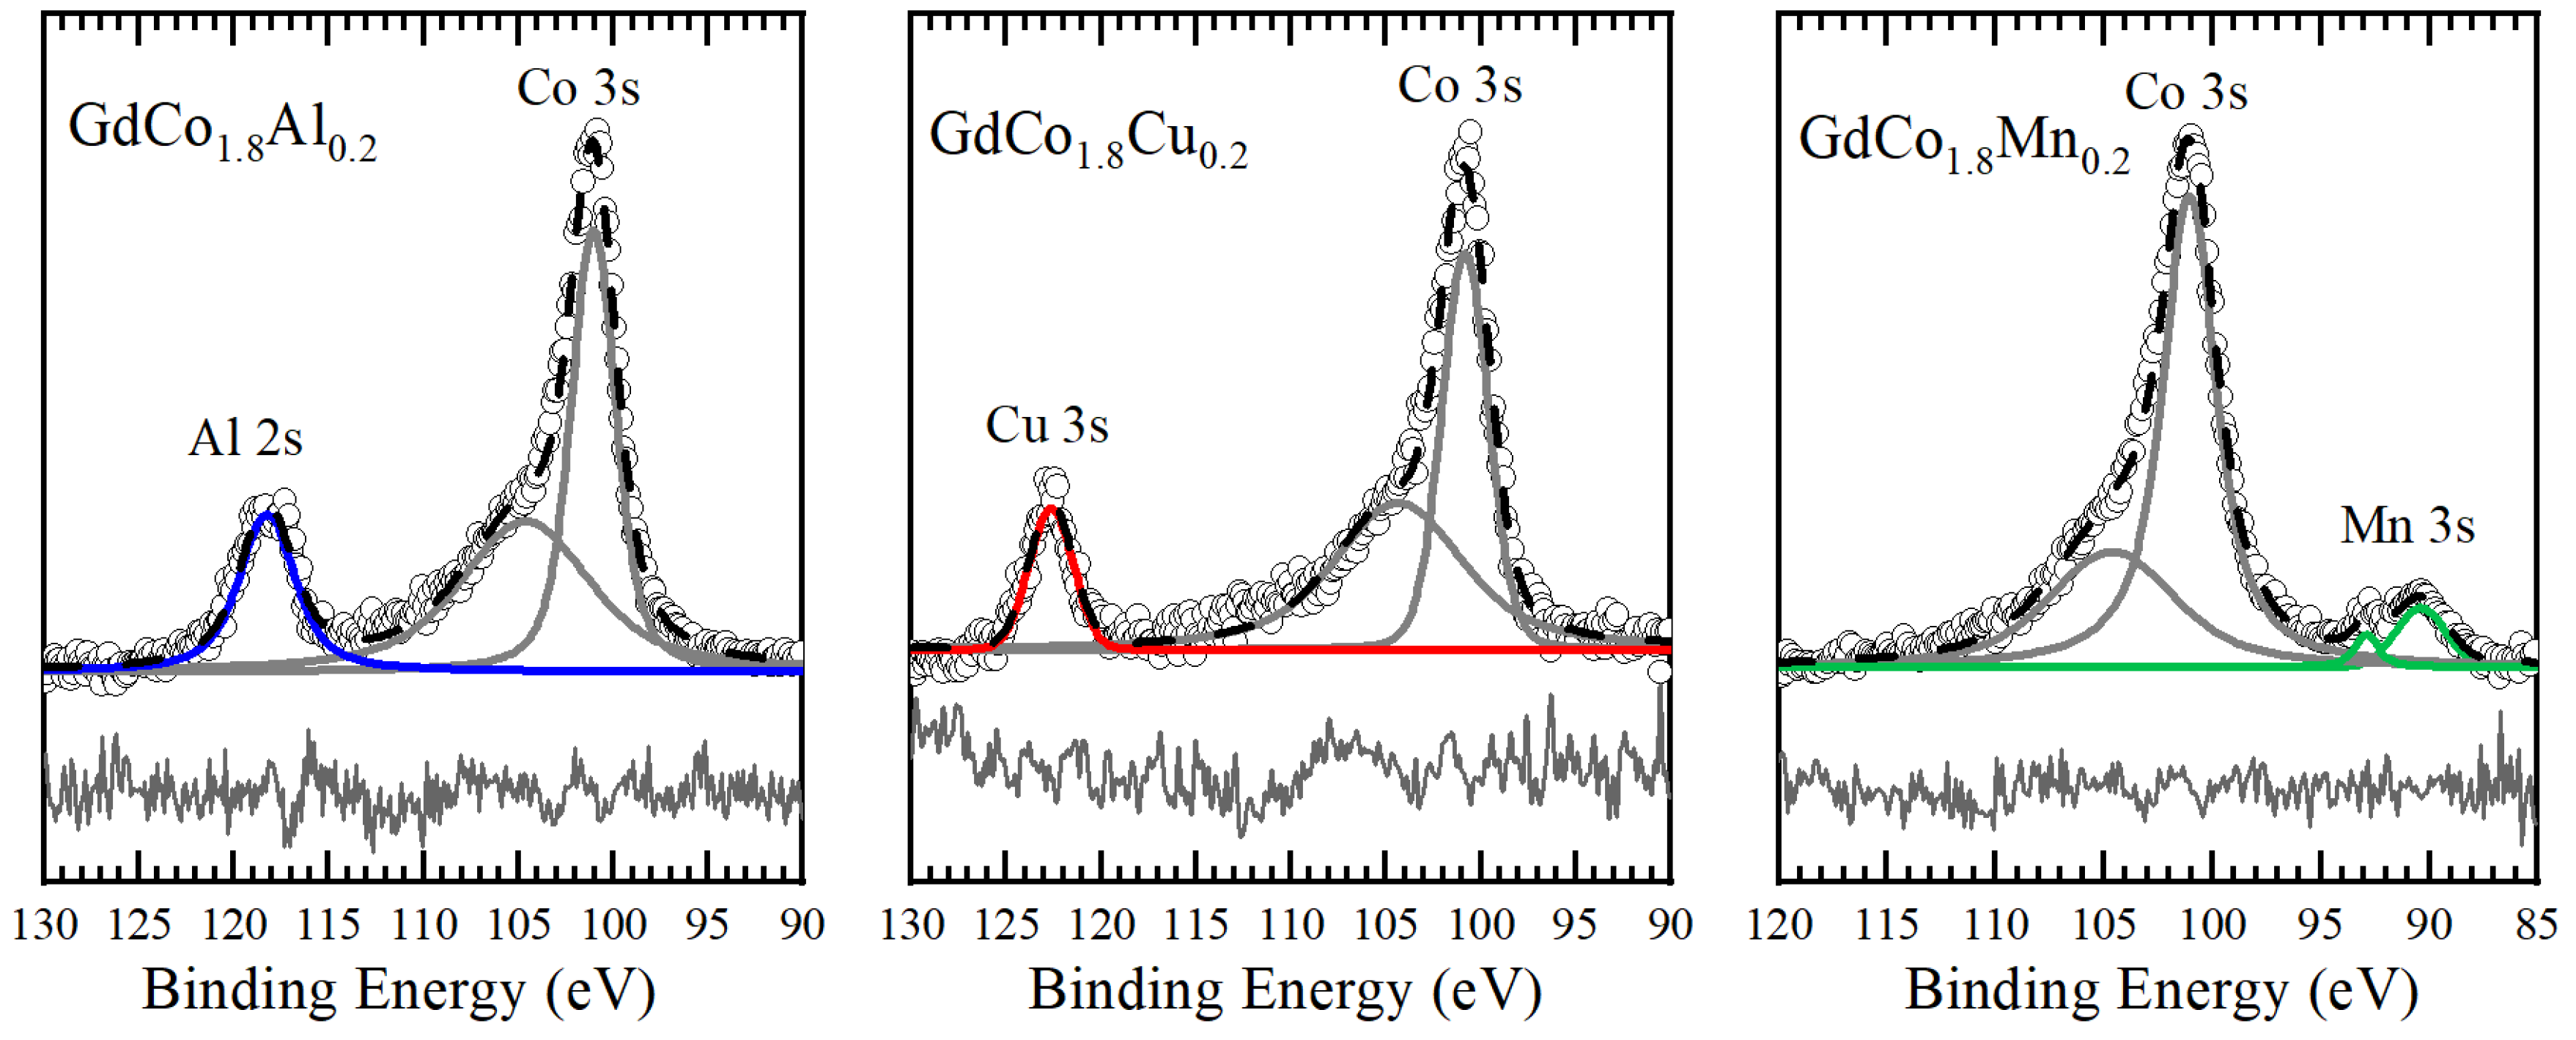
The line-shape analysis of the XPS spectra in the 85 eV to 130 eV binding energy region, shown in Figure 11, reveals the exchange splitting of both the Co 3s and Mn 3s core levels, which is direct evidence of the local magnetic moments on both the Co and Mn sites. The Al 2s states in GdCo1.8Al0.2 and the Cu 3s states in GdCo1.8Cu0.2 are located at higher binding energies, at 118.2 eV and 122.6 eV, respectively. The exchange splitting of the Co 3s core level was evaluated by fitting the XPS spectra in the 85 eV to 130 eV binding energy regions. We note that the Shirley type background, [44], was subtracted.
The fitting results are shown in Figure 12, while the binding energies of the Co 3s fitted components and the mean energy separation between the S + 1/2 and S − 1/2 total spin states, which correspond to the exchange splitting of the Co 3s core-hole states, are presented in Table 2. An exchange splitting around 2.7 eV was found from the Mn 3s core-level spectrum of the GdCo1.8Mn0.2 sample. Having in mind that a magnetic moment of 4 µB/Mn produces an exchange splitting of 5.2 eV in a MnNi compound [45], a magnetic moment of about 2 µB/Mn was calculated in this sample.
An exchange splitting of about 3.5 eV was obtained for all studied samples. The obtained value is smaller than that found in the pure Co metal, 4.5 eV, being in the same range as the values found for GdCo2−xNix compounds [31]. Using the obtained values for the exchange splitting ΔEex, and considering that these values are proportional with the Co local magnetic moment, a value of 1.3 µB was estimated for the Co ions in GdCo1.8M0.2 compounds with M = Al, Cu, Mn.
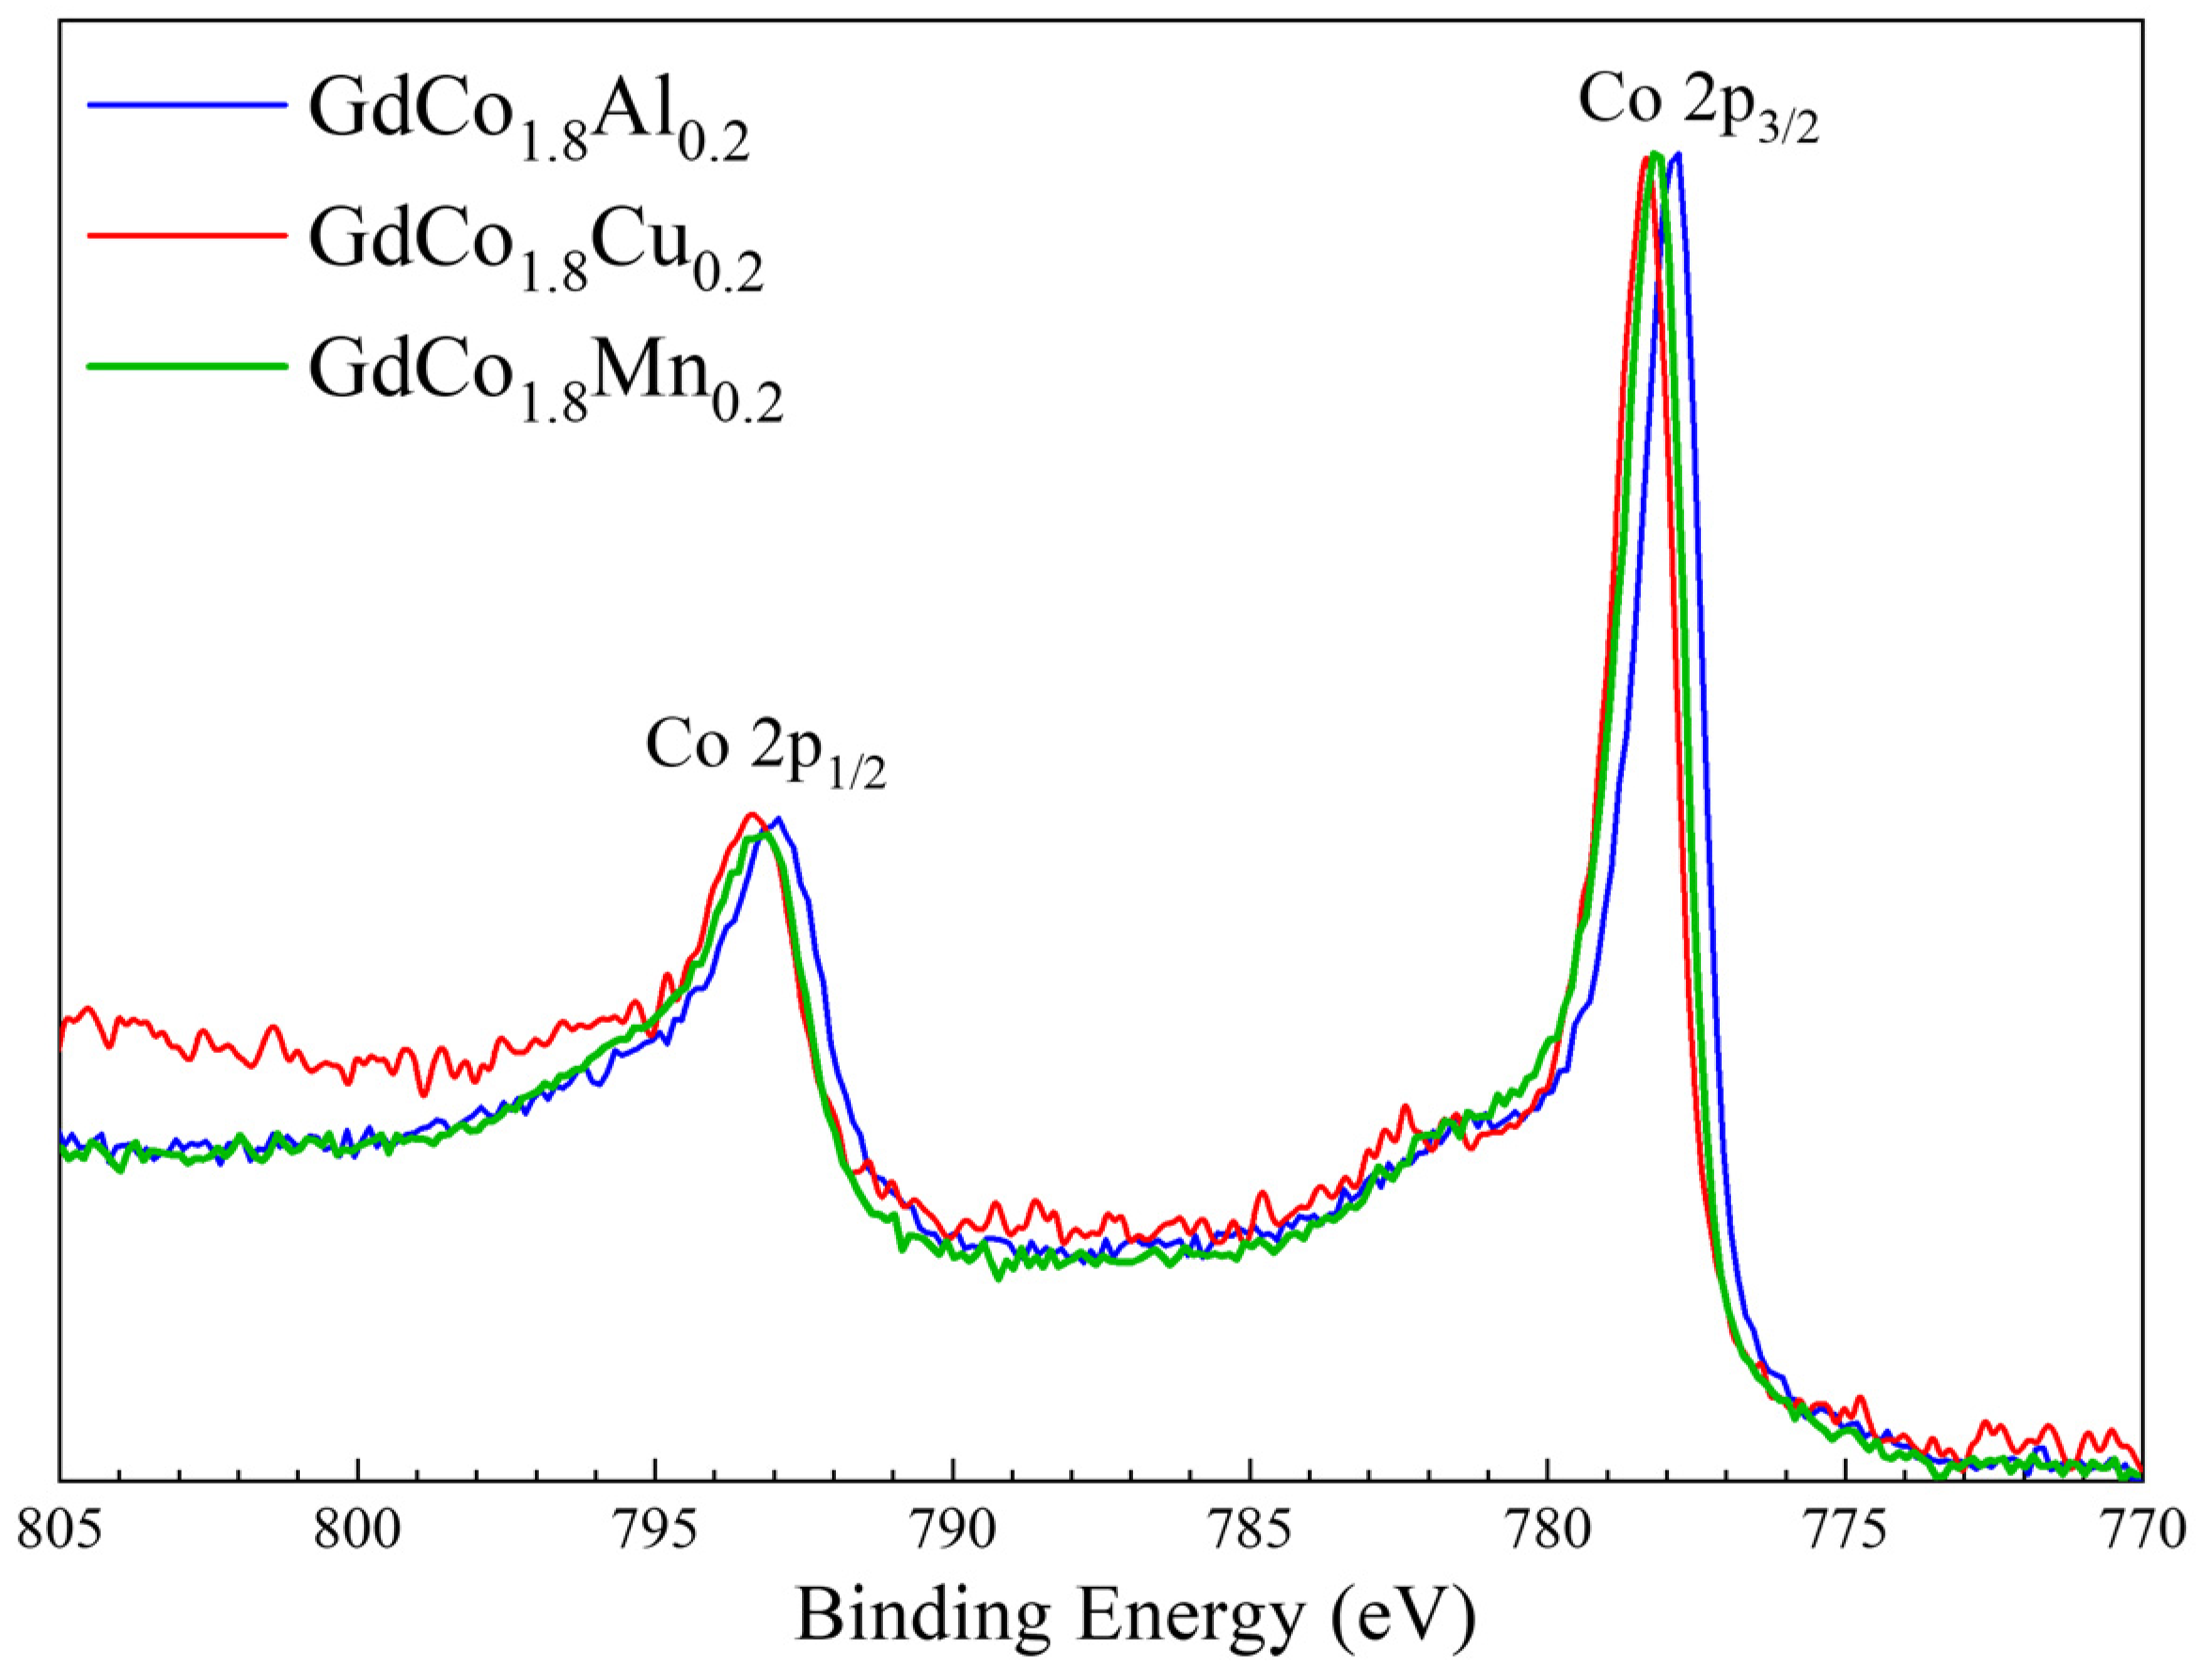
The Co 2p XPS core-level spectra of GdCo1.8M0.2, shown in Figure 13, are dominated by the 2p3/2 and 2p1/2 states resulting from spin–orbit splitting, which are accompanied by broad satellite features at higher binding energies. The observed spin–orbit splitting, which can be found by measuring the distance between the two centres of the 2p3/2 and 2p1/2 states, is ~15 eV. Like for GdCo2−xNix compounds, the presence of the satellite lines may be explained by considering the admixture of 3dn configurations in the ground state and the recoupling of the 3d valence shell (spin flips). The shift to the lower binding energies of the Co 2p core-level spectra of GdCo1.8Al0.2 may be due to the charge transfer from Gd to the neighbouring Co atoms.

3.4. Magnetic Properties of GdCo2−xMnx Intermetallic Compounds

Magnetization as a function of temperature in a small applied magnetic field of 0.05 T was registered for the investigated samples in order to calculate the transition temperature as the minima in the first derivative of magnetization dM/dT vs. temperature. The results are presented in Figure 14. All the studied samples underwent a ferrimagnetic–paramagnetic transition at the Curie temperatures. No other transition can be seen in this temperature range. The sample with the Cu dopant element has a smooth transition compared to the Al and Mn samples, which have a sudden transition from the magnetic ordered state to the paramagnetic one. The calculated Curie temperatures were determined as the minimum values of the first derivative of magnetization as a function of temperature, plotted in the Figure 14 inset. The obtained values were 378 K for the sample doped with copper, 382 K for the aluminium one, and 453 K for the manganese sample. The Curie temperature depends on the R-R, R-M, and M-M exchange interactions. In our case, the R-R exchange interactions were the weakest, being of the RKKY type and occurring between the Gd 4f electrons. The R-M interactions are determined by the R5d polarized shell and M3d shells and are of intermediate strength [46]. The M-M exchange interactions are the strongest ones, are direct and determined by M3d-M3d shells, and have the main contribution to the Curie temperatures. The interatomic distances and the type and number of the nearest atoms are very important. The substitution of Co with nonmagnetic Cu or Al decreases the effective number of the nearest magnetic neighbours and decreases the transition temperatures compared with the GdCo2 compound. On the other hand, the magnetic moment of Mn is higher (more than double) than the Co one and consequently the 3d transition metal exchange interaction is much stronger, being reflected on the highest value of the Curie temperature for this sample.
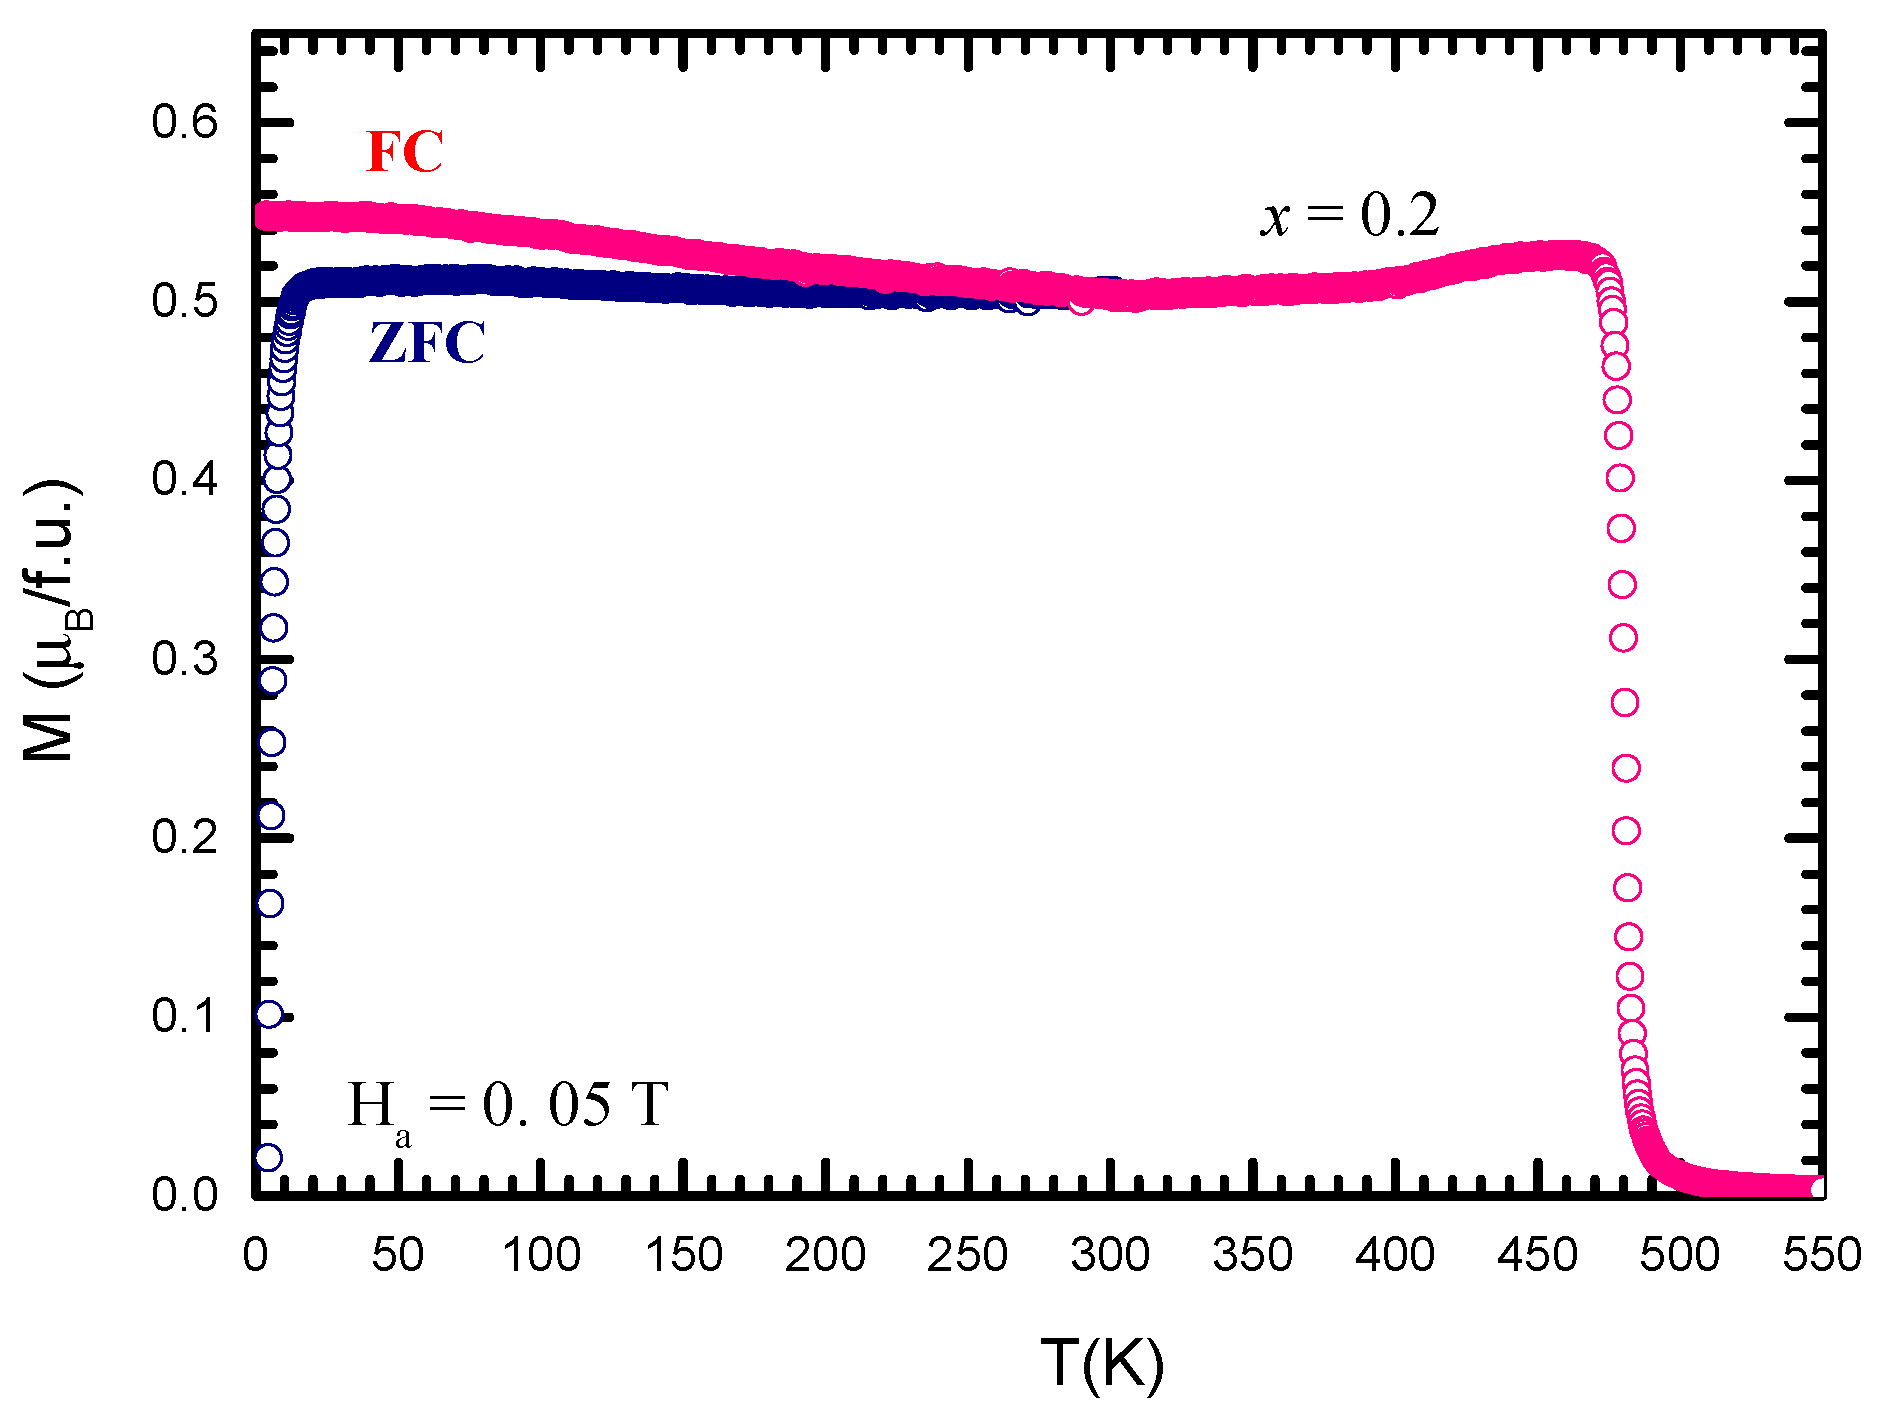
The Zero Field-Cooled (ZFC)–Field Cooled (FC) magnetization curves, measured in a small external magnetic field of 0.05 T, are presented in Figure 15. The bifurcation of the ZFC and FC magnetization curves below 270 K is a signature of spin glass-like behaviour. The appearance of spin glass-like features in our sample can be attributed to the existence of the random distribution of the magnetic ions or to the magnetocrystalline anisotropy which is connected to the magnitude of coercivity at low temperature. The overlapping of the ZFC and FC magnetization curves after 270 K is followed by a second-order ferrimagnetic–paramagnetic phase transition at 450 K. Similar behaviour was found in the case of the compounds with Cu and Al.
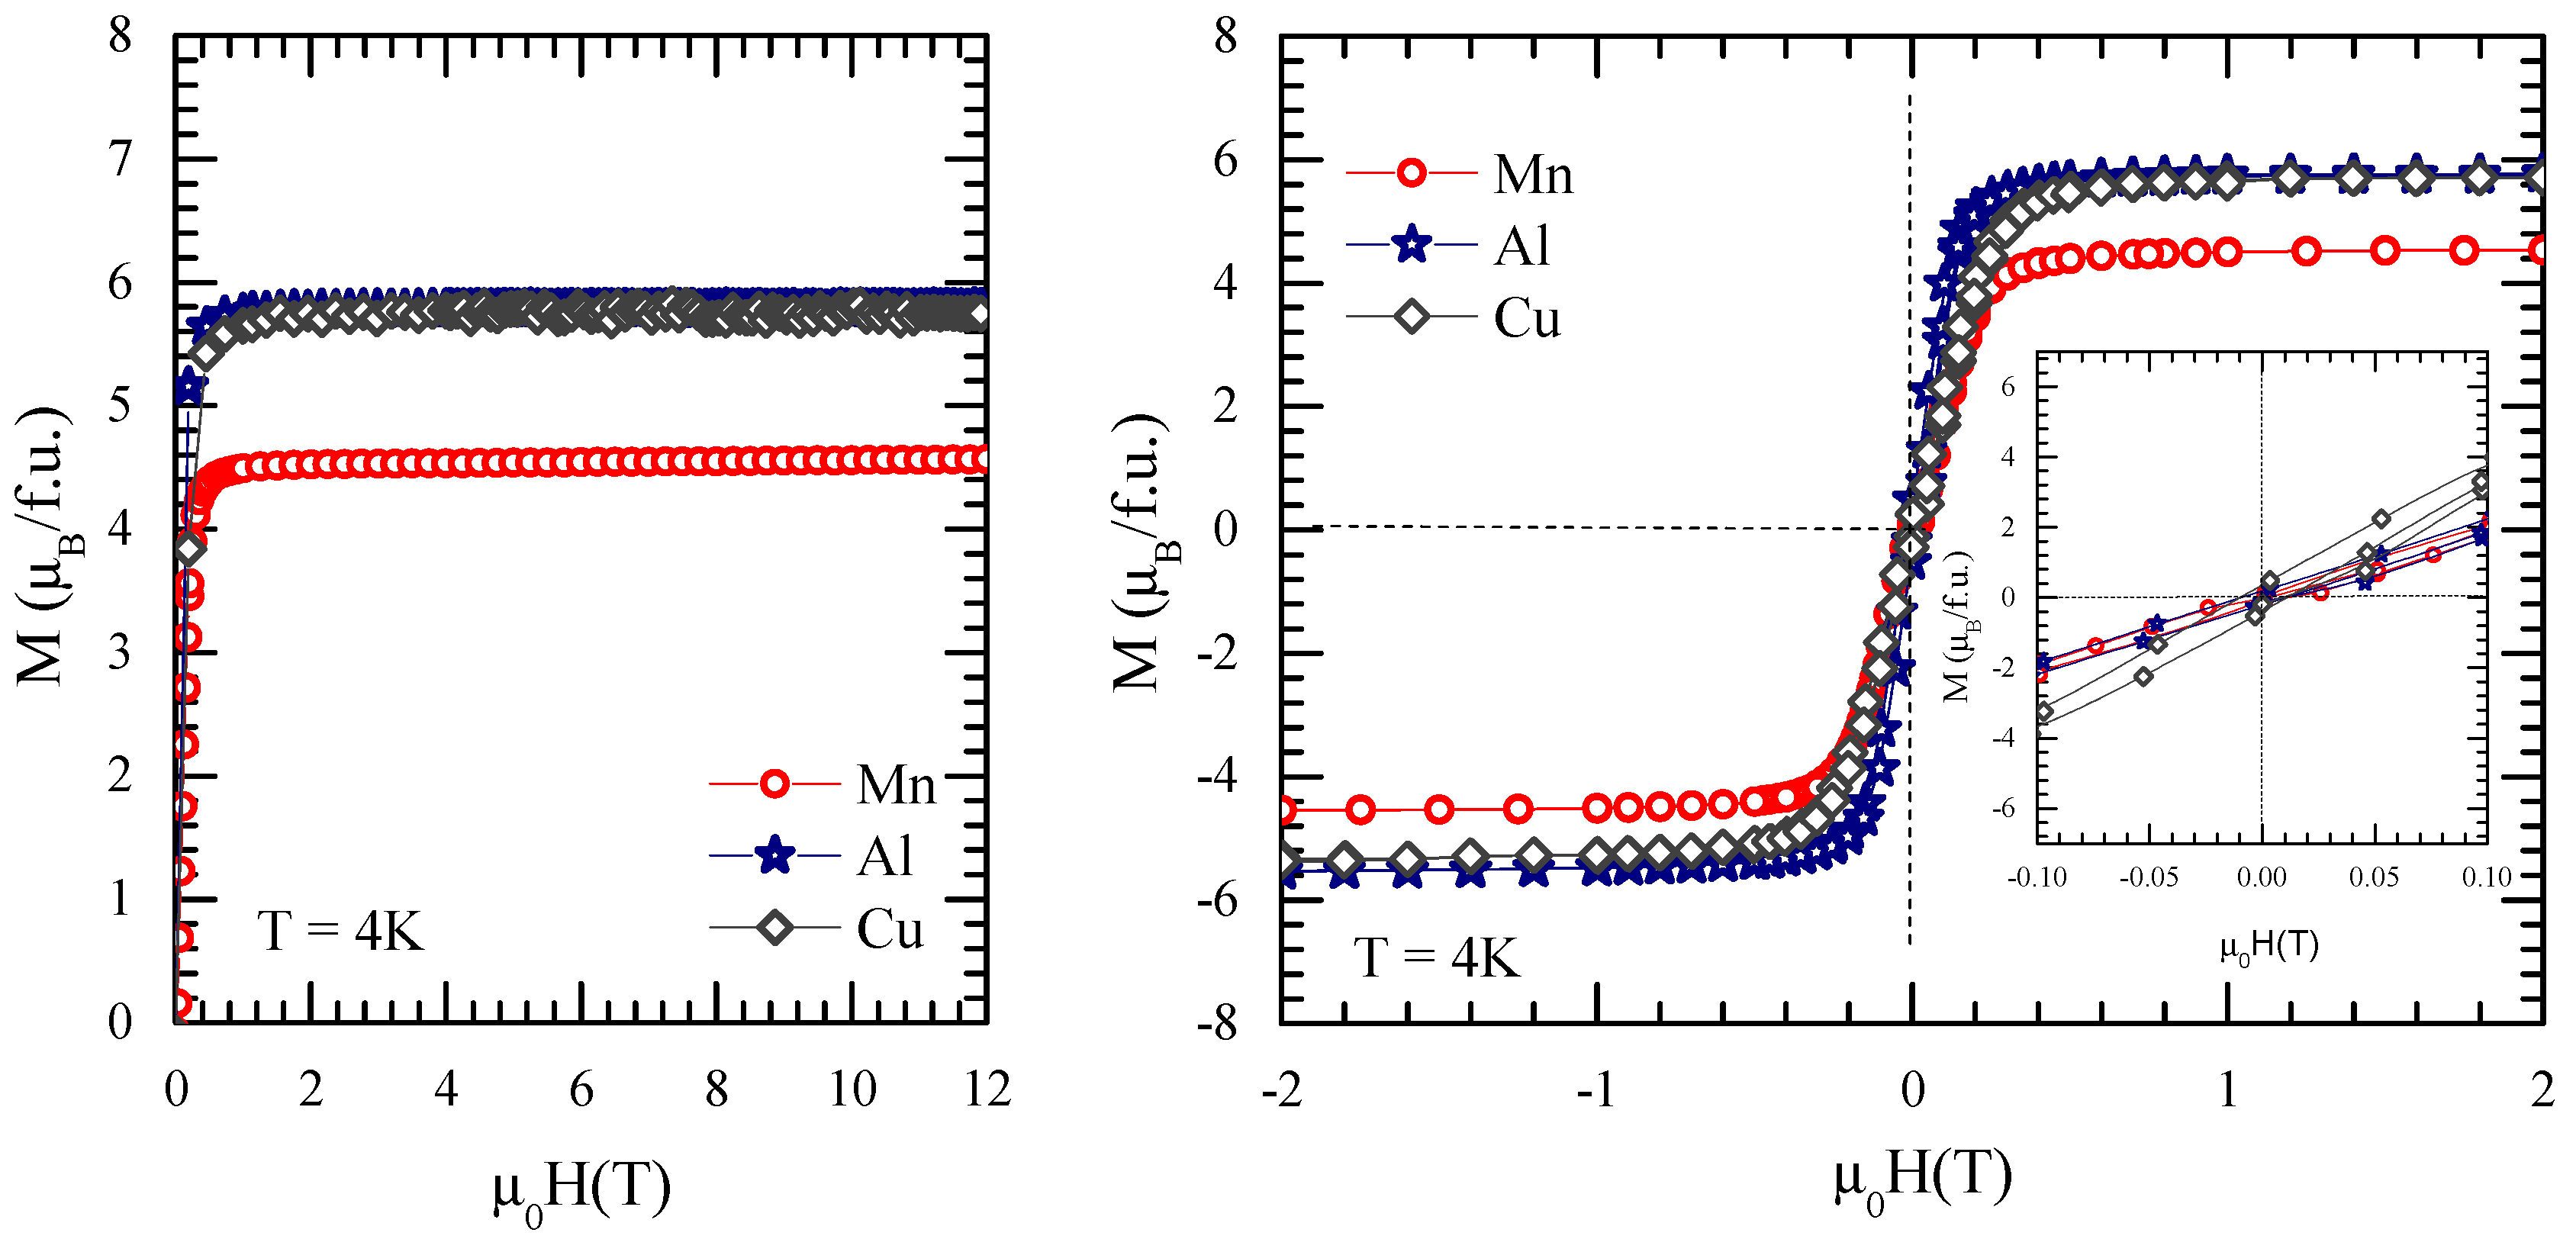
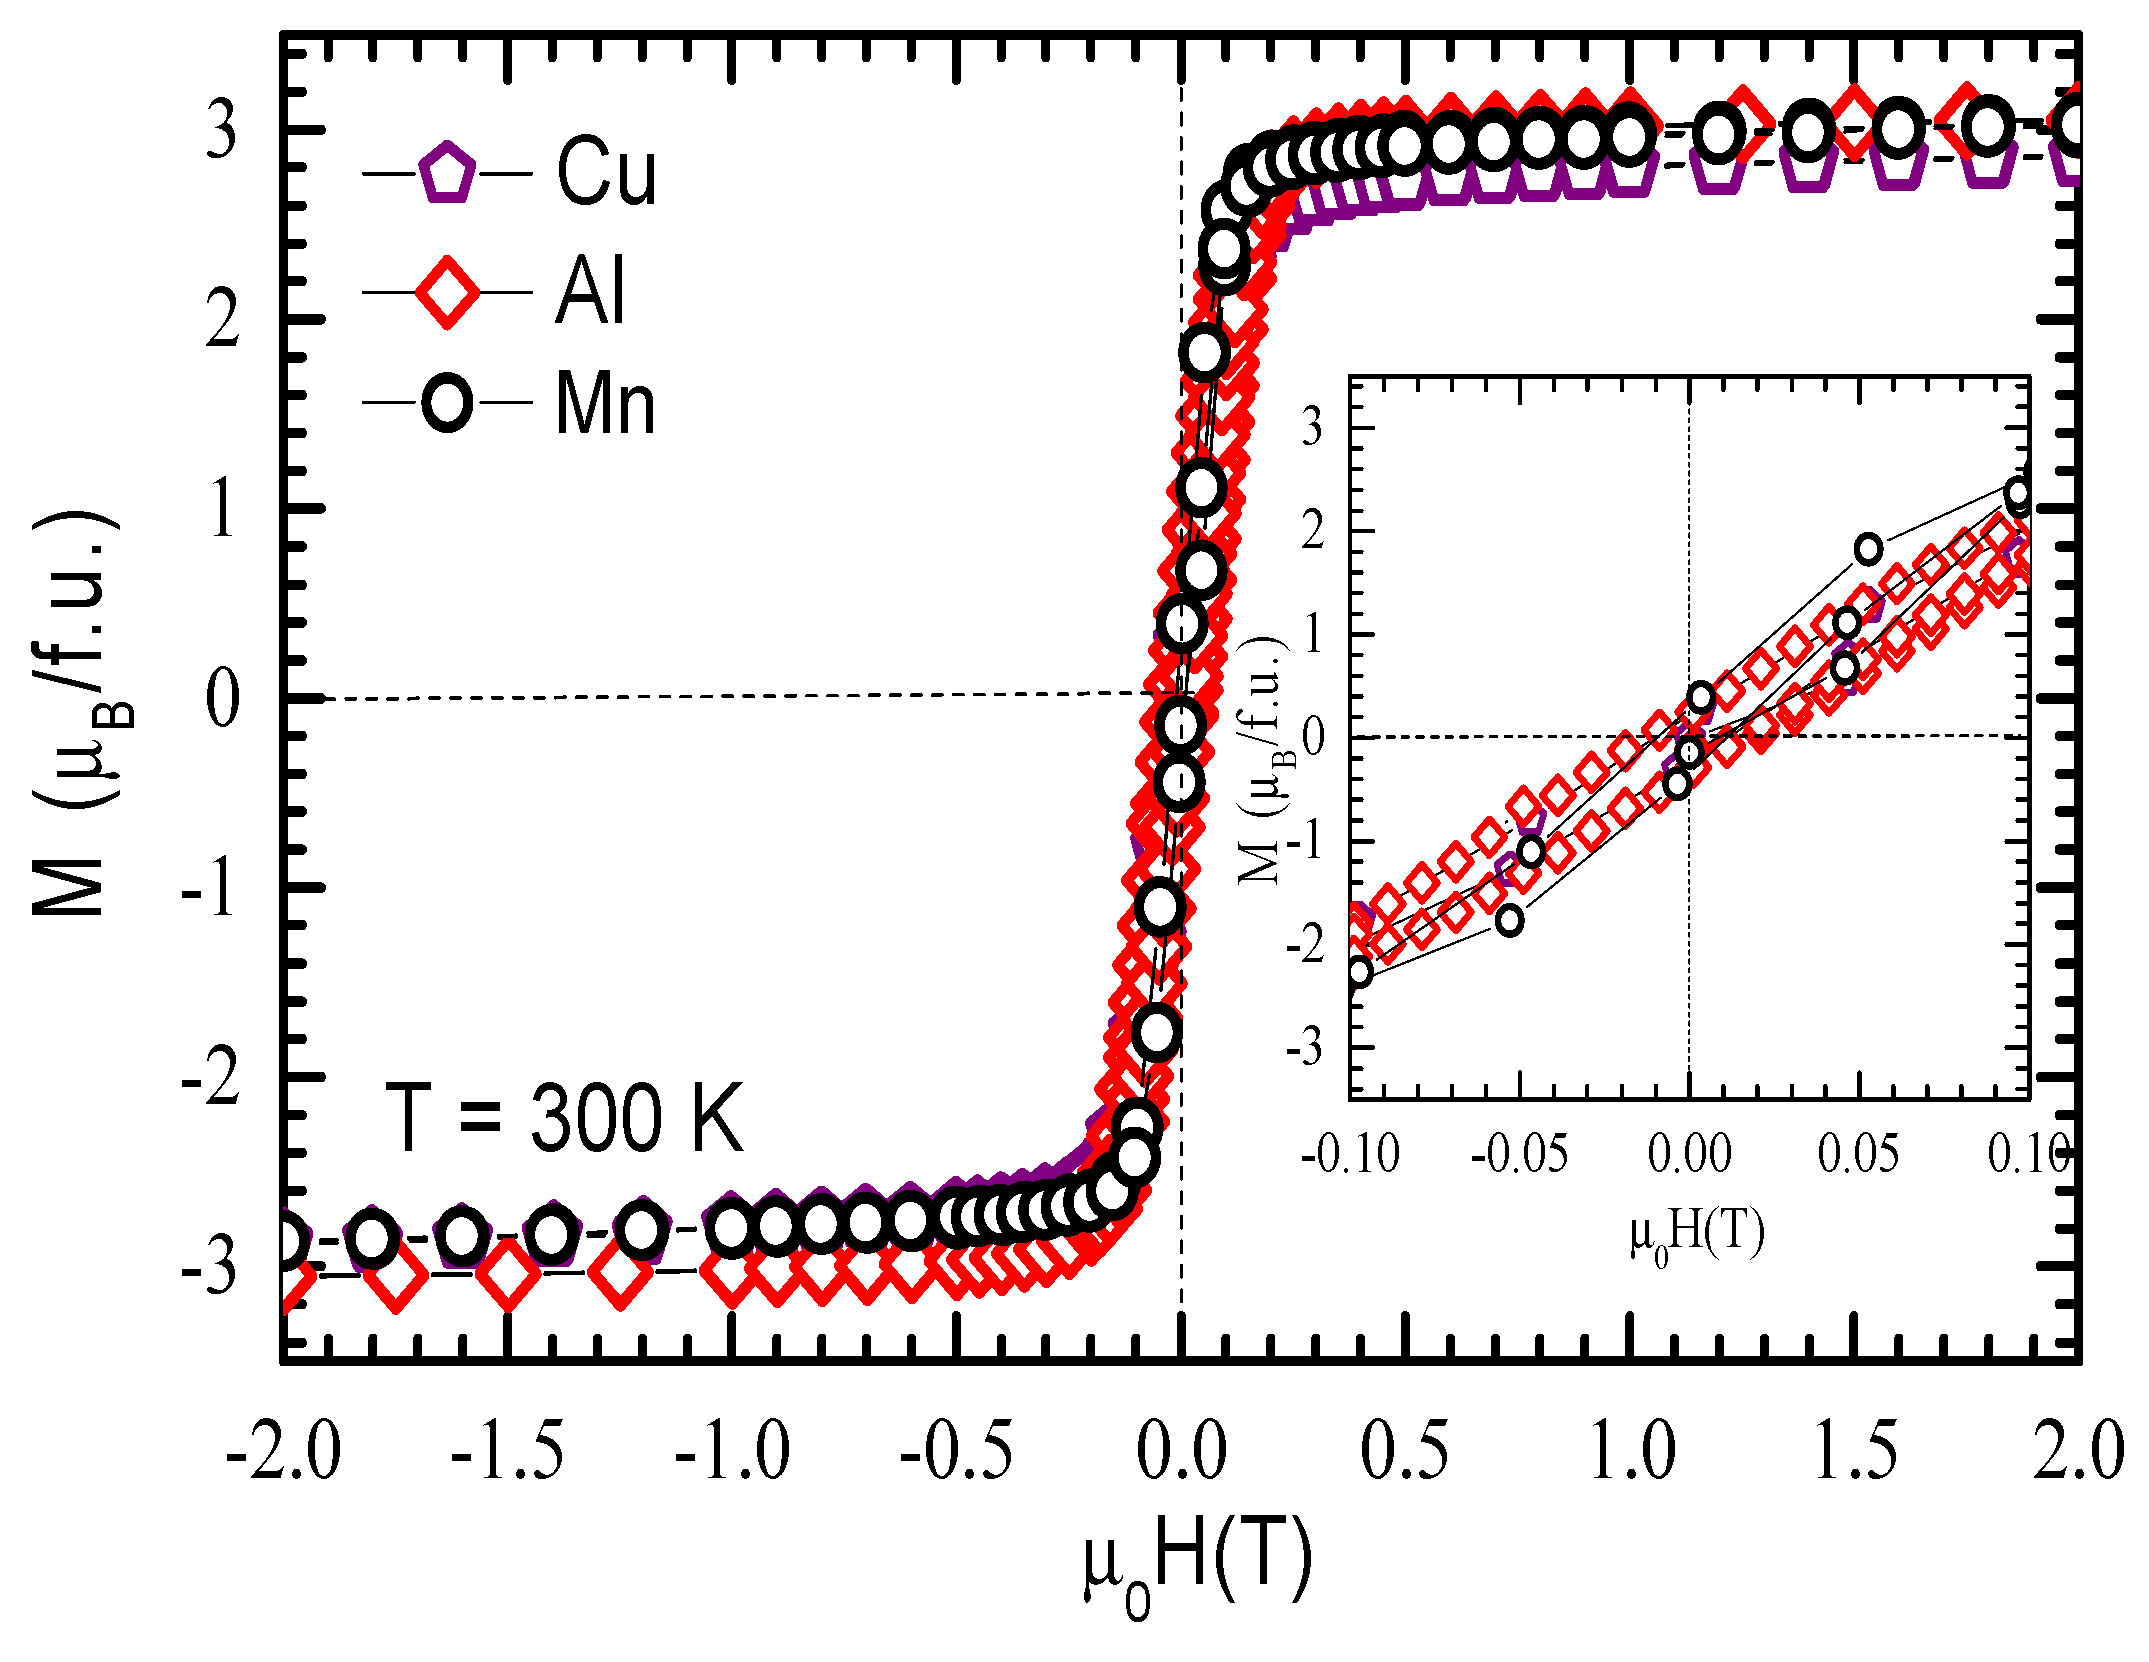
From magnetization isotherms measured at 4 K in the external applied magnetic field up to 12 T, saturation magnetization was calculated. From Figure 16, which illustrates the measured data, it can be observed that saturation was already reached at 1.5 T for all samples and the saturation magnetizations have very appropriate values, 5.75 µB/f.u. for the copper sample and 5.78 µB/f.u. for the aluminium sample, while for the sample with Mn a value of 4.52 µB/f.u. was obtained. The obtained values are lower than the Gd magnetic moment and confirm the ferrimagnetic ordering in these compounds. The saturation magnetization values are higher for the Cu- and Al-doped samples compared with the undoped one and can be explained by the magnetic dilution due to the presence of nonmagnetic Cu and Al atoms. In the case of the Mn-doped sample, the saturation magnetization is lower than that of the parent compound and this decrease is attributed to the higher magnetic moments of Mn compared with Co (which are parallelly oriented). Considering that the computed magnetic moments of Gd, Cu, Al, and Mn are not affected by changes in the neighbouring atoms, and considering the antiparallel alignment of the Gd, Co, Cu, Al, and Mn magnetic moments, the cobalt magnetic moment was calculated and is presented in Table 3. The lowest values of the Co magnetic moment compared with the undoped sample in the cases of the Cu and Al dopants could be attributed to the weakening 3d-3d exchange interactions due to substitution with almost nonmagnetic Cu or Al. On the other hand, the increase in the Co magnetic moment in the Mn-doped sample is attributed to the increase in the 3d-3d exchange interactions due to the presence of manganese atoms with higher magnetic moments. The magnetic hysteresis curves measured at 4 K between −2 T and 2 T are presented in Figure 16. One can see a very low coercive field, around 0.01 T for M = Mn and 0.005 T for M = Cu or Al, showing that the magnetocrystalline anisotropy is very small—see the inset of the right-hand figure. The magnetic hysteresis loops registered at 300 K measured in external magnetic fields between −2 T and 2 T are presented in Figure 17.
The coercive field is very small at 300 K, too, which is an advantage when using these materials for magnetic refrigeration with high efficiency.
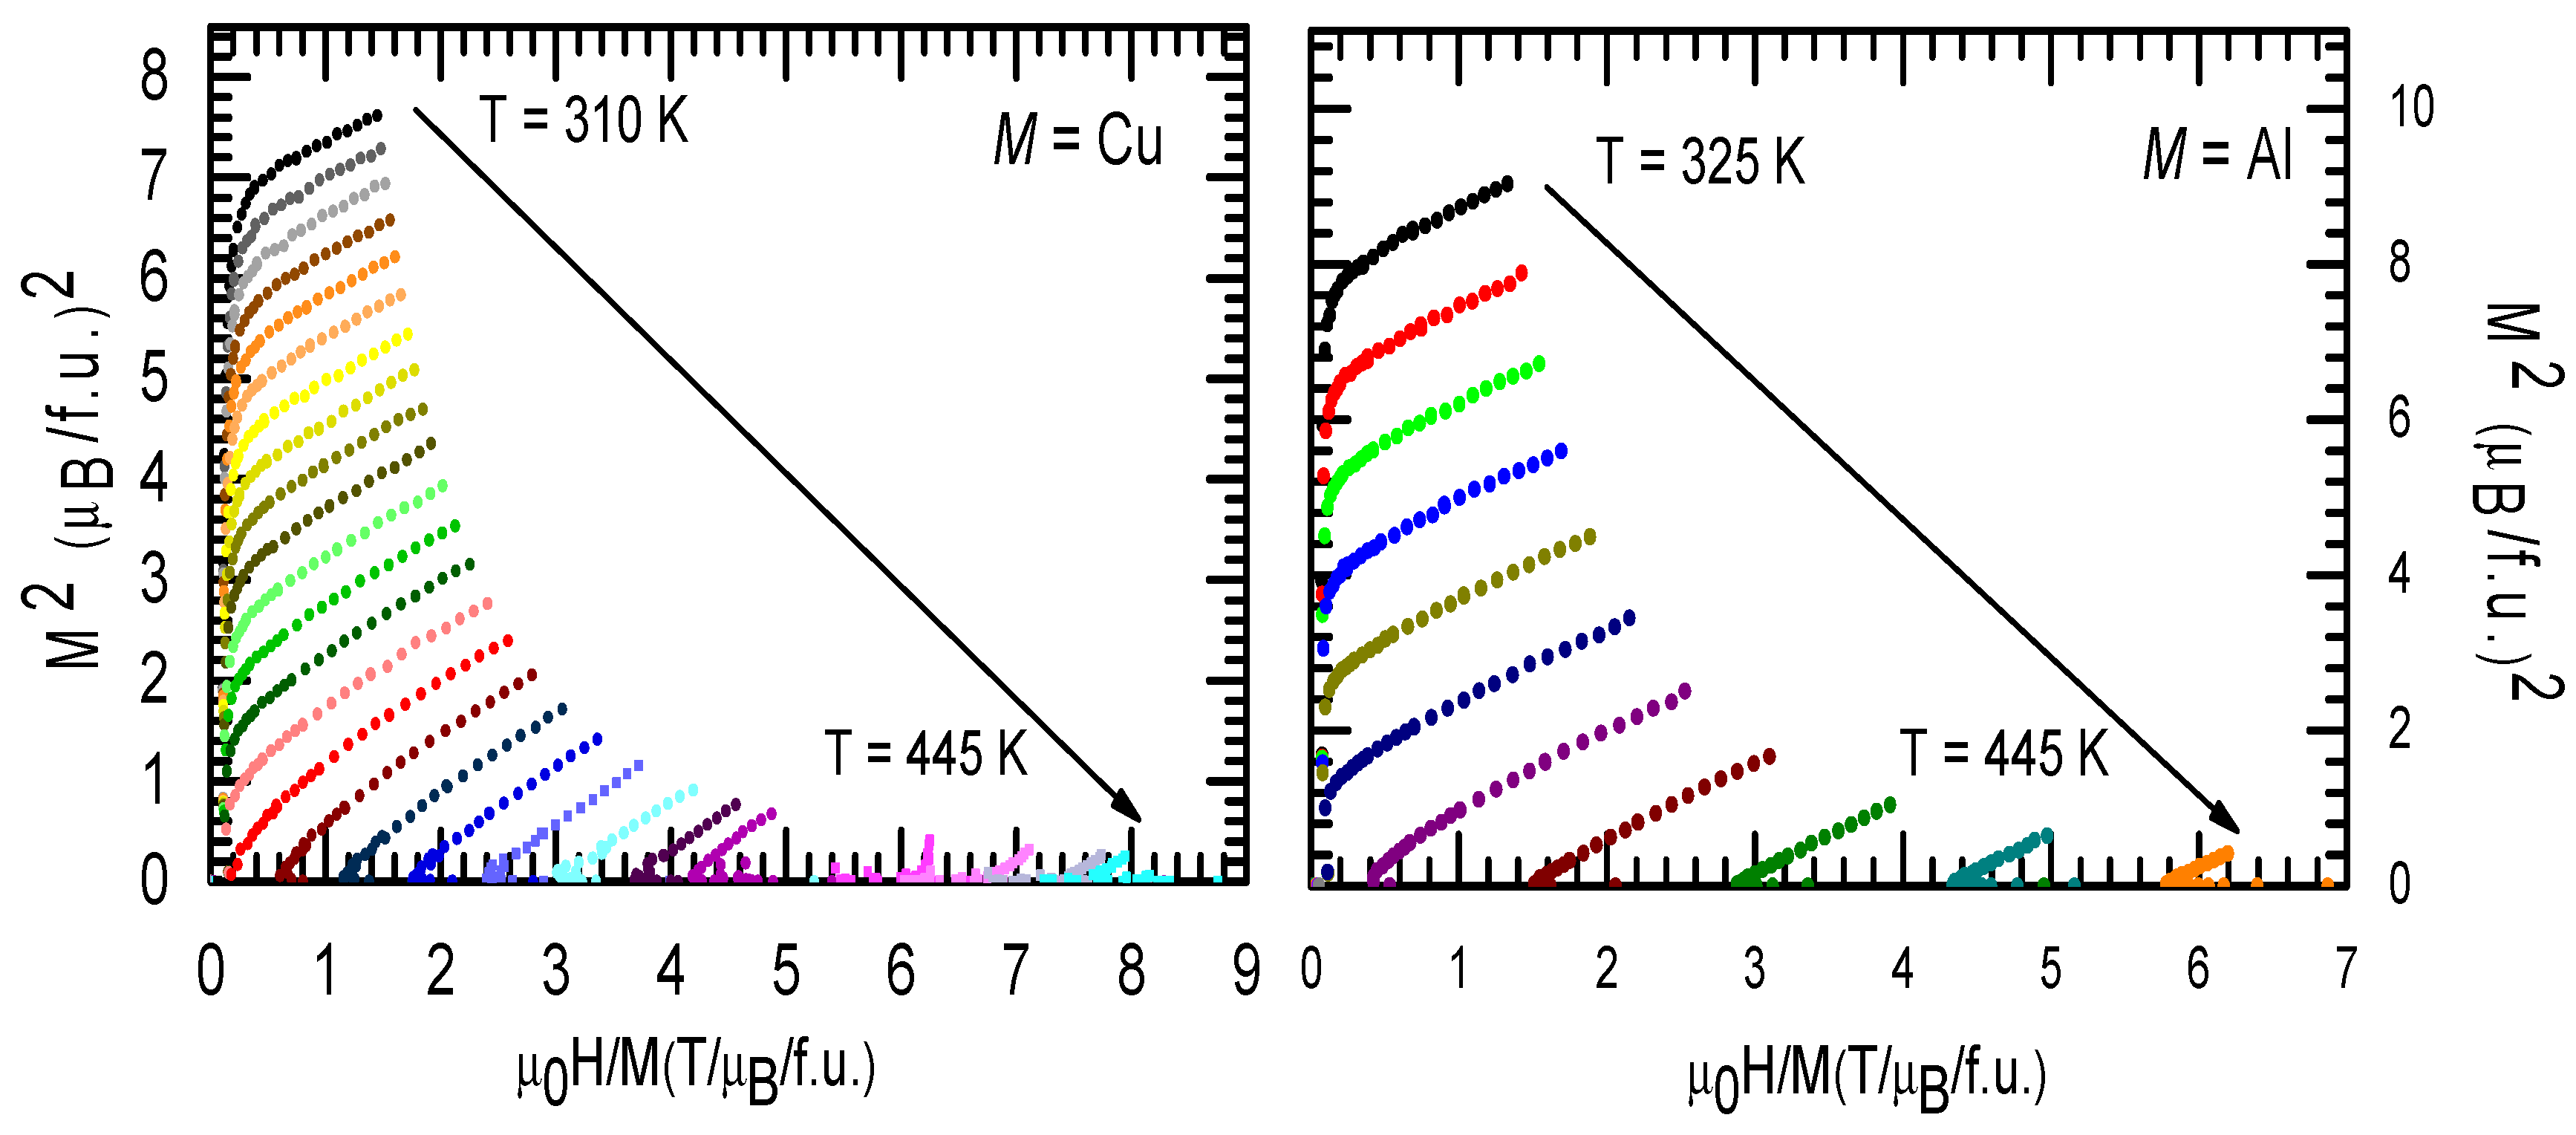
The Arrott–Belov plots illustrated in Figure 18 for the GdCo1.8Cu0.2 and GdCo1.8Al0.2 compounds have the features typical of second-order magnetic phase transitions at the Curie point. The Arrott plots were calculated from the magnetization isotherms in the temperature range 310–445 K. As can be noticed, the curves are similar for both samples, exhibiting no inflexion points near TC, which means that the phase transition is of the second order. In order to prove the type of transition, we calculated the Landau coefficients a(T) and b(T) [47]. The sign of the a coefficient changes the sign from negative to positive at the transition temperature, while the sign of the b coefficient shows the type of the transition. The transition is of the first order if the b sign is negative and is of the second order if the sign of b is positive or zero. The temperature dependences of the Landau a and b coefficients for the studied samples are presented in Figure 19. One can see that the a coefficient changes the sign at the Tc and the b coefficient is positive, having extreme points at the transition temperatures for the studied samples. These values of the b coefficient confirm that the transition is of a second-order type.
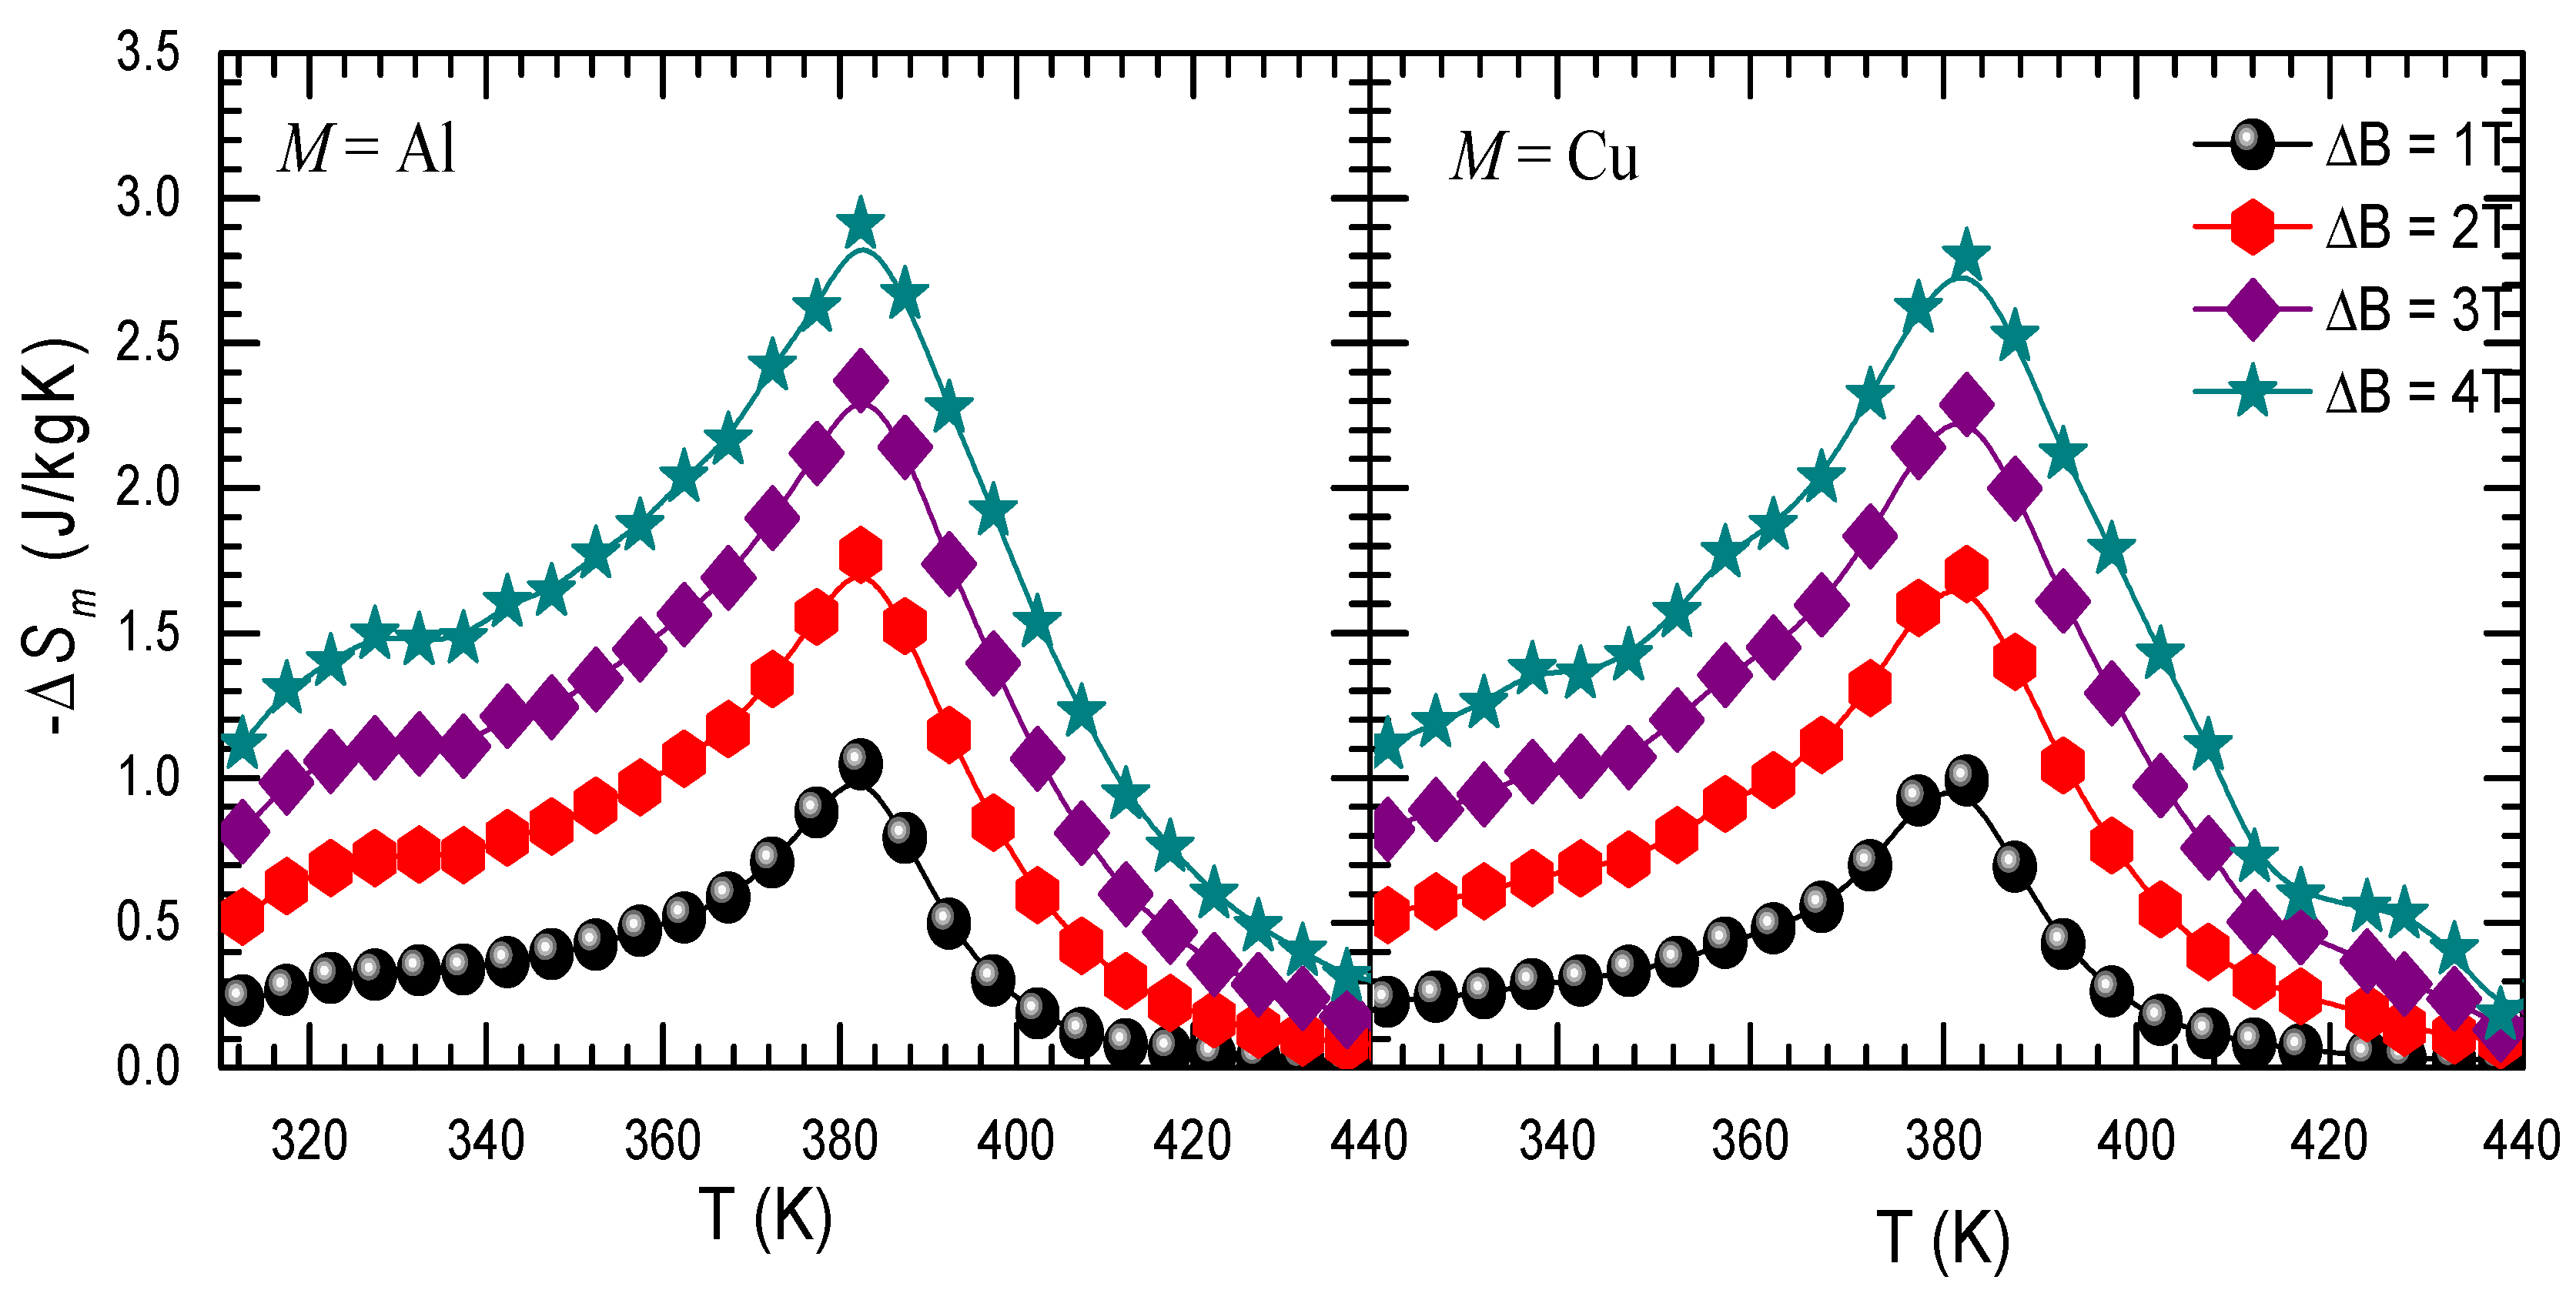
The magnetic entropy changes were calculated with relation (2) for the compounds with Cu and Al, from magnetization isotherms, measured with a step of 5 K, in the temperature range 320–440 K. The obtained data are presented as a function of temperature in Figure 20. The maximum value of magnetic entropy change is reached very close to the transition temperature for the GdCo1.8Cu0.2 sample, being 381 K, while for the GdCo1.8Al0.2 sample it is reached at the transition temperature of 382 K. As can be observed, the │ΔSM│ peaks depend on the external magnetic field variation, with the maximum values decreasing when the magnetic field variation is reduced from 4 T to 1 T. In the cases of the samples with Cu or Al, the maximum values of the magnetic entropy change are very close to each other, being around 3 J/KgK. The maximum values of the magnetic entropy changes in different external magnetic field variations are presented in Table 4. Similar values of the magnetic entropy changes were obtained on other Laves phase compounds. As an example, it was reported that the magnetic entropy change decreased with increasing Al concentration in GdCo2−xAlx (x ≤ 0.4) compounds from 2.31 to 1.41 J/kgK, measured in ΔB = 1.5 T [48]. Smaller values of 1.06–0.72 J/kgK were obtained in the case of Gd(Co1−xFex)2 for x ≤ 0.6 for a field variation of 1.7 T [49]. In the case of Gd(Co1−xMnx)2 compounds, the maximal value was reported to be 4.11 J/kgT for a sample with x = 1.8 in a field variation of 5 T [50]. In all these compounds, the transitions were of the second order. On the other hand, much larger values were reported for compounds which underwent a first-order phase transition. As an example, in the case of a quenched Fe49Rh51 alloy a value of 15.33 J/kgK measured in a field variation of 1.95 T was reported. From this value, 40% was due to electronic entropy [51]. Even if these values are much larger than in Laves-phase compounds, the practical application of Fe-Rh compounds is still far away due to the costs of Rh, at 151 USD/g compared with 9 USD/for Gd.
The │ΔSM│ curves are approximately symmetric around the temperature of the maximum values, confirming that the phase transition for our investigated samples is of the second-order type. It was shown that the field dependence of the magnetic entropy changes in the case of materials exhibiting a second-order transition follows a master curve ΔSMBn where n = 0.75 for T = TC and n = 2 in the paramagnetic region [52]. In the case of a magnetic field changing from a value to the half of it, the maximum entropy change corresponding to a magnetic field variation from 0 to B and from 0 to B/2, n, has a value of 0.59. The calculated n values for our samples, for field variations between 0 and 2 T and 0 and 4 T, were 0.605 for the compound with Cu and 0.609 for the compound with Al, which were very close to the reported master curve.
A better parameter for the characterization of magnetocaloric materials is the relative cooling power, RCP, which was calculated using relation (2). Larger RCP values correspond to a superior magnetocaloric material [12]. The broadening of │ΔSM│ peaks has a significant contribution to the RCP(S) values; see Table 5. The specific renormalized cooling power RCP(S)/ΔB is another characteristic parameter which allows researchers to compare the magnetocaloric properties of different materials relative to the external field variation. The normalized RCP with an applied magnetic field—RCP(S)/ΔB was calculated for both samples in order to have more accurate data and is presented in Table 5. The RCP(S)/ΔB values are higher in the case of compounds with Al and decrease slowly when the field variation decreases. The obtained values for normalized RCP are close to other materials, making them suitable candidates for magnetic refrigerator materials. As an example, values of around 24 J/kgT were reported for Gd(Co1.−xFex)2 compounds [49], 54 J/kgT in the case of GdCo2.−xNix [31] and 60 J/kgT for Gd(Co1.−xMnx)2 [50], very close to our results.

4. Conclusions

The band structure, magnetic properties, and magnetocaloric effect of GdCo1.8M0.2 with M = Fe, Mn, Cu, and Al were investigated. The samples were prepared by an induction melting technique and all of them were single-phase with a cubic MgCu2–Laves-type structure, as revealed by X-ray diffraction measurements.
The band structure calculations that we have performed within the full potential linearized augmented plane-wave method allowed us to extract key theoretical issues concerning the magnetic and electronic properties for GdCo1.8M0.2 compounds (M = Mn, Fe, Co, Ni, Cu, Al). First, we demonstrated that the ground state of all the system was ferrimagnetic, with antiparallel magnetic moments for Gd and Co or the other magnetic substitutional elements. Then, for each compound, we determined the magnetic moment of individual Gd, Co, and M atoms, demonstrating within a fully relativistic spin–orbit framework the dominant spin contribution to the total moment. Moreover, we analyzed the variation in the total moment/unit cell, the variation in the average Co moment, and the variation in the average substitutional element M moment with respect to the atomic Z number of the substitutional element. The calculated variation is not simply related to a rigid band shift upwards or downwards, depending on the atomic number of M with respect to that of Co, but is strongly influenced by hybridisation mechanisms. A detailed analysis of the orbital projected local density of states clearly illustrates that, qualitatively and quantitatively, the Gd, Co, and M magnetic moments are also controlled by covalent magnetism complex features determined by the hybridisation between the d states of Gd and Co (or M), in the case of transition metal substitutions, and between the Co and the neighbouring substitutional atoms. These theoretical calculations are in very good agreement with the data from the experiments.
The valence band spectra of GdCo1.8M0.2 compounds are dominated by the Co 3d states and show no significant differences at the Fermi level for the investigated samples. The core-level XPS spectra are characteristic for Gd-type intermetallic compounds. The Co 3s XPS spectra are very similar for the investigated compounds and show an exchange splitting arising from the exchange interactions between the core hole and open 3d shell. The average local Co magnetic moment is estimated at about 1.3 µB in GdCo1.8M0.2 with M = Mn, Cu, and Al. For GdCo1.8Mn0.2, the exchange splitting of the Mn 3s core-level spectrum indicates a magnetic moment of about 2.1 µB/Mn.
Magnetic measurements reveal that the substitution of Co with nonmagnetic Cu or Al decreases the effective number of the nearest magnetic neighbours and consequently decreases the transition temperatures compared with the GdCo2 compound. On the other hand, the magnetic moment of Mn is higher than the Co one. Consequently, the 3d transition metals’ exchange interactions are much stronger, being reflected at the highest value of the Curie temperature for this sample. The saturation magnetization values are higher for the Cu- and Al-doped samples compared with the undoped one. This can be explained by the magnetic dilution due to the presence of nonmagnetic Cu and Al atoms. In the case of the Mn-doped sample, the saturation magnetization is lower than the one of the parent compound. This decrease is attributed to the higher magnetic moments of Mn compared with the Co one.
The Arrott plots are characteristic for a second-order magnetic phase transition. This was confirmed by the values of the Landau coefficients. It was shown that the a coefficient changes the sign at TC and the b coefficient is positive, having extreme points at the transition temperatures for the studied samples. This confirms that the transition is of the second-order type. The magnetic entropy changes are nearly symmetric, as expected for a second-order-type transition. The specific renormalized cooling power RCP(S)/ΔB values are higher in the case of compounds with Al and decrease slowly when the field variation decreases. The obtained values for the normalized RCP are close to the values obtained for other Laves phase materials, having good properties for integration in magnetic refrigeration applications.

Author Contributions

Conceptualization, R.T. and C.T.; methodology, G.S., R.D., C.T. and R.T.; software, C.T.; validation, R.D., C.T. and R.T.; formal analysis, G.S. and R.D.; investigation, G.S., R.D. and K.K.; resources, R.T.; data curation, G.S., R.D., K.K. and C.T.; writing—original draft preparation, G.S., R.D., C.T. and R.T.; writing—review and editing, R.D., C.T. and R.T.; supervision, R.T.; funding acquisition, G.S. and R.T. All authors have read and agreed to the published version of the manuscript.

Funding

C.T. acknowledges funding from Project No. “MODESKY” ID PN-III-P4-ID- PCE-2020–0230, Grant No. UEFISCDI: PCE 245/02.11.2021.

Data Availability Statement

The data supporting the findings of this study are partially available within the article (e.g., tables and figures) and upon request.

Conflicts of Interest

The authors declare no conflicts of interest.

References

  1. Burzo, E.; Chelkowski, L.; Kirchmayr, H.R. Compounds between Rare Earth Elements and 3d, 4d, or 5d Elements, Landolt Börnstein Handbuch; Springer: Berlin, Germany, 1990; Volume 19. [Google Scholar] [CrossRef]
  2. Buschow, K.H.J. Intermetallic compounds of rare earth elements and Ni, Co, or Fe. Phys. Status Solidi A 1971, 7, 199. [Google Scholar] [CrossRef]
  3. Wallace, W.E.; Swearingen, J.T. Magnetic Characteristics of LaCo5-ThCo5 Pseudobinary System. J. Solid State Chem. 1973, 8, 37. [Google Scholar] [CrossRef]
  4. González, J.A.; Andrés, J.P.; López Antón, R. Applied Trends in Magnetic Rare Earth/Transition Metal Alloys and Multilayers. Sensors 2021, 21, 5615. [Google Scholar] [CrossRef] [PubMed]
  5. Bessais, L. Structure and Magnetic Properties of Intermetallic Rare-Earth-Transition-Metal Compounds: A Review. Materials 2022, 15, 201. [Google Scholar] [CrossRef] [PubMed]
  6. Gschneidner, K.A.; Eyring, L. Handbook on the Physics and Chemistry of Rare Earths; Elsevier: Amsterdam, The Netherlands, 2000; pp. 1–413. [Google Scholar]
  7. Gschneidner, K.A.; Pecharsky, V.K. Binary rare earth Laves phases—An overview. Z. Krist.-Cryst. Mater. 2006, 221, 375–381. [Google Scholar] [CrossRef]
  8. Wiesinger, G.; Hilscher, G. Magnetism of hydrides. In Handbook on Magnetic Materials; Buschow, K.-H.-J., Ed.; Elsevier: Amsterdam, The Netherlands, 2007; Chapter 5; pp. 293–456. [Google Scholar] [CrossRef]
  9. Buschow, K.H.J. Intermetallic compounds of rare-earth and 3d transition metals. Rep. Prog. Phys. 1977, 40, 1179–1256. [Google Scholar] [CrossRef]
  10. Stein, F.; Leineweber, A. Laves phases: A review of their functional and structural applications and an improved fundamental understanding of stability and properties. J. Mater. Sci. 2021, 56, 5321–5427. [Google Scholar] [CrossRef]
  11. Gutfleisch, O.; Willard, M.A.; Brück, E.; Chen, C.H.; Sankar, S.G.; Liu, J.P. Magnetic materials and devices for the 21st century: Stronger, lighter, and more energy efficient. Adv. Mater. 2011, 23, 821–842. [Google Scholar] [CrossRef]
  12. Tishin, A.M.M.; Spichkin, Y.I.I. The Magnetocaloric Effect and Its Applications; series in condensed matter physics; CRC Press: Boca Raton, FL, USA, 2003; Volume 6, pp. 1–475. [Google Scholar] [CrossRef]
  13. Coey, J.M.D. Magnetism and Magnetic Materials; Cambridge Univerity Press: Cambridge, UK, 2010. [Google Scholar] [CrossRef]
  14. Taylor, K.N.R. Transition metal moment collapse in Gd(Co1−xNix)2. Phys. Lett. 1969, 29, 372–373. [Google Scholar] [CrossRef]
  15. Bloch, D.; Lemaire, R. Metallic alloys and exchange-enhanced paramagnetism. Application to rare-earths-cobalt alloys. Phys. Rev. B 1970, 2, 2648–2650. [Google Scholar] [CrossRef]
  16. Campbell, I.A. Indirect exchange for rare earths in metals. J. Phys. F Met. Phys. 1972, 2, 3–7. [Google Scholar] [CrossRef]
  17. Moriya, T. Recent progress in the theory of itinerant electron magnetism. J. Magn. Magn. Mater. 1979, 14, 1–46. [Google Scholar] [CrossRef]
  18. Beal-Monod, M.T. Field effects in strongly enhanced paramagnets. Phys. B 1982, 1837, 109–110. [Google Scholar] [CrossRef]
  19. Yamada, H.; Inoue, J.; Shimizu, M. Electronic structure and magnetic properties of the cubic Laves phase compounds ACo2 (A = Sc, Ti, Zr, Lu and Hf) and ScNi2. J. Phys. F 1985, 15, 169. [Google Scholar] [CrossRef]
  20. Kuentzler, R.; Tari, A. Electronic properties and the appearance of magnetism in the (Tb1−xYx)Co2 compounds. J. Magn. Magn. Mater. 1986, 61, 29–38. [Google Scholar] [CrossRef]
  21. Burzo, E.; Lemaire, R. On the magnetic behaviour of RCo2 compounds where R is yttrium or a rare-earth. Solid State Commun. 1992, 84, 1145. [Google Scholar] [CrossRef]
  22. Moriya, T. Theory of itinerant electron magnetism. J. Magn. Magn. Mater. 1991, 100, 261–271. [Google Scholar] [CrossRef]
  23. Burzo, E.; Chioncel, L.; Tetean, R.; Isnard, O. On the R 5d band polarization in rare-earth-transition metal compounds. J. Phys. Condens. Matter. 2011, 23, 02601. [Google Scholar] [CrossRef]
  24. Lemaire, R. Magnetic properties of intermetallic compounds of Co with rare earth metals or Y. [PART I.]. Cobalt 1966, 32, 132–140. [Google Scholar]
  25. Lemaire, R. Magnetic properties of intermetallic compounds of Co with rare earth metals or Y. PART II. Cobalt 1966, 33, 201–211. [Google Scholar]
  26. Cyrot, M.; Lavagna, M. Density of states and magnetic properties of the rare-earth compounds RFe2, RCO2 and RNi2. J. Phys. 1979, 40, 763–771. [Google Scholar] [CrossRef]
  27. Baily, L.J.; Richter, E. Proceeding of the 2nd Intern Workshop on Rare Earth Permanent Magnets and their Applications; Strnat, K.J., Ed.; University of Dayton: Dayton, OH, USA, 1976; p. 235. [Google Scholar]
  28. Kirchmayer, H.R. Handbook on the Physics and Chemistry of Rare Earths; Gschneidner, K.A., Ed.; Elsevier: Amsterdam, The Netherlands; New York, NY, USA; Oxford, UK, 1979; Chapter 14. [Google Scholar]
  29. Burzo, E.; Tetean, R.; Sarkozi Zs Chioncel, L.; Neuman, M. Magnetic properties and electronic structures of RCo2−xSix, (R = Gd, Y) compounds. J. Alloys Compd. 2001, 323–324, 490–493. [Google Scholar] [CrossRef]
  30. Tetean, R.; Burzo, E.; Chioncel, L.; Crainic, T. On the magnetic behaviour of GdCo2–xCux compounds. Phys. Stat. Sol. (A) 2003, 196, 301–304. [Google Scholar] [CrossRef]
  31. Souca, G.; Dudric, R.; Cotop, R.; Küpper, K.; Tiusan, C.; Tetean, R. Electronic structure, magnetic properties and magnetocaloric effect of GdCo2−xNix. J. Alloys Compd. 2022, 923, 166116. [Google Scholar] [CrossRef]
  32. Pecharsky, V.K.; Gschneidner, K.A., Jr. Magnetocaloric effect and magnetic refrigeration. J. Magn. Magn. Matter. 1999, 200, 44–56. [Google Scholar] [CrossRef]
  33. Pecharsky, V.K.; Gschneidner, K.A. Magnetocaloric Effect. Encycl. Condens. Matter Phys. 2005, 236–244. [Google Scholar] [CrossRef]
  34. Brück, E. Developments in magnetocaloric refrigeration. J. Phys. D Appl. Phys. 2005, 38, R381–R391. [Google Scholar] [CrossRef]
  35. Gschneidner, K.A.; Pecharsky, V.K. Thirty years of near room temperature magnetic cooling: Where we are today and future prospects. Int. J. Refrig. 2008, 31, 945. [Google Scholar] [CrossRef]
  36. Smith, A.; Bahl, C.R.H.; Bjørk, R.; Engelbrecht, K.; Nielsen, K.K.; Pryds, N. Materials Challenges for High Performance Magnetocaloric Refrigeration Devices. Adv. Energy Mater. 2012, 2, 1288. [Google Scholar] [CrossRef]
  37. Blaha, P.; Schwarz, K.; Tran, F.; Laskowski, R.; Madsen, G.K.H.; Marks, L.D. WIEN2k: An APW+lo program for calculating the properties of solids. J. Chem. Phys. 2020, 152, 074101. [Google Scholar] [CrossRef]
  38. Saini, S.M.; Singh, N.; Nautiyal, T.; Auluck, S. Comparative study of optical and magneto-optical properties of GdFe2 and GdCo2. J. Phys. Condens. Matter 2007, 19, 176203. [Google Scholar] [CrossRef]
  39. Harmon, B.N.; Antropov, V.P.; Liechtenstein, A.I.; Solovyev, I.V.; Anisimov, V. Calculation of magneto-optical properties for 4f systems: LSDA + Hubbard U results. J. Phys. Chem. Solids 1995, 56, 1521. [Google Scholar] [CrossRef]
  40. Rodríguez-Carvajal, J. Recent advances in magnetic structure determination by neutron powder diffraction. Phys. B Condens. Matter 1993, 192, 55–69. [Google Scholar] [CrossRef]
  41. Wei, S.-H.; Ferreira, L.G. Bernard James E, and Zunger Alex, Electronic properties of random alloys: Special quasirandom structures. Phys. Rev. B 1990, 42, 9622. [Google Scholar] [CrossRef]
  42. Zunger Alex Wei, S.-H.; Ferreira, L.G.; Bernard James, E. Special quasirandom structures. Phys. Rev. Lett. 1990, 65, 353. [Google Scholar] [CrossRef] [PubMed]
  43. Szade, J.; Neumann, M.; Karla, I.; Schneider, B.; Fangmeyer, F.; Matteucci, M. Photon energy dependence of the Gd 4d photoemission. Solid State Commun. 2000, 113, 709–712. [Google Scholar] [CrossRef]
  44. Shirley, D.A. High-Resolution X-ray Photoemission Spectrum of the Valence Bands of Gold. Phys. Rev. B 1972, 5, 4709. [Google Scholar] [CrossRef]
  45. Rednic, V.; Coldea, M.; Mendiratta, S.K.; Valente, M.; Pop, V.; Neumann, M.; Rednic, L. X-ray photoelectron spectroscopy and magnetism of Mn1−xAlxNi alloys. J. Magn. Magn. Mater. 2009, 321, 3415–3421. [Google Scholar] [CrossRef]
  46. Givord, D.; Lemaire, R. Magnetic transition and anomalous thermal expansion in R2Fe17 compounds. IEEE Trans. Magn. 1974, 10, 109–113. [Google Scholar] [CrossRef]
  47. Ćwik, J. Magnetism and magnetocaloric effect in multicomponent Laves-phase compounds: Study and comparative analysis. J. Solid State Chem. 2014, 209, 13–22. [Google Scholar] [CrossRef]
  48. Gu, Z.; Zhou, B.; Li, J.; Ao, W.; Cheng, G.; Zhao, J. Magnetocaloric effect of GdCo2−xAlx compounds. Solid State Commun. 2007, 141, 548–550. [Google Scholar] [CrossRef]
  49. Anikin, M.; Tarasov, E.; Kudrevatykh, N.; Zinin, A. Magnetocaloric properties of Gd(Co1−xFex)2 compounds, with x ≤ 0.60. In EPJ Web of Conferences; EDP Sciences: Les Ulis, France, 2018; Volume 185, p. 05009. [Google Scholar] [CrossRef]
  50. Zhang, J.Y.; Luo, J.; Li, J.B.; Liang, J.K.; Wang, Y.C.; Ji, L.N.; Liu, Y.H.; Rao, G.H. Magnetocaloric effect of Gd(Co1−xMnx)2 compounds. Solid State Commun. 2007, 143, 541–544. [Google Scholar] [CrossRef]
  51. Annaorazov, M.P.; Asatryan, K.A.; Myalikgulyev, G.; Nikitin, S.A.; Tishin, A.M.; Tyurin, A.L. Alloys of the Fe-Rh system as a new class of working material for magnetic refrigerators. Cryogenics 1992, 32, 867–872. [Google Scholar] [CrossRef]
  52. Franco, V.; Blázquez, J.S.; Conde, A. Field dependence of the magnetocaloric effect in materials with a second order phase transition: A master curve for the magnetic entropy change. Appl. Phys. Lett. 2006, 89, 222512. [Google Scholar] [CrossRef]
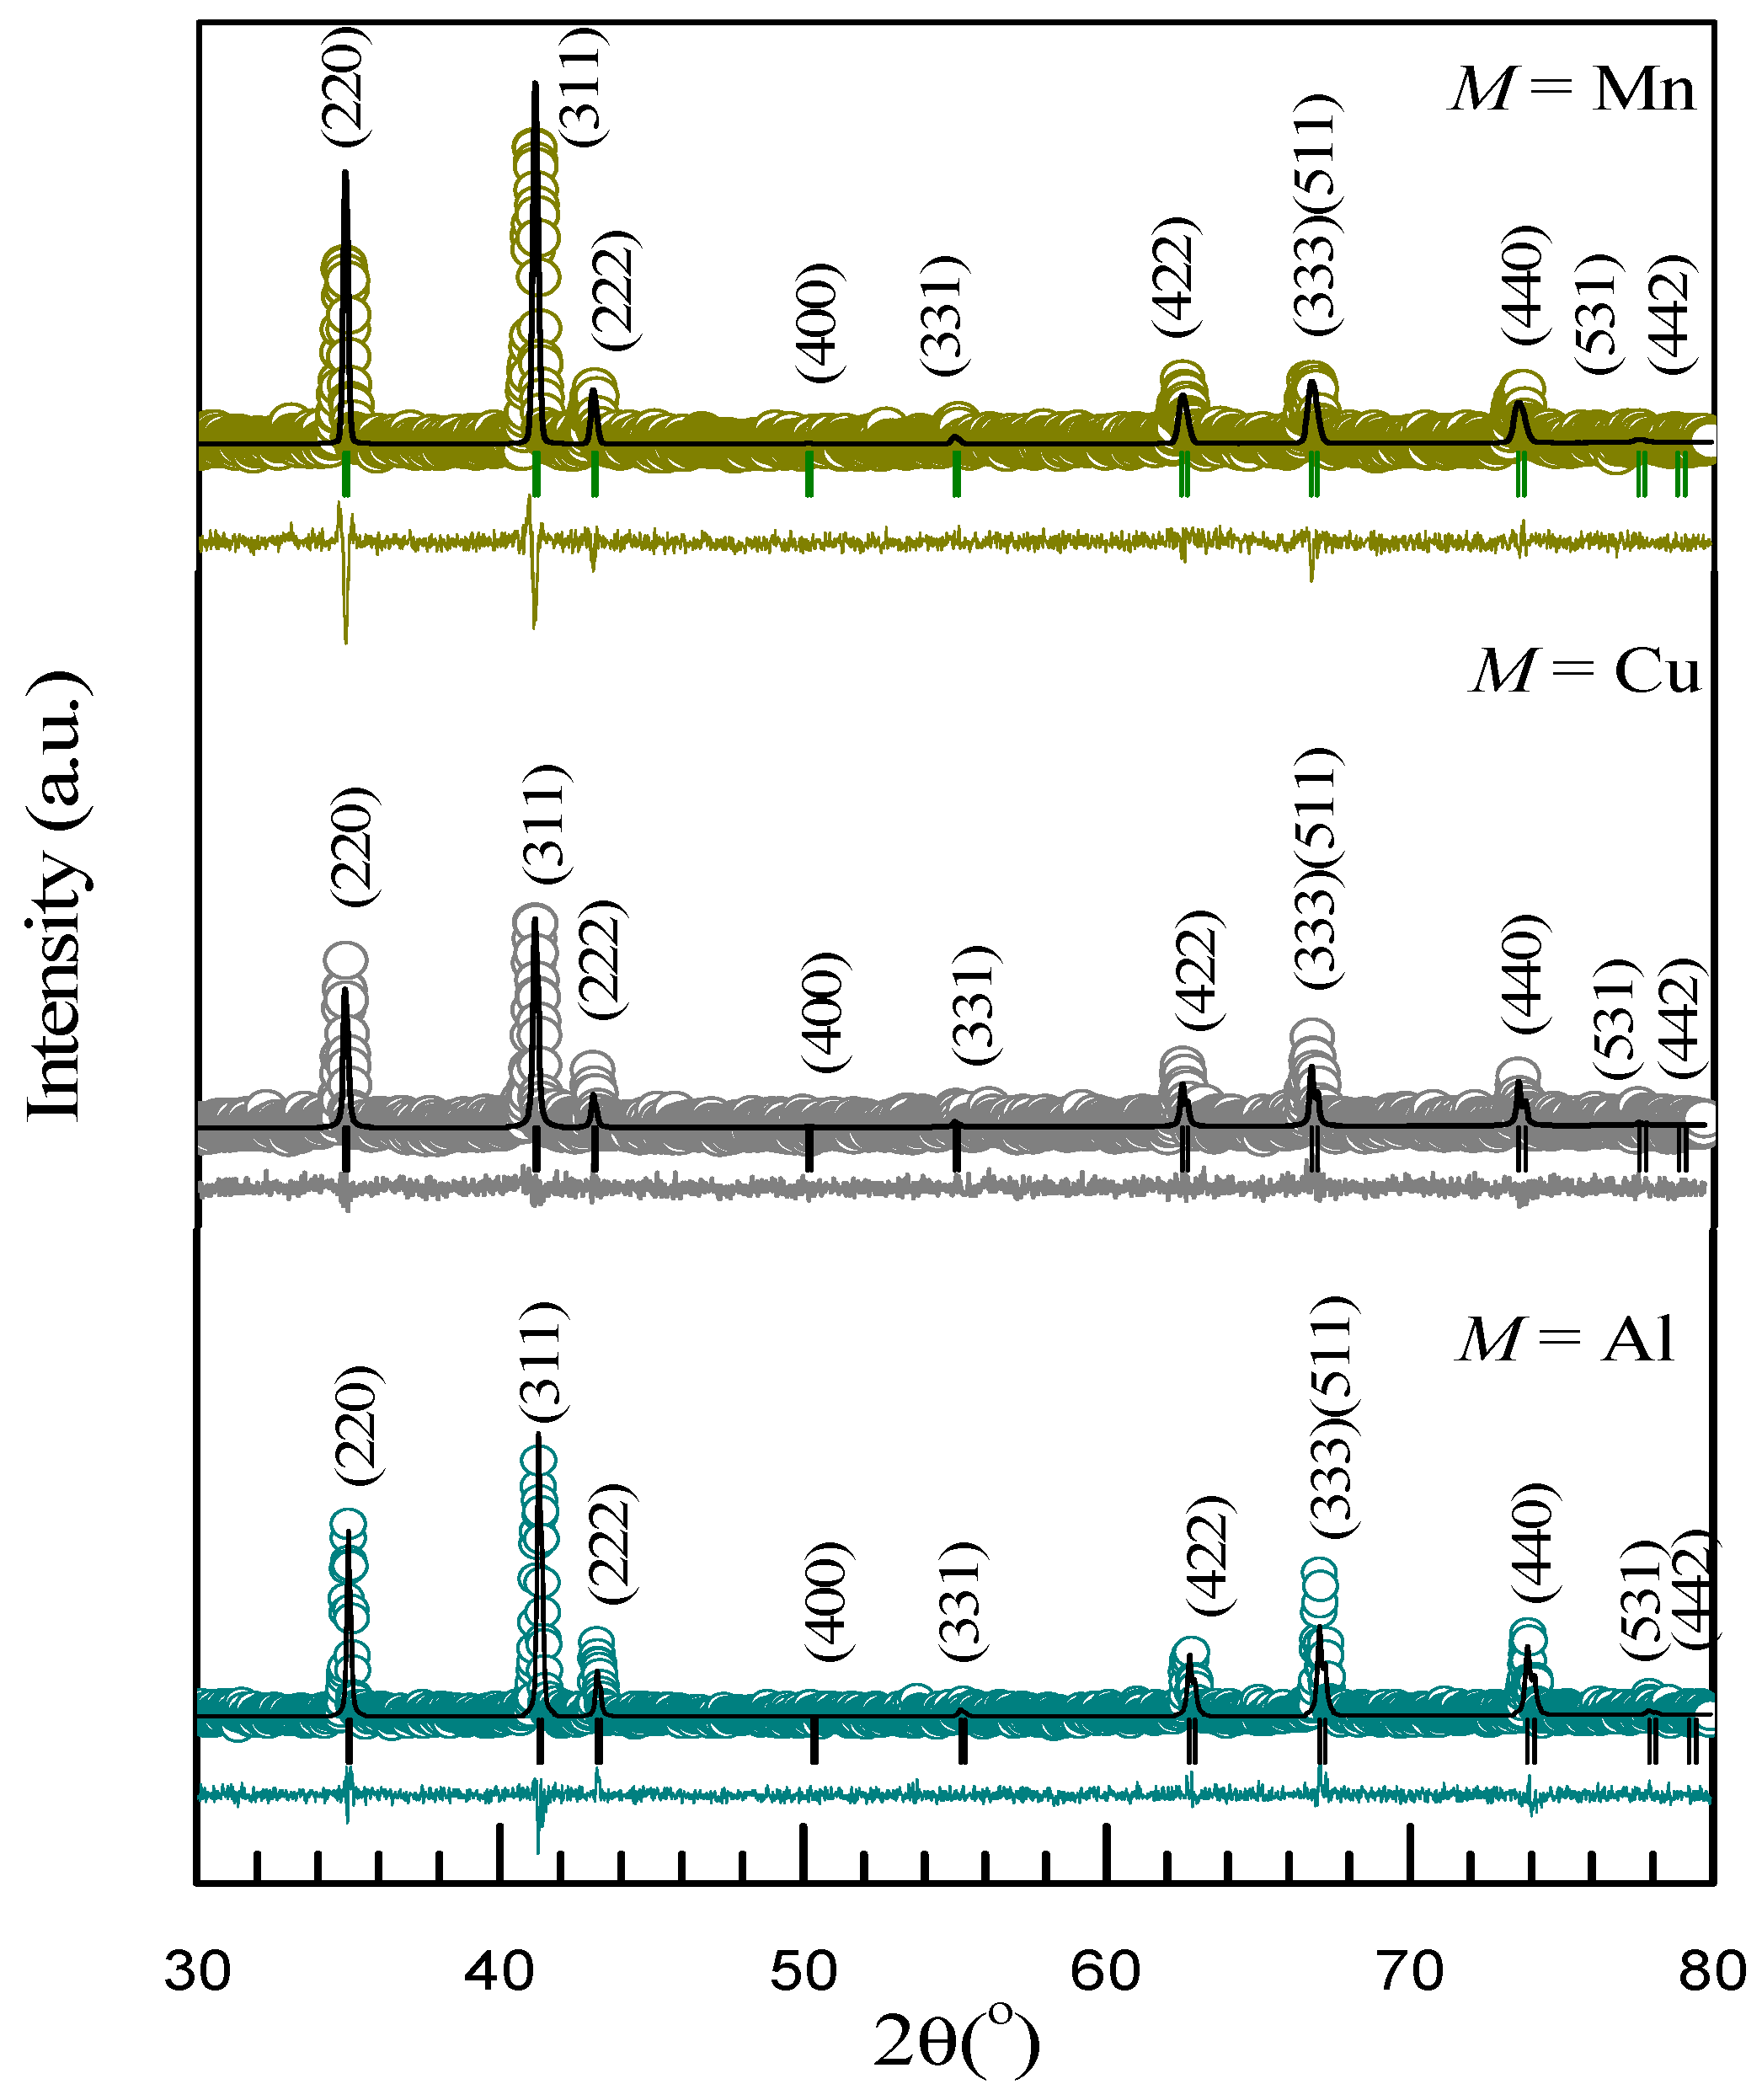
Figure 1. X-ray diffraction data for the GdCo1.8M0.2 samples. The open points correspond to the experimental data, the solid black lines are the Rietveld refinement, the vertical lines point out the Bragg positions, and the bottom solid line represents the difference between the experimental and fitted data.
Magnetochemistry 10 00053 g001
Figure 2. Supercell model used in the ab initio calculations. The M atoms which substitute Co atoms can randomly occupy the Co positions. In this picture, we illustrate the one of the configurations in which the M atoms occupy the (1/2, 1/2, 1/2), (1/2, 3/4, 3/4), and (1/2, 0, 0) positions in the supercell.
Magnetochemistry 10 00053 g002
Figure 3. Total density of states for the GdCo2 supercell, performed considering a Hubbard effective term: Ueff = 0.7Ry (U-J).
Magnetochemistry 10 00053 g003
Figure 4. Variation in the total magnetic moment per unit cell in GdCo1.8M0.2 compounds.
Magnetochemistry 10 00053 g004
Figure 5. Calculated variation in the average Co moment in GdCo1.8M0.2 compounds.
Magnetochemistry 10 00053 g005
Figure 6. Calculated variation in the average substitutional element M moment in GdCo1.8M0.2 compounds.
Magnetochemistry 10 00053 g006
Figure 7. Calculated variation in the average Gd moment in GdCo1.8M0.2 compounds.
Magnetochemistry 10 00053 g007
Figure 8. Orbital projected (d) density of states for the (a) GdCo1.8Al0.2 and (b) GdCo1.8Fe0.2 compounds. The contribution of each element is indicated with different colors (see legend). In (a), one can see that because of the zero d-DOS of Al there is no hybridization with Gd and Co. Conversely, in (b), the arrows indicate the Gd-Co-Fe hybridization of the d states (e.g., peaks in Gd and Co D-DOS at about −1.5 eV below EF).
Magnetochemistry 10 00053 g008
Figure 9. XPS valence band of GdCo1.8M0.2 compounds. The dashed line indicates the position of the Fermi level.
Magnetochemistry 10 00053 g009
Figure 10. Gd 4d XPS spectra of GdCo1.8M0.2 compounds.
Magnetochemistry 10 00053 g010
Figure 11. XPS Co 3s, Mn 3s, Cu 3s, and Al 2s core-level spectra of GdCo1.8M0.2 compounds.
Magnetochemistry 10 00053 g011
Figure 12. Curve fitting results for the XPS spectrum of GdCo1.8M0.2 (open circles correspond to the experimental spectrum and the lines to the fitting results, after background subtraction).
Magnetochemistry 10 00053 g012
Figure 13. Co 2p XPS spectra of GdCo1.8M0.2 compounds.
Magnetochemistry 10 00053 g013
Figure 14. The temperature dependence of magnetization for the GdCo1.8M0.2 samples measured in a 0.05 T applied magnetic field. The first derivative of magnetization vs. temperature is shown in the inset.
Magnetochemistry 10 00053 g014
Figure 15. The temperature dependences of Zero Field-Cooled (ZFC)–Field Cooled (FC) magnetic moments for the GdCo1.8Mn0.2 sample.
Magnetochemistry 10 00053 g015
Figure 16. Magnetic isotherms registered at 4 K in the applied magnetic field up to 12 T (left) and magnetic hysteresis loops recorded at 4 K (right) for GdCo1.8M0.2.
Magnetochemistry 10 00053 g016
Figure 17. Magnetic hysteresis loops recorded at T = 300 K for GdCo1.8M0.2.
Magnetochemistry 10 00053 g017
Figure 18. Arrott plots for GdCo1.8Cu0.2 (left) and GdCo1.8Al0.2 (right) compounds. Colors indicate different temperatures.
Magnetochemistry 10 00053 g018
Figure 19. The temperature dependences of the Landau a and b coefficients for the studied samples.
Magnetochemistry 10 00053 g019
Figure 20. The temperature dependence of the magnetic entropy changes for the samples with M = Al (left) and M = Cu (right) determined for variations in the external magnetic field of 1 T, 2 T, 3 T, and 4 T.
Magnetochemistry 10 00053 g020
Table 1. The computed magnetic moments and the total magnetic moment per formula for the GdCo2 supercell, performed considering a Hubbard effective term: Ueff = 0.7Ry (U-J).
GdCo1.8M0.2Substitutional Element MMnFeCoNiCuAl
ATOMPositionSpin Moment
B]
Spin Moment
B]
Spin Moment
B]
Spin Moment
B]
Spin Moment
B]
Spin Moment
B]
Gd1(1/8, 1/8, 1/8)7.277.307.277.267.277.26
Gd2(7/8, 7/8, 7/8)7.287.317.287.267.267.24
Gd3(5/8, 5/8, 1/8)7.297.317.277.257.277.25
Gd4(3/8, 3/8, 7/8)7.297.317.277.257.277.25
Gd5(5/8, 1/8, 5/8)7.297.317.277.257.277.25
Gd6(3/8, 7/8, 3/8)7.297.317.277.257.277.25
Gd7(1/8, 5/8, 5/8)7.287.317.277.267.267.24
Gd8(7/8, 3/8, 3/8)7.277.307.277.267.277.26
M1(1/2, 1/2, 1/2)−2.88−2.46−1.31−0.290.020.02
M2(1/2, 3/4, 3/4)−2.81−2.45−1.31−0.290.030.02
Co3(3/4, 3/4, 1/2)−1.34−1.39−1.31−1.26−1.15−0.89
Co4(3/4, 1/2, 3/4)−1.34−1.39−1.31−1.26−1.15−0.89
Co5(0, 0, 1/2)−1.40−1.40−1.31−1.28−1.19−1.17
Co6(0, 1/4, 3/4)−1.40−1.39−1.31−1.33−1.28−1.17
Co7(1/4, 1/4, 1/2)−1.36−1.38−1.31−1.31−1.24−1.08
Co8(1/4, 0, 3/4)−1.34−1.39−1.31−1.26−1.15−0.89
Co9(0, 1/2, 0)−1.40−1.40−1.31−1.28−1.19−1.17
Co10(0, 3/4, 1/4)−1.40−1.39−1.31−1.33−1.28−1.17
Co11(1/4, 3/4, 0)−1.34−1.39−1.31−1.26−1.15−0.89
Co12(1/4, 1/2, 1/4)−1.36−1.38−1.31−1.31−1.24−1.08
M3(1/2, 0, 0)−2.88−2.46−1.31−0.290.020.02
Co14(1/2, 1/4, 1/4)−1.38−1.36−1.31−1.26−1.22−1.01
Co15(3/4, 1/4, 0)−1.36−1.38−1.31−1.31−1.24−1.08
Co16(3/4, 0, 1/4)−1.36−1.38−1.31−1.31−1.24−1.08
interstitial 3.844.734.093.803.933.78
TOTAL 35.7337.8141.3544.2046.3948.27
Moment
/elementary cell
4.474.735.175.525.806.03
Table 2. Fitting results for GdCo1.8M0.2 Co 3s core levels.
MS − 1/2
Binding Energy (eV)
S + 1/2
Binding Energy (eV)
ΔEex
(eV)
Al101.08104.623.54
Cu100.82104.333.51
Mn101.07104.593.52
Table 3. The values of the Curie temperatures, saturation magnetizations, and magnetic moments in GdCo1.8M0.2 compounds.
MTc (K)M0B/f.u.)MGdB/atom)MMB/atom)MCoB/atom)
Al3825.787.26−0.030.82
Cu3785.757.27−0.020.84
Mn4534.527.30−2.861.23
Table 4. The maximum value of magnetic entropy changes for the GdCo1.8M0.2 (M = Al, Cu) compounds.
MTmax (K)|ΔSM| (J/KgK)δTFWHM (K)
ΔB = 1 TΔB = 2 TΔB = 3 TΔB = 4 TΔB = 1 TΔB = 2 TΔB = 3 TΔB = 4 T
Cu3810.931.642.212.7130455466
Al3821.041.762.362.8931486182
Table 5. The calculated RCP(S) and the RCP(S)/ΔB parameters for GdCo1.8M0.2 compounds.
MRCP(S) (J/kg)RCP(S)B (J/kgT)
ΔB = 1 TΔB = 2 TΔB = 3 TΔB = 4 TΔB = 1 TΔB = 2 TΔB = 3 TΔB = 4 T
Cu27.973.8119.34178.8627.936.939.7844.71
Al32.2484.48143.96236.9832.2442.2447.9859.24
Disclaimer/Publisher’s Note: The statements, opinions and data contained in all publications are solely those of the individual author(s) and contributor(s) and not of MDPI and/or the editor(s). MDPI and/or the editor(s) disclaim responsibility for any injury to people or property resulting from any ideas, methods, instructions or products referred to in the content.