Article

Transcriptomic and Metabolomic Analyses of Seedlings of Two Grape Cultivars with Distinct Tolerance Responses to Flooding and Post-Flooding Stress Conditions

1
College of Life Science, Leshan Normal University, Leshan 614000, China
2
Institution of Biodiversity Conservation and Utilization in Mount Emei, Leshan Normal University, Leshan 614000, China
3
California Association of Resource Conservation Districts, Folsom, CA 95630, USA
4
Academy of Mount Emei, Leshan Normal University, Leshan 614000, China
5
Leshan Academy of Agricultural Sciences, Leshan 614000, China
*
Authors to whom correspondence should be addressed.
These authors contributed equally to this work.
Horticulturae 2023, 9(9), 980; https://doi.org/10.3390/horticulturae9090980
Submission received: 21 July 2023 / Revised: 21 August 2023 / Accepted: 29 August 2023 / Published: 30 August 2023

Abstract

:
Grapes, an important and widespread fruit crop providing multiple products, face increasing flooding risks due to intense and frequent extreme rainfall. It is thus imperative to fully understand the flood-tolerance mechanisms of grapevines. Here, RNA-seq and LC-MS/MS technologies were used to analyze the transcriptome and metabolome changes in the roots of SO4 (tolerant to flooding) and Kyoho (sensitive to flooding) grapes under flooding and post-flooding conditions. The results showed that the abundance of many metabolites in the phenylpropanoids and polyketides, organic acids and their derivatives, and organic oxygen compounds superclasses changed in different patterns between the Kyoho and SO4 grapes under flooding and post-flooding conditions. Jasmonic acid and the ascorbic acid–glutathione cycle played a pivotal role in coping with both hypoxia stress and reoxygenation stress incurred during flooding and post-flooding treatments in the SO4 cultivar. Under flooding stress, the regulatory mechanistic shift from aerobic respiration to anaerobic fermentation under hypoxia is partly missing in the Kyoho cultivar. In the post-flooding stage, many genes related to ethylene, gibberellins, cytokinins, and brassinosteroids biosynthesis and brassinosteroids-responsive genes were significantly downregulated in the Kyoho cultivar, adversely affecting growth recovery; however, their expression was not reduced in the SO4 cultivar. These findings enhance our understanding of the flooding-tolerance mechanisms in grapes.

1. Introduction

Flooding events in the last few decades have increased worldwide due to climate extremes caused by ongoing global warming. More intense, frequent flooding has led to disastrous impacts on natural vegetation and crops, causing huge agricultural and economic losses [1]. Unfortunately, the land area subjected to flooding at a variety of scales increases with an increasing flooding frequency [2]. Agricultural crops, horticultural crops, and forest trees cultivated in these areas are likely threatened, to some extent, with production declines caused by flooding because most of them cannot tolerate this particular abiotic stress [3].
Plants experience hypoxia, or even anoxia, during flooding stress conditions because the diffusion rate of O2 is extremely low in water, especially in stagnant water. Root hypoxia could result from all kinds of flooding events, and hypoxia of the upper organs could be caused by partial or full submergence. Subsequent damage incurred from flooding stress is often the consequence of plant hypoxia. The methods by which plants adapt to flooding consist mainly of an escape strategy or a quiescence strategy [4]. Some deep-water rice varieties can activate their rapid internode elongation due to the presence of gibberellin (GA), enabling them to maintain sufficient aerial contact using leaves above the water level’s surface, thereby allowing air transport to submerged organs via aerenchyma; this is the so-called escape strategy [5]. Plants can utilize the other strategy, quiescence, to reduce the use of carbohydrates, energy, and O2 to the minimum amounts required for keeping the plant alive [6,7]. Reactive oxygen species (ROS) scavenging is among these required activities. ROS induced by hypoxia can not only trigger the phytohormone-associated stress defenses when the content level is low and well-controlled, but it can also directly damage membrane lipids, pigments, proteins, and nucleic acids, if excessively accumulated [8,9]. Enzymatic antioxidants, including catalase, ascorbate peroxidase (APX), superoxidase, dehydroascorbate reductase (DHAR), glutathione reductase (GR), and glutathione S-transferase (GST), as well as non-enzymatic antioxidants, such as ascorbic acid (AsA), glutathione (GSH), and carotenoids, work together to detoxify ROS [10]. Additionally, the ability to maintain the ROS balance contributes significantly to the flood-tolerance traits of plants.
To accurately estimate real tolerance to flooding stress, plant performance should be evaluated during both flooding and recovery periods; however, the latter is often overlooked, especially in molecular-based analyses [11]. Plants face multiple challenges after excessive water is removed, such as reoxygenation, re-illumination, dehydration, and senescence [12]. As the dominant organ affected in determining the flood tolerance of plants, roots are most prone to reoxygenation stress [13,14]. Excessive ROS in the roots could be induced, not only by hypoxia during soil flooding, but also via multiple pathways upon oxygen re-entry in the post-flooding period, such as electron leakage in electron-transport chains and NADPH oxidase/respiratory bursts [15,16]. Thus, a strong ROS scavenging ability remains essential for plants to fully recover during post-flooding conditions.
The grape (Vitis L.) is one of the most important fruit crops, yielding multiple products, with both table grapes and grape wines being popular worldwide [17]. As widespread plants in both Northern and Southern Hemispheres, grapevines, like other common crops, are facing increasingly worse flooding situations, resulting from intense and frequent extreme rainfall. In such circumstances, it is of importance to gain a comprehensive understanding of the mechanisms of flood tolerance in grapevines and to utilize these mechanisms accordingly to reduce flood damage in grape cultivation. Some physiological responses of roots from grapevine plants to waterlogging stress have been reported [18,19], yet the responsible molecular mechanisms are seldom studied. The work of Ruperti et al. [20] provided the first comprehensive view of the molecular and metabolic pathways involved in the root responses of grapevines. In their study, a series of hypoxia-inducible metabolites, namely ethanol and GABA, were characterized at hypoxia initiation. A shift from O2-dependent respiration toward fermentative metabolism, coupled with an increase in the glycolytic flux, was observed in roots at the transcriptional level, ensuring ATP supplementation under root hypoxia conditions. Reduced phytohormone-associated root growth was also evinced by the downregulation of brassinosteroid (BR), auxin, and GA biosynthesis processes at the transcriptional level; however, only flood-tolerant grape rootstocks were analyzed Although many flood-induced responses were clarified, it remains a challenge to determine the key markers for plant tolerance to flooding. The mechanism by which one grapevine cultivar is more tolerant to flooding than another might lie at the nexus of differential responses between them to flooding and post-flooding stresses. Accordingly, comparing a genotype which is tolerant and a sensitive to flooding, both during flooding and post-flooding recovery periods, should provide insight.
Here, we sought to explore the genotype-specific transcriptional and metabolic responses of roots from Kyoho (V. vinifera × V. labrusca cv. Kyoho, sensitive to flooding) and SO4 (V. berlandieri × V. riparia, tolerant to flooding) in the flood and post-flooding periods. RNA-sequencing and metabolic profiling were applied to roots flooded for 7 days and to roots allowed to recover for 3 days after the removal of excess water. The timely knowledge gained in this study will benefit the selection of flood tolerance-related markers and the breeding of flood-tolerant grape rootstocks.

2. Results

2.1. Sequencing Quality Statistics

The treatment of the sample groups in this study are described in Table 1. Nine cDNA libraries of Kyoho, and likewise of SO4, were generated and sequenced to better understand how these two grape cultivars responded to short-term stress under flooding and subsequent recovery. The number of clean bases and of clean reads averaged 8.47 G and 71.43 M, respectively, for the 18 cDNA libraries. The proportion of Q20 and Q30 bases was, respectively, greater than 97.14% and 91.82%, while that of the GC bases was between 46.00% and 47.83%. All these results suggested that the sequencing quality was robust. The clean reads were aligned to the reference genome of the grape, and the average alignment rate of each sample was 85.89% (Supplementary Table S1).

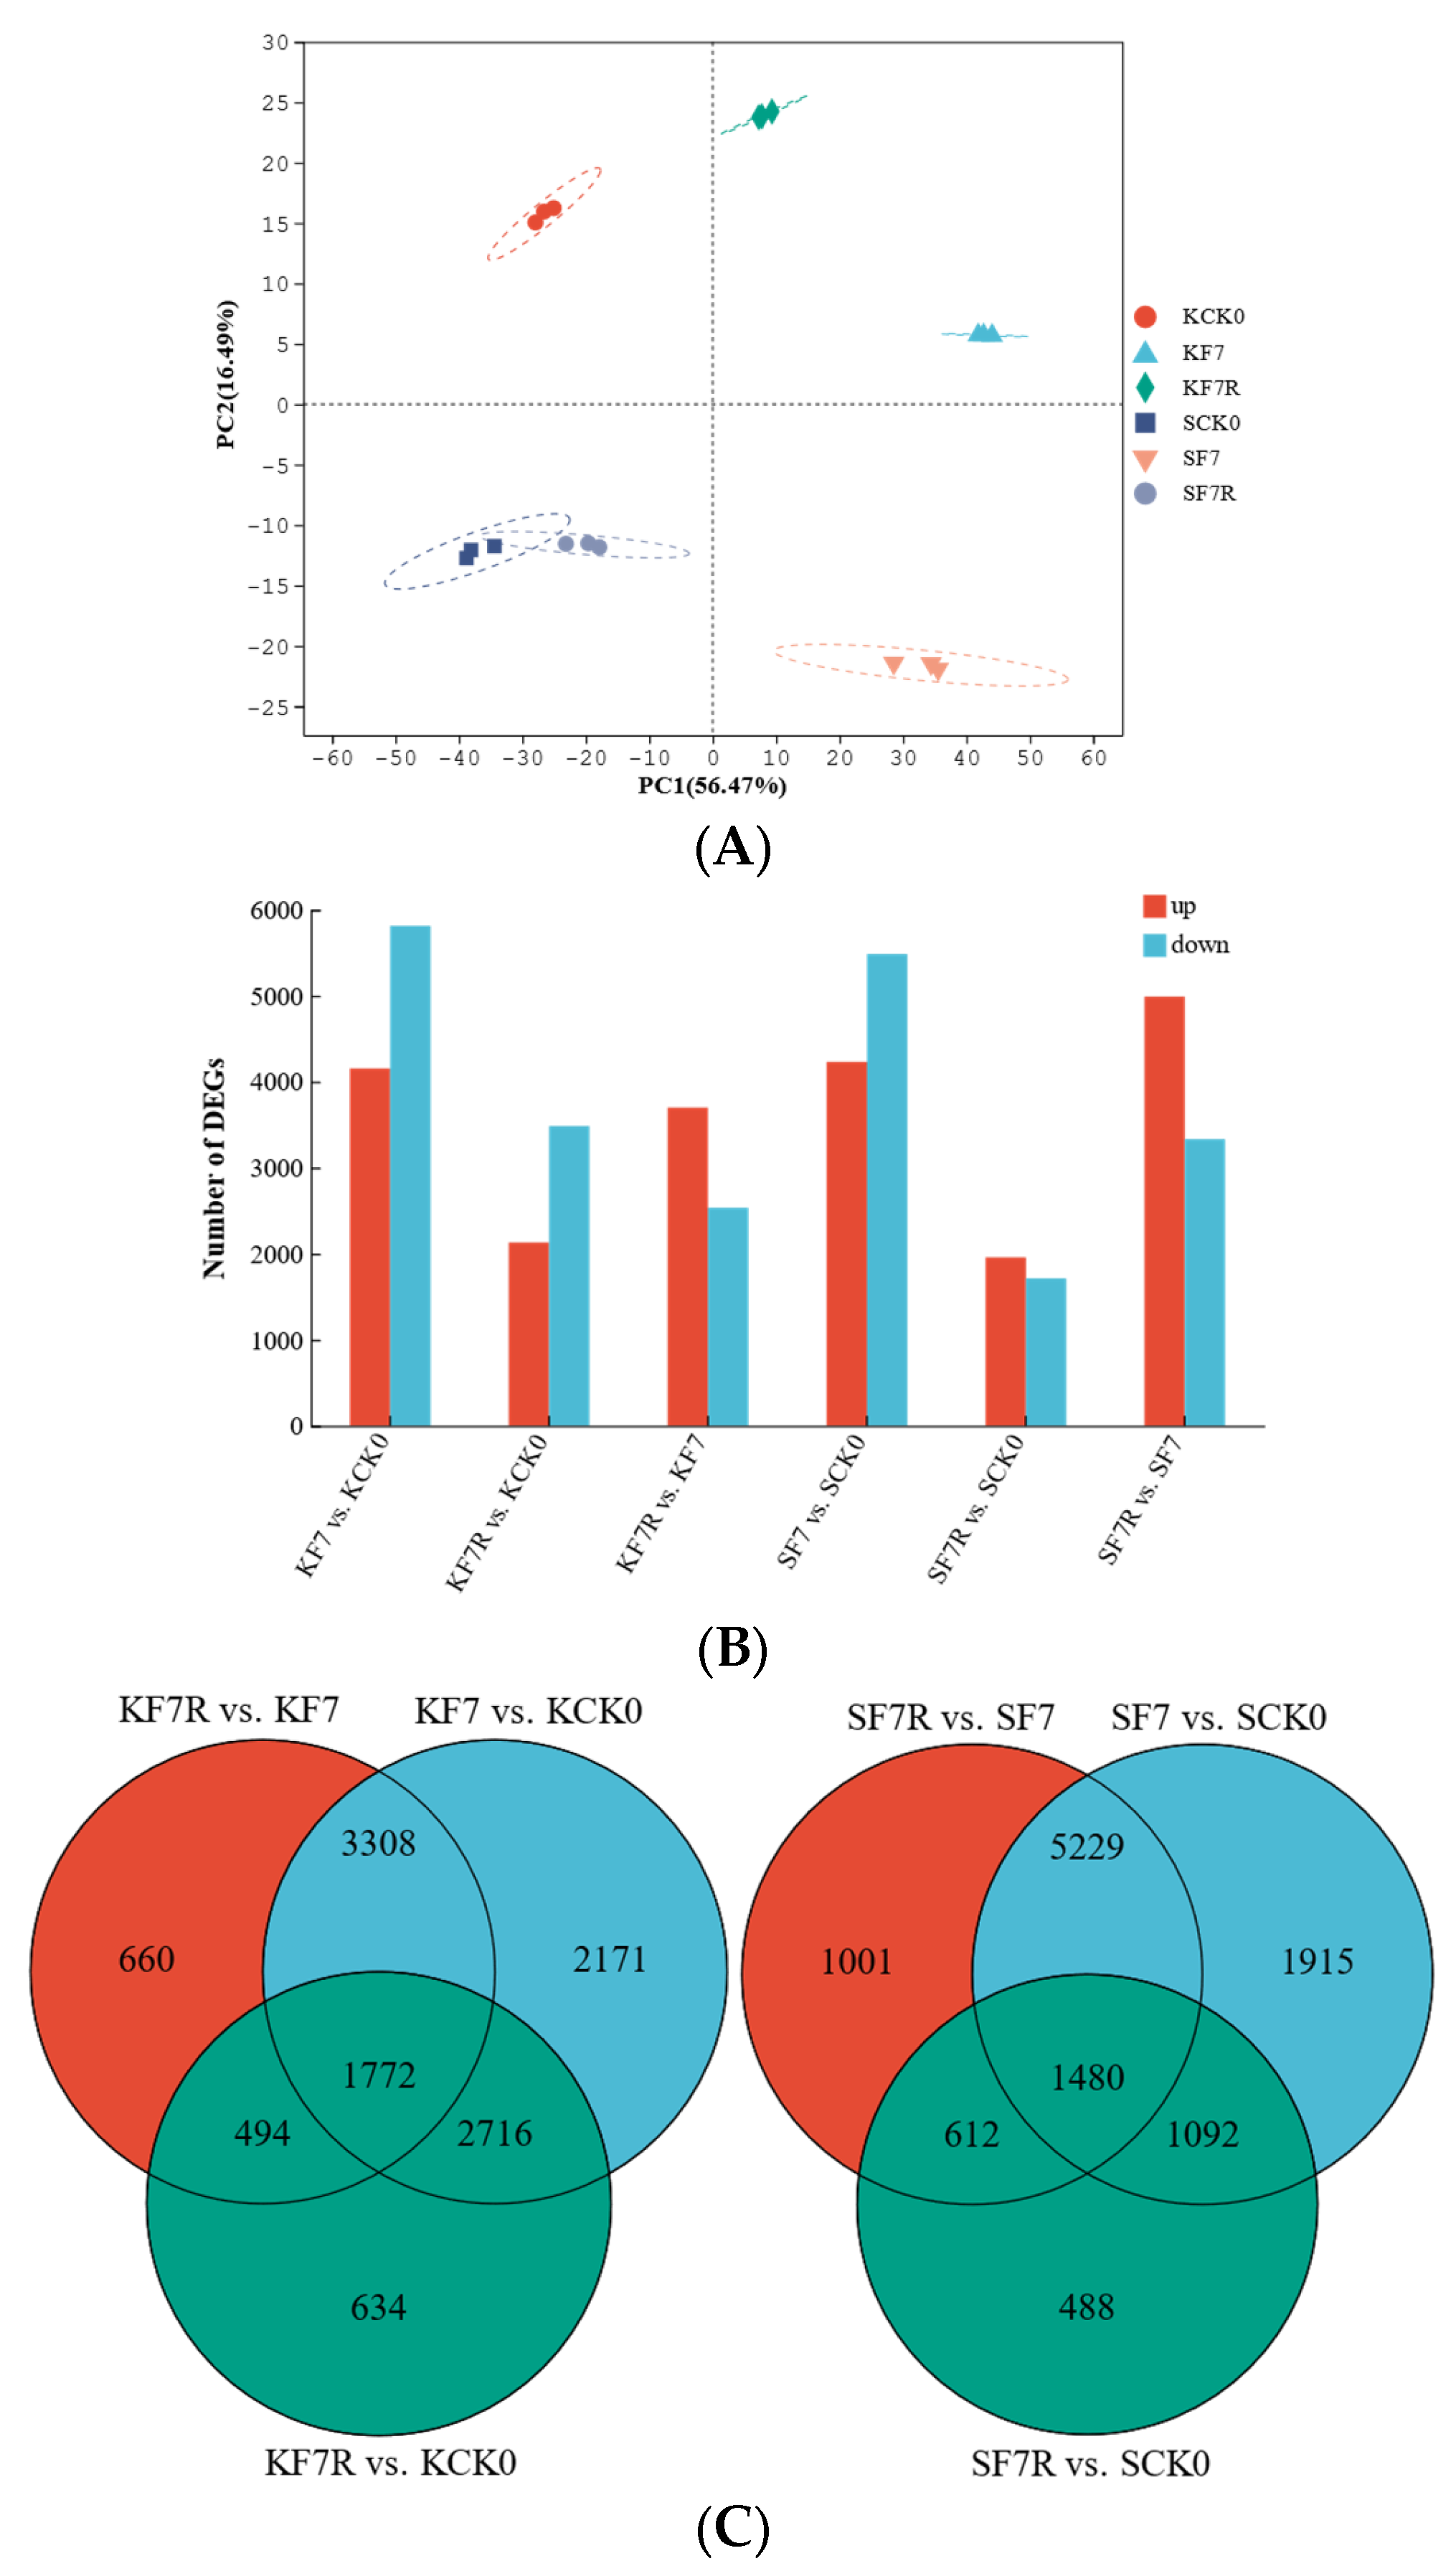
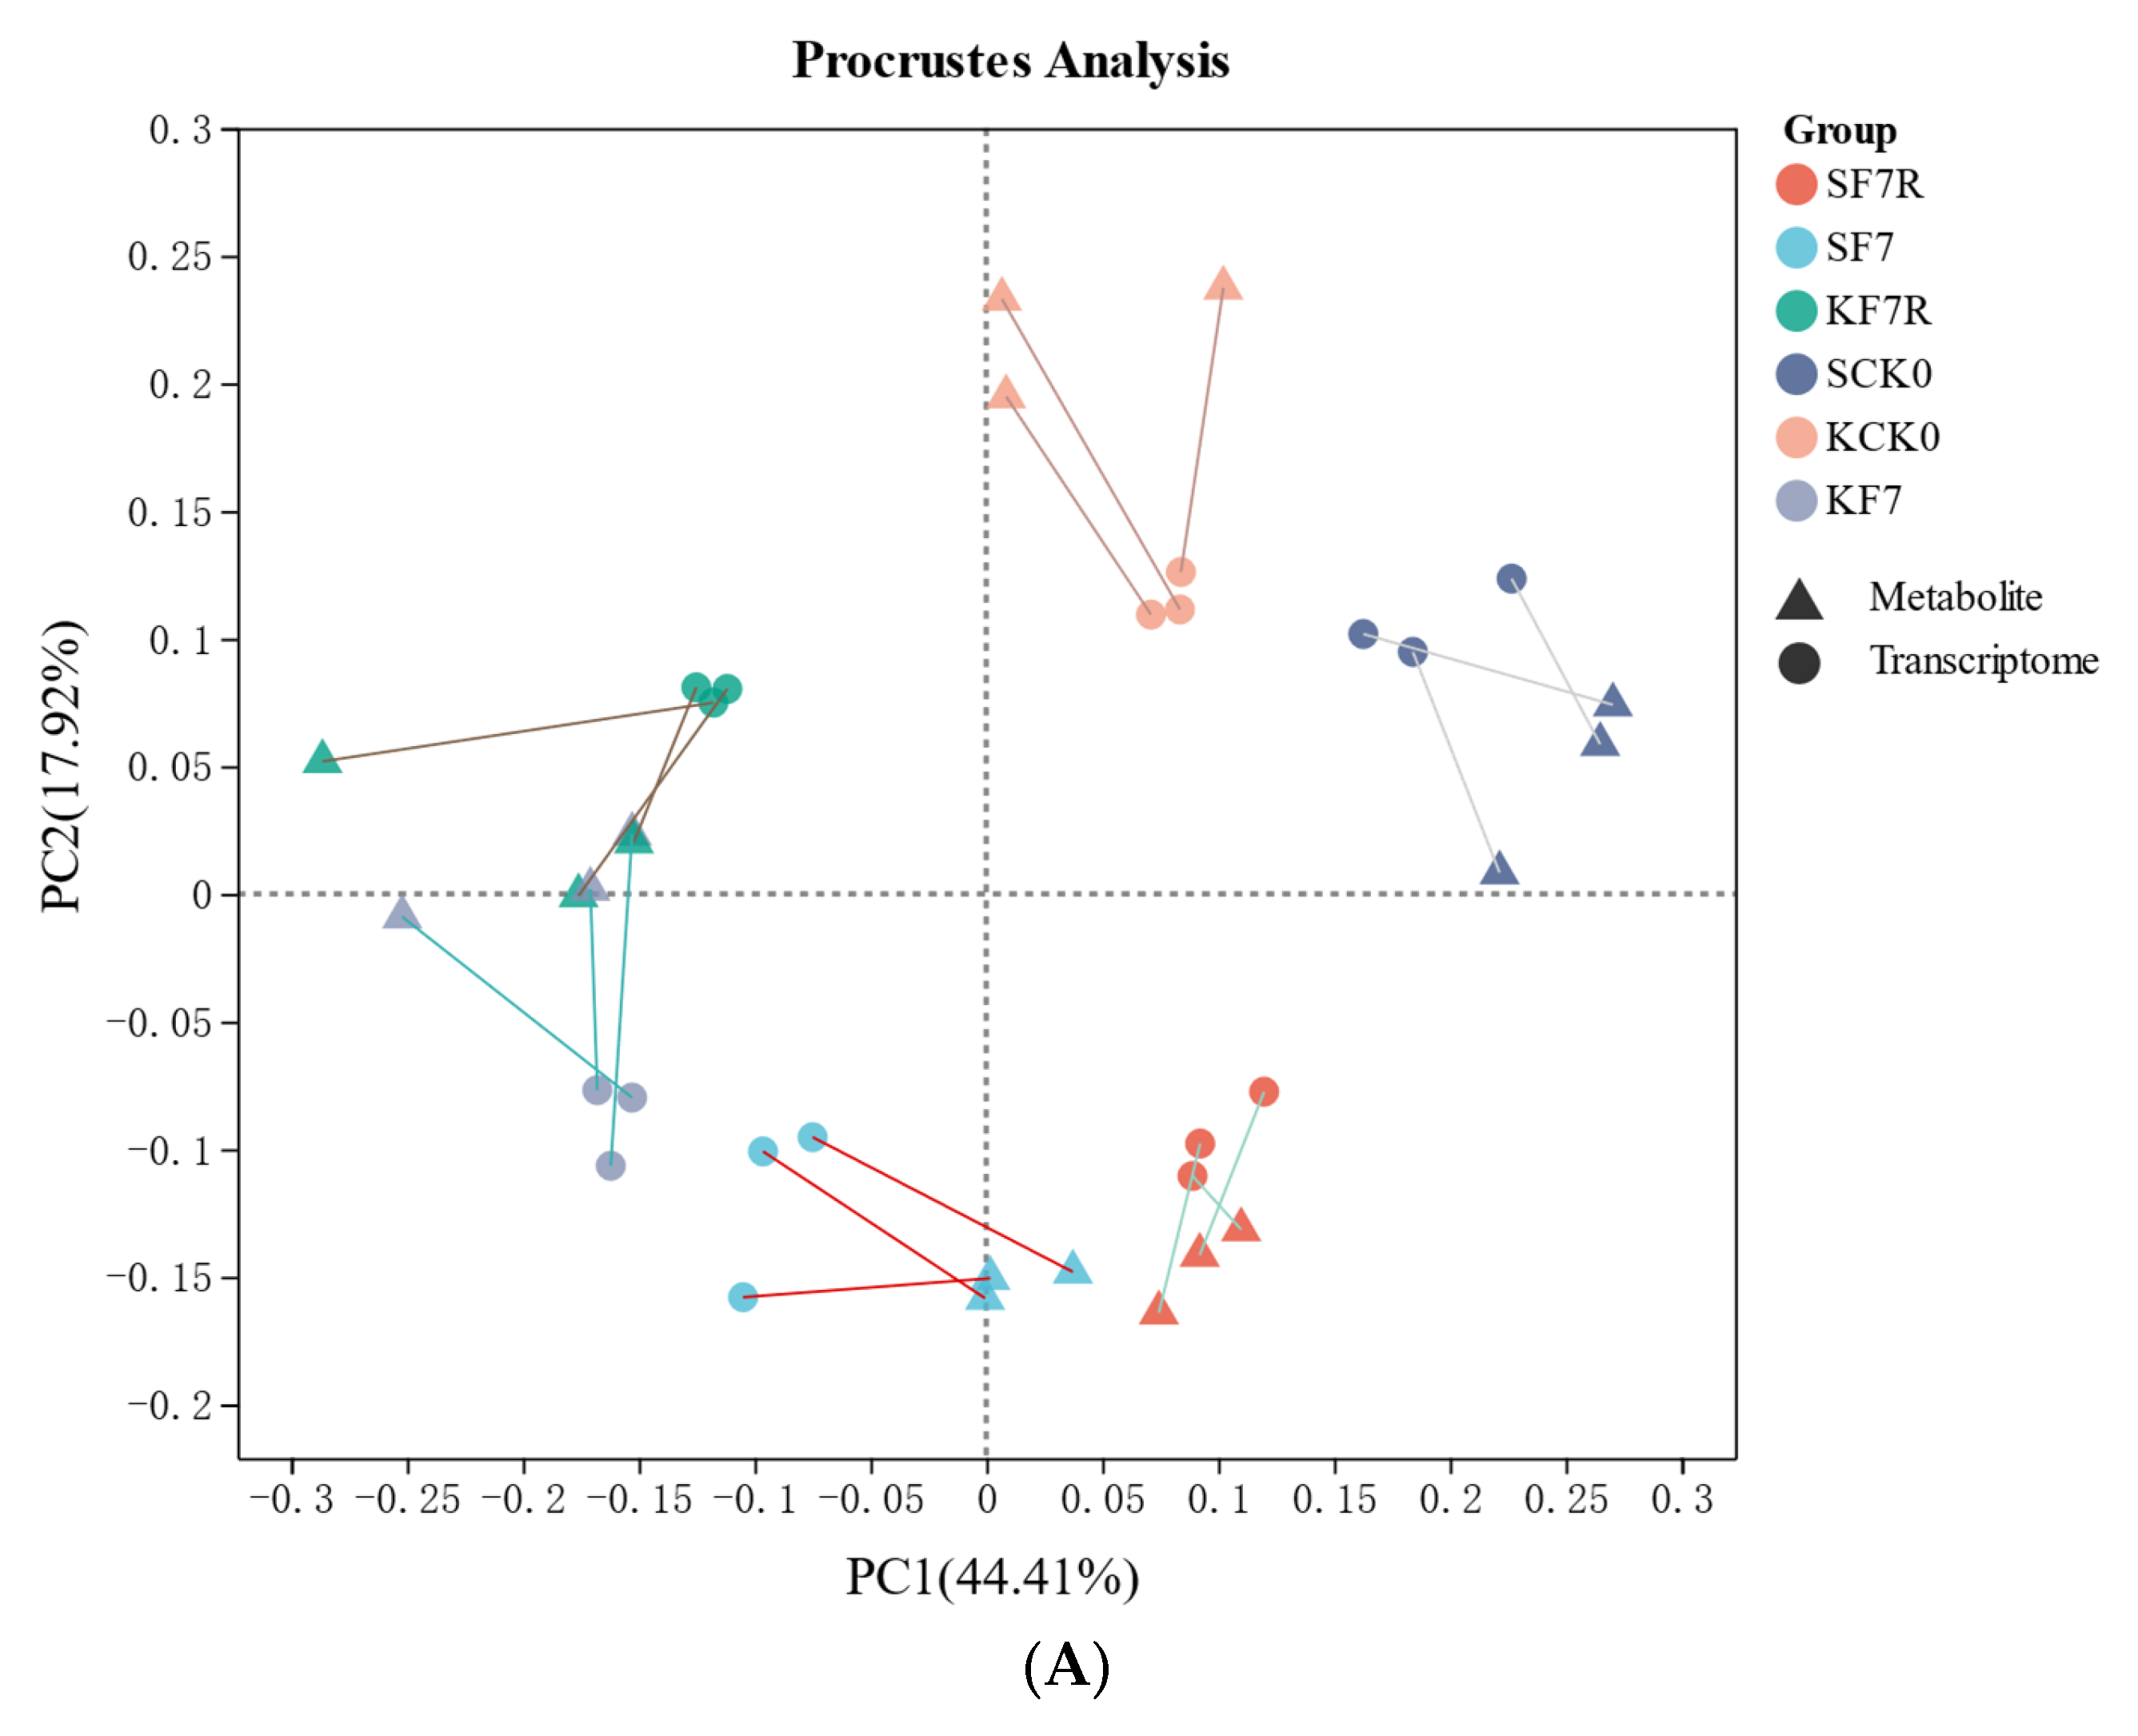
2.2. Relationship between Samples and Differentially Expressed Genes (DEGs)

At the transcriptional level, the roots of Kyoho and SO4 responded differently to stress during flooding and post-flooding recovery (Figure 1; Supplementary Table S2). The principal component analysis (PCA) of gene expression data revealed a high reproducibility between the biological replicates (Figure 1A). Principal component 1 (PC1), which accounted for 56.47% of the variance, separated the three treatments. Principal component 2 (PC2), which accounted for 16.49% of total variance, separated the two cultivars. All sample groups, except for SCK0 and SF7R, were obviously separated; this suggested that the sample groups had different characteristics at the transcriptional level, and that flooded SO4 might already have fully recovered within 3 days after drainage. In the Kyoho roots, we found 4155 upregulated and 5812 downregulated genes after exposed to flooding for 7 days (KF7), when compared with the control, while the corresponding numbers were 4231 and 5485 in SO4 after experiencing flooding for 7 days (SF7). After drainage and 3 days of recovery, there were 2131 upregulated and 3485 downregulated genes compared with the results for the control of Kyoho (KCK0); the corresponding numbers in the SO4 roots were only 1958 and 1714 (Figure 1B). Evidently, far fewer genes were downregulated in SO4 roots than in Kyoho roots during the post-flooding stage, indicating that flood stress was less harmful to SO4. In the Kyoho roots, 4488 DEGs were co-expressed during flooding and post-flooding conditions vis-à-vis the control, with 5479 and 1128 genotype-specific DEGs, respectively, found in KF7 and Kyoho, recovered for 3 days after flooding (KF7R), in comparison to the results for KCK0. In the SO4 roots, the corresponding number of co-expressed DEGs was 2572, and the numbers of genotype-specific DEGs amounted to 7144 and 1100 (Figure 1C). Additionally, DEGs in the post-flooding vs. flooding groups in the two cultivars were also uncovered (Figure 1B,C; Supplementary Table S2).

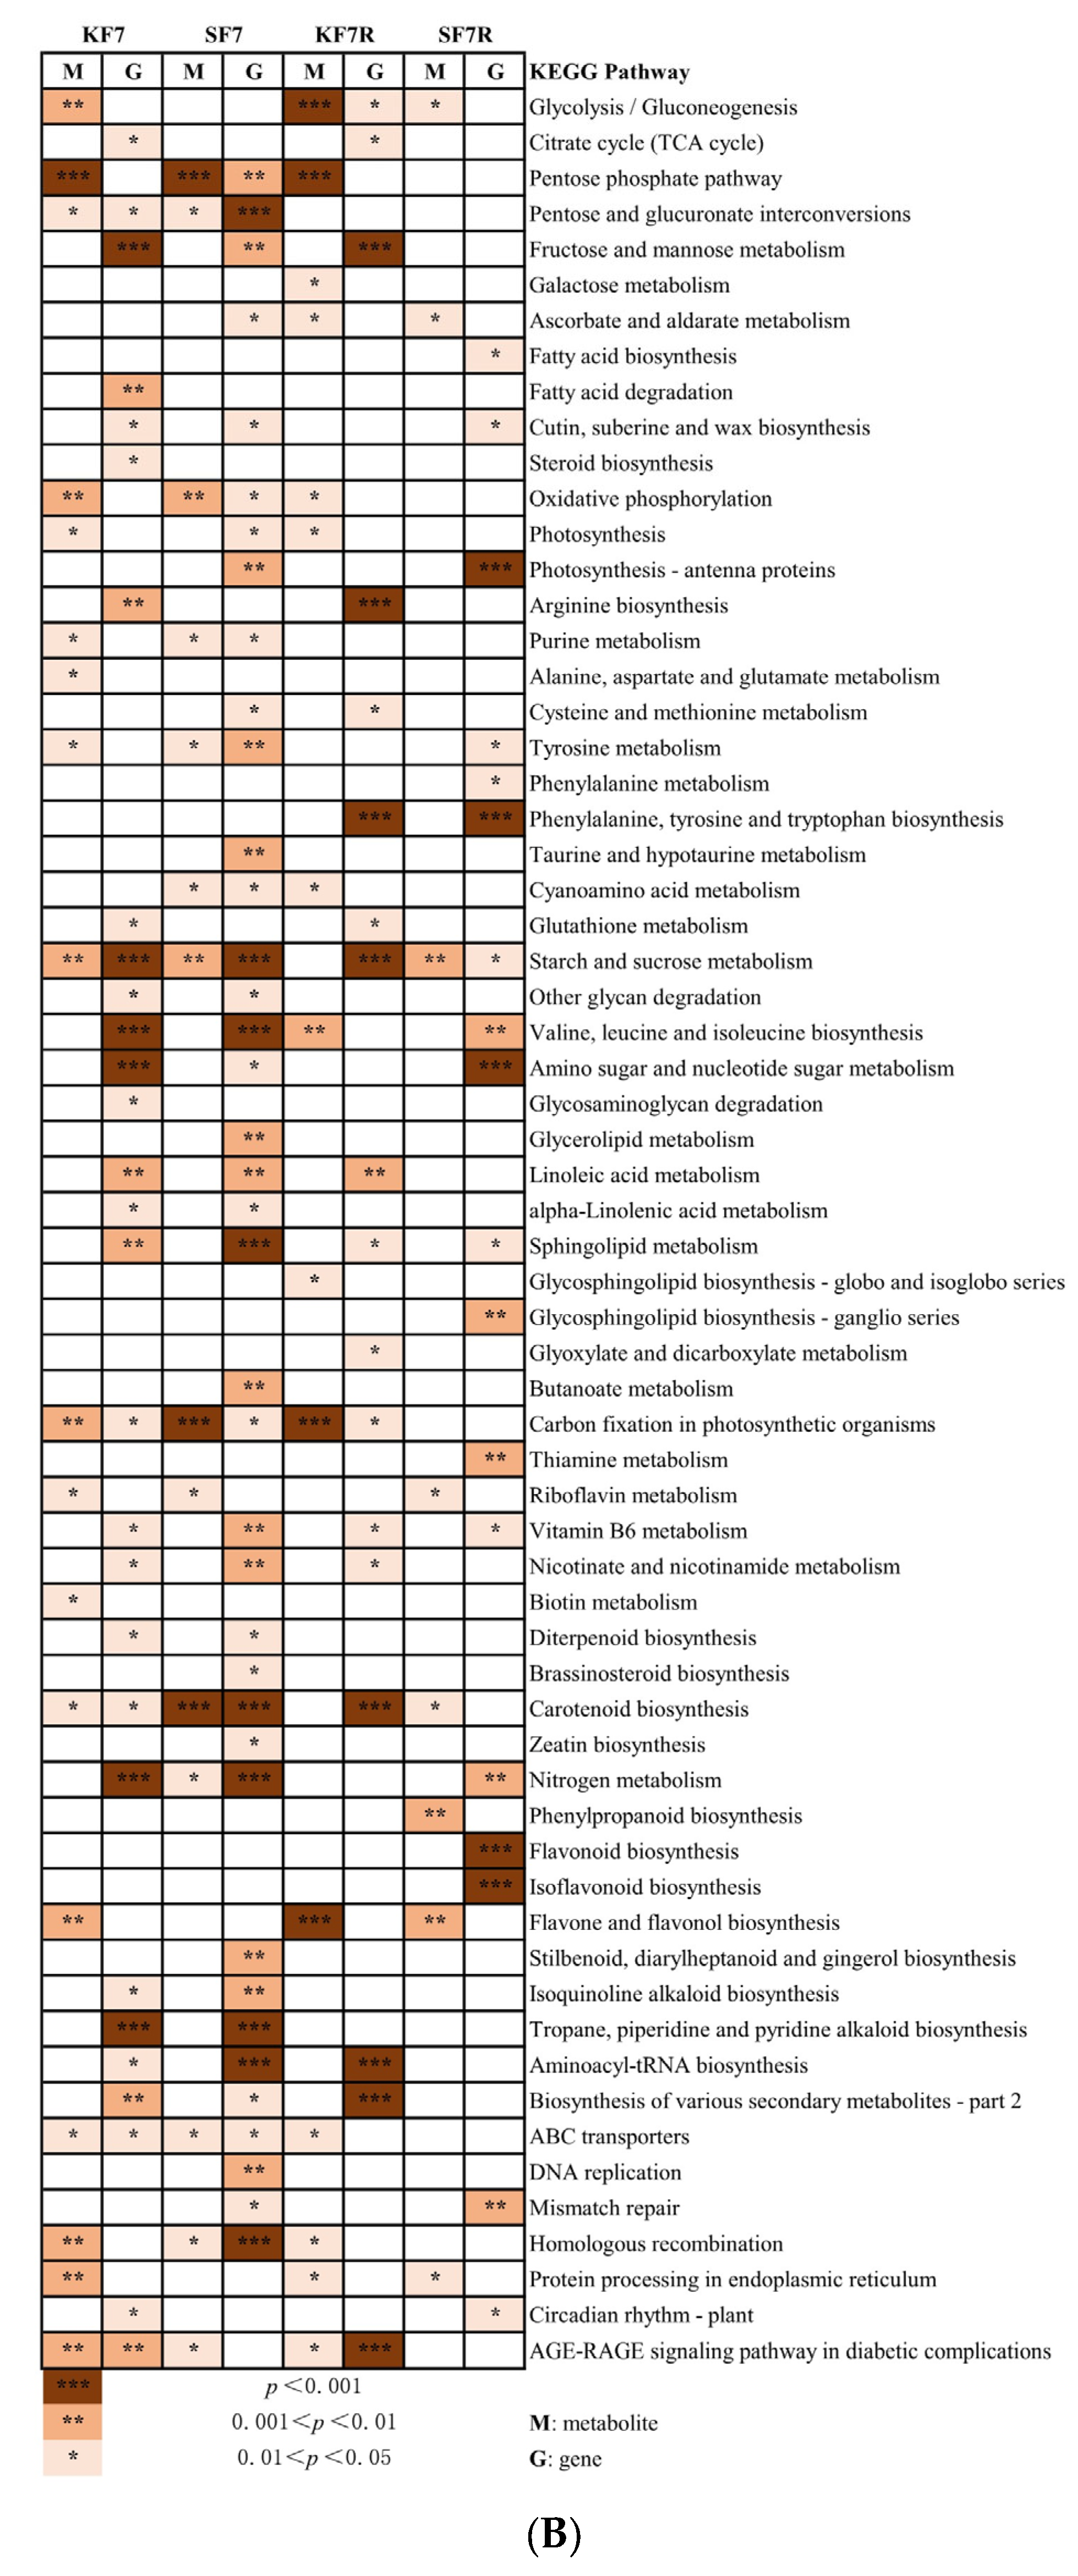
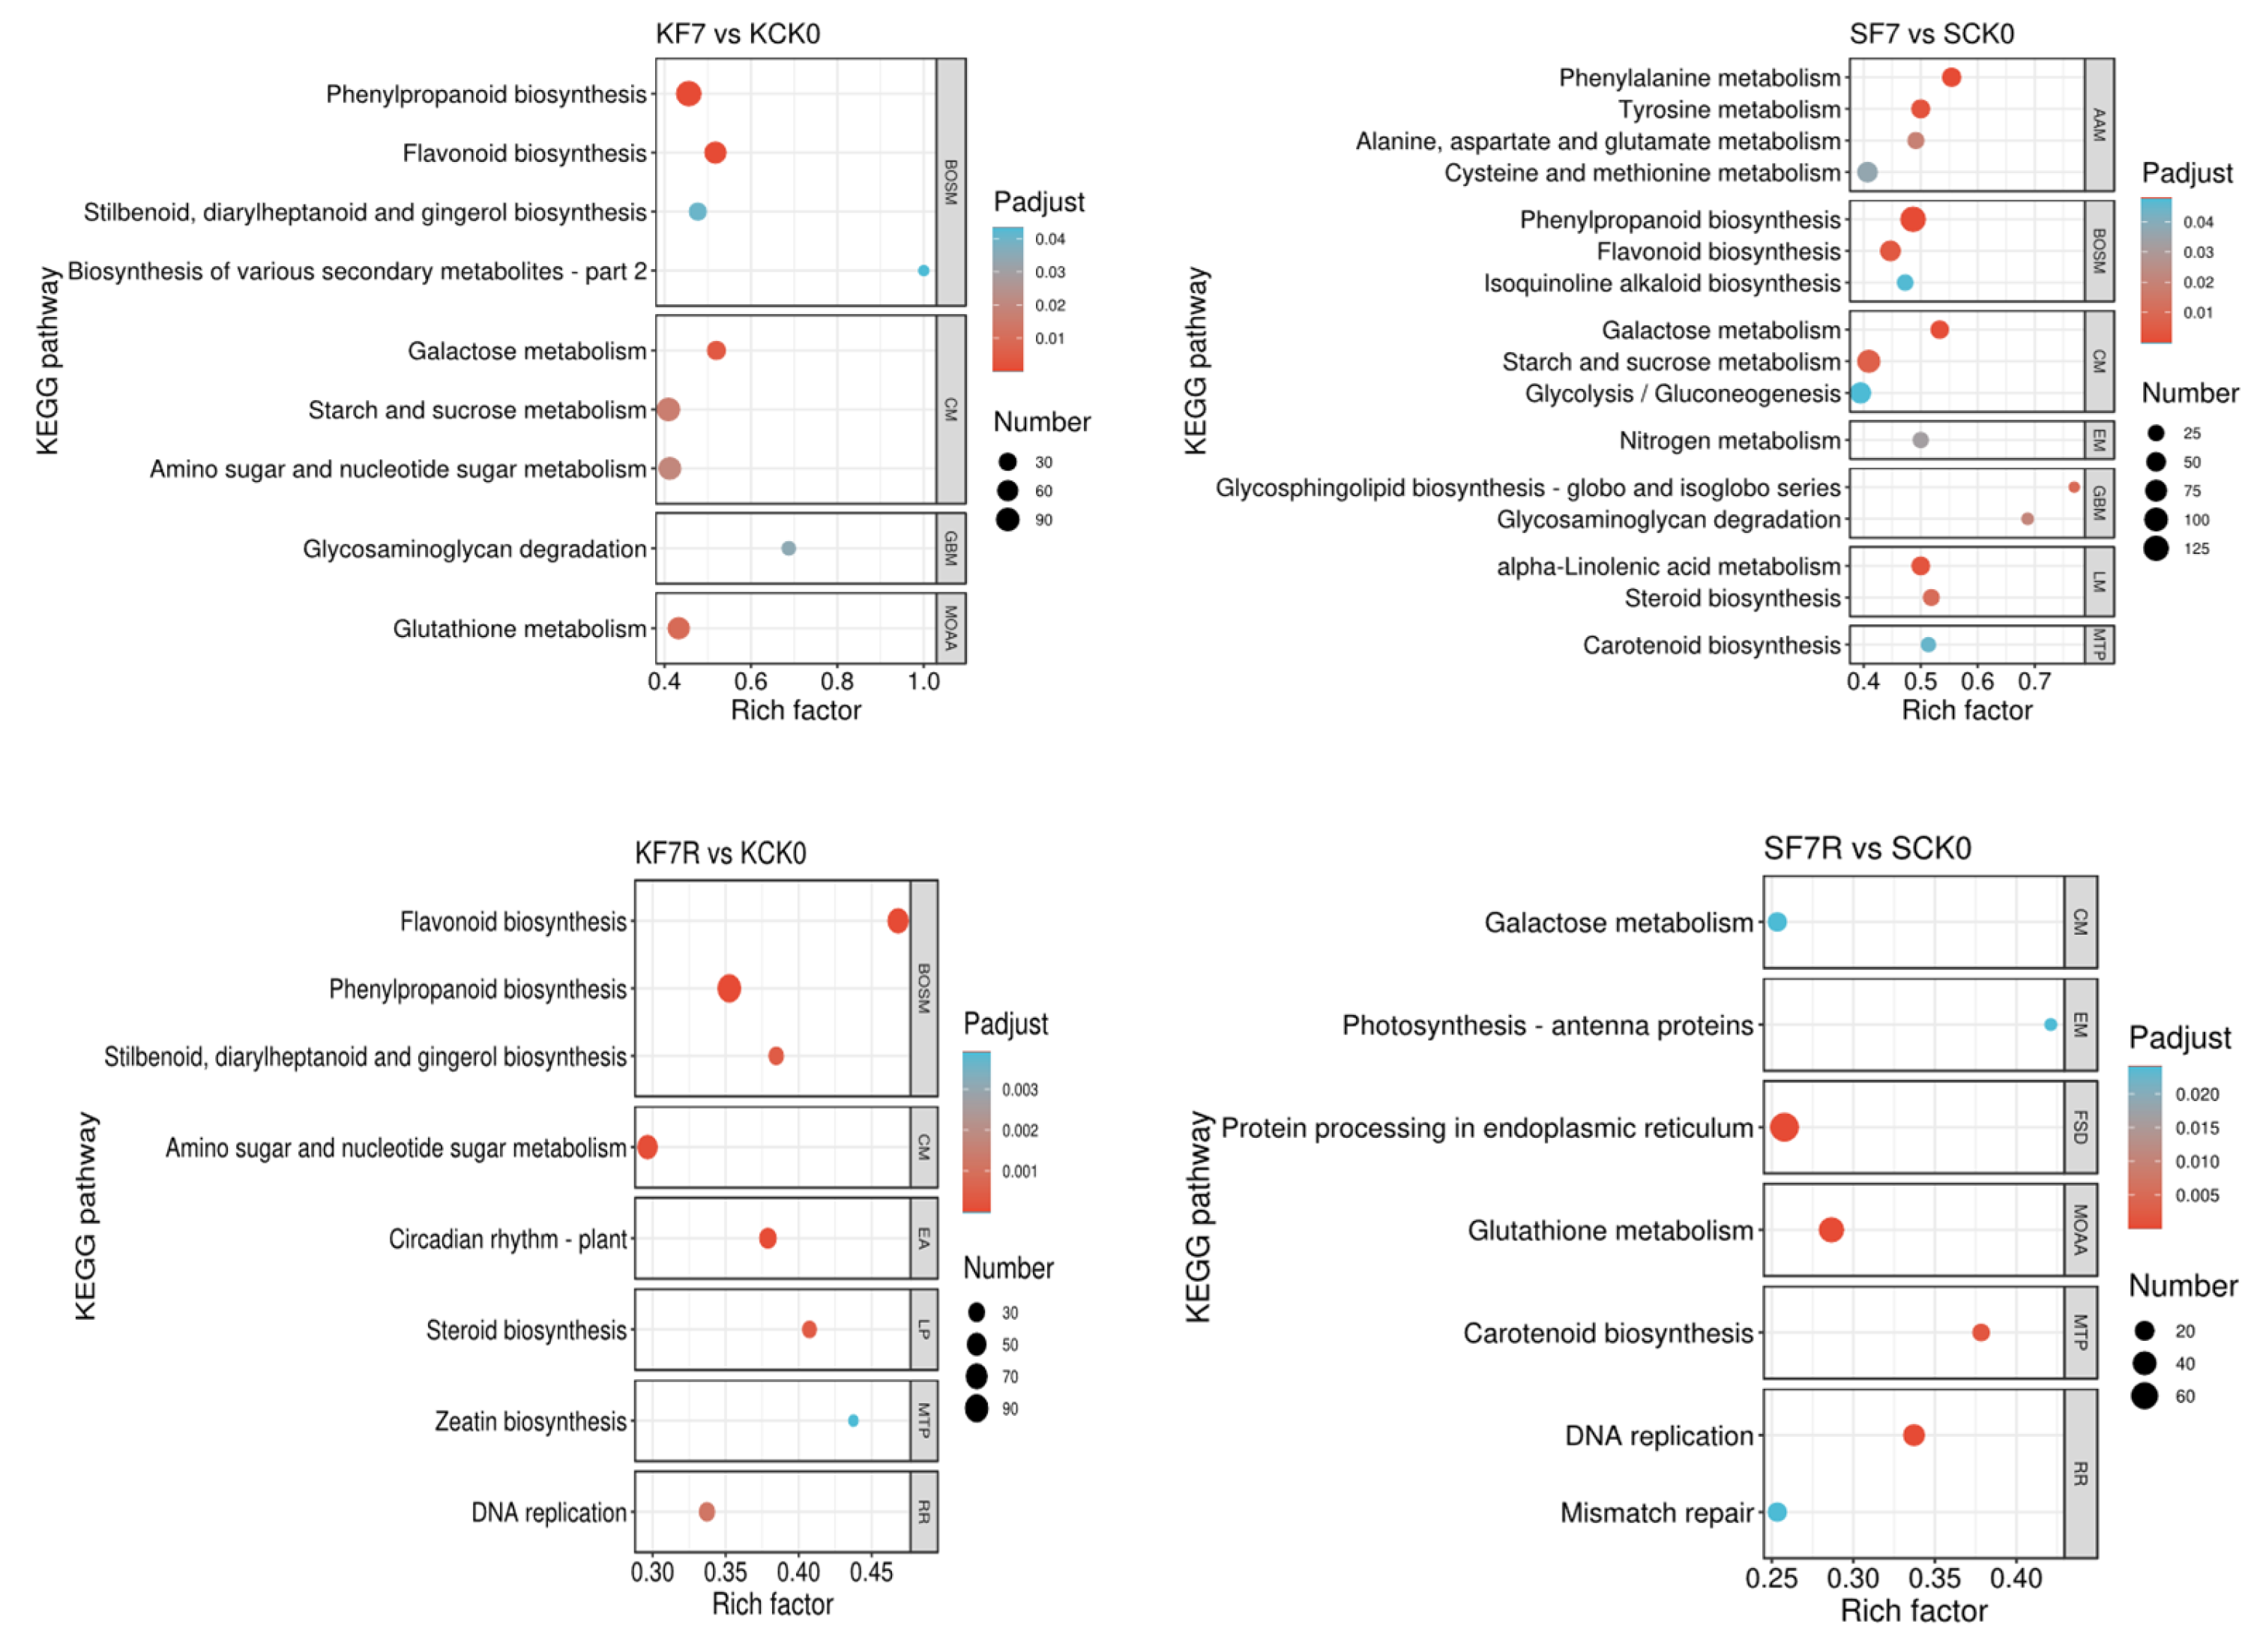
2.3. DEGs with Enriched Gene Ontology (GO) Terms and Kyoto Encyclopedia of Genes and Genomes (KEGG) Pathways

To understand the functions of the above DEGs, annotation and enrichment analyses were performed, according to the GO database (Supplementary Table S3). The DEGs for KF7 were enriched in 53 GO terms, including 21 in the biological process (BP) class, 10 in the cellular component (CC) class, and 22 in the molecular function (MF) class. Meanwhile, the DEGs for SF7 were enriched in 48 GO terms, totaling 22, 6, and 20 in the BP, CC, and MF classes, respectively. A few stress-related GO terms were found enriched in both KF7 and SF7, such as the response to hydrogen peroxide, oxidoreductase activity, signaling receptor activity, etc. Notably, however, several key GO terms related to how plants respond to flooding, such as detoxification and response to oxidative stress, were only enriched in SF7. For KF7R, its DEGs were enriched in 99 GO terms: 45 in the BP class, 19 in the CC class, and 35 in the MF class. In contrast, the DEGs for SF7R were enriched in only 76 GO terms, corresponding to 48, 9, and 19 in the BP, CC, and MF classes, respectively. Far fewer GO terms were similarly enriched in SF7R, indicating that the SO4 grapes might have recovered better than the Kyoho variety post-flooding. Many responsive GO terms were uniquely enriched in SF7R, including the responses to abiotic stimulus, hydrogen peroxide, osmotic stress, oxidative stress, and ROS, all of which could have helped SO4 grapevine seedlings better respond to potential oxidative damage after drainage.
DEGs were also enriched in a number of KEGG pathways in the two cultivars in response to the flooding and post-flooding conditions (Figure 2). The enriched pathways analysis between the treatment and control groups of the same cultivar revealed which pathway the transcriptional responses were focused on under a certain treatment. A number of enriched pathways were usually different between cultivars, and those different enriched pathways might explain how Kyoho and SO4 respond differently to flooding and post-flooding conditions. On day 7, DEGs were enriched in 9 and 16 pathways in the roots of Kyoho and SO4, respectively. Hence, there were seven more enriched pathways in SO4, which suggested that this cultivar was more active in response to flood stress at the transcriptional level. The phenylpropanoid biosynthesis pathway, flavonoid biosynthesis pathway, starch and sucrose metabolism pathway, glycosaminoglycan degradation pathway, and galactose metabolism pathway were all enriched in both cultivars. The DEGs in KF7 were uniquely enriched in the stilbenoid, diarylheptanoid, and gingerol biosynthesis pathways, the biosynthesis of various secondary metabolites–part 2 pathway, the amino sugar and nucleotide sugar metabolism pathway, and the glutathione metabolism pathway. A series of pathways involved in phytohormone biosynthesis were found to be uniquely enriched in SF7, such as the α-linolenic acid metabolism pathway (jasmonic acid, JA), the steroid biosynthesis pathway (BR), the cysteine and methionine metabolism pathway (ethylene, ETH), and the carotenoid biosynthesis pathway (abscisic acid, ABA). DEGs in SF7 were also enriched in the alanine, aspartate, and glutamate metabolism pathways, as well as the glycolysis/gluconeogenesis pathway, which are related to 4-aminobutaonate (GABA) biosynthesis and anaerobic respiration, respectively. After drainage and 3 days of recovery, DEGs were enriched in eight and seven pathways in the roots of Kyoho and SO4, respectively, but they were only co-enriched in the DNA replication pathway. The uniquely enriched pathways in KF7R included the following: the flavonoid biosynthesis pathway; the phenylpropanoid biosynthesis pathway; the stilbenoid, diarylheptanoid, and gingerol biosynthesis pathway; the amino sugar and nucleotide sugar metabolism pathway; the circadian rhythm-plant pathway; the steroid biosynthesis pathway; and the zeatin biosynthesis pathway. This pattern was highly similar to that for the enriched pathways in the roots of Kyoho and SO4 on day 7. However, the galactose metabolism pathway, photosynthesis-antenna proteins pathway, protein processing in endoplasmic reticulum pathway, glutathione metabolism pathway, carotenoid biosynthesis pathway, and mismatch repair pathway were exclusively enriched in SF7R. This indicated that the biosynthesis processes of plant hormones, proteins, and DNA were all active in the roots of SO4 during its post-flooding recovery.

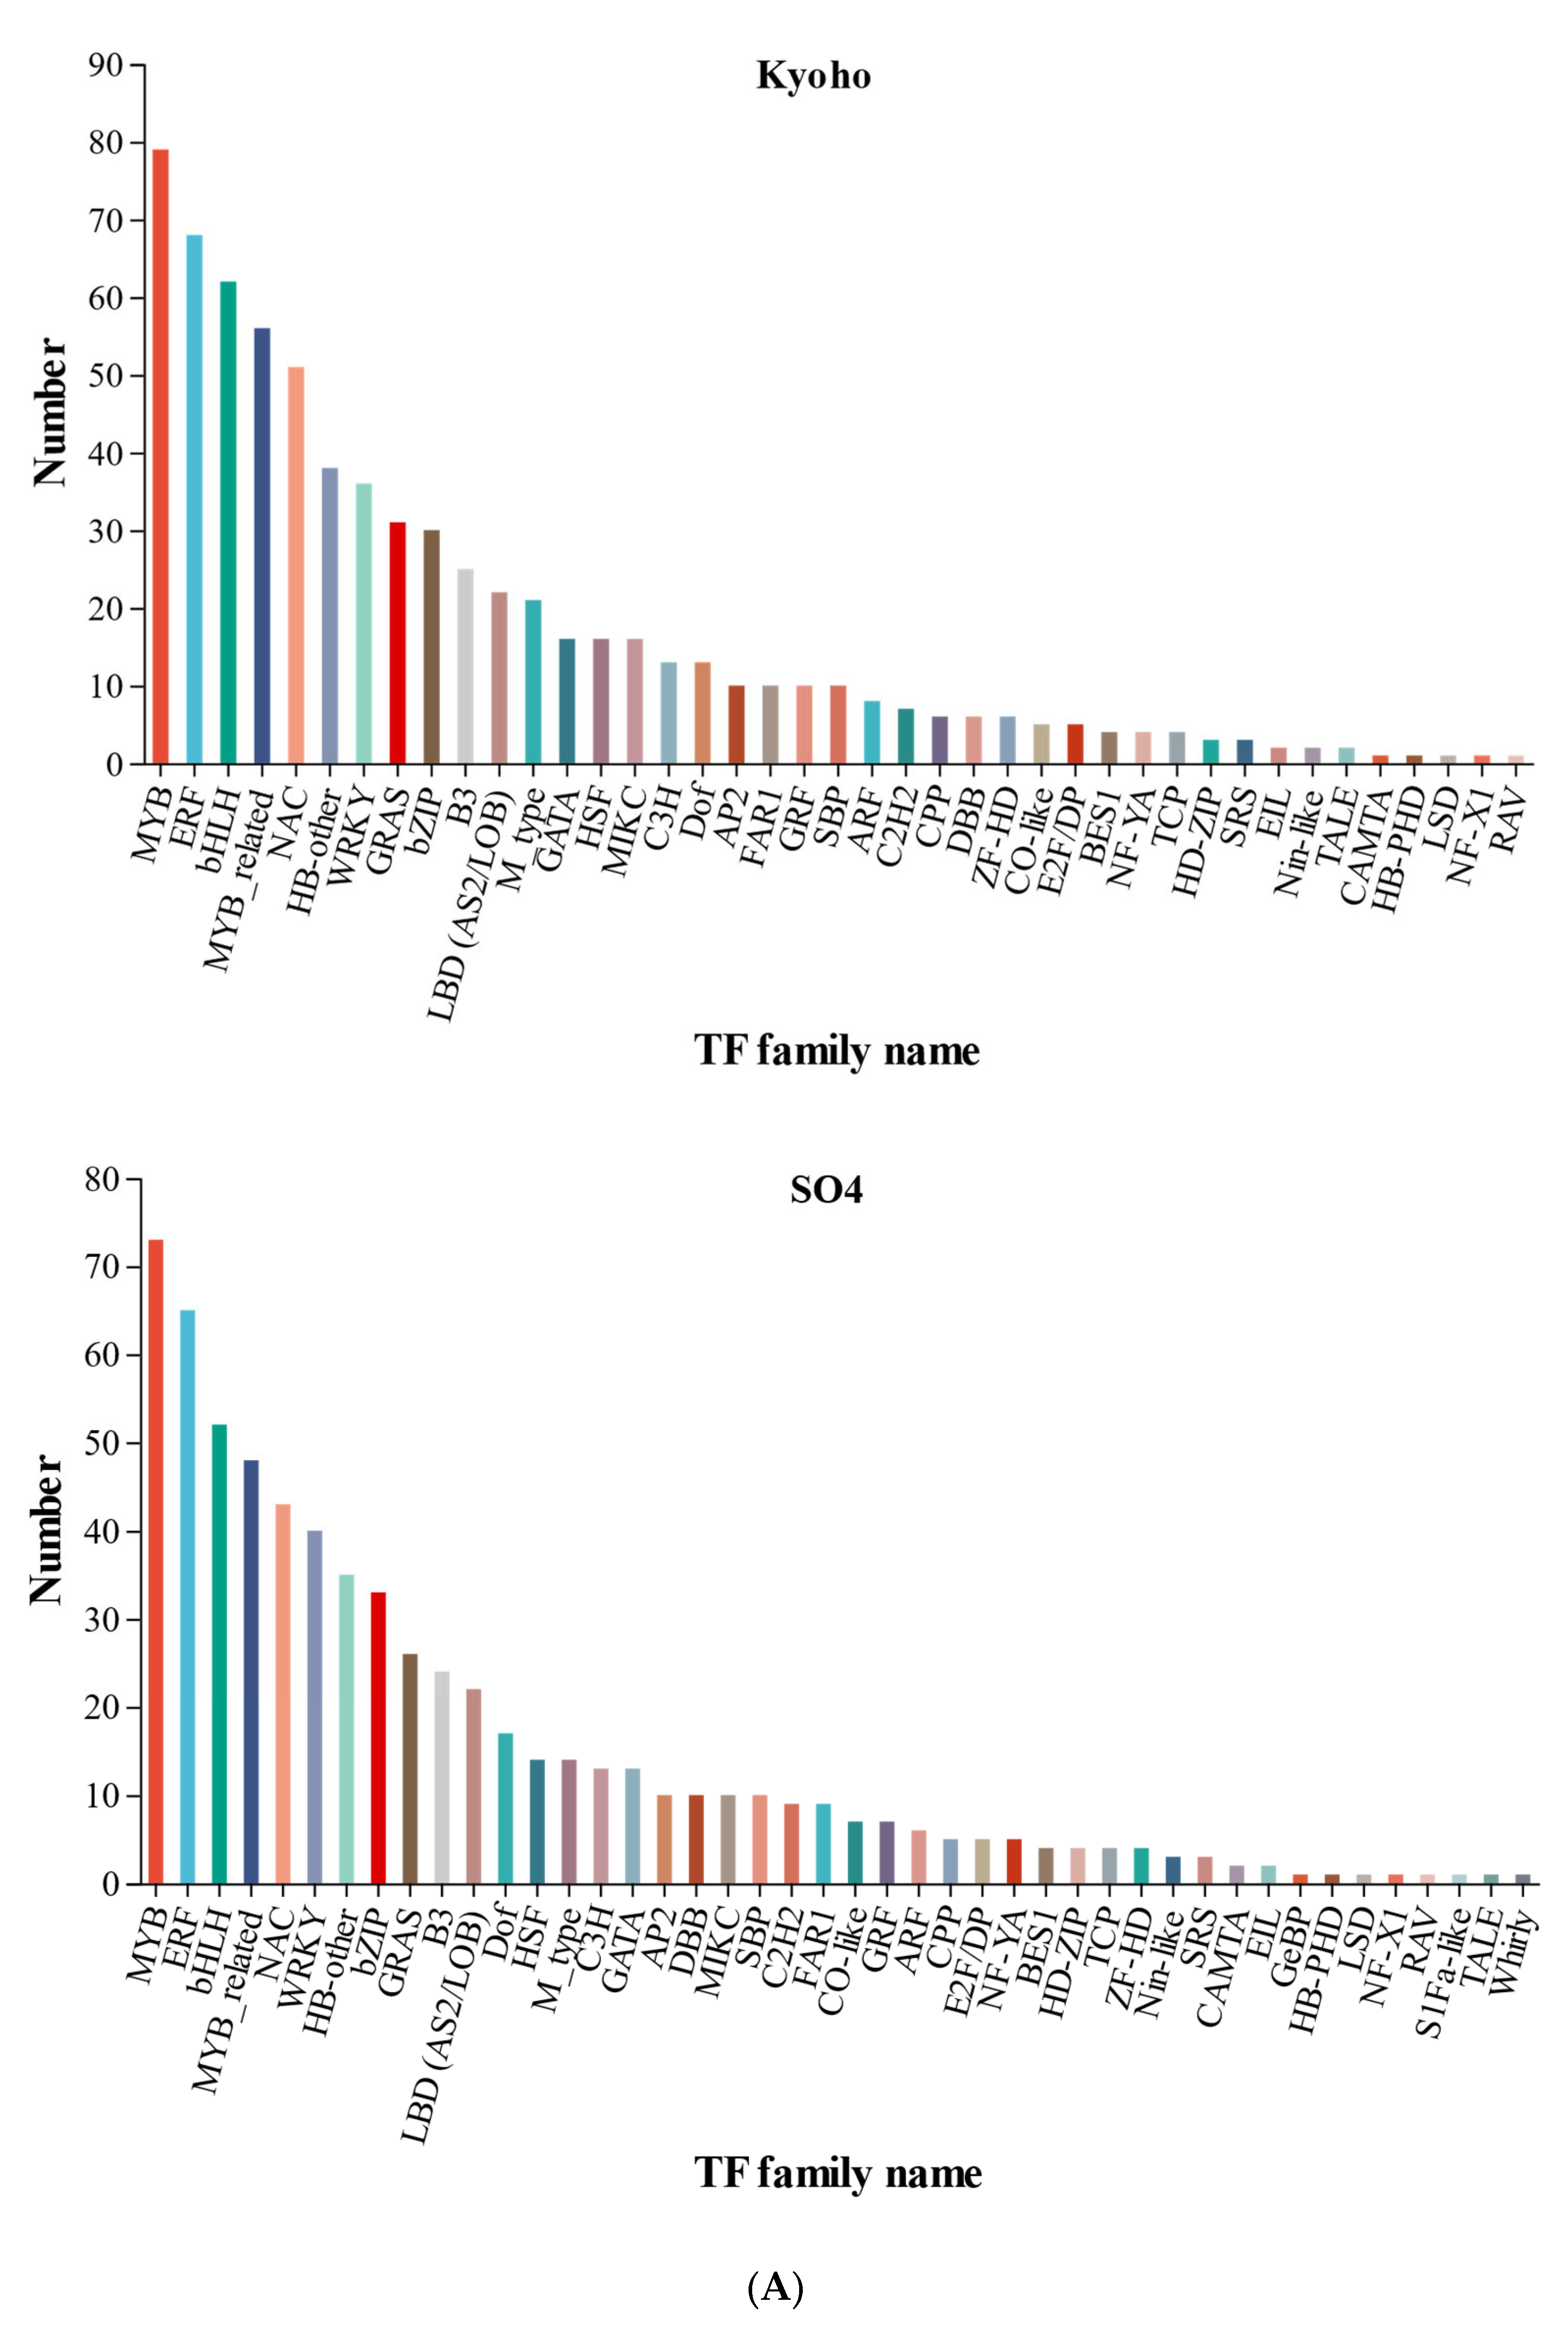
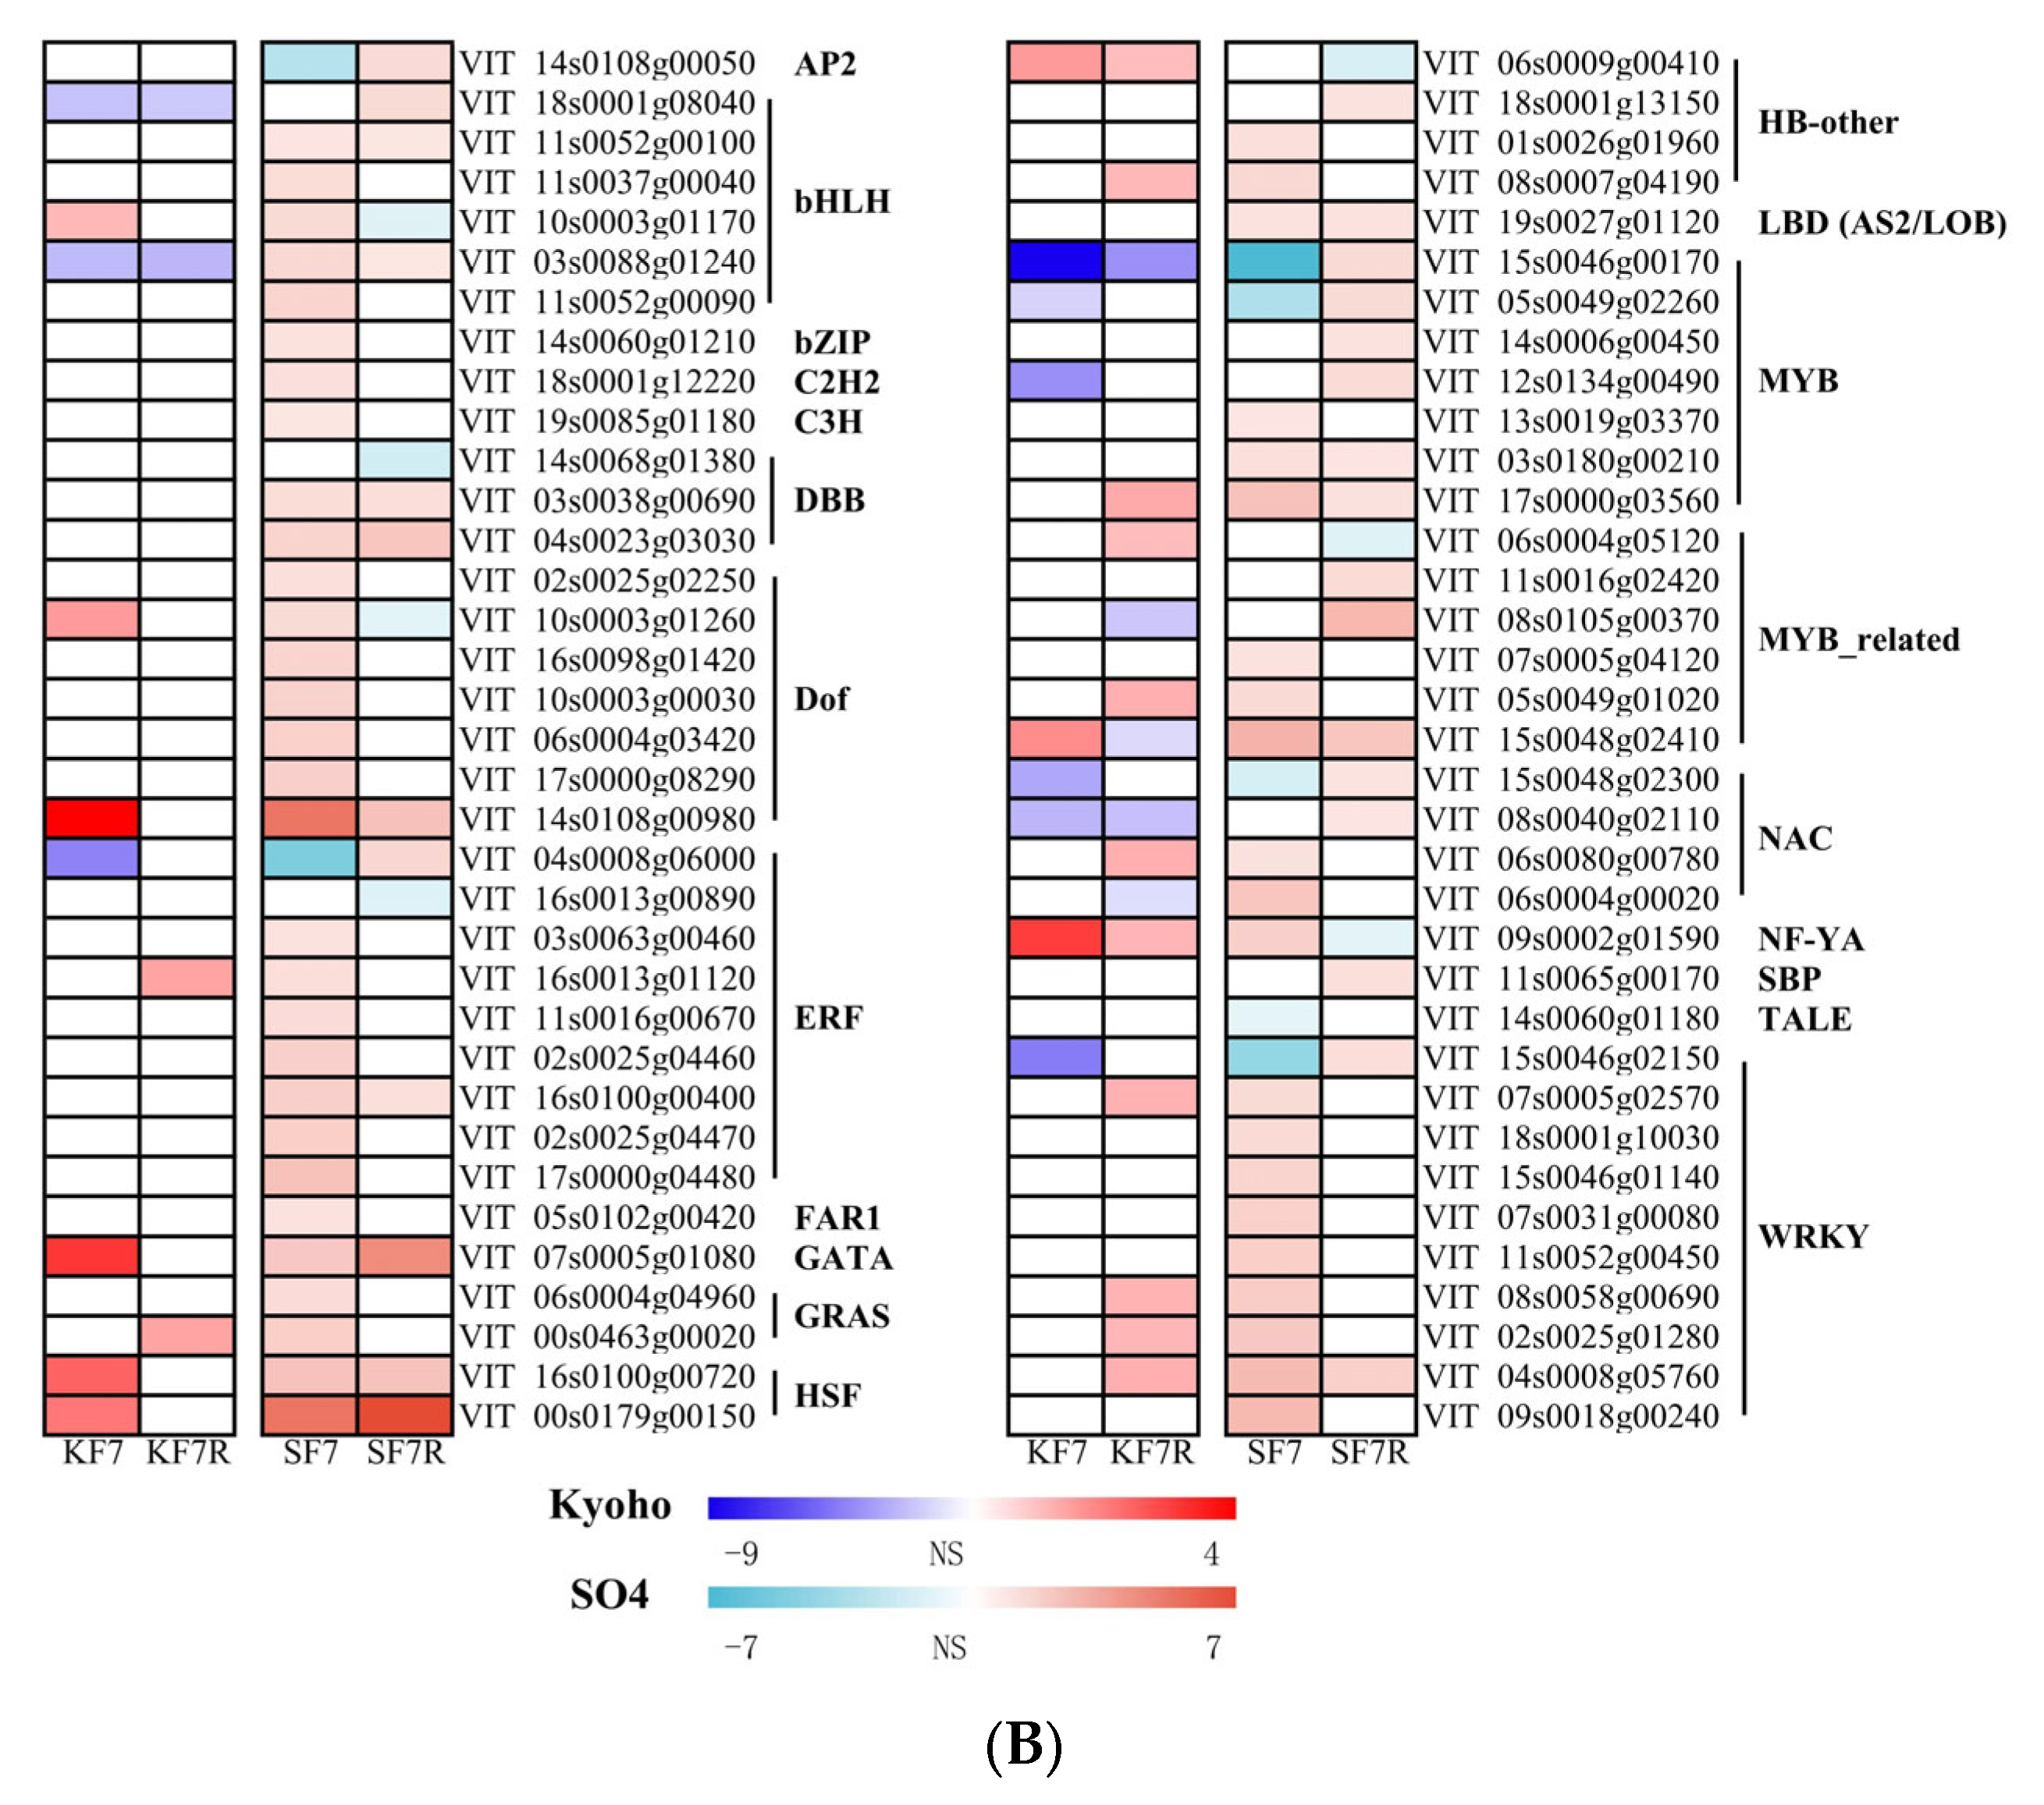
2.4. Differentially Responsive Transcription Factor Genes

Numerous genes encoding transcription factors (TFs) in response to flood and post-flooding conditions differed in expression between the roots of the Kyoho and SO4 cultivars. There were 705 differentially expressed TF genes in the Kyoho roots, either under flooding or during post-flooding conditions, relative to the control. These TF genes belonged to 41 families. The top-five families exhibiting the most DEGs were MYB (79 DEGs), ERF (68 DEGs), bHLH (62 DEGs), MYB-related (56 DEGs), and NAC (51 DEGs). For SF7 and SF7R, compared with its control (SCK0), 659 differentially expressed TF genes were detected in 45 families. The same top-five families harbored the most DEGs: MYB (73 DEGs), ERF (65 DEGs), bHLH (52 DEGs), MYB-related (48 DEGs), and NAC (43 DEGs). A single DEG in each GeBP family, S1Fa-like family, and Whirly family was only detected in SO4, but not in Kyoho (Figure 3A).
Several candidate TF genes were screened out based on their changing expression trends in response to flood stress or during post-flooding recovery, differing between Kyoho and SO4, or because they were DEGs limited to SO4, but not Kyoho (Figure 3B). These encoded TFs may play a vital role in augmenting the flood tolerance of SO4 versus Kyoho. Overall, 70 DEGs expressed at more than 10 TPM at least one time in each cultivar were selected, and they belonged to 21 families. The ERF and WRKY families had the most candidate TF genes (nine each). Both the MYB and Dof families had seven candidate TF genes each; the MYB-related family and bHLH family each had six candidate TF genes; the HB-other family and NAC family each had four candidate TF genes. The rest of the families each had one to three candidate TF genes. Among the 70 candidates, 42 were upregulated in SF7 vs. SCK0, yet they were not significantly changed in KF7 vs. KCK0, which suggested they might be key TF genes related to the flood response of grapevines. Further, 24 candidates were upregulated in SF7R vs. SCK0, but these were downregulated or not significantly changed in KF7 vs. KCK0; hence, they might be key TF genes enabling a post-flooding recovery.

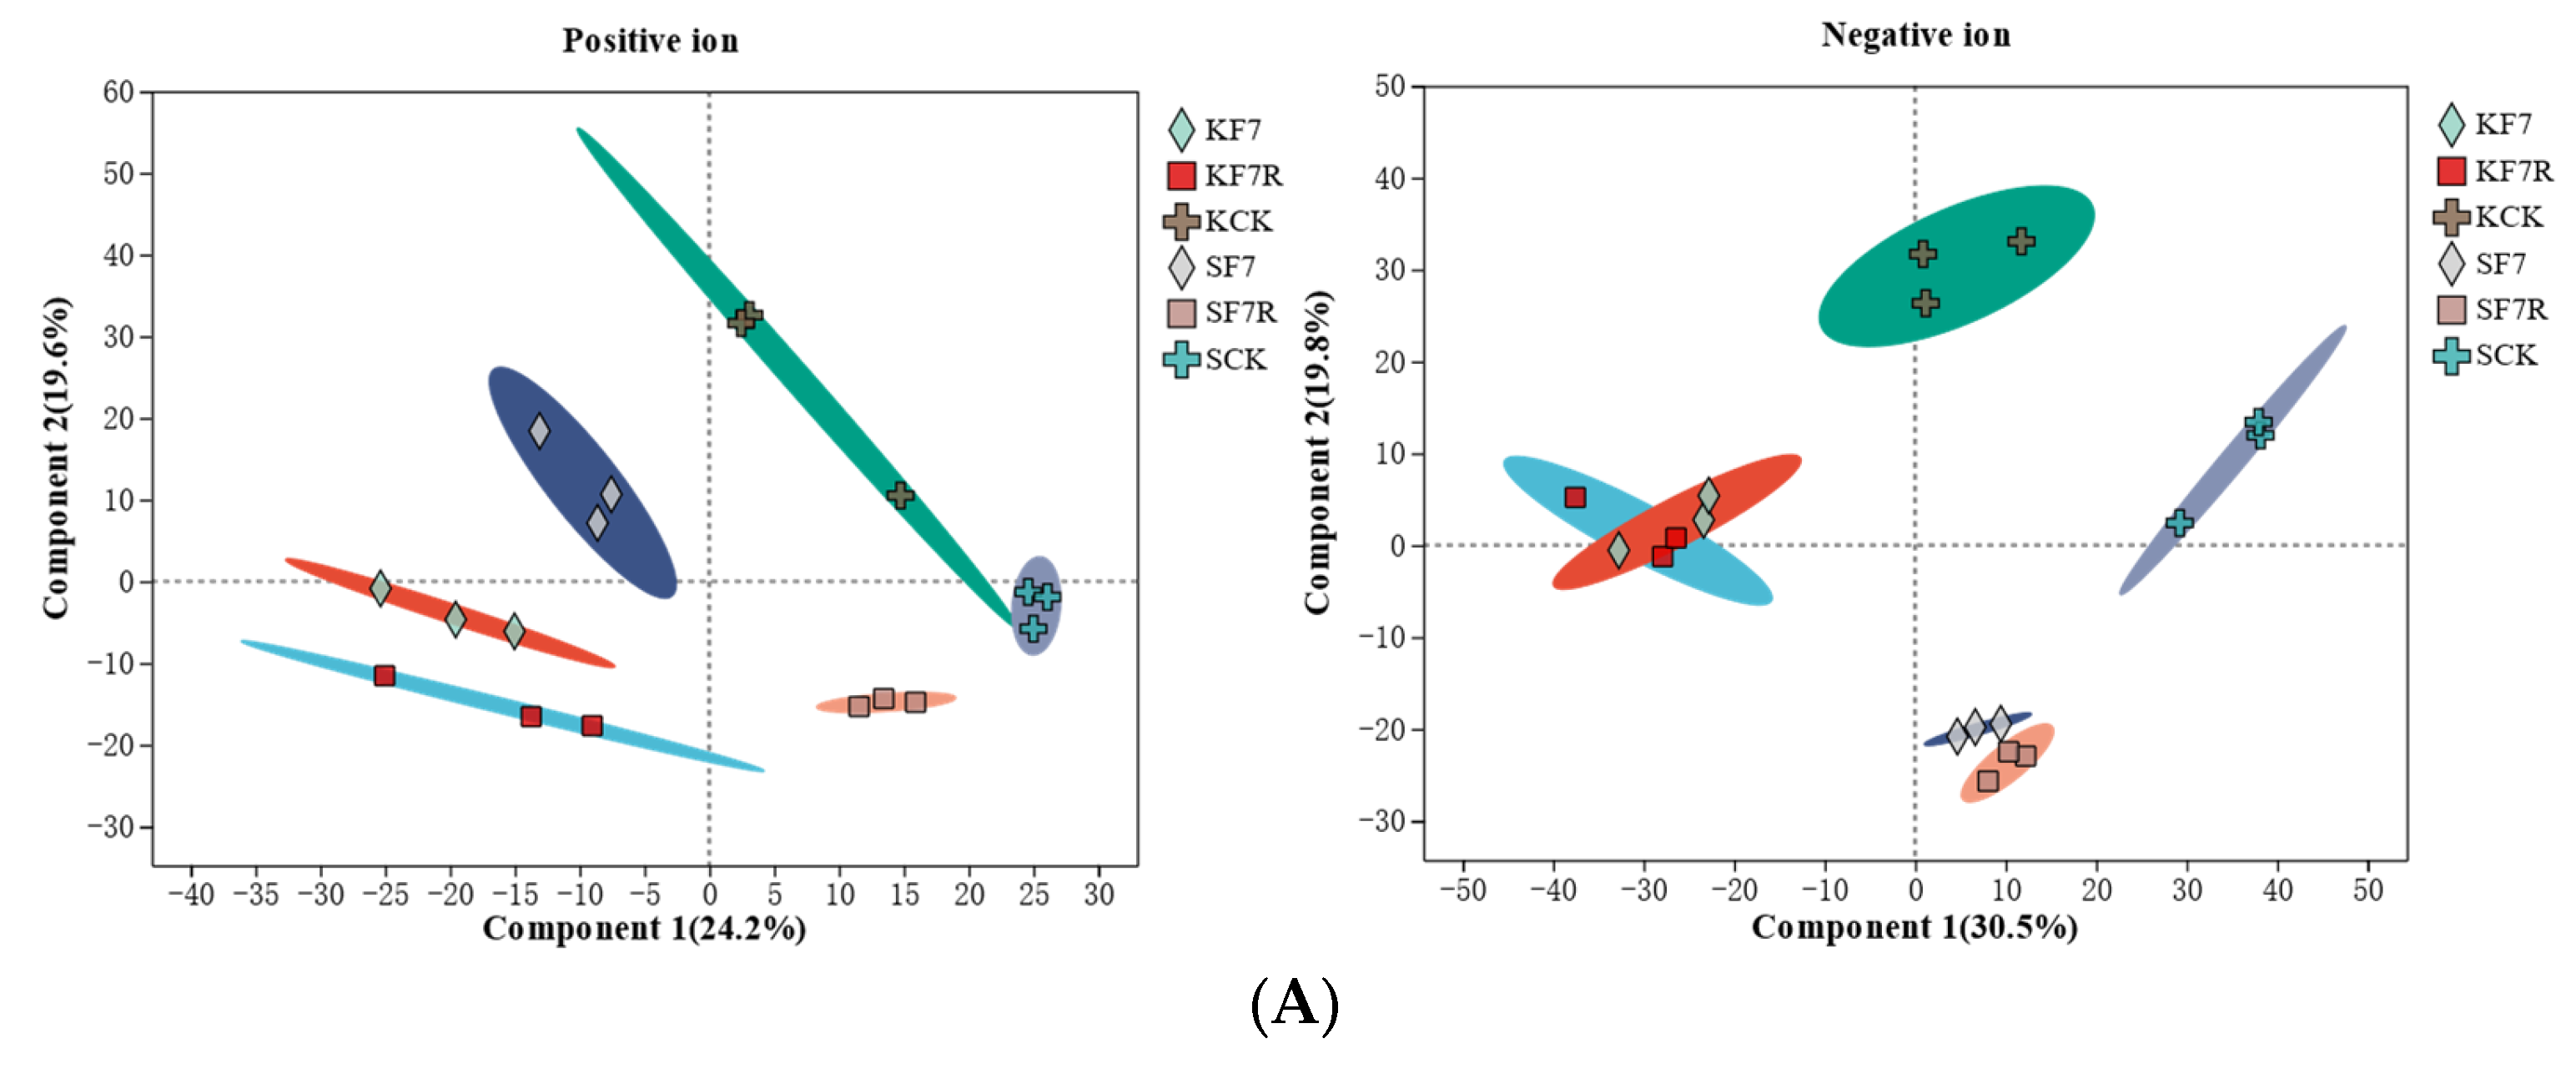
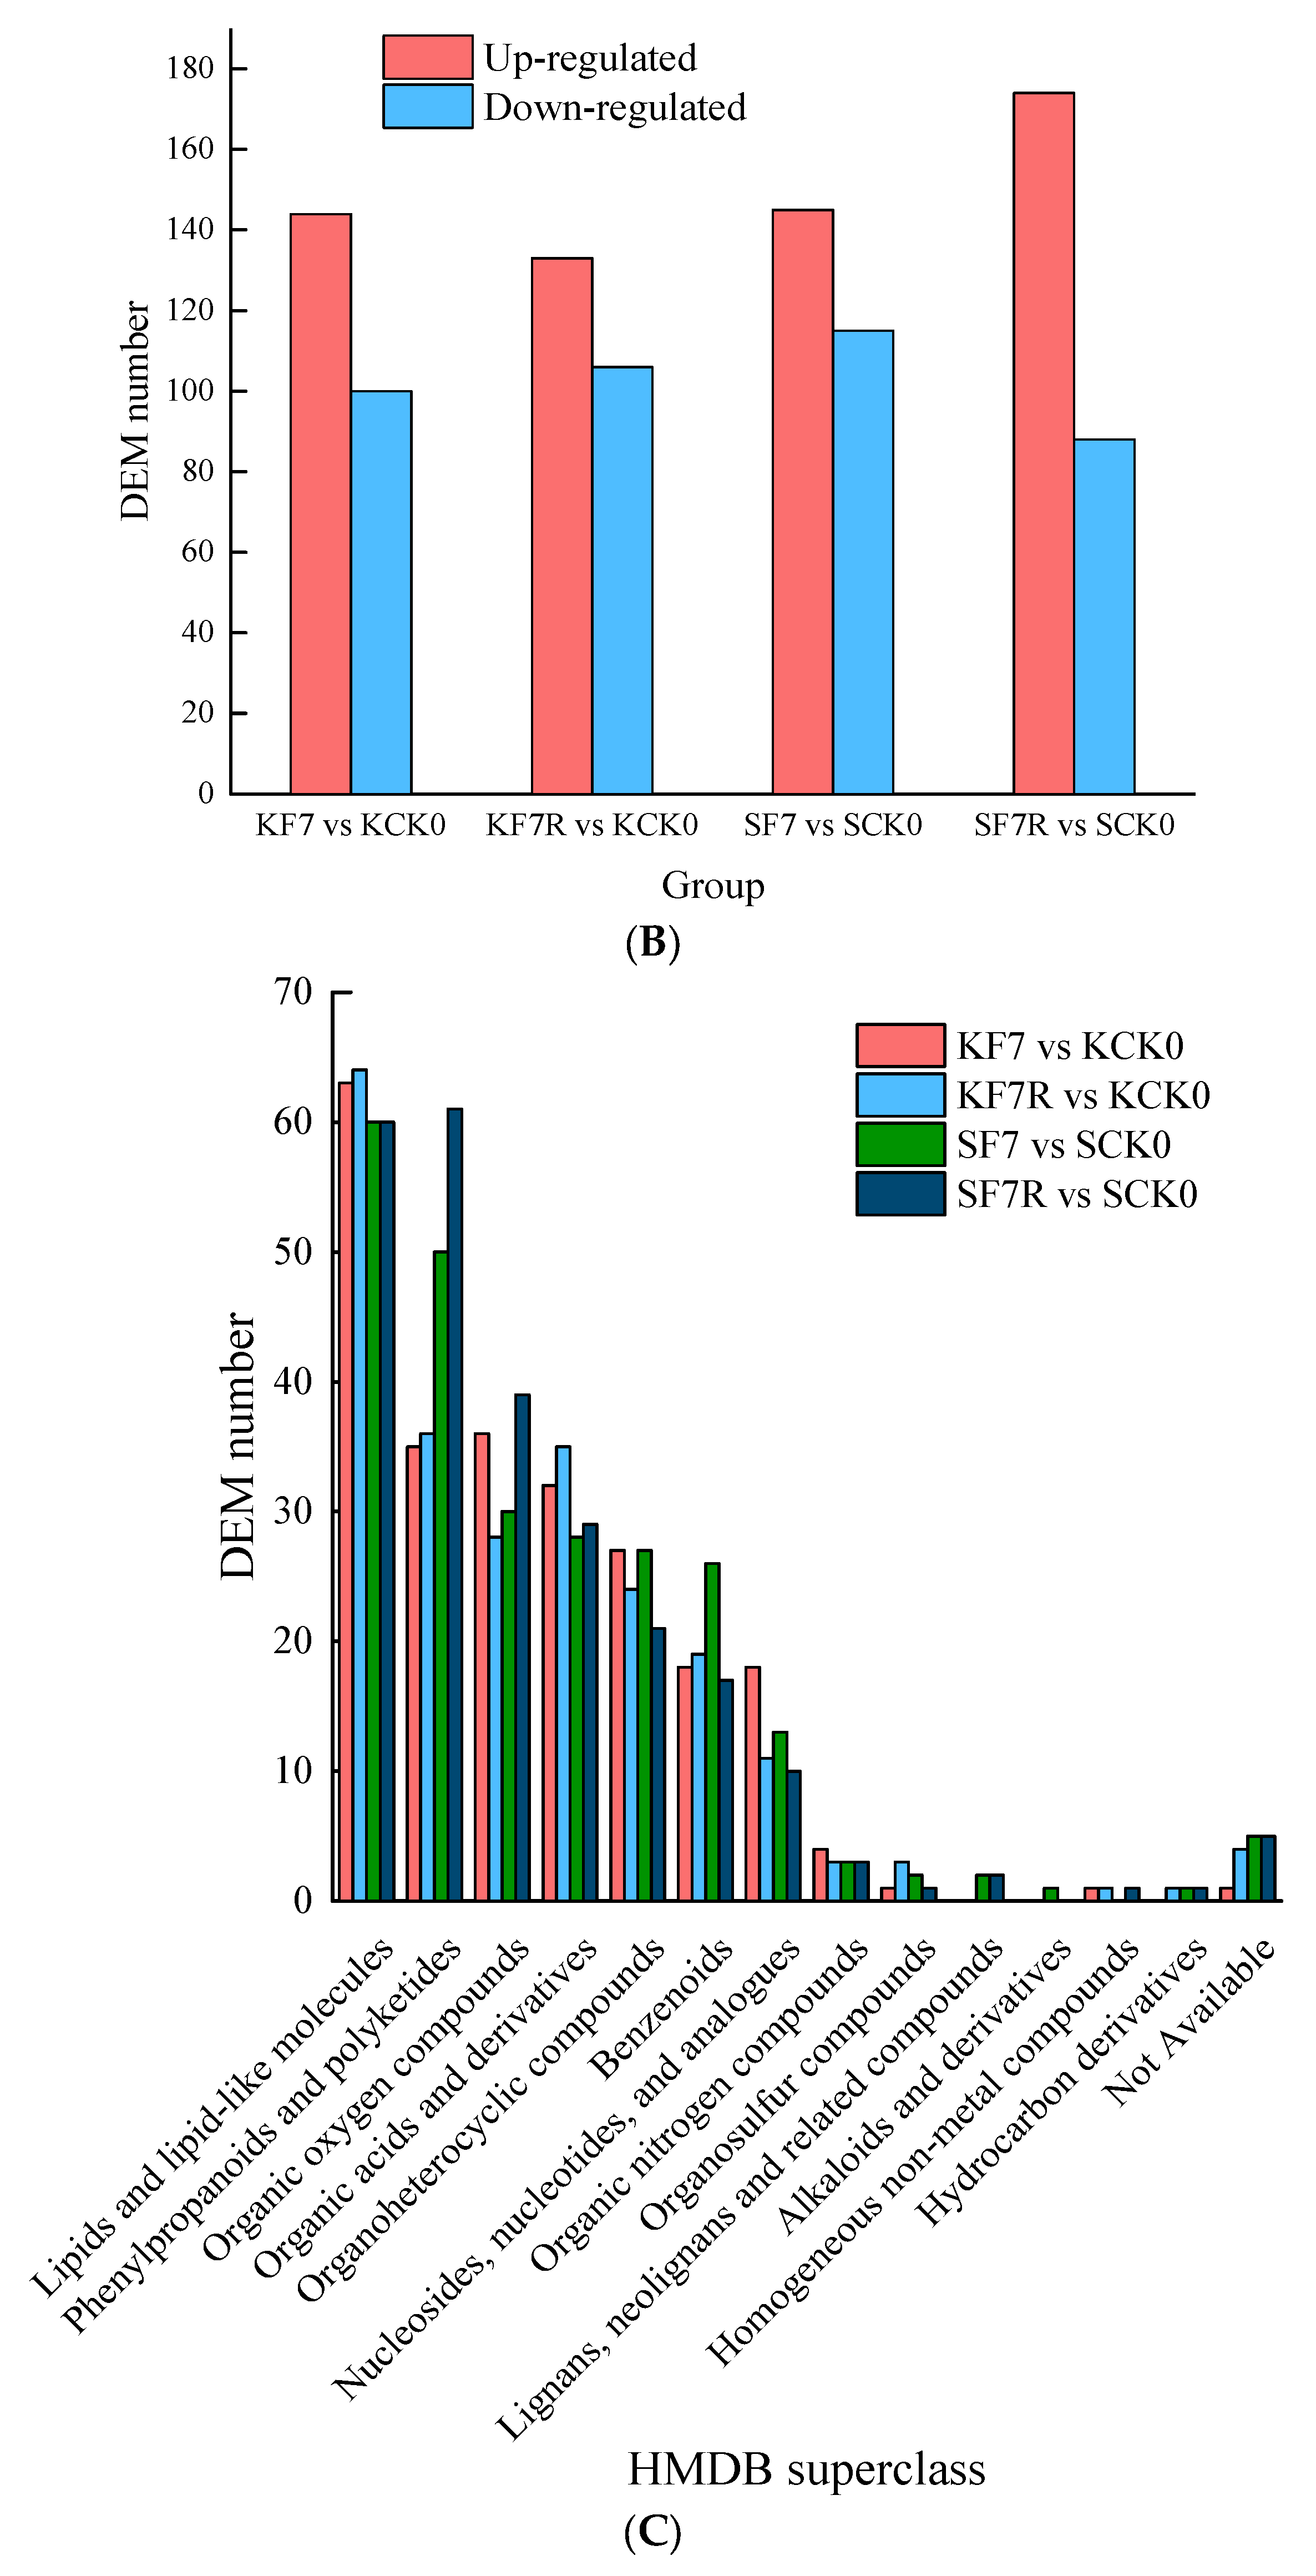
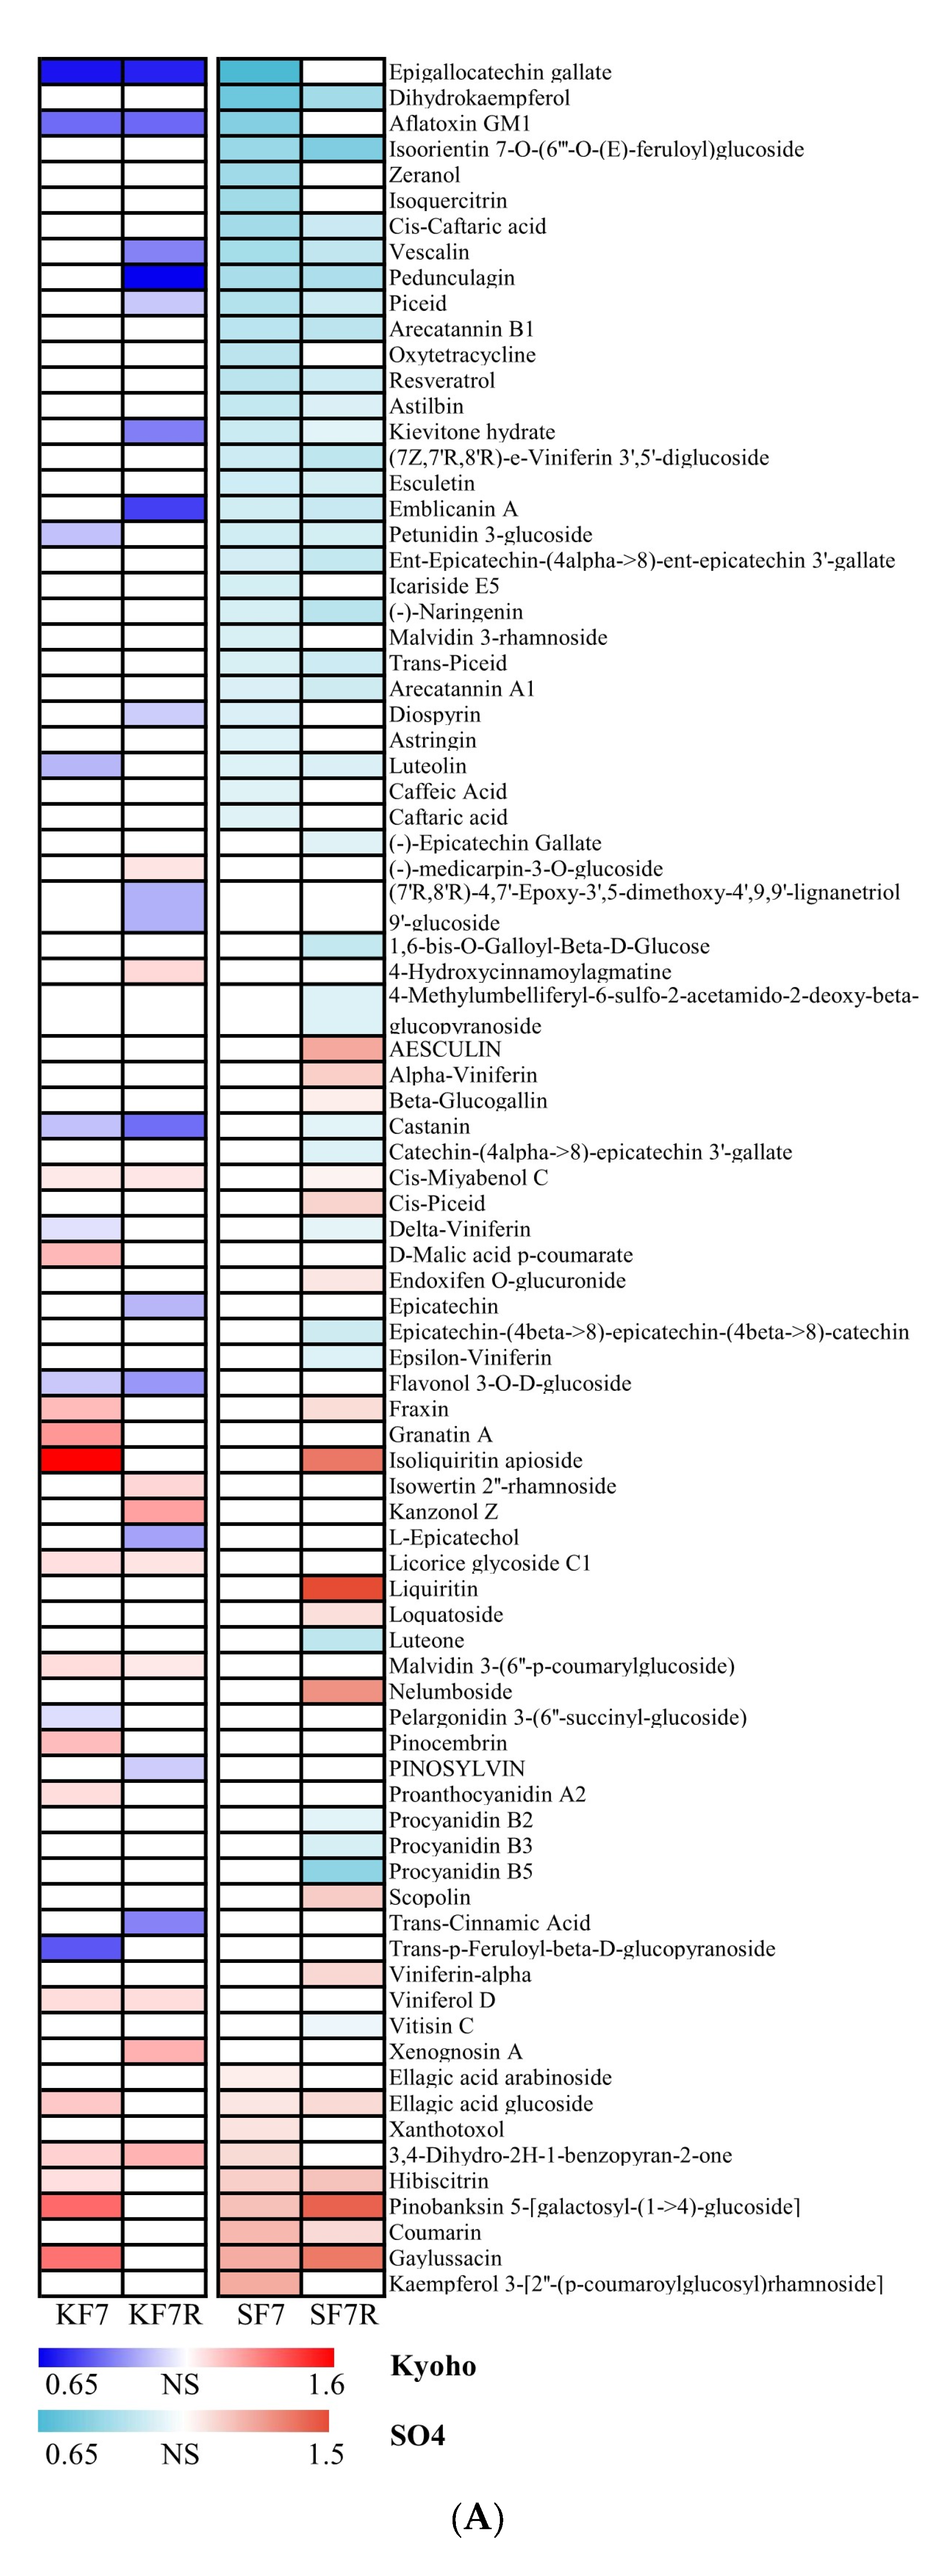
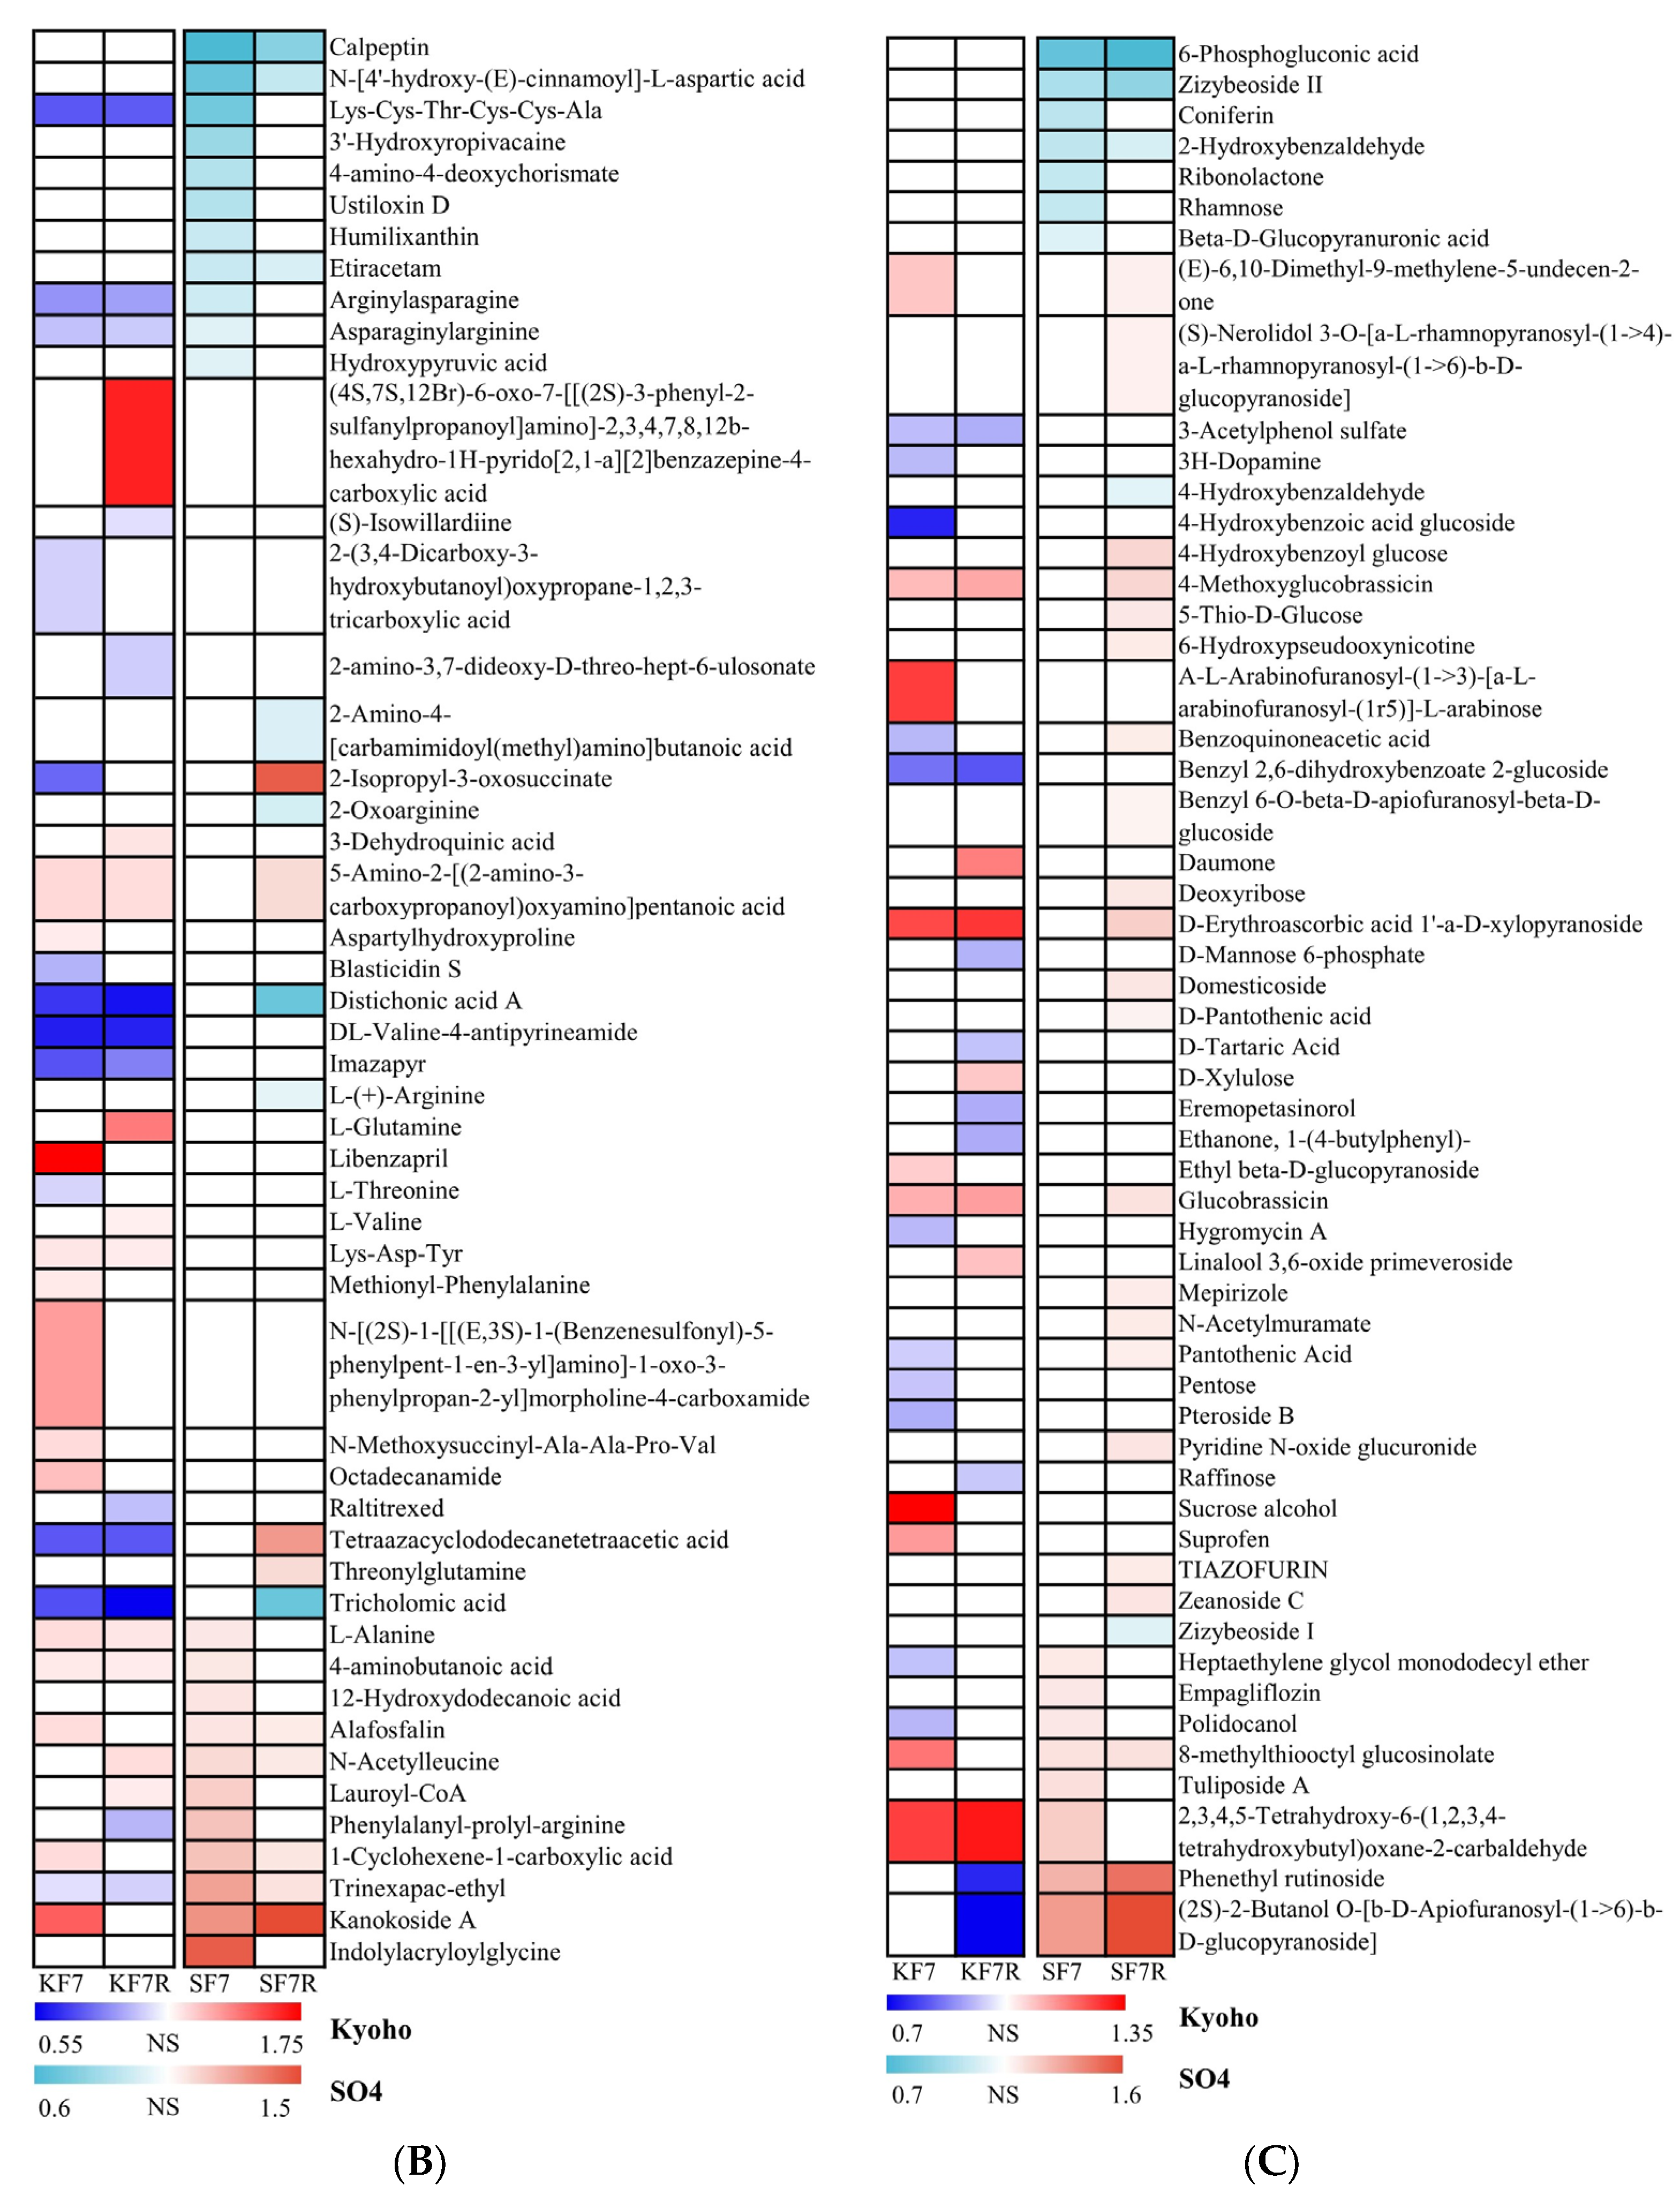
2.5. Differential Metabolites in Response to Flooding and Post-Flooding Stress Conditions

The patterning of the root metabolomes also changed in different ways between the Kyoho and SO4 cultivars during flooding and post-flooding conditions (Figure 4). The partial least squares discrimination analysis (PLS-DA) results showed that the metabolic traits of flood-treated and recovering grapevines were clearly separated from their controls and between cultivars (Figure 4A). In the PLS-DA of positive ions, the relationships among the three groups of SO4 were tighter than for those of Kyoho, suggesting that flood stress is more harmful to the Kyoho cultivar. In contrast, in the PLS-DA of the negative ions, KF7 and KF7R were not separated, which indicated the poor ability of Kyoho to recover from flooding.
In the metabolomics analysis based on LC-MS, a total of 970 metabolites were identified (Supplementary Table S4), of which 529 were differentially expressed metabolites (DEMs) (Supplementary Table S5). For KF7, 144 upregulated and 100 downregulated DEMs were identified in comparison with KCK0, while the numbers for SF7 were 145 and 133, respectively, in comparison with SCK0. For KF7R, 133 upregulated and 106 downregulated DEMs were identified relative to KCK0, whereas for SF7R vis-à-vis SCK0, 174 upregulated DEMs and 88 downregulated DEMs were distinguishable (Figure 4B). The DEMs were then classified into 13 human metabolome database (HMDB) superclasses (Figure 4C). The seven superclasses containing the more than 10 DEMs were the lipids and lipid-like molecules superclass, the phenylpropanoids and polyketides superclass, the organic oxygen compounds superclass, the organic acids and derivatives superclass, the organoheterocyclic compounds superclass, the benzenoids superclass, and the nucleosides, nucleotides and analogues superclass. More DEMs were assigned to the lipids and lipid-like molecules superclass and organic acids and derivatives superclass in Kyoho than in SO4, while significantly more DEMs were identified in SO4 than Kyoho in the superclass of phenylpropanoids and polyketides, as well as benzenoids. Regarding the organic oxygen compounds superclass, more DEGs were found in KF7 and SF7R in comparison with their controls than in KF7R and SF7. In the organoheterocyclic compounds superclass and the nucleosides, nucleotides, and analogues superclass, the DEM numbers were larger under flooding than post-flooding conditions.
DEMs whose abundances responded differently during the flooding and post-flooding conditions between Kyoho and SO4—namely, those in the phenylpropanoids and polyketides superclass, the organic acids and their derivatives superclass, and the organic oxygen compounds superclass—are listed in Figure 5. Most DEMs in the phenylpropanoids and polyketides superclass were secondary metabolites with strong antioxidant activities, such as dihydrokaempferol, resveratrol, naringenin, epicatechin, procyanidins, and scopoline (Figure 5A). Therefore, SO4 might exhibit a stronger tolerance to flood stress and reoxygenation stress during the post-flooding stage than Kyoho, given that more of the former’s antioxidant metabolites responded to the treatment (Figure 4C). In the organic acids and their derivatives superclass, DEMs mostly participated in amino acid metabolism, including that of arginine, threonine, valine, glutamine, alanine, etc. (Figure 5B). Interestingly, 4-aminobutanoic acid, a stress-related metabolite, was more abundant in the KF7, SF7, and KF7R seedlings than in the corresponding controls under flooding conditions, whereas the content recovered to control level in SF7R; this indicated that SO4 might no longer be in a stressed state after recovering for 3 days. Regarding the organic oxygen compounds superclass, these DEMs were mostly involved in carbohydrate metabolism, being highly related to energy supplementation in plants. Compared with their controls, far more DEMs reached a higher abundance in SF7R than KF7R seedlings, indicating that SO4 underwent vigorous post-flooding recovery in terms of the carbohydrate metabolism of its roots (Figure 5C).

2.6. Integrative Analysis of Transcriptomic and Metabolomic Data

Next, the DEGs and DEMs were simultaneously subjected to a combined analysis to determine the joint changes involved in the grapevine response to flooding and post-flooding stress conditions (Figure 6). Evidently, the transcriptomic data and metabolomic data were in good correlation, as shown by the Procrustes analysis (Figure 6A). In the SO4 roots, three groups were completely separated, while in the Kyoho roots, the KF7 and KF7R groups were not significantly divided; this suggested that the KF7R seedlings remained in a similar state to that experienced during flooding. The number of KEGG pathways enriched (p < 0.05) by at least one of the DEGs and DEMs for the KF7, KF7R, SF7, and SF7R groups was respectively 41, 30, 41, and 25 (Figure 6B). On day 7, the DEGs and DEMs were co-enriched in the taurine and hypotaurine metabolism, phenylalanine metabolism, flavonoid biosynthesis, alpha-linolenic acid metabolism, and linoleic acid metabolism pathways in bots cultivars. In the KF7 group, the zeatin biosynthesis pathway was the sole uniquely co-enriched pathway found. In stark contrast, the tyrosine metabolism, cysteine and methionine metabolism, and the alanine, aspartate and glutamate metabolism pathways were exclusively co-enriched in the SF7 group. After the 3-day recovery period, for KF7R, its co-enriched pathways were the zeatin biosynthesis, ABC transporters, and linoleic acid metabolism pathways, while for SF7R, only the flavonoid biosynthesis pathway was co-enriched. Additionally, many pathways related to plant stress responses were also enriched by either the DEGs or DEMs, namely the glutathione metabolism; cysteine and methionine metabolism; starch and sucrose metabolism; carotenoid biosynthesis; diterpenoid biosynthesis; steroid biosynthesis; ascorbate and aldarate metabolism; and the phenylpropanoid biosynthesis pathways.

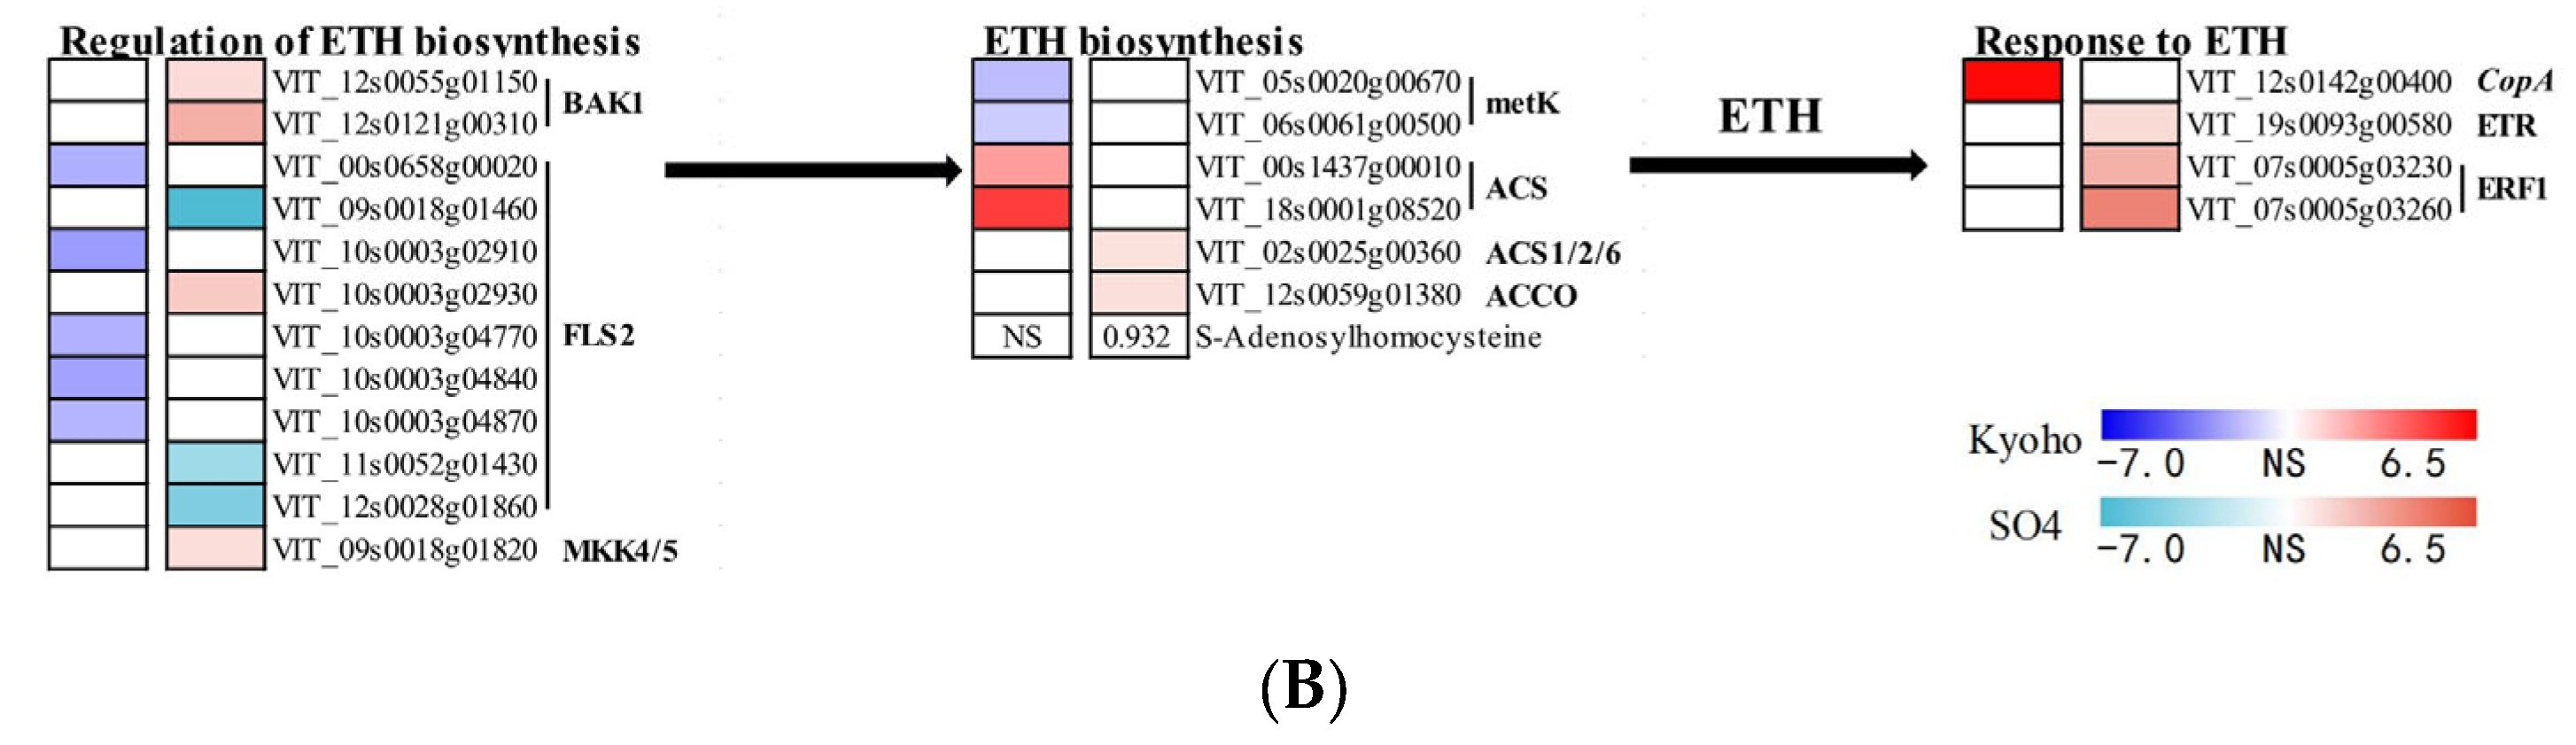
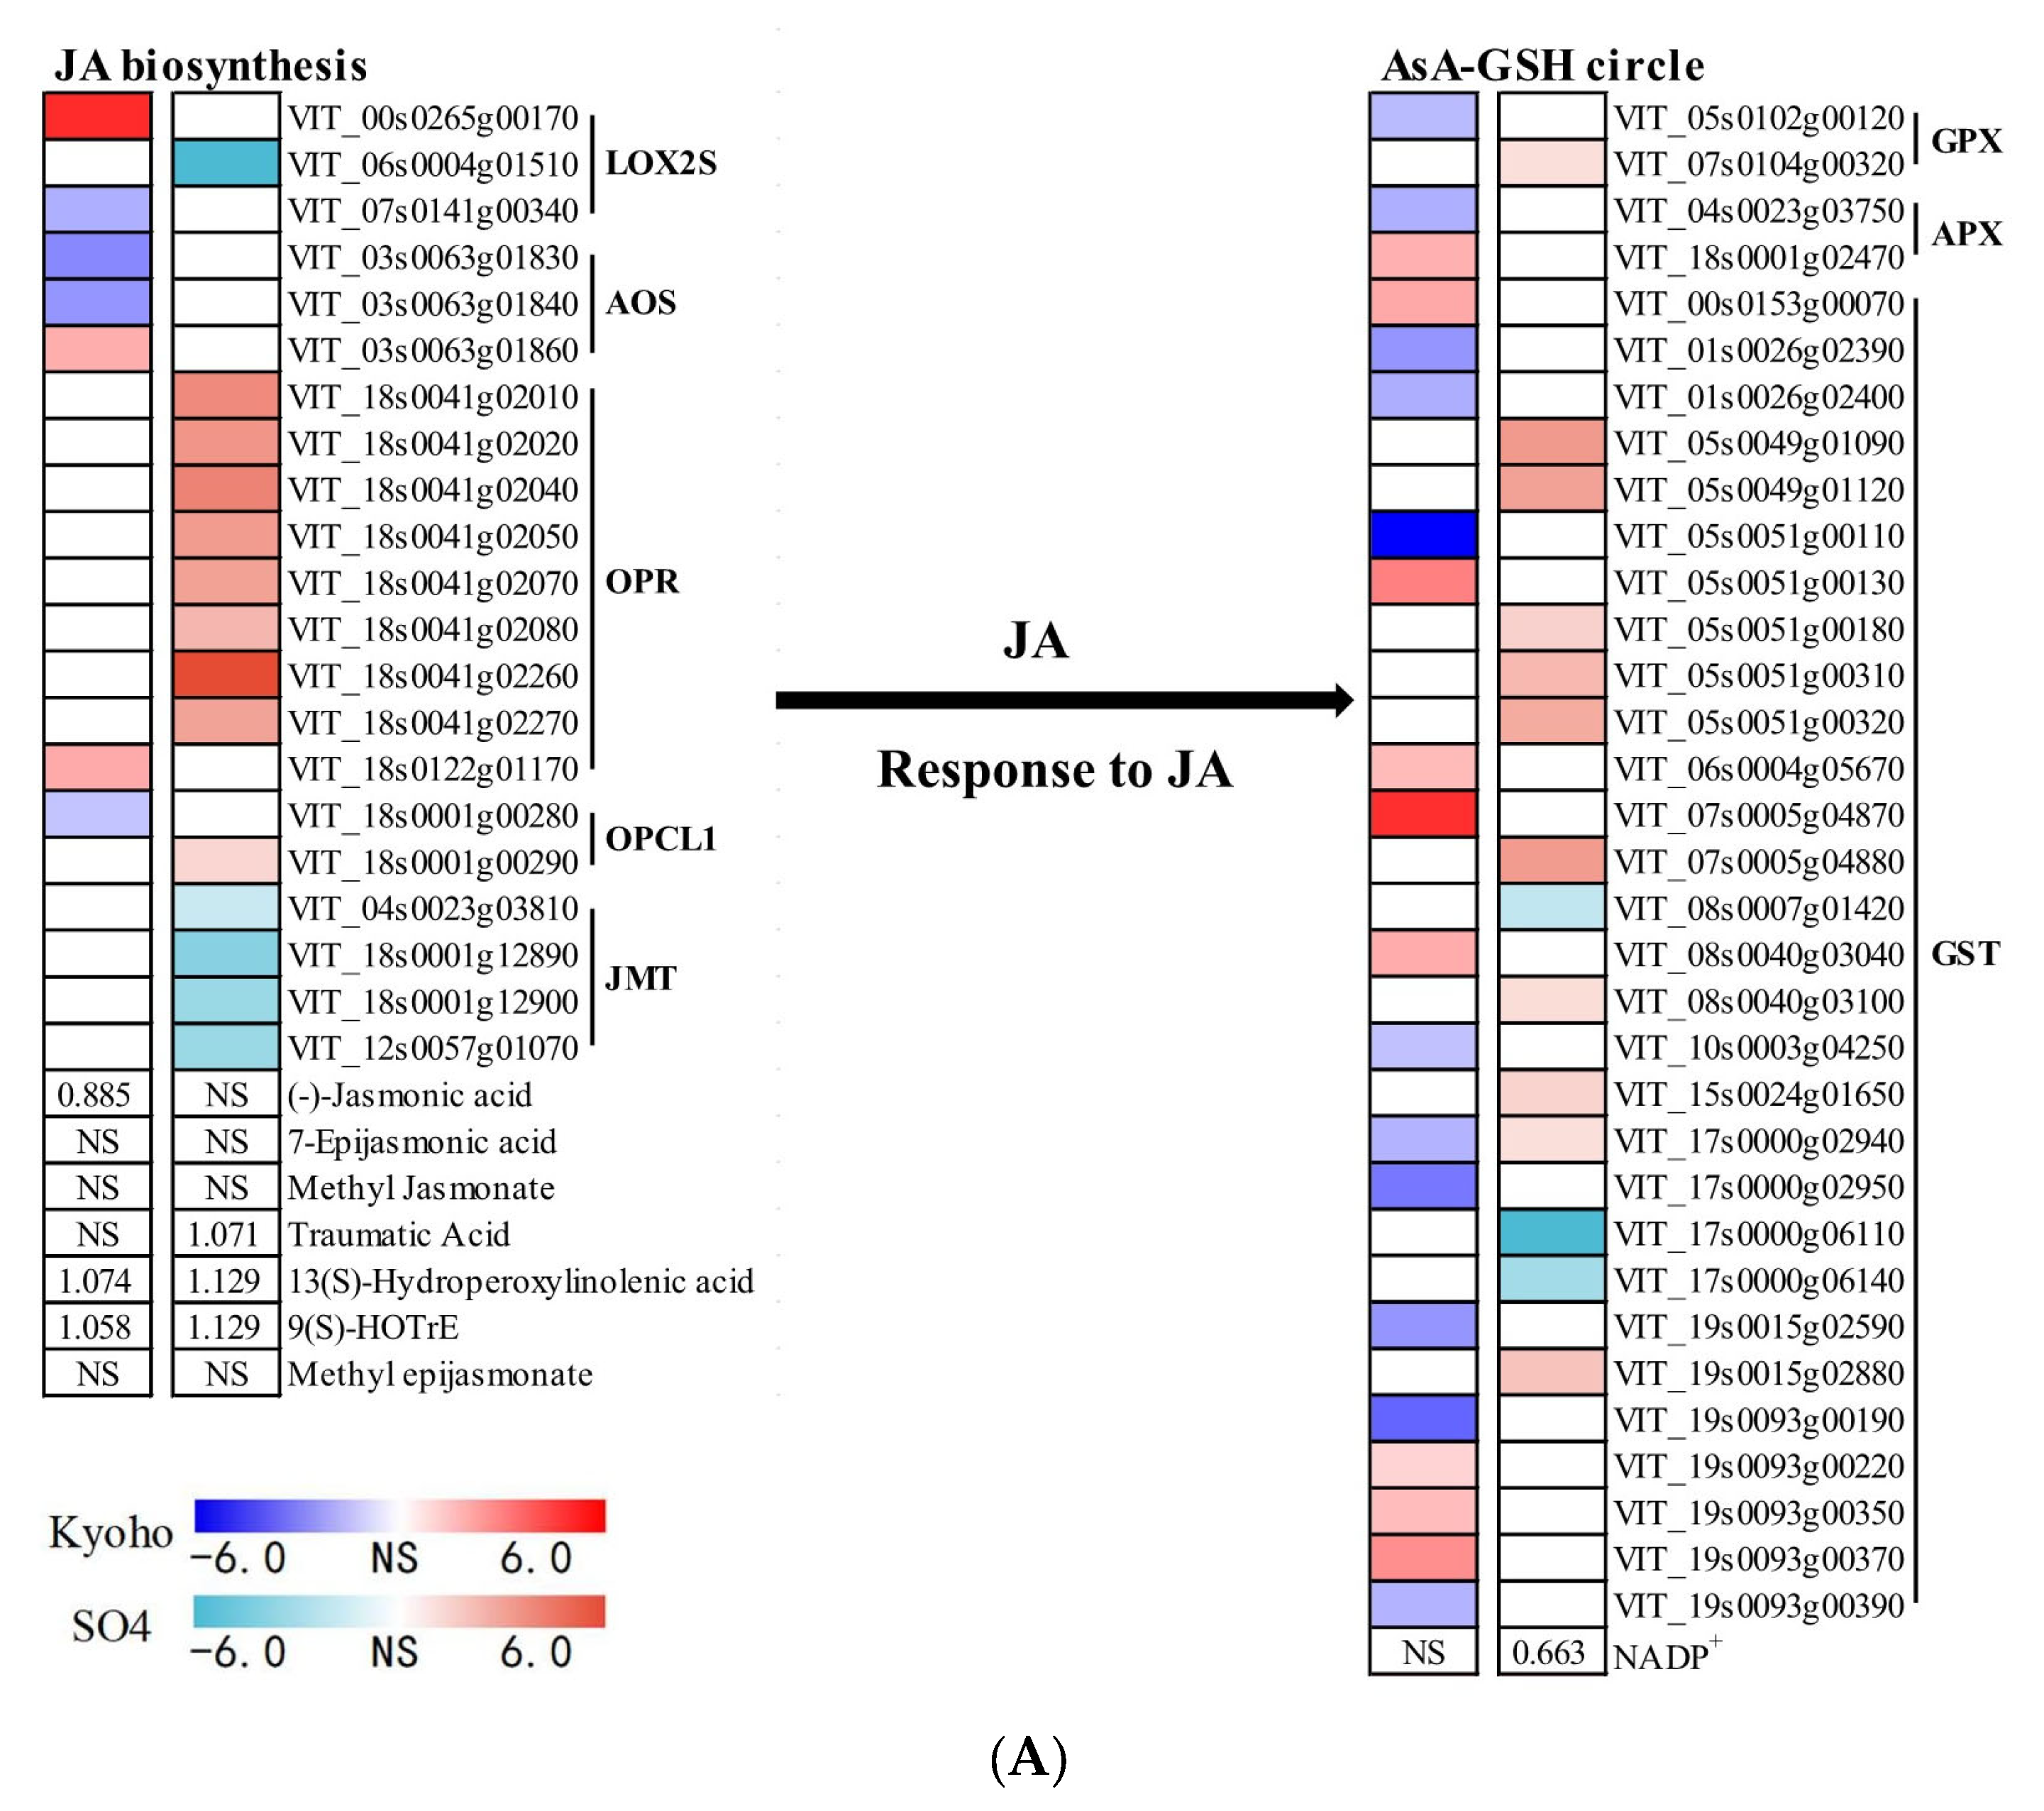
2.7. JA- and ETH-Related Responses of Grapevines to Flooding

Under flooding, the SO4 cultivar was more active in terms of its JA-related ROS scavenging and ETH-related stress regulation than was the Kyoho cultivar (Figure 7). JA biosynthesis seemed to be negatively affected by flood stress, in that one LOX2S gene, two AOS genes, and one OPCL1 gene were uniquely downregulated in KF7, while only one LOX2S gene, one AOS gene, and one OPR gene were uniquely upregulated (Figure 7A). The log10 value for the JA content of KF7 seedlings was also only 0.885 that of KCK0. For SF7, there was a single LOX2S gene uniquely downregulated, while nine OPR genes and one OPCL1 gene were uniquely upregulated under flooding. Furthermore, four jasmonate o-methyltransferase genes were downregulated solely in the SF7 seedlings, perhaps exerting a positive effect on the accumulation of JA by preventing its conversion to methyl jasmonate. In the downstream AsA-GSH ROS scavenging system, which is regulated by JA, we found that one GPX gene, one APX gene, and nine GST genes were uniquely downregulated by flooding in the KF7 seedlings, while one APX gene and eight GST genes were uniquely upregulated. For SF7, relative to SCK0, there were only three uniquely downregulated GST genes, but one GPX gene and ten genes for GST were upregulated. Concerning the regulation of ETH biosynthesis, the five genotype-specific DEGs of KF7 were all downregulated FLS2 genes, while two BAK1 genes, one FLS2 gene, and one MKK4/5 gene were exclusively upregulated in the SF7 group (Figure 7B). For KF7, two metK genes, which encoded the first enzymes in ETH biosynthesis from methionine, were uniquely downregulated, possibly having a strong negative effect on ETH biosynthesis. However, for SF7, one ACS1/2/6 gene and one ACCO gene were solely upregulated under flooding conditions. S-adenosylhomocysteine, formed by the consuming intermediate product in ETH biosynthesis, was uniquely downregulated in SF7 vs. the control, consistent with increased ETH biosynthesis. One P-type Cu+ transporter gene was upregulated only in the KF7 seedlings, which would negatively influence the downstream plant defense response regulated by ETH. In contrast, two ERF1 genes were uniquely upregulated in SF7, which would promote the downstream defense response in roots of the SO4 grapevine cultivar.

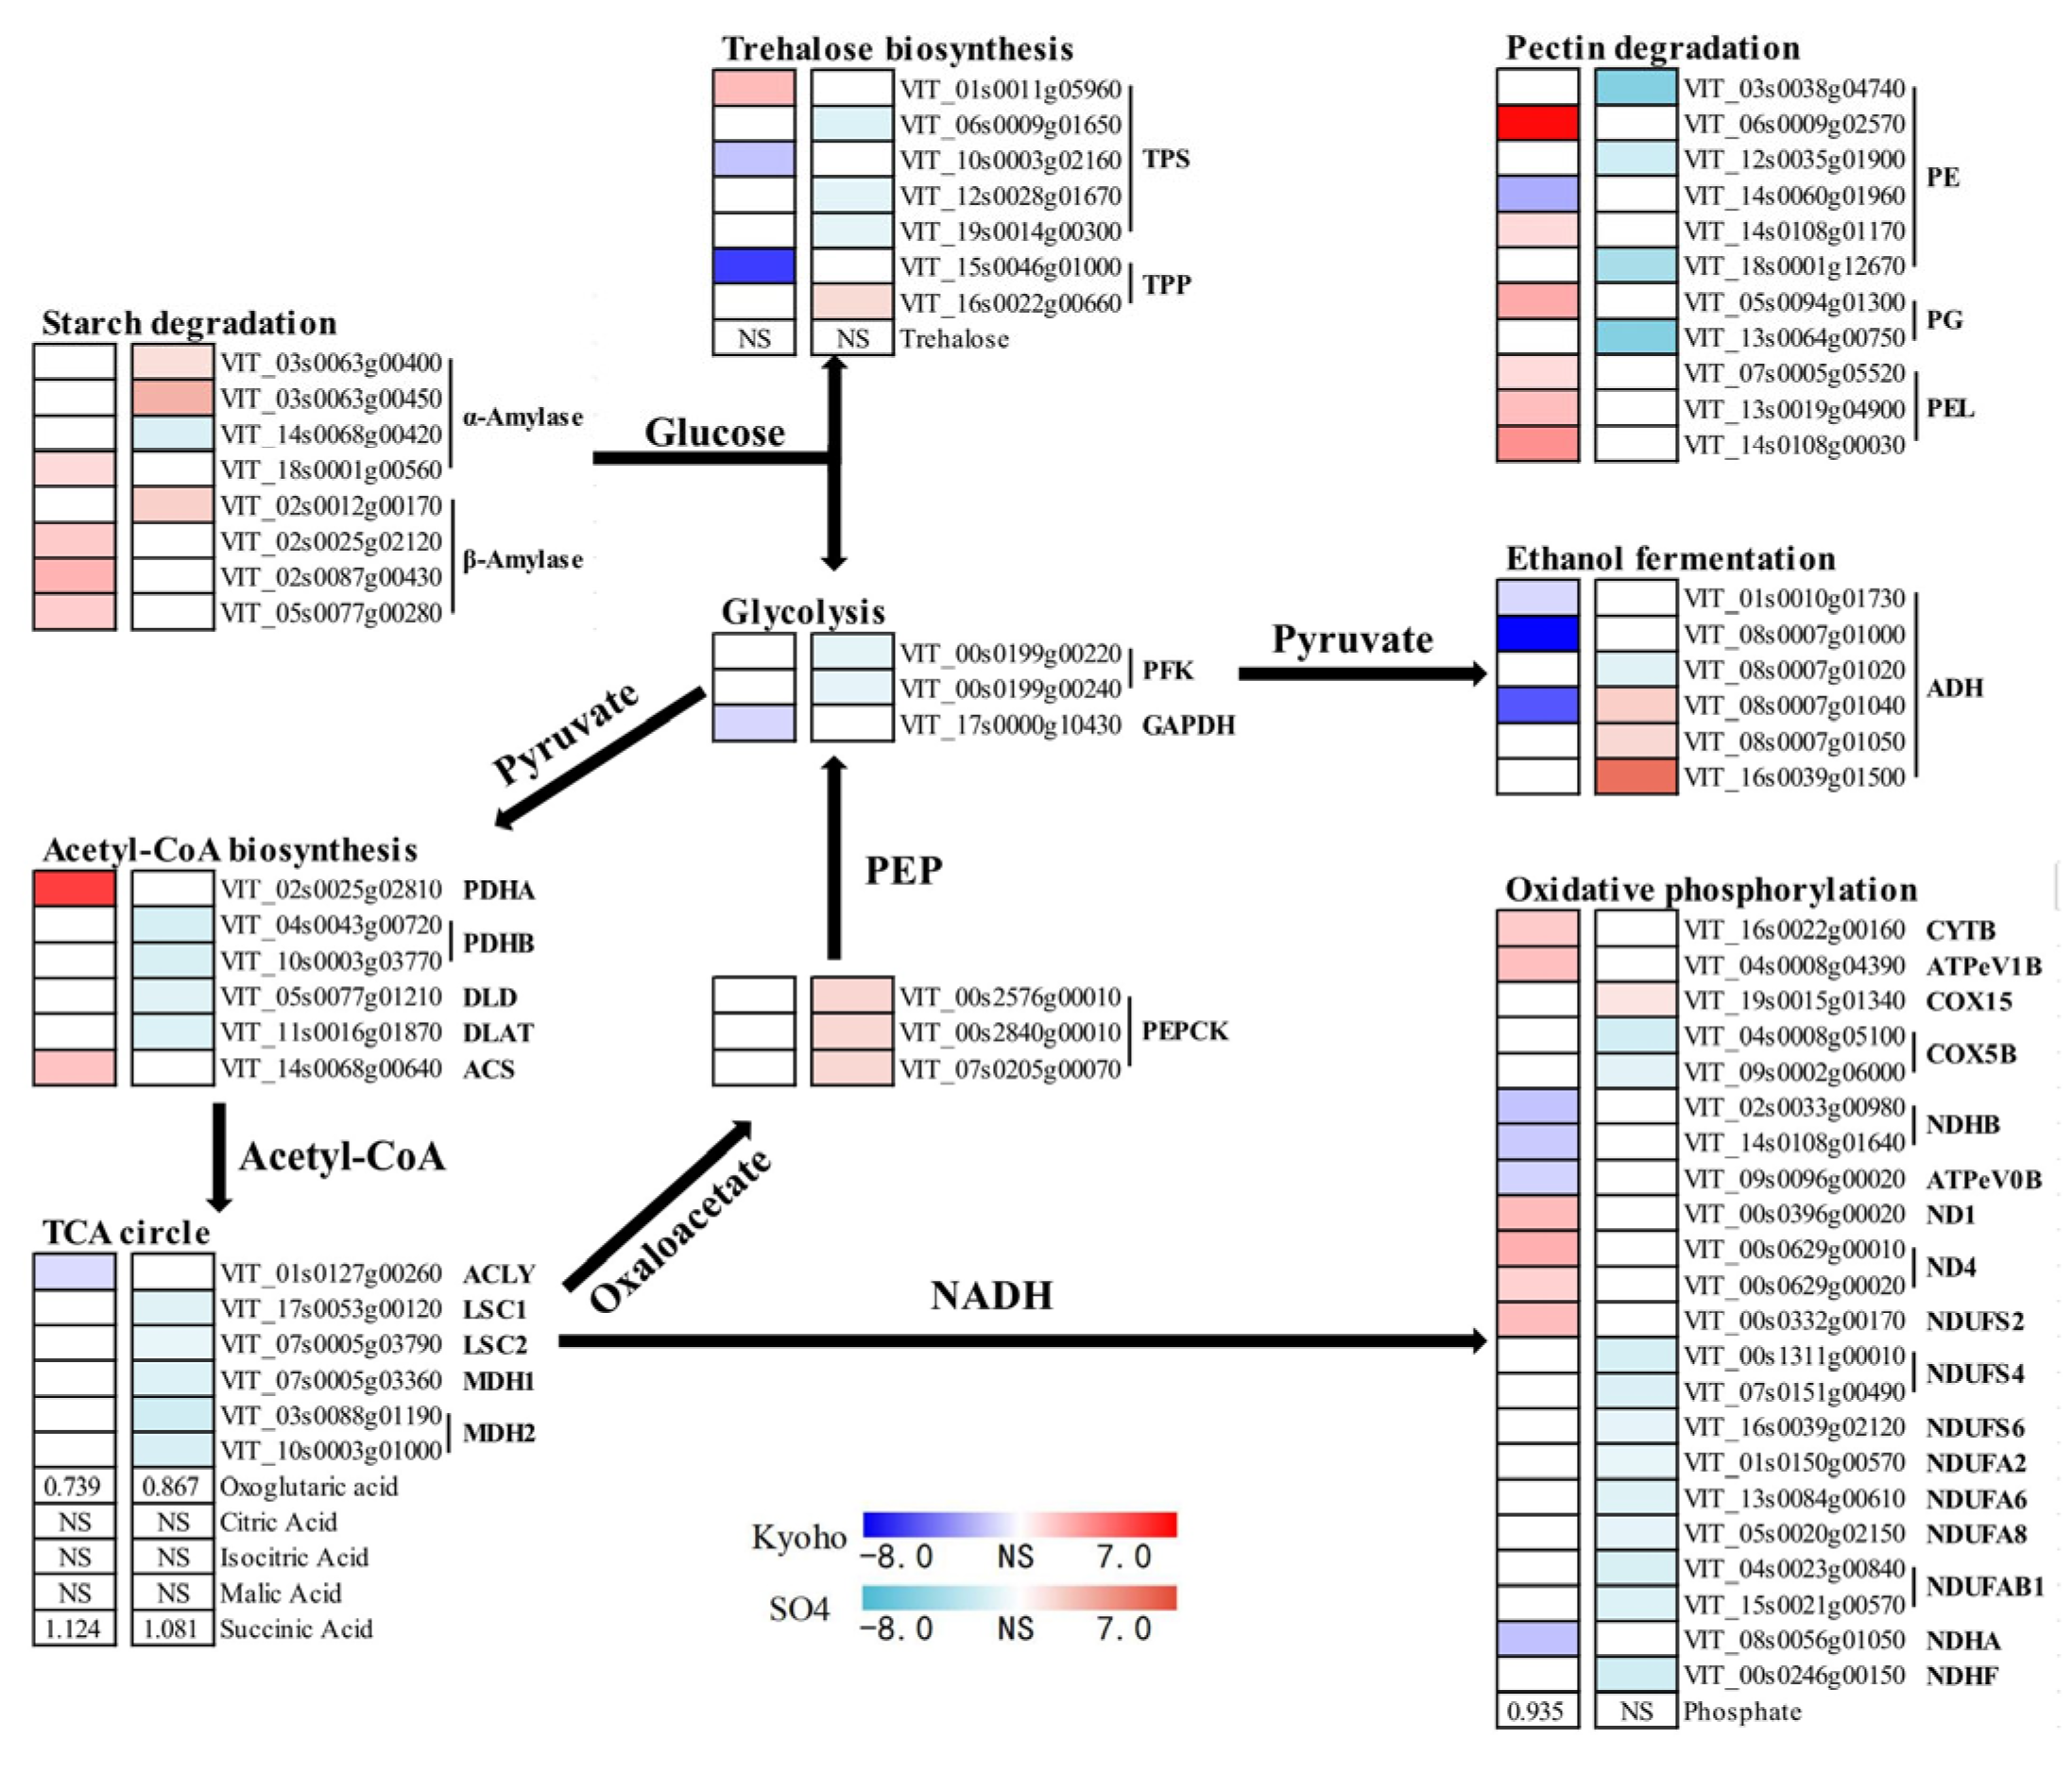
2.8. Carbohydrates Metabolism under Flood Stress

Starch degradation in the roots of the Kyoho and SO4 cultivars responded differently to flood stress conditions (Figure 8). There were three β-amylase genes uniquely upregulated in the KF7 group, while just one α-amylase gene was uniquely upregulated. In case of SF7, two α-amylase genes and a single β-amylase gene were uniquely upregulated under flooding. These SF7 seedlings also were capable of preventing T6P accumulation by downregulating the expression of TPS (T6P-producing enzyme) genes and upregulating the expression of trehalose 6-phosphatase (which catalyzes trehalose formation from T6P) genes, thus reducing the repressive effect on α-amylase. For KF7, we found two genotype-specific upregulated genes associated with acetyl-CoA production, and three ADH genes participating in ethanol fermentation were uniquely downregulated. Conversely, for SF7, four genes in acetyl-CoA biosynthesis were all uniquely downregulated, along with three upregulated ADH genes.
In the KF7 seedlings, only one gene involved in the TCA cycle and four genes from oxidative phosphorylation were uniquely downregulated, whereas six genes for oxidative phosphorylation were upregulated. Meanwhile, in the SF7 seedlings, 5 and 11 genes for the TCA cycle and oxidative phosphorylation, respectively, were uniquely downregulated; only 1 gene for oxidative phosphorylation was upregulated. Three PEPC genes in the SF7 group were uniquely upregulated under flooding conditions, which might direct oxaloacetate from the TCA cycle back to glycolysis. In addition, pectin degradation was upregulated for KF7, but downregulated for SF7, as suggested by the gene expression levels.

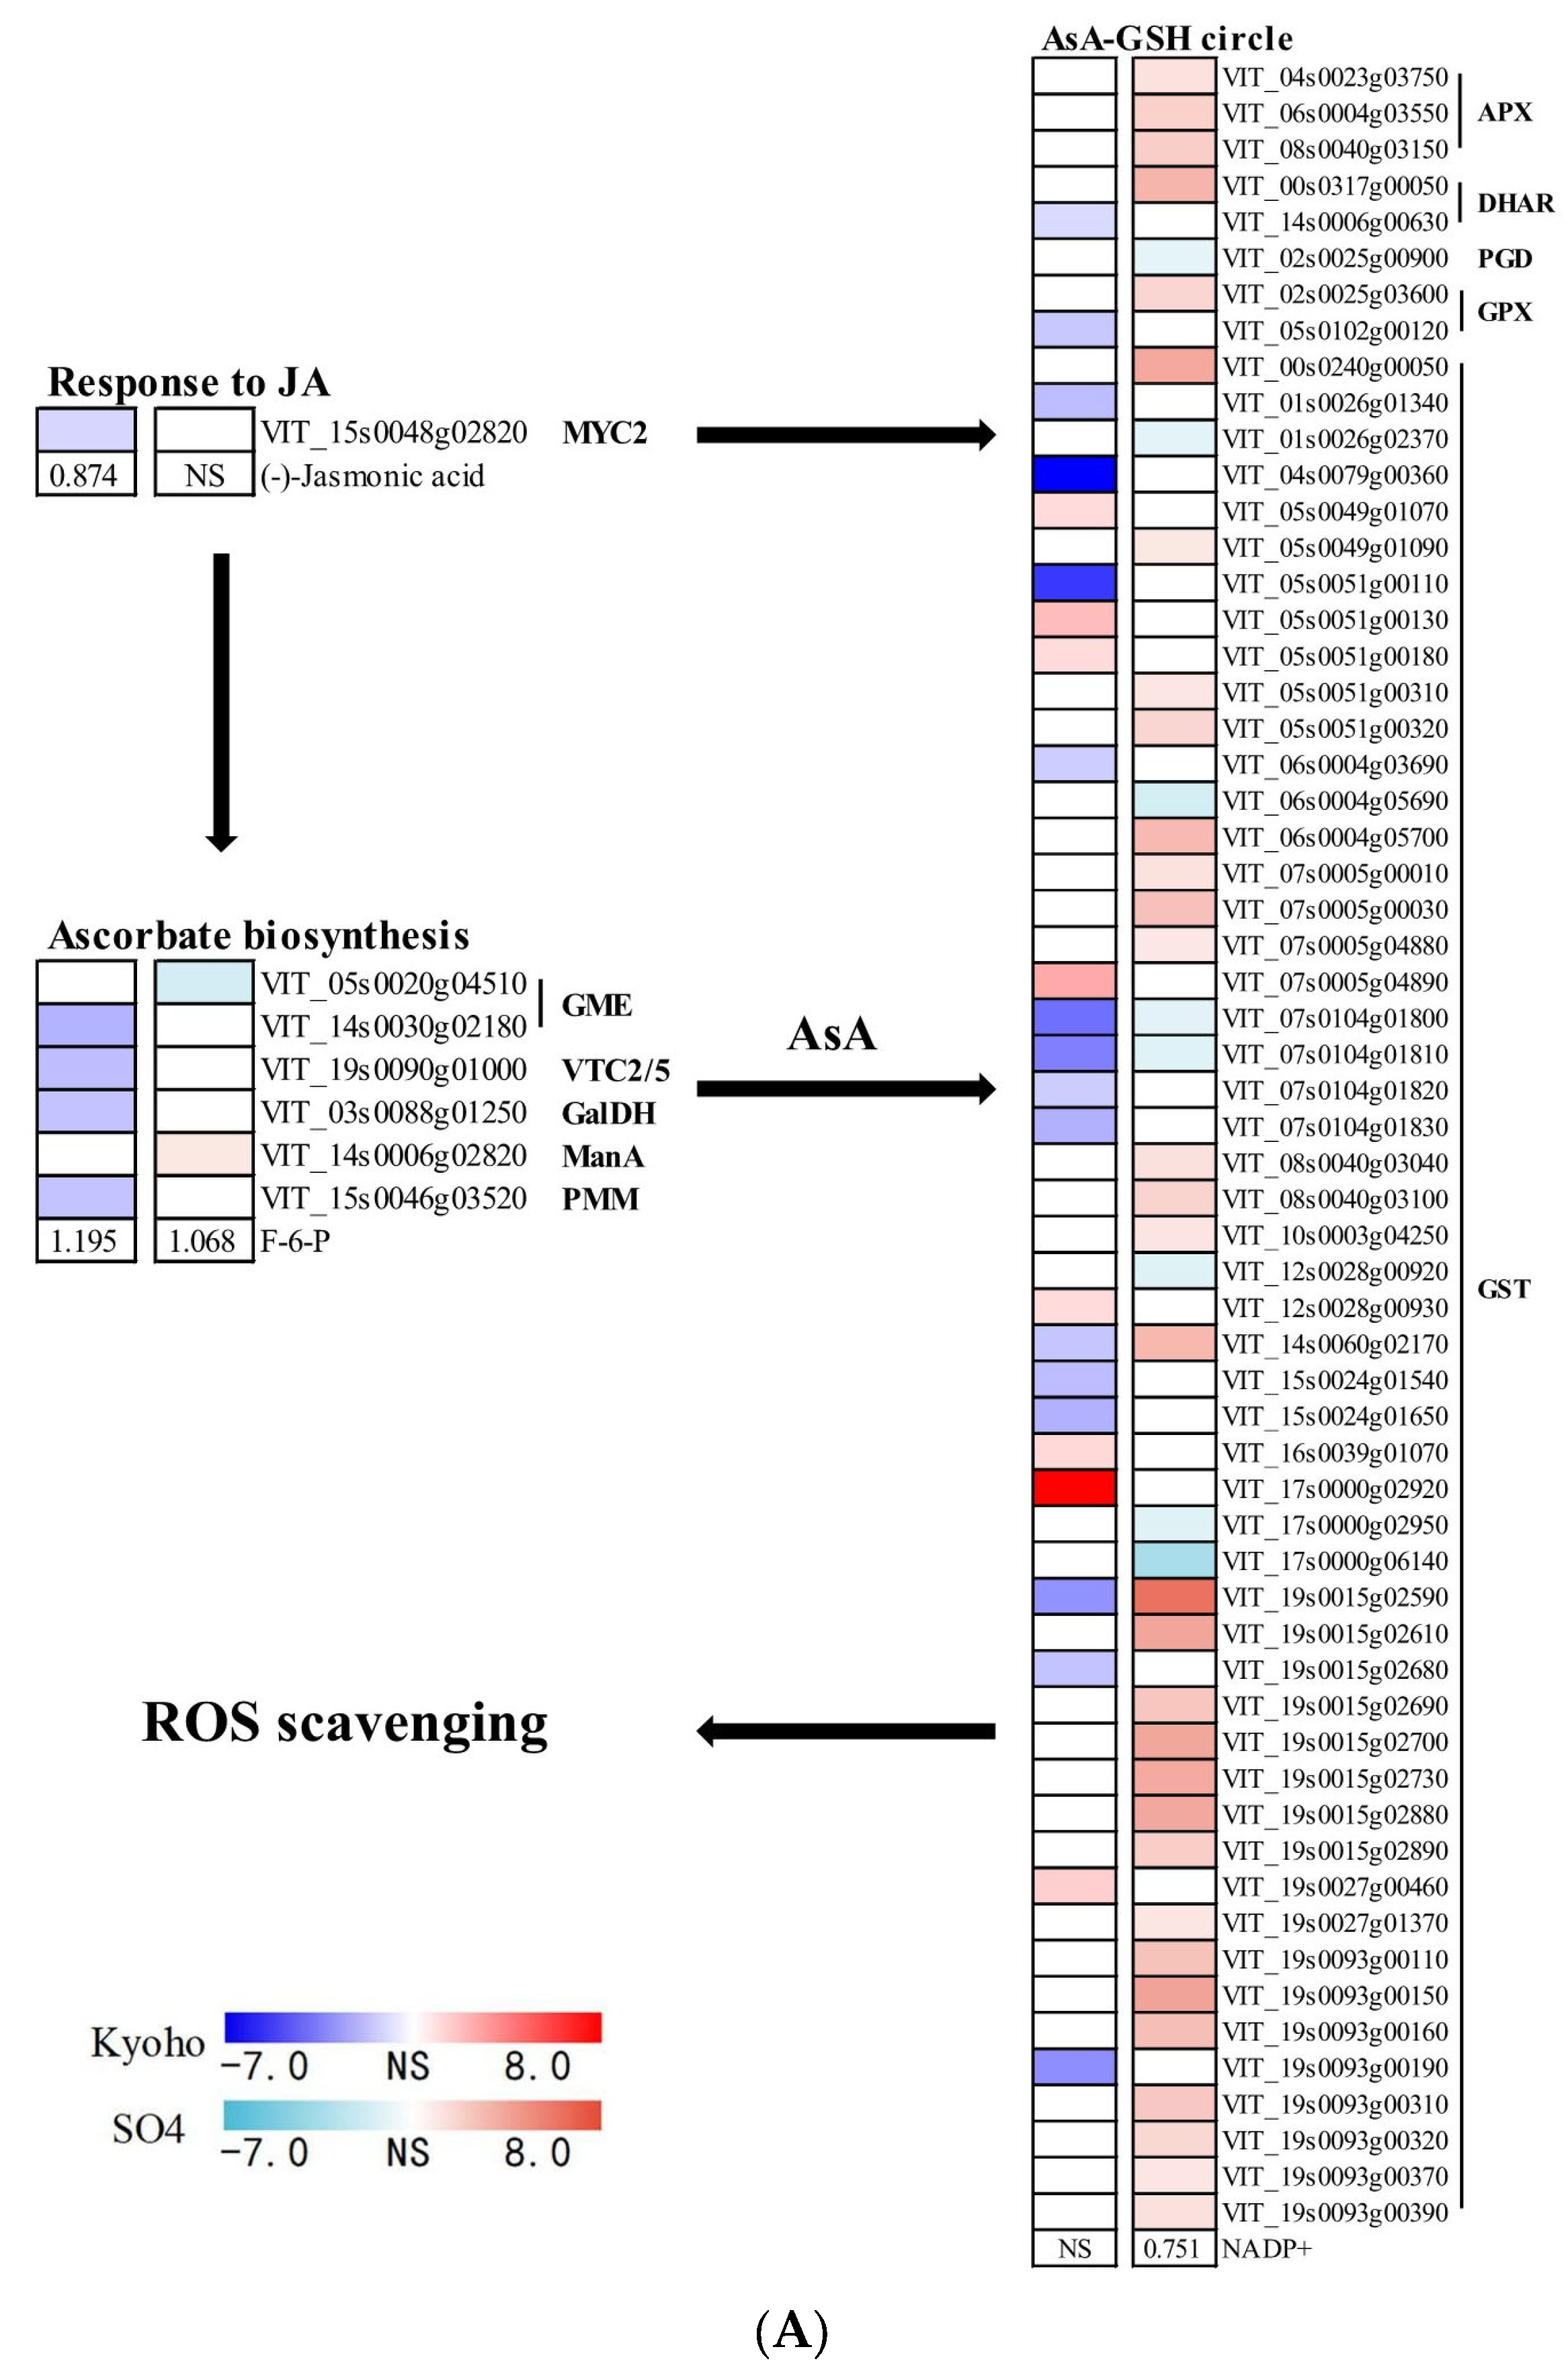
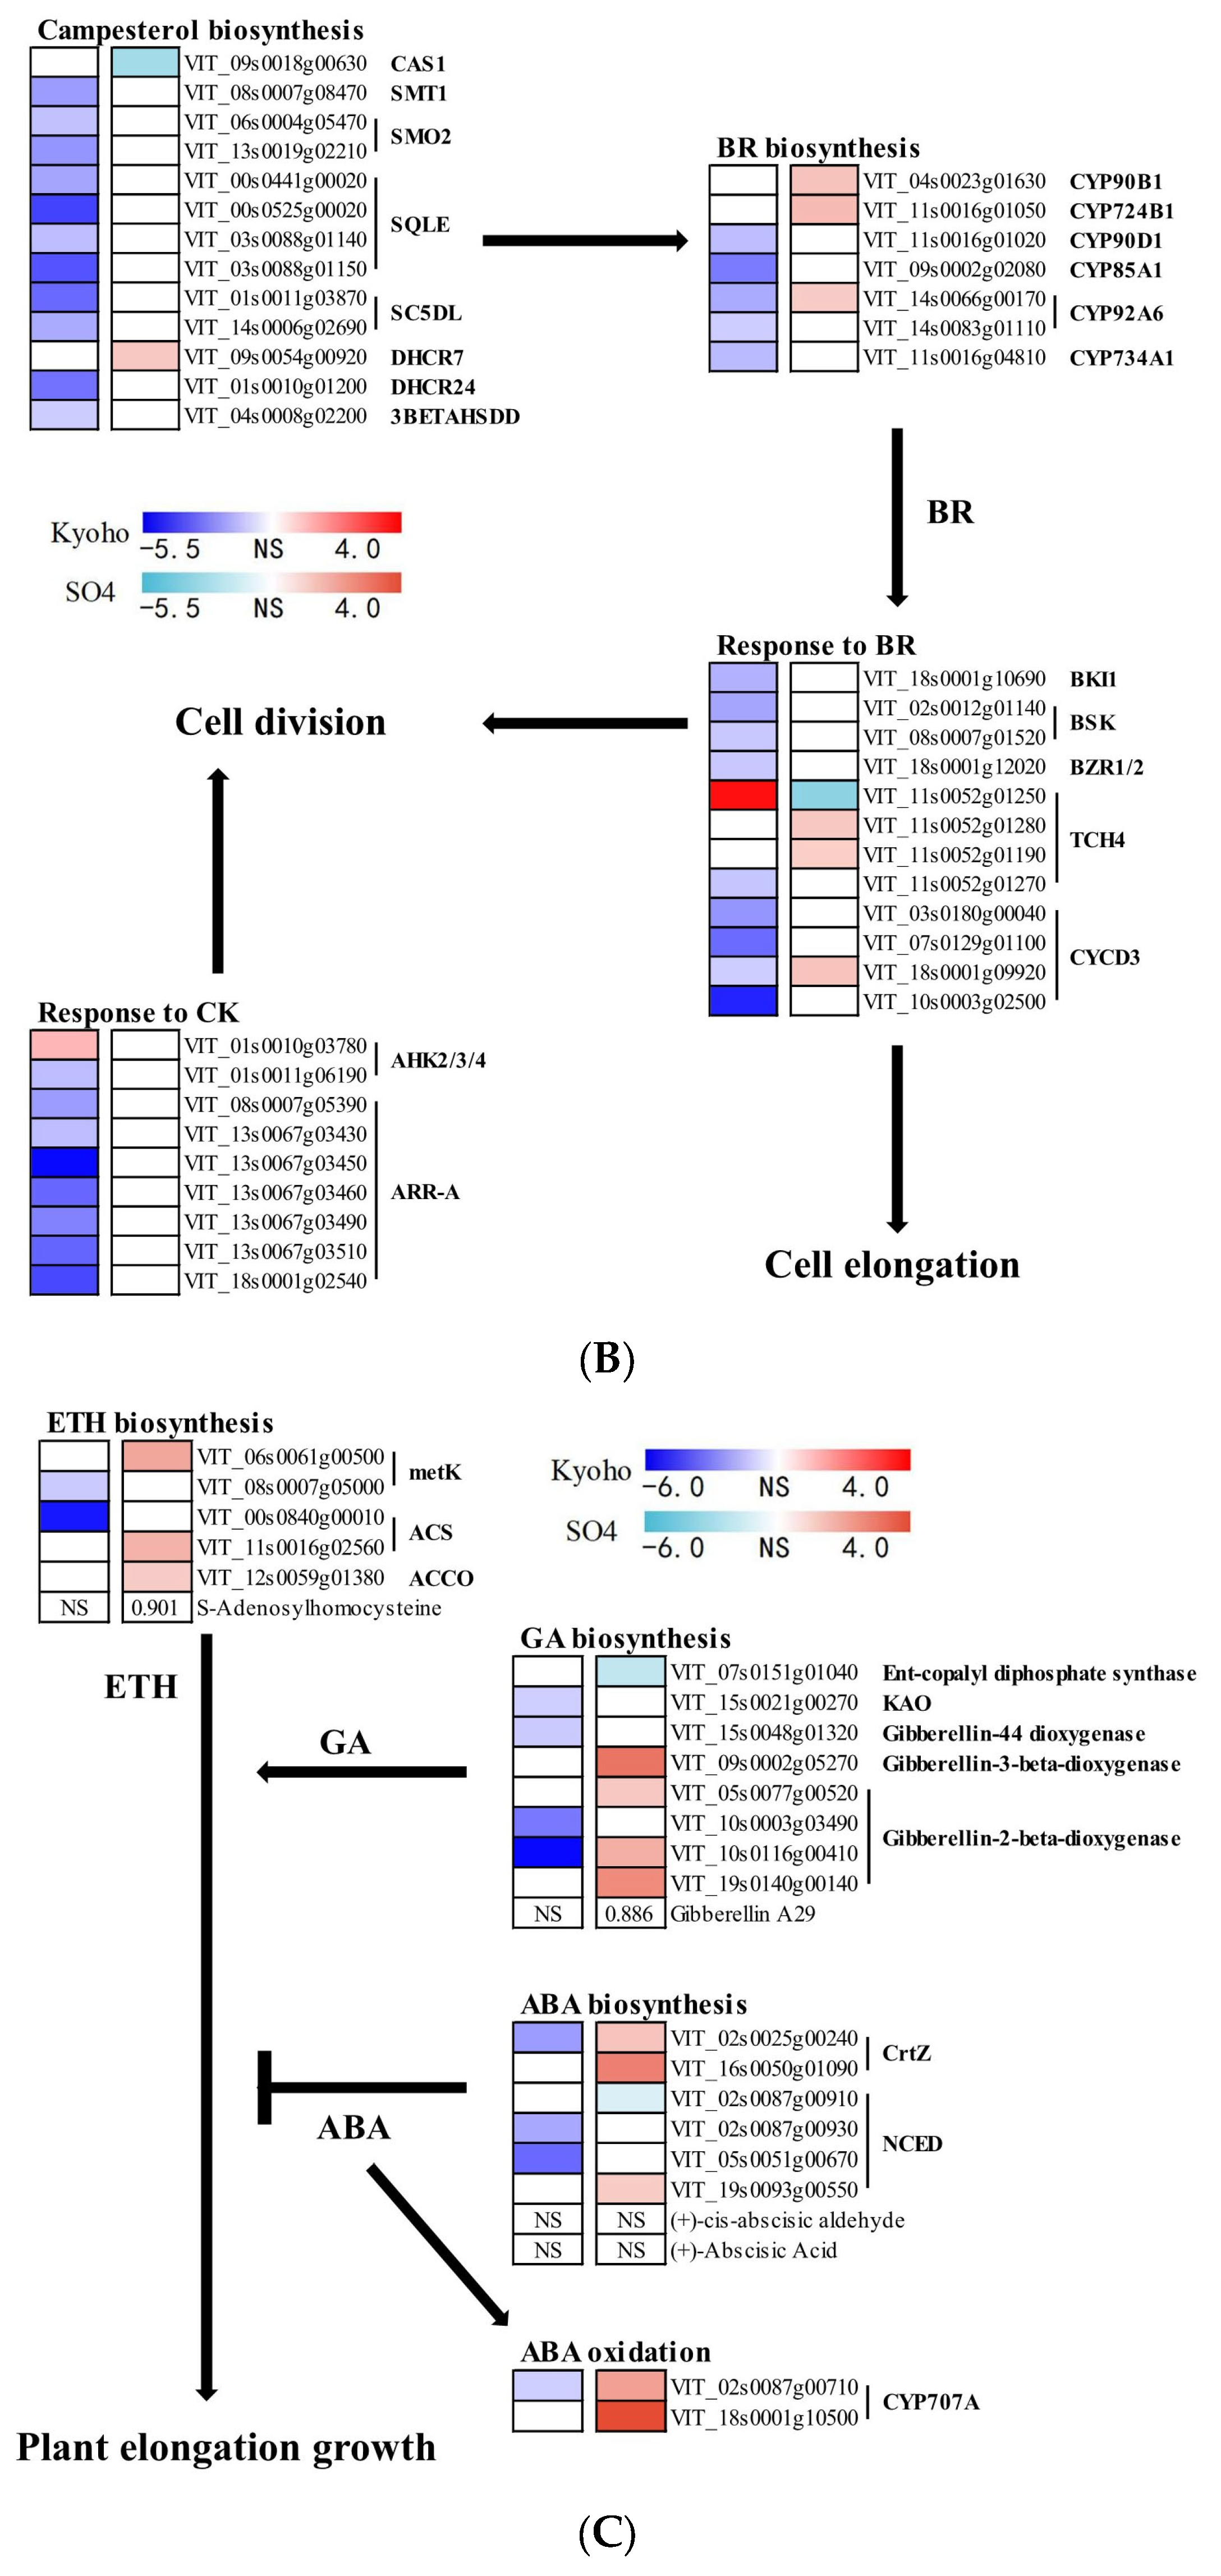
2.9. Phytohormone-Mediated Grapevine Responses during Post-Flooding Recovery

Compared to the flooding period, the differences in the phytohormone-mediated responses between the roots of Kyoho and SO4 cultivars were more distinct in the post-flooding (recovery) stage (Figure 9).
The KF7R group had a significantly lower JA content and VIT_15s0048g02820 (MYC2) transcript abundance than did KCK0, leading to 16 DEGs from the AsA-GSH ROS scavenging system being uniquely downregulated in the recovery stage, while the number of uniquely upregulated genes was only 7. For SF7R, there were 3 APX genes, 1 DHAR gene, 1 GPX gene, and 27 genes for GST found uniquely upregulated vis-à-vis the control, indicative of an augmented ROS scavenging effort in the post-flooding recovery stage. The downregulation of genes for AsA biosynthesis would also contribute to the lower expression levels of genes in the AsA-GSH cycle of KF7R seedlings (Figure 9A), by decreasing their production of AsA. For KF7R, BR- and cytokinin (CK)-regulated cell development were also downregulated, given the downregulation of the genes involved in those pathways. There were 11, 5, 9, and 8 genes uniquely downregulated, respectively, in campesterol biosynthesis, BR biosynthesis, response to BR, and response to CK categories in the KF7R group, while only one gene in response to BR and one gene in response to CK were uniquely upregulated. In the SF7R seedlings, there were seven uniquely upregulated genes for campesterol biosynthesis, and likewise for BR biosynthesis and also for the response to BR; however, only one gene each for campesterol biosynthesis and response to BR were uniquely downregulated (Figure 9B). Collectively, these results indicated that cell development, as mediated by BR, was upregulated at the gene expression level. A number of genes related to plant elongation growth, as mediated by ETH, GA, and ABA, also responded differently in the roots of Kyoho vs. SO4. The genotype-specific DEGs in the biosynthesis of ETH, GA, and ABA for KF7R were all downregulated genes, while all but one of those for SF7R were upregulated genes. The content of S-adenosylhomocysteine was significantly lower in the SF7R seedlings than in the control, due to the upregulation of ETH biosynthesis (Figure 9C). Two CYP707A (the first enzyme in ABA oxidation) genes were uniquely upregulated in SF7R vs. SCK0, perhaps contributing to the elongation growth of SO4 by promoting ABA oxidation.

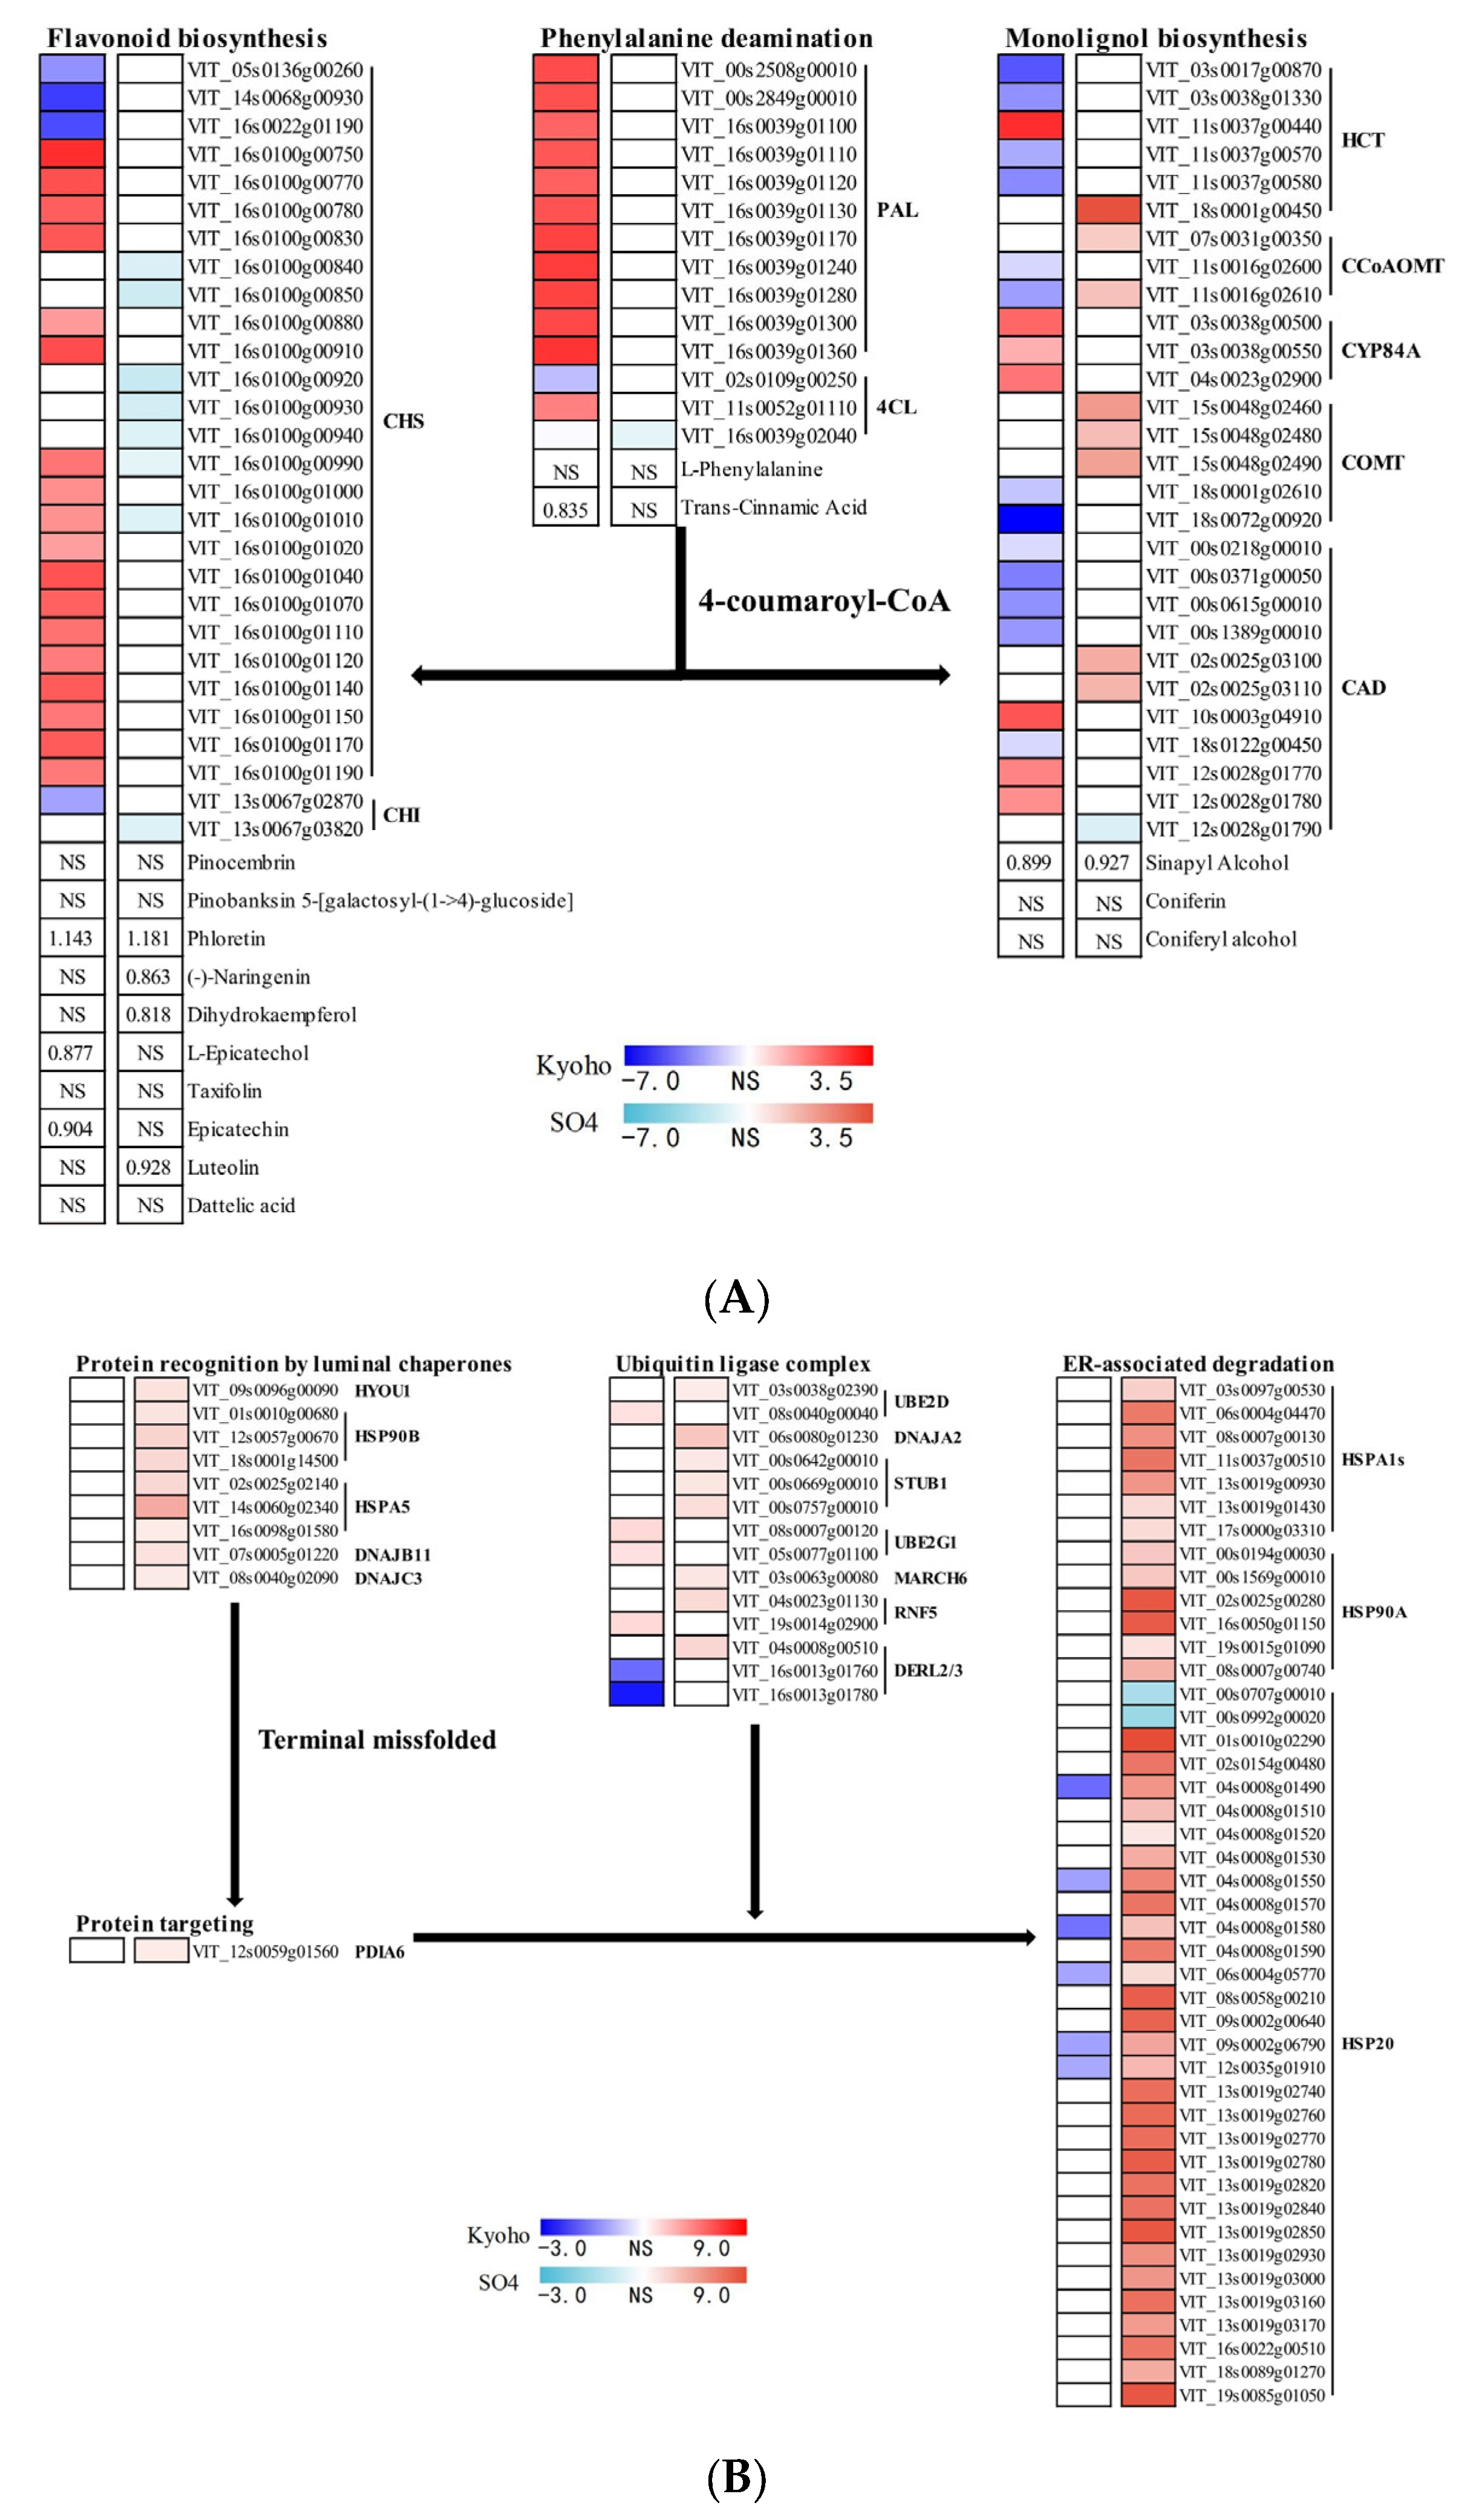
2.10. Flavonoid Biosynthesis, Monolignol Biosynthesis, and Endoplasmic Reticulum Associated Degradation in Post-Flooding Recovery
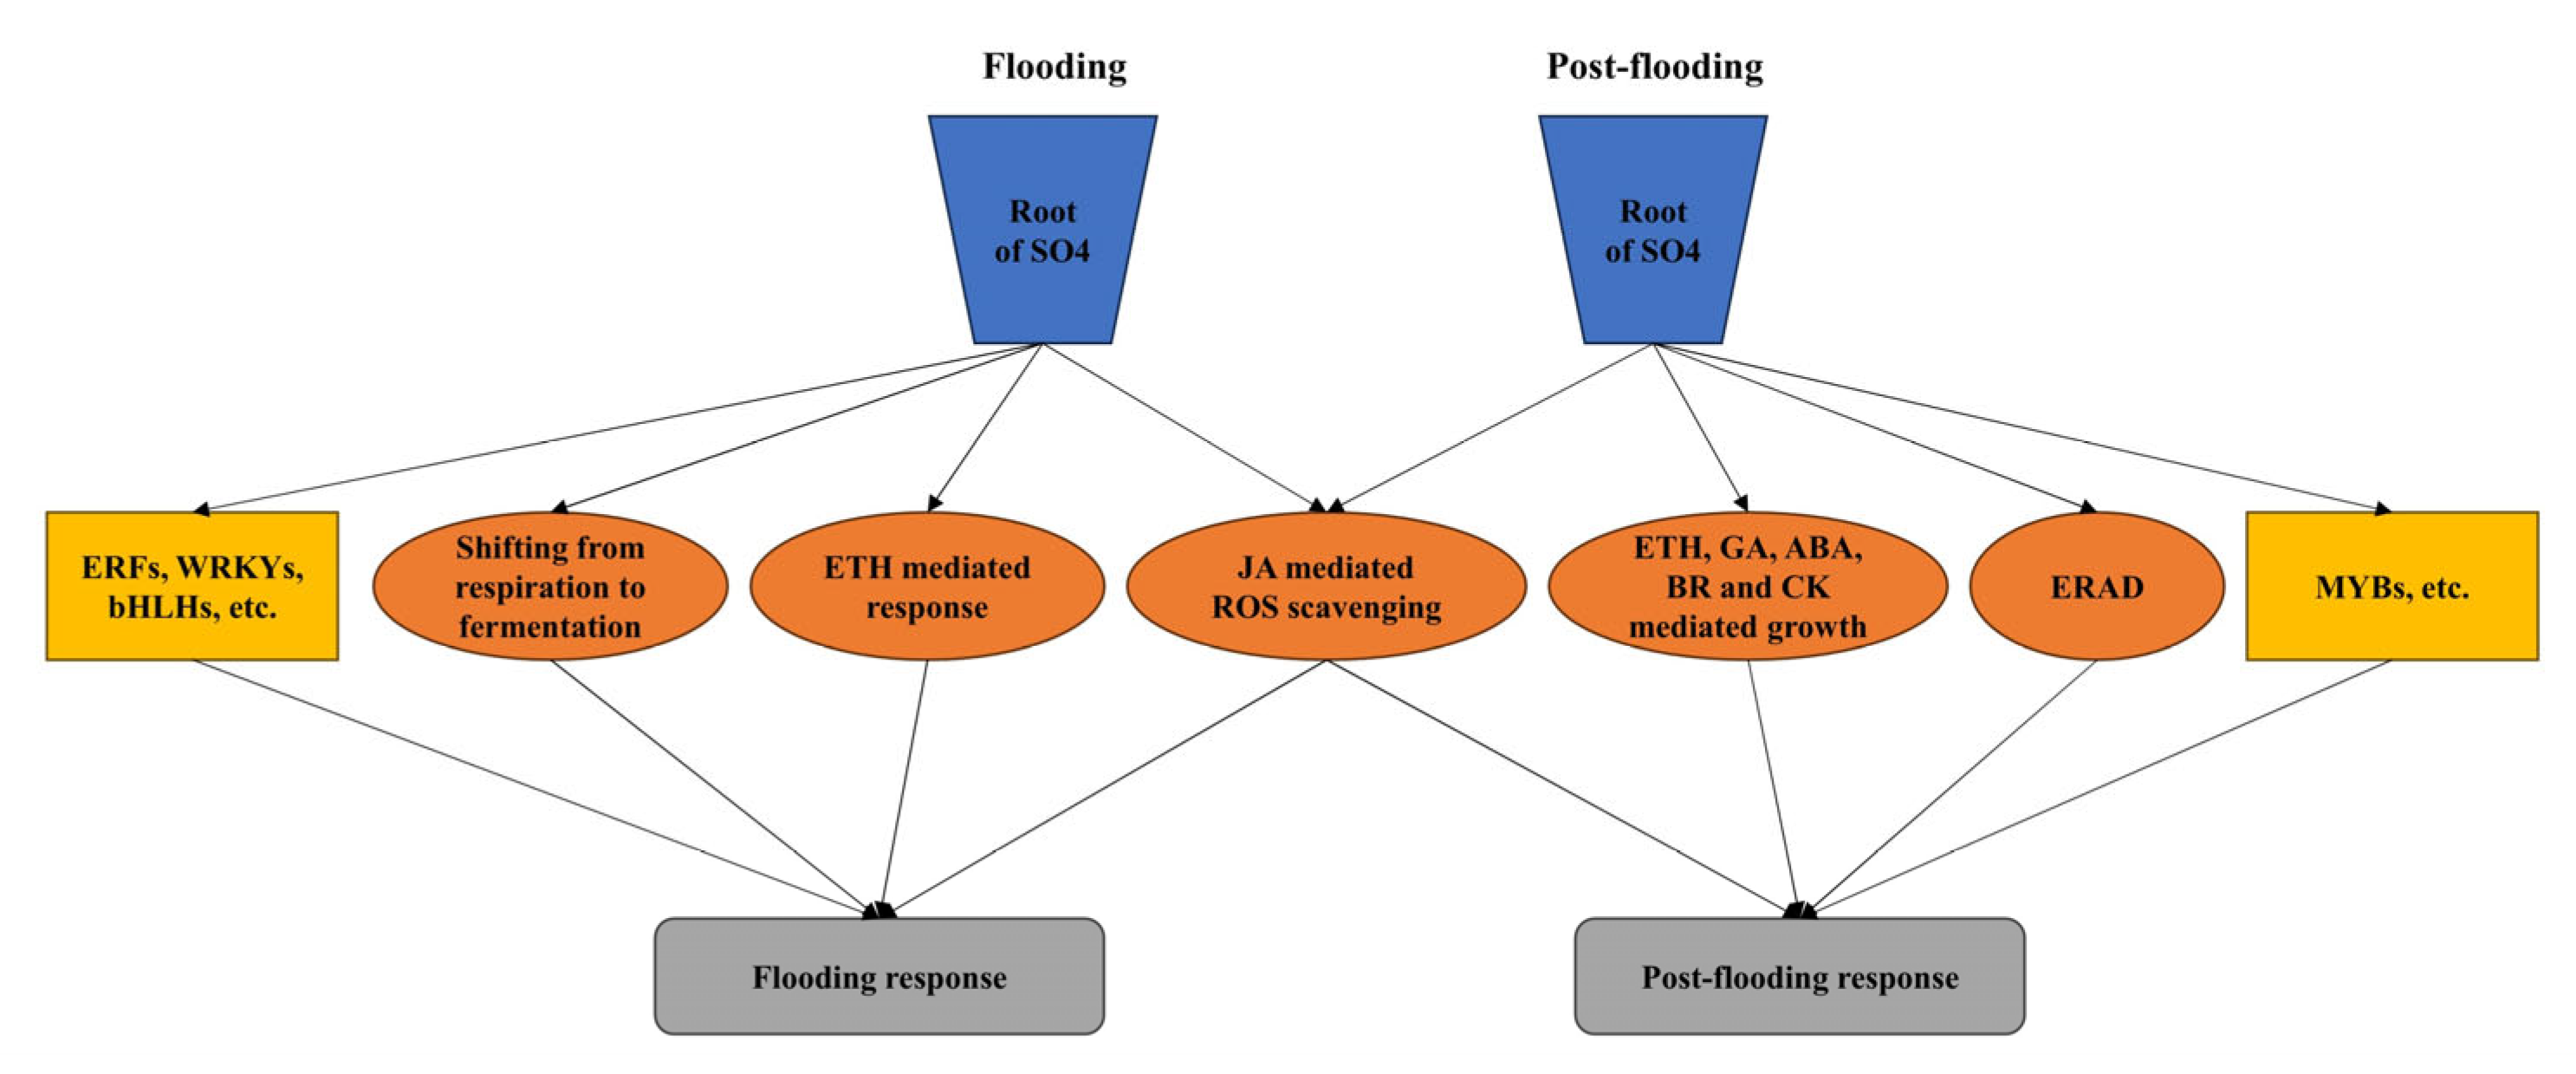
One piece of evidence supporting the better elongation growth and cell development of SO4 than that of Kyoho during their post-flooding recovery might lie with the biosynthesis of flavonoids and monolignol (Figure 10A). After its synthesis from phenylalanine, 4-coumaroyl-CoA seemed to be directed toward divergent uses. In the KF7R seedlings, 18 CHS genes in the downstream flavonoid biosynthesis process were uniquely upregulated, while 13 genes downstream, in the direction of monolignol biosynthesis, were uniquely downregulated. In stark contrast, the genotype-specific DEGs in flavonoid biosynthesis from SF7R seedlings were all downregulated, while all genotype-specific DEGs but one for monolignol biosynthesis were upregulated. The upregulation of monolignol biosynthesis in the SF7R group also agrees with the greater elongation growth and improved cell development during post-flooding recovery, implying that it might promote the biosynthesis of cell-wall components for vigorous cell division.
As another critical stress defensive process, endoplasmic reticulum-associated degradation (ERAD) genes were highly upregulated in the SF7R, but not in the KF7R group (Figure 10B). Six HSP20 genes and two DERL2/3 genes were found uniquely downregulated, with four genes in the ubiquitin ligase complex upregulated in the KF7R seedlings; moreover, the highest log2 fold-change value was only 1.4. In the case of SF7R, the uniquely upregulated DEGs included 9 contributing to protein recognition by luminal chaperones, 1 for protein targeting, 8 in the ubiquitin ligase complex, and 41 genes involved in ER-associated degradation. We uncovered one endoplasmic reticulum-related E3 ubiquitin ligase (ER-related E3), March6, being uniquely upregulated in the SF7R group. Such upregulated ubiquitin-mediated proteolysis in SF7R was also consistent with its higher responsive levels of gene expression with respect to JA, ETH, and GA.

3. Discussion

The world is currently experiencing dramatic increases in the severity and frequency of flood events, with attendant greater impacts on both natural vegetation and crops [1]. Plants respond to flooding stress conditions by mediating changes in their architecture, energy metabolism, photosynthesis, respiration, and endogenous phytohormone biosynthesis and signaling [21]. While under flooding stress, the Kyoho and SO4 roots featured some common changes at the transcriptional and metabolic levels, indicating that Kyoho and SO4 cultivars share similar waterlogging tolerance mechanisms. For example, DEGs in both cultivars are significantly enriched in the phenylpropanoid biosynthesis and flavonoid biosynthesis pathways, and the contents of many flavonoid substances, as well as the expression of genes related to their biosynthesis, are arguably changed in both cultivars (Figure 2 and Figure 5A). Flavonoids play a very efficient role in antioxidant and free radical scavenging, and a large number of flavonoids often accumulate in plants when they are stressed, which can significantly enhance their tolerance to environmental stressors [22,23,24]. In the present study, we find that the root transcriptome and metabolome of Kyoho and SO4 grapevines differ in many aspects when responding to flooding stress, namely in their hormonal balance, antioxidant system, respiratory metabolism, energy metabolism, etc. These differences are reflected in the trend and degree of modified gene expression levels and metabolite contents. This general difference between Kyoho and SO4 cultivars is an important reason for the discrepancy in their flooding tolerance; thus, this response deserves more attention.

3.1. Genotype-Specific TF Genes in Flooding and Post-Flooding Response in SO4

The TF gene families reportedly involved in plant responses to flooding are AP2/ERF, WRKY, NAC, HSF, etc. [25,26,27,28]. Here, many TF genes were involved in the grapevine root response to flooding and post-flooding (Figure 3). Most of the genotype-specific DEGs were significantly upregulated in the SF7 groups, namely the ERFs, WRKYs, bHLHs, etc. These genes actively participated in the response of the SO4 cultivar to flooding. Likewise, genotype-specific MYB family DEGs were also significantly upregulated in SF7R, figuring prominently in the post-flooding response and growth recovery. As such, these genotype-specific TF genes deserve further study because they may significantly affect the flooding tolerance of plants.

3.2. ETH and JA Regulation under Flooding Situation

Ethylene, as a reliable and timely signal communicating flooding stress before the onset of hypoxic and anoxic conditions, is a key regulator of several flood-adaptive traits in plants [29]. Viewed at the transcriptional level, ethylene synthesis and response were more active in SF7 than in KF7 seedlings, given that more related genes were significantly upregulated in SF7 vs. the control. The substrate for S-adenosylhomocysteine biosynthesis comes from the intermediate products of ethylene synthesis, and the significant reduction in S-adenosylhomocysteine content of SF7 may have been caused by the large consumption of intermediate products during active ethylene synthesis (Figure 7). When incurring stress from flooding, ethylene can induce plants to form lysigenous aerenchyma and porous adventitious roots, so that oxygen can be transported to the submerged roots via these pores to alleviate the root hypoxia stress caused by being under water [30,31,32]. In plants, the final step in ethylene biosynthesis is an aerobic reaction catalyzed by ACCO [33]. Therefore, it is paramount to induce the timely formation of aerenchyma and adventitious roots through the rapid synthesis of ethylene in the early stages of flooding stress conditions in order to ensure plant survival.
Under flooding stress, the formation of aerenchyma and adventitious roots is dependent on ethylene-mediated ROS formation [29,34,35]. A certain dose of ROS is nonetheless helpful to induce plant roots to form proper aerenchyma, which can alleviate the effects of hypoxia damage on roots. However, the rapid formation of aerenchyma could sometimes be a threat to plant survival. For example, Peng et al. [36] observed that in the cellular structure of poplar roots, the flood-susceptible LS2 formed large-scale aerenchyma more rapidly than did the flood-tolerant LS1 in response to flooding stress. With prolonged flooding, the uncontrolled parenchyma cells cracking the cortex of the LS2 roots resulted in the plant’s failure to maintain an intact root structure. In this case, much of the oxygen delivered to the root apex is lost radially, impairing the original function of aerenchyma. In their subsequent work, Peng et al. [7] demonstrated that the ROS scavenging ability was significantly weaker in the roots of LS2 than LS1. Hence, the runaway aerenchyma formation may be linked to the excessive accumulation of ROS. The scavenging for ROS in plants relies on enzymatic antioxidant and non-enzymatic antioxidant systems. The AsA-GSH cycle is a key component of plant resistance to oxidative stress [37]. It includes both the non-enzymatic antioxidants AsA and GSH, in addition to antioxidant enzymes, namely glutathione peroxidase (GPX), APX, GR, DHAR, GST, etc. In plants incurring flood stress, JA can accelerate the synthesis of AsA and GSH by activating the expression of rate-limiting genes [38] and augment the activities of key enzymes such as GPX and APX [39], thus accelerating the scavenging for ROS. In this study, the expression of JA synthesis-related genes was more active in SF7 than KF7 seedlings, and the changed JA content of the latter was significantly reduced when compared with the control (Figure 7). Affected by the JA content, the expression of many genes related to the AsA-GSH cycle in SF7 was significantly upregulated, while the expression of many such genes in KF7 was significantly downregulated, illustrating that the SO4 grapevine may possibly maintain a high antioxidant capacity to ensure its survival under conditions of flooding stress.

3.3. The Shift from Aerobic Respiration to Anaerobic Fermentation under Flooding

Most flood-tolerant woody plants rely on the low-oxygen quiescent strategy (LOQS) when they incur flooding stress. They reduce their consumption by converting their metabolism to energy- and oxygen-saving methods, thereby maintaining a higher survival rate under flooding stress, as demonstrated for the flood-tolerant poplar variety LS1 and the grape rootstock K5BB [7,20,40]. In our study, when compared with Kyoho, SO4 exhibited characteristics more consistent with those of LOQS plants. At the transcriptional level, the genotype-specific DEGs related to respiration in the SO4 roots were significantly downregulated in almost all respects (Figure 8), including in the genes for acetyl-CoA synthesis, TCA cycling, and oxidative phosphorylation, which decreased the respiration and oxygen consumption activities. Three DEGs encoding PEPCK were significantly upregulated in the SF7 group, promoting the redirecting of oxaloacetic acid from the TCA cycle to the glycolysis pathway. Several ADH genes were also specifically upregulated for SF7, suggesting that this group’s seedlings could consume pyruvate and NADH produced by glycolysis through a more active ethanol fermentation pathway. Under hypoxic conditions, the roots can only obtain a small amount of energy via glycolysis, which is limited by the rate of NADH oxidation. Under anaerobic or hypoxic conditions, NADH oxidation depends on ethanol fermentation and lactic acid fermentation [40]. Peng et al. [7] proposed that lactic acid fermentation should only operate in the initial stage of flooding stress, and that it should cease after activating the ethanol fermentation pathway; otherwise, substantial lactic acid production will cause damage to cells. Therefore, SO4 roots can oxidize NADH through ADH-catalyzed ethanol fermentation to ensure a high-throughput glycolysis energy supply after 7 days of flooding. In the flood-sensitive Kyoho cultivar, some DEGs specifically upregulated in acetyl-CoA synthesis and oxidative phosphorylation are distinguishable, with three ADH genes specifically downregulated. We interpret this result to mean that the Kyoho cultivar’s conversion mechanism does not work as well as that of the SO4 cultivar.

3.4. JA Mediated ROS Scavenging System under Post-Flooding

After their bout with flooding stress, plants do not simply return to normal growth. In fact, when a large amount of oxygen is added to the soil again, the roots will undergo reoxygenation stress, and additionally, the roots become porous due to aerenchyma formation and must face the challenge of greater soil pressure [11,41]. The excessive accumulation of ROS is the main cause of post-flooding damage to roots [42]. The study of Yeung et al. [16] on Arabidopsis thaliana found that genotypes with less ROS accumulation had stronger resilience after the end of flooding. Therefore, plants need efficient ROS removal systems, not only during actual flooding stress conditions, but also during the recovery from it. For A. thaliana, it is known that JA plays a key role in improving this plant’s oxidative stress resistance during the post-flooding recovery period. JA promotes the upregulated expression of ascorbic acid and glutathione synthesis genes by regulating the TF gene MYC, and it improves the antioxidant capacity of plants by activating the AsA-GSH cycle [38]. In our study, the JA content and MYC expression in the KF7R groups were both significantly lower than those in the control. Under its influence, the expression of four AsA synthesis-related genes, one DHAR encoding gene, and many GST-encoding genes was significantly downregulated in KF7R seedlings (Figure 9), thus exerting a negative impact on the antioxidant functioning of the AsA-GSH cycle. The expression of most genotype-specific genes related to the AsA-GSH cycle in the SF7R group was upregulated vis-à-vis the control, indicating that SO4 could maintain a higher ROS scavenging ability during its recovery from flooding.

3.5. Phytohormone Mediated Plant Growth in Post-Flooding Stage

Judged at the transcriptional level, evidently the SO4 grapevine was able to quickly recover its growth in the post-flooding period, while the Kyoho cultivar was unable to do so (Figure 9). At the cellular level, expression levels of genotype-specific DEGs related to CK and BR synthesis and its responses were downregulated overall in KF7R. The BR response-related genes, such as the BZR1 gene [43], whose expression is regulated by BR, are capable of bolstering plant growth by promoting plant cell division and elongation. Some genes related to the BR synthesis and response underwent upregulated expression in SF7R, which can enhance the synthesis and regulation of BR. The downregulation of genotype-specific DEGs related to ETH and GA synthesis in KF7R seedlings also suggested that the Kyoho roots exhibited poor elongation and growth during the 3-day recovery period. For the SF7R group, the upregulated expression of metK, ACS, and ACCO genes, as well as the upregulated expression of those genes related to GA synthesis, will jointly augment the synthesis of ETH and GA, which is beneficial to a plant’s elongation and growth [5]. However, ABA inhibits the positive effects of ETH and GA on plant elongation. Several ABA synthesis-related genes were also upregulated in SF7R, but this did not cause ABA to accumulate, an outcome which may be linked to the simultaneously upregulated expression of the CYP707A gene (Figure 9). In tomato plants, the SlCYP707A1 gene encodes the enzyme catalyzing the first step in ABA catabolism, and its upregulated expression lowers the ABA content [44]. Active monolignol biosynthesis in the SF7R seedlings also provides evidence for the rapid recovery of the SO4 grapevine’s growth during the recovery period, in that many genes related to monolignol biosynthesis were significantly upregulated in SF7R vs. the control (Figure 10A). A large number of lignin monomers could polymerize to form lignin, a fundamental component of secondary cell walls, to meet the needs of cell division and growth in rapidly growing roots. The phenylalanine deamination pathway is where monolignol synthesis begins, and the 4-coumaroyl-CoA produced by this pathway can enter both the monolignol and flavonoid biosynthesis pathways. For the KF7R group, its 4-coumaroyl-CoA may be assigned more to the pathway for flavonoid biosynthesis than to the pathway for lignin synthesis. We infer that from the many genes in the monolignol biosynthesis pathway may be significantly downregulated in KF7R, though many CHS genes in the flavonoid biosynthesis pathway were specifically upregulated (Figure 10A). This may compensate for the weaker antioxidant capacity of KF7R because of the synthesis of many flavonoid substances.

3.6. Active ERAD in SO4 under Post-Flooding

In adverse environments, unfolded and misfolded proteins accumulate in large quantities in the ER, leading to ER stress. The clearance of misfolded proteins requires ERAD [45]. In SF7R, the expression of numerous HSPA1s, HSP90A, and HSP20 genes in the ERAD process was significantly upregulated relative to the control, strongly suggesting that this process actively participates in the response of the SO4 grapevine to reoxygenation stress, a response absent in the Kyoho cultivar (Figure 10B). Protein ERAD must first undergo ubiquitination, and ER-related E3s are the most expanded components in that ubiquitination, playing an essential role in recognizing targets and later transferring ubiquitin to these targets, while they are also involved in regulating plant growth and development, stress responses, and hormone signaling pathways [46]. A total of three genotype-specific expressed ER-related E3s genes were found in the SF7R and KF7R groups of seedlings, namely two RNF5 genes and one March6 gene (Figure 10B). The March6 gene, also known as DOA10, is involved in the regulation of root development and ABA signaling in A. thaliana and its drought and heat stress responses [47,48,49,50]. However, there have been no reports in the literature regarding whether or not it contributes to how plants respond to flooding stress. The expression level of March6 in SF7R seedlings was 2.33 times that of the control, which points to the ER-related E3s gene engaging in the post-flooding response of grapevines. We postulate that the March6 gene might play an underappreciated role in the success of flood-tolerant plant species.

4. Materials and Methods

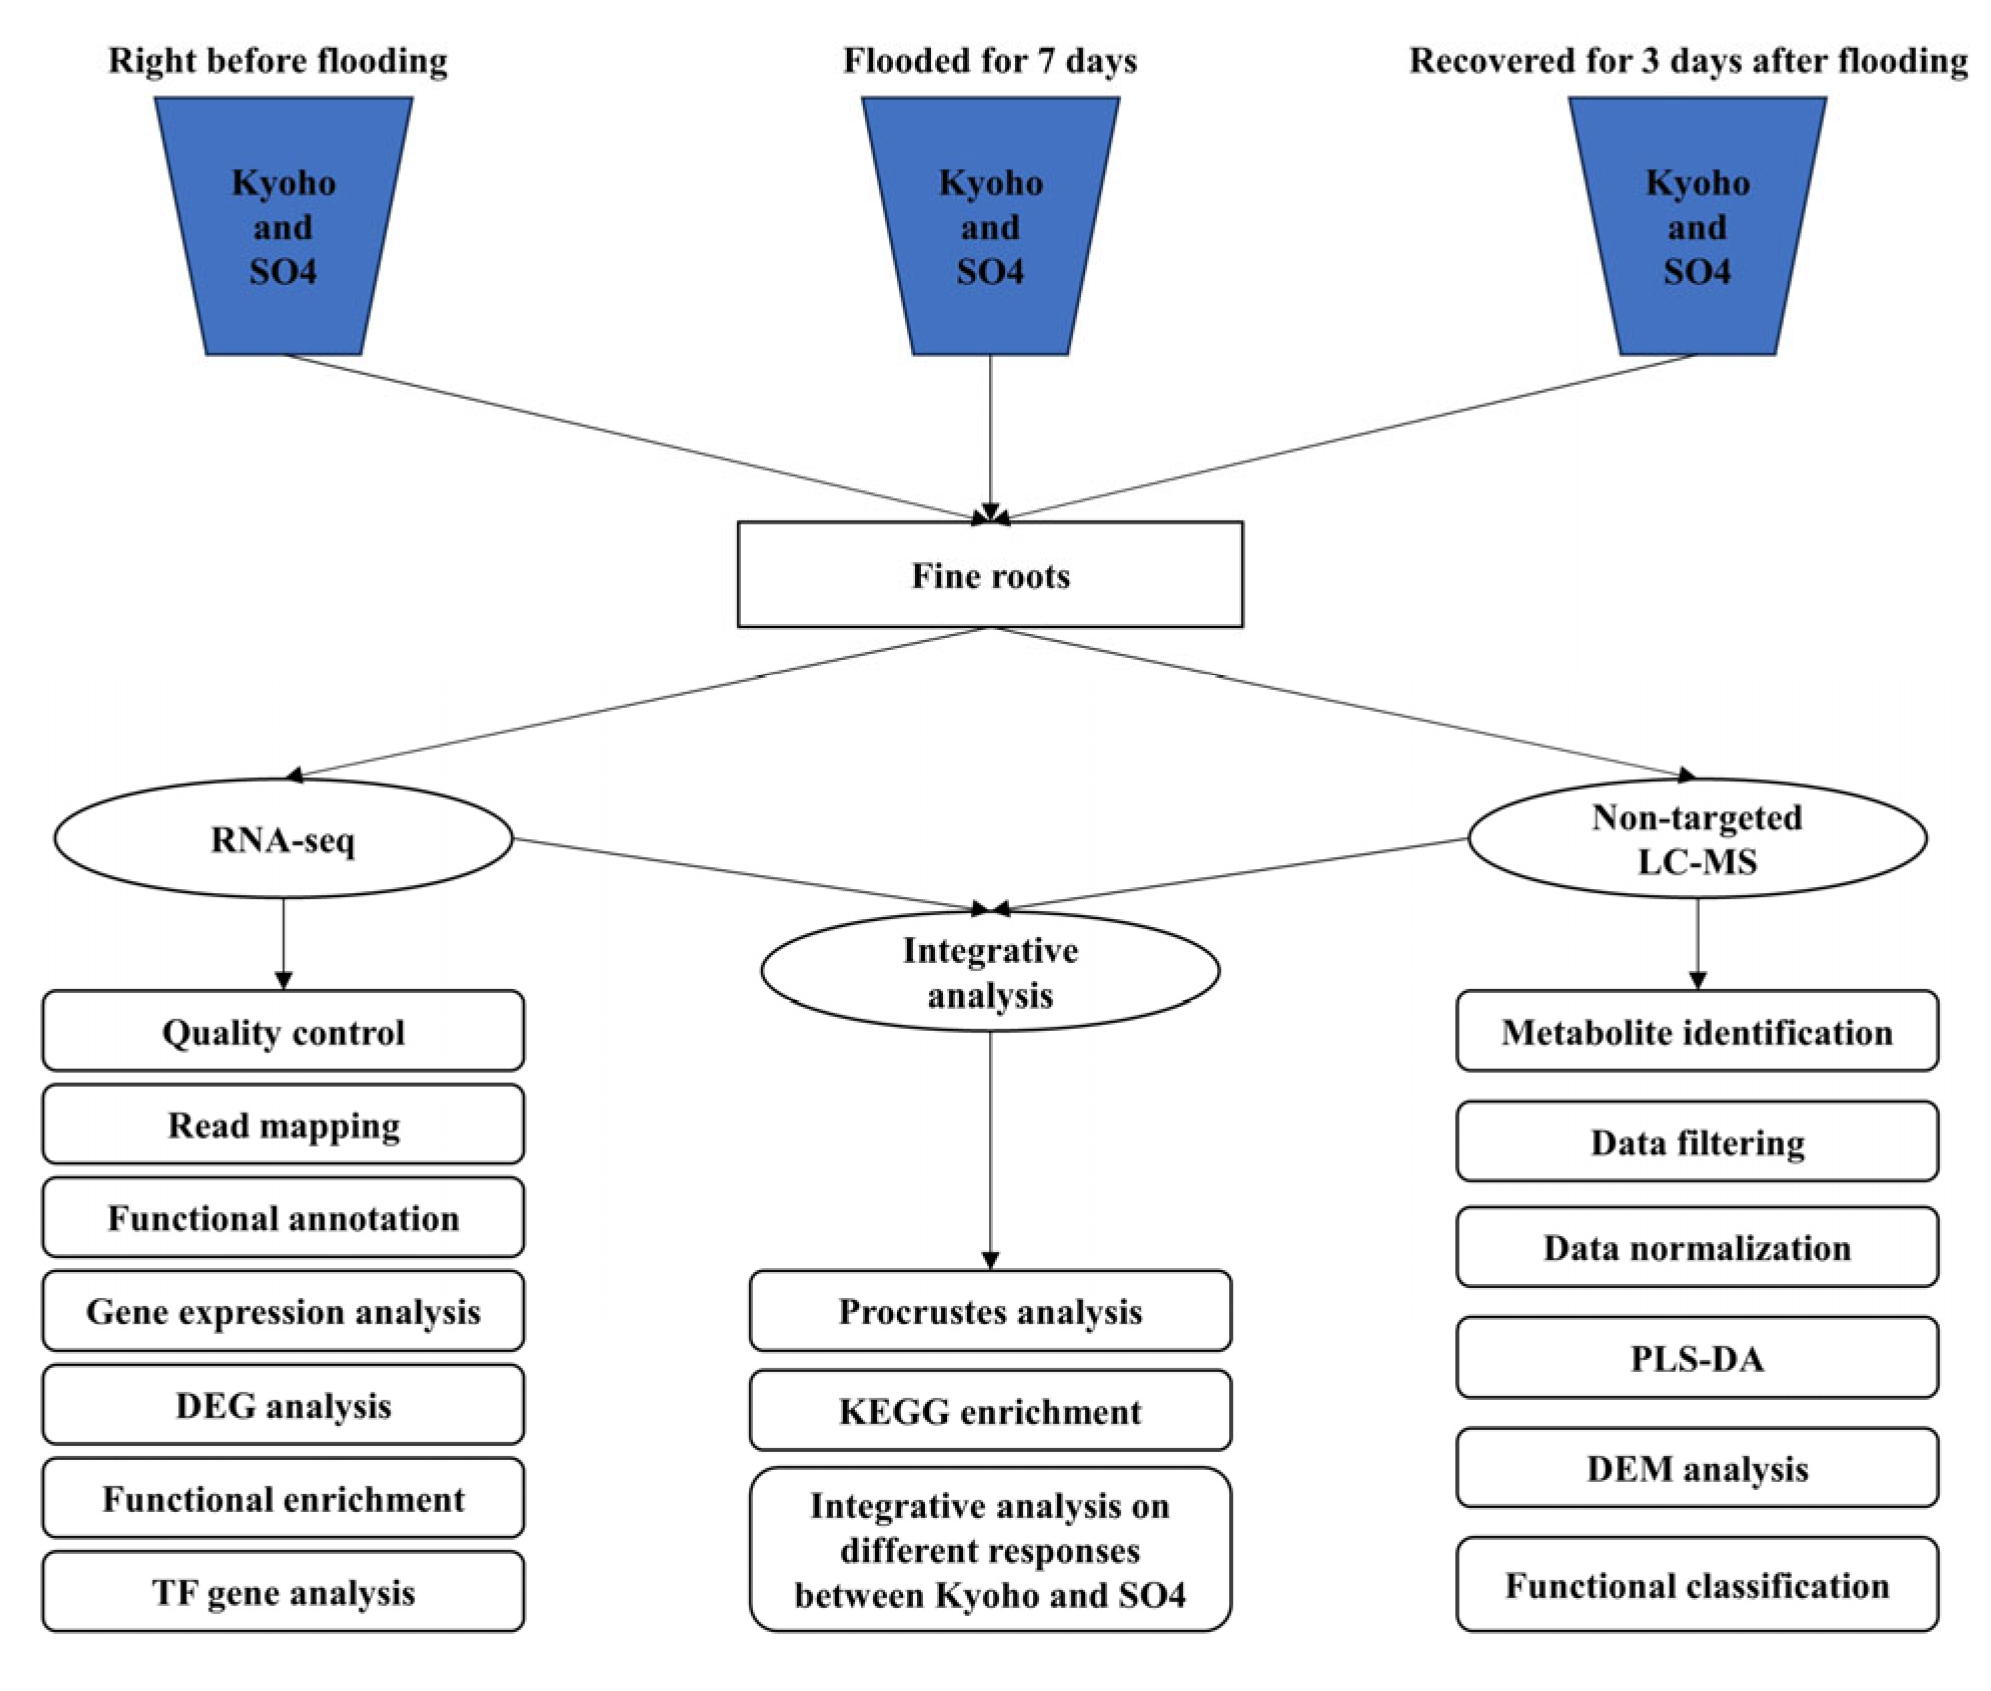
4.1. Plants and Experimental Treatments

The study was performed at the Leshan Normal University, Leshan, China (29°34 N, 103°45 E). The region has a warm and humid climate, with a yearly mean temperature of 17.1 °C, 1384 mm of rainfall, and an annual average of 359 frost-free days. About 80% of the rainfall occurs in the summer.
Two grape cultivars with known differences in their flood tolerance were selected as test materials. One is a popular table grape, cultivar Kyoho (flood-sensitive), while the other is a popular grape rootstock, cultivar SO4 (flood-tolerant). One-year-old branches of these two cultivars were collected in December of the first year and stored at 4 °C until March of the second year. Next, they were cut into 15 cm length cuttings, each with 2–3 buds, and these were planted in plastic pots (21 cm × 19 cm, with three drainage holes in the bottom) containing culture soil (pH 6.0, consisting of 2–5% N, P2O5, and K2O, with >20% organic matter) in an airy transplant greenhouse. After sprouting, all seedlings were watered weekly with a Hoagland solution and with tap water twice a week until the flood treatment was carried out. Seedlings with an average height of 50–60 cm were used for a 10-day treatment, that is, flooded for 7 days, then allowed to recover for 3 days after removing the flood condition (Figure 11).
This flood treatment was implemented in water tanks whose water level was maintained at 15 cm above the soil surface. Fine root samples were collected on day 0, day 7, and day 10, thereby generating six sample groups: KCK0 (Kyoho before flooding), KF7 (Kyoho flooded for 7 days), KF7R (Kyoho recovered for 3 days post-flooding), SCK0 (SO4 before flooding), SF7 (SO4 flooded for 7 days), and SF7R (SO4 recovered for 3 days post-flooding). Hence, KCK0 and SCK0 were considered the controls for Kyoho and SO4, respectively. The samples were immediately frozen in liquid nitrogen and kept at −80 °C until utilized for transcriptomic and metabolomic analyses. Three replicates were used for RNA-seq and the LC-MS analysis, and each replicate consisted of thoroughly mixed samples from five seedlings.

4.2. Transcriptomic Analysis

RNA-seq and data analysis were performed as described by Peng et al. [51]. The total RNA was extracted from fine root powder using the Plant RNA Purification Reagent (Invitrogen, Carlsbad, CA, USA). During the RNA extraction, any genomic DNA was removed using DNase I (Takara, Otsu, Japan). Both the RNA quality and quantity were verified by a NanoDrop2000 spectrophotometer (Thermo Fisher Scientific, Waltham, MA, USA), and the RNA integrity was checked using agarose gel electrophoresis, with the RNA integrity number then determined by an Agilent 2100 Nano Bioanalyzer (Agilent Technologies, Santa Clara, CA, USA). All RNA samples used to construct the sequencing libraries were of high quality (OD260/280 = 1.8–2.2). The obtained total RNA (1 μg) was used to prepare an RNA-seq transcriptome library by employing the TruSeq RNA sample preparation kit (Illumina, San Diego, CA, USA). The mRNA was isolated by oligo(dT) beads and fragmented in a fragmentation buffer. Next, the SuperScript double-stranded cDNA synthesis kit (Invitrogen), with random hexamer primers (Illumina), was used to synthesize the double-stranded cDNA; this was then subjected to end repair, phosphorylation, and A base addition, according to the Illumina protocol for library construction. Target cDNA fragments of 300 bp in length were selected on 2% low-range ultra agarose and PCR-amplified over 15 cycles using Phusion DNA polymerase (New England Biolabs, Ipswich, MA, USA). Finally, each paired-end sequencing library was quantified with TBS380 (Picogreen, Invitrogen) and sequenced on a HiSeq PE150 sequencer (Illumina; 2 × 150-bp read length).
To obtain clean reads, the raw paired-end reads were trimmed and quality controlled under the default parameters of SeqPrep (https://github.com/jstjohn/SeqPrep, accessed on 1 November 2022) and Sickle (https://github.com/najoshi/sickle, accessed on 2 November 2022). Then, the clean read alignment was performed using HISAT2 software (Version 2.1.0) [52], and the mapped reads were then assembled using StringTie via a reference-based approach [53]. The V. vinifera genome served as the reference genome for read mapping (12×; http://plants.ensembl.org/Vitis_vinifera/Info/Index, accessed on 3 November 2022). All transcriptomic data were analyzed on the Majorbio Cloud online platform (www.majorbio.com). Gene expression levels were calculated as clean read counts and are presented here as transcripts per million reads (TPMs). Gene abundance was qualified by RNA-seq and expectation maximization [54], with DESeq2 used to conduct the differential gene expression analysis [55]. Genes from roots in the flooded or recovery group with adjusted p-value (padj) < 0.05 and |log2 fold change| > 1 relative to the control group were designated as differentially expressed genes (DEGs) having statistical significance. GO and KEGG pathway analyses were carried out using Goatools and KOBAS [56]. Those GO terms and KEGG pathways with a Benjamini–Hochberg (BH)-corrected p-value ≤ 0.05 were considered enriched.

4.3. Metabolomic Analysis

The preparation of samples for metabolomic analysis was performed according to the methods used by Wang et al. [57], with a few changes. Metabolites from 50 mg fine root samples were extracted using 400 µL of a methanol:water (4:1, v/v) solution, with 0.02 mg/mL of L-2-chlorophenylalanin as an internal standard. After settling at –10 °C and crushing at 50 Hz for 6 min by a Wonbio-96c high-throughput tissue crusher (Shanghai Wanbo Biotechnology Co., Ltd., Shanghai, China), the metabolites were extracted by ultrasound at 40 kHz for 30 min at 5 °C. The proteins were precipitated by exposing the extractions to –20 °C for 30 min. After centrifugation at 13,000× g at 4 °C for 15 min, the ensuing supernatants were used for the LC-MS/MS analysis. Equal volumes of all samples were mixed to prepare a pooled quality control sample (QC). This QC was injected at regular intervals (every 10 samples) to monitor the stability of the analysis.
The LC-MS analysis was carried out following the suggestions of Xie et al. [58], with a few changes introduced to the methodology, on the UHPLC-Q Exactive HF-X system (Thermo Fisher Scientific). Each sample was separated by an HSS T3 column (100 mm × 2.1 mm, 1.8 μm) and then subjected to mass spectrometry detection. The mobile phases consisted of 0.1% formic acid in water:acetonitrile (95:5, v/v) (solvent A) and 0.1% formic acid in acetonitrile:isopropanol:water (47.5:47.5:5, v/v) (solvent B). The solvent gradient changed as follows: from 0 to 3.5 min, 0% B to 24.5% B (0.4 mL/min); from 3.5 to 5 min, 24.5% B to 65% B (0.4 mL/min); from 5 to 5.5 min, 65% B to 100% B (0.4 mL/min); from 5.5 to 7.4 min, 100% B (0.4 to 0.6 mL/min); from 7.4 to 7.6 min, 100% B to 51.5% B (0.6 mL/min); from 7.6 to 7.8 min, 51.5% B to 0% B (0.6 to 0.5 mL/min); from 7.8 to 9 min, 0% B (0.5 to 0.4 mL/min); and from 9 to 10 min, 0% B (0.4 mL/min), to equilibrate the systems. The sample injection volume was fixed at 2 µL, and the flow rate was set to 0.4 mL/min. The column temperature was maintained at 40 °C. The mass spectrometric data were collected using a Thermo UHPLC-Q Exactive HF-X Mass Spectrometer equipped with an electrospray ionization source operating in either the positive or negative ion mode. Its optimal conditions were set as follows: heater temperature, 425 °C; capillary temperature, 325 °C; sheath gas flow rate, 50 psi; Aux gas flow rate, 13 psi; ion-spray voltage floating (ISVF), –3500 V and 3500 V in the negative and positive mode, respectively; and normalized collision energy, 20–40–60 V rolling for MS/MS. The full MS resolution was 60,000, while the MS/MS resolution was 7500. Data acquisition was implemented in the Data Dependent Acquisition mode. All detections were carried out over a mass range of 70–1050 m/z.
The raw data of LC-MS was preprocessed by Progenesis QI software version 3.0 (Waters Corporation, Milford, MA, USA). The detected metabolites were searched and identified in the three databases: HMDB (http://www.hmdb.ca/, accessed on 5 November 2022), Metlin (https://metlin.scripps.edu/, accessed on 9 November 2022), and Majorbio. The resulting data after each database search were uploaded to the Majorbio Cloud platform (https://cloud.majorbio.com, accessed on 14 November 2022) for analysis. Those metabolic features detected in at least 80% of any set of samples were retained. After filtering, minimum metabolite values were imputed for specific samples whose metabolite levels fell below the lower limit of quantification. Then, the response intensity of a sample’s mass spectrum peaks was normalized by the sum normalization method. In tandem, those variables with a relative standard deviation (RSD) >30% compared to those in the QC samples were removed, and log10-transformed before their subsequent variance analysis. PCA and orthogonal least partial squares discriminant analysis (OPLS-DA) were implemented using the R package “ropls” (v1.6.2), and a 7-cycle interactive validation was used to evaluate the stability of each model. In addition, Student’s t test and a fold-difference analysis were applied. The metabolites having a variable importance in the projection of >1 (for the OPLS-DA) and p < 0.05 (Student’s t test) were defined as being significant DEMs. The DEMs compared to the controls were mapped to their biochemical pathways through metabolic enrichment and pathway analyses, based on a database search (KEGG, http://www.genome.jp/kegg/, accessed on 14 November 2022); those pathways with a BH-corrected p-value ≤ 0.05 were considered enriched.

5. Conclusions

We performed in-depth transcriptomic and metabolomic analyses to gain new knowledge about the molecular mechanisms of two grapevine seedlings that differ in their flood-tolerance response to flooding and post-flooding conditions, and the mechanisms of flooding response and post-flooding response in SO4, the flood-tolerant cultivar, were briefly illustrated in Figure 12. Under flooding stress, efficient ethylene synthesis and regulation can be maintained in the roots of SO4. The JA-mediated AsA-GSH cycle plays an important role in ROS scavenging. The flood-tolerant SO4 cultivar adopts LOQS when faced with flooding stress, thus successfully shifting from aerobic respiration to anaerobic fermentation in terms of its energy supply, reduced O2 consumption, and used energy, so as to maintain its ROS-scavenging capacity. However, this mechanism is partly absent in the flood-sensitive Kyoho cultivar. Expression levels of many genes for ERFs, WRKYs, and bHLHs are also specifically upregulated in the SF7 seedlings, which may exhibit critical functions in the flood response of SO4. During the 3-day post-flooding recovery period, SF7R is capable of maintaining a robust ROS scavenging ability via the JA-mediated AsA-GSH cycle to cope with reoxygenation stress. MYC, a key gene in the JA response, is only significantly upregulated in its expression in the SF7R groups, while the JA content and MYC gene expression are markedly lower in KF7R than in its control group. In the KF7R seedlings, the expression of many genes related to the biosynthesis of CK, BR, ETH, and GA, as well as the BR response, are considerably downregulated, which seriously delays the growth of the Kyoho grapevines during the recovery period, whereas SF7R was able to rapidly restore its normal growth. We find that 4-coumaroyl-CoA is mainly used in the synthesis of monolignol in SF7R to maintain SO4′s rapid growth, yet in KF7R, it is mainly used in the synthesis of flavonoids to compensate for impaired ROS scavenging. Further, the results of this study suggest that an ER-related E3s gene might be involved in the plant response to post-flooding, as a March6 gene was specifically and significantly upregulated in SF7R seedlings, but its function and regulatory mechanism require further investigation. Our experimental findings provide useful insights into the molecular mechanisms of flood tolerance in grapevines, and the DEGs in SO4, like TF genes in ERFs, WRKYs, and bHLHs family, could be applied for further study regarding the breeding of flood-tolerant rootstock cultivars.

Supplementary Materials

The following supporting information can be downloaded at: https://www.mdpi.com/article/10.3390/horticulturae9090980/s1, Supplementary Table S1: Qualities of RNA-seq libraries; Supplementary Table S2: Expression level changes of DEGs; Supplementary Table S3: GO enrichment of DEGs; Supplementary Table S4: Identified metabolites; Supplementary Table S5: Contents change of DEMs.

Author Contributions

Formal analysis, Y.P.; writing—original draft preparation, J.C.; investigation, W.L. and P.H.; validation, Q.Z.; visualization, X.H.; writing—review and editing, Y.Z. (Yong Zhou) and Y.Z. (Ying Zheng). All authors have read and agreed to the published version of the manuscript.

Funding

This research was supported by the Research Foundation of Leshan Normal University for Talented Scholars (RC202005), the Academic Discipline Breeding Project of Leshan Normal University (2022SSDJS007), the Scientific Research Breeding Project of Leshan Normal University (KYPY2023-0007), and the Natural Science Foundation of Sichuan Province (2023NSFSC1164 and 2023YFN0068).

Data Availability Statement

RNA-seq raw data have been deposited in the NCBI Short Read Archive (SRA) database, and the accession numbers are PRJNA1002607.

Conflicts of Interest

The authors declare no conflict of interest.

References

  1. Pedersen, O.; Perata, P.; Voesenek, L.A.C.J. Flooding and low oxygen responses in plants. Funct. Plant Biol. 2017, 44, iii–vi. [Google Scholar] [CrossRef] [PubMed]
  2. Bailey-Serres, J.; Fukao, T.; Gibbs, D.J.; Holdsworth, M.J.; Lee, S.C.; Licausi, F.; Perata, P.; Voesenek, L.A.C.J.; van Dongen, J.T. Making sense of low oxygen sensing. Trends Plant Sci. 2012, 17, 129–138. [Google Scholar] [CrossRef] [PubMed]
  3. Tewari, S.; Mishra, A. Chapter 18—Flooding Stress in Plants and Approaches to Overcome. In Plant Metabolites and Regulation Under Environmental Stress; Ahmad, P., Ahanger, M.A., Singh, V.P., Tripathi, D.K., Alam, P., Alyemeni, M.N., Eds.; Academic Press: Cambridge, MA, USA, 2018; pp. 355–366. [Google Scholar]
  4. Colmer, T.D.; Voesenek, L. Flooding tolerance: Suites of plant traits in variable environments. Funct. Plant Biol. 2009, 36, 665–681. [Google Scholar] [CrossRef] [PubMed]
  5. Loreti, E.; van Veen, H.; Perata, P. Plant responses to flooding stress. Curr. Opin. Plant Biol. 2016, 33, 64–71. [Google Scholar] [CrossRef] [PubMed]
  6. Perata, P.; Voesenek, L.A.C.J. Submergence tolerance in rice requires Sub1A, an ethylene-response-factor-like gene. Trends Plant Sci. 2007, 12, 43–46. [Google Scholar] [CrossRef] [PubMed]
  7. Peng, Y.; Zhou, Z.; Zhang, Z.; Yu, X.; Zhang, X.; Du, K. Molecular and physiological responses in roots of two full-sib poplars uncover mechanisms that contribute to differences in partial submergence tolerance. Sci. Rep. 2018, 8, 12829. [Google Scholar] [CrossRef]
  8. Sarwat, M.; Ahmad, A.; Abdin, M.Z.; Ibrahim, M.M. Stress Signaling in Plants: Genomics and Proteomics Perspective; Physiological, Metabolic, and Molecular Responses of Plants to Abiotic Stress; Springer: Berlin/Heidelberg, Germany, 2017; Volume 2, pp. 1–35. [Google Scholar] [CrossRef]
  9. Sasidharan, R.; Hartman, S.; Liu, Z.; Martopawiro, S.; Sajeev, N.; Veen, H.; Yeung, E.; Voesenek, L. Signal Dynamics and Interactions during Flooding Stress. Plant Physiol. 2017, 176, 1106–1117. [Google Scholar] [CrossRef] [PubMed]
  10. Lekshmy, S.; Jha, S.K.; Sairam, R.K. Physiological and Molecular Mechanisms of Flooding Tolerance in Plants. In Elucidation of Abiotic Stress Signaling in Plants: Functional Genomics Perspectives; Pandey, G.K., Ed.; Springer: New York, NY, USA, 2015; Volume 2, pp. 227–242. [Google Scholar]
  11. Striker, G.G. Time is on our side: The importance of considering a recovery period when assessing flooding tolerance in plants. Ecol. Res. 2012, 27, 983–987. [Google Scholar] [CrossRef]
  12. Yeung, E.; Bailey-Serres, J.; Sasidharan, R. After The Deluge: Plant Revival Post-Flooding. Trends Plant Sci. 2019, 24, 443–454. [Google Scholar] [CrossRef]
  13. Kreuzwieser, J.; Hauberg, J.; Howell, K.; Carroll, A.; Rennenberg, H.; Millar, A.; Whelan, J. Differential Response of Gray Poplar Leaves and Roots Underpins Stress Adaptation during Hypoxia. Plant Physiol. 2008, 149, 461–473. [Google Scholar] [CrossRef]
  14. Peng, Y.; Dong, Y.; Tu, B.; Zhou, Z.; Zheng, B.; Luo, L.; Shi, C.; Du, K. Roots play a vital role in flood-tolerance of poplar demonstrated by reciprocal grafting. Flora Morphol. Distrib. Funct. Ecol. Plants 2013, 208, 479–487. [Google Scholar] [CrossRef]
  15. Chen, S.; Yin, C.; Strasser, R.J.; Govindjee; Yang, C.; Qiang, S. Reactive oxygen species from chloroplasts contribute to 3-acetyl-5-isopropyltetramic acid-induced leaf necrosis of Arabidopsis thaliana. Plant Physiol. Biochem. 2012, 52, 38–51. [Google Scholar] [CrossRef] [PubMed]
  16. Yeung, E.; van Veen, H.; Vashisht, D.; Sobral Paiva, A.L.; Hummel, M.; Rankenberg, T.; Steffens, B.; Steffen-Heins, A.; Sauter, M.; de Vries, M.; et al. A stress recovery signaling network for enhanced flooding tolerance in Arabidopsis thaliana. Proc. Natl. Acad. Sci. USA 2018, 115, E6085–E6094. [Google Scholar] [CrossRef] [PubMed]
  17. Chen, R.; Cao, P.; Tian, D.; Chen, H.; Zhu, C.; Zhu, B. Postharvest Biology; Technology. Edible coatings inhibit the postharvest berry abscission of table grapes caused by sulfur dioxide during storage. Postharvest Biol. Technol. 2019, 152, 1–8. [Google Scholar] [CrossRef]
  18. Mancuso, S.; Marras, A.M. Adaptative Response of Vitis Root to Anoxia. Plant Cell Physiol. 2006, 47, 401–409. [Google Scholar] [CrossRef] [PubMed]
  19. Mugnai, S.; Marras, A.; Mancuso, S. Effect of Hypoxic Acclimation on Anoxia Tolerance in Vitis Roots: Response of Metabolic Activity and K+ Fluxes. Plant Cell Physiol. 2011, 52, 1107–1116. [Google Scholar] [CrossRef] [PubMed]
  20. Ruperti, B.; Botton, A.; Populin, F.; Eccher, G.; Brilli, M.; Quaggiotti, S.; Trevisan, S.; Cainelli, N.; Guarracino, P.; Schievano, E.; et al. Flooding Responses on Grapevine: A Physiological, Transcriptional, and Metabolic Perspective. Front. Plant Sci. 2019, 10, 339. [Google Scholar] [CrossRef] [PubMed]
  21. Zhou, W.; Chen, F.; Meng, Y.; Chandrasekaran, U.; Luo, X.; Yang, W.; Shu, K. Plant waterlogging/flooding stress responses: From seed germination to maturation. Plant Physiol. Biochem. 2020, 148, 228–236. [Google Scholar] [CrossRef]
  22. Panat, N.A.; Maurya, D.K.; Ghaskadbi, S.S.; Sandur, S.K. Troxerutin, a plant flavonoid, protects cells against oxidative stress-induced cell death through radical scavenging mechanism. Food Chem. 2016, 194, 32–45. [Google Scholar] [CrossRef]
  23. Hodaei, M.; Rahimmalek, M.; Arzani, A.; Talebi, M. The effect of water stress on phytochemical accumulation, bioactive compounds and expression of key genes involved in flavonoid biosynthesis in Chrysanthemum morifolium L. Ind. Crops Prod. 2018, 120, 295–304. [Google Scholar] [CrossRef]
  24. Yang, L.-l.; Yang, L.; Yang, X.; Zhang, T.; Lan, Y.-m.; Zhao, Y.; Han, M.; Yang, L.-m. Drought stress induces biosynthesis of flavonoids in leaves and saikosaponins in roots of Bupleurum chinense DC. Phytochemistry 2020, 177, 112434. [Google Scholar] [CrossRef] [PubMed]
  25. Banti, V.; Mafessoni, F.; Loreti, E.; Alpi, A.; Perata, P. The Heat-Inducible Transcription Factor HsfA2 Enhances Anoxia Tolerance in Arabidopsis. Plant Physiol. 2010, 152, 1471–1483. [Google Scholar] [CrossRef] [PubMed]
  26. Rauf, M.; Arif, M.; Fisahn, J.; Xue, G.-P.; Balazadeh, S.; Mueller-Roeber, B. NAC transcription factor SPEEDY HYPONASTIC GROWTH regulates flooding-induced leaf movement in Arabidopsis. Plant Cell 2013, 25, 4941–4955. [Google Scholar] [CrossRef] [PubMed]
  27. Raineri, J.; Ribichich, K.; Chan, R. The sunflower transcription factor HaWRKY76 confers drought and flood tolerance to Arabidopsis thaliana plants without yield penalty. Plant Cell Rep. 2015, 34, 2065–2080. [Google Scholar] [CrossRef] [PubMed]
  28. Chen, W.; Qiuming, Y.; Patil, G.; Agarwal, G.; Deshmukh, R.; Lin, L.; Wang, B.; Wang, Y.; Prince, S.; Song, L.; et al. Identification and Comparative Analysis of Differential Gene Expression in Soybean Leaf Tissue under Drought and Flooding Stress Revealed by RNA-Seq. Front. Plant Sci. 2016, 7, 1044. [Google Scholar] [CrossRef] [PubMed]
  29. Sasidharan, R.; Voesenek, L.A. Ethylene-Mediated Acclimations to Flooding Stress. Plant Physiol. 2015, 169, 3–12. [Google Scholar] [CrossRef] [PubMed]
  30. Vidoz, M.L.; Loreti, E.; Mensuali, A.; Alpi, A.; Perata, P. Hormonal interplay during adventitious root formation in flooded tomato plants. Plant J. Cell Mol. Biol. 2010, 63, 551–562. [Google Scholar] [CrossRef]
  31. Sauter, M. Root responses to flooding. Curr. Opin. Plant Biol. 2013, 16, 282–286. [Google Scholar] [CrossRef]
  32. Yamauchi, T.; Watanabe, K.; Fukazawa, A.; Mori, H.; Abe, F.; Kawaguchi, K.; Oyanagi, A.; Nakazono, M. Ethylene and reactive oxygen species are involved in root aerenchyma formation and adaptation of wheat seedlings to oxygen-deficient conditions. J. Exp. Bot. 2014, 65, 261–273. [Google Scholar] [CrossRef]
  33. Khan, M.I.R.; Trivellini, A.; Chhillar, H.; Chopra, P.; Ferrante, A.; Khan, N.A.; Ismail, A.M. The significance and functions of ethylene in flooding stress tolerance in plants. Environ. Exp. Bot. 2020, 179, 104188. [Google Scholar] [CrossRef]
  34. Steffens, B.; Geske, T.; Sauter, M. Aerenchyma formation in the rice stem and its promotion by H2O2. New Phytol. 2011, 190, 369–378. [Google Scholar] [CrossRef] [PubMed]
  35. Steffens, B.; Kovalev, A.; Gorb, S.N.; Sauter, M. Emerging roots alter epidermal cell fate through mechanical and reactive oxygen species signaling. Plant Cell 2012, 24, 3296–3306. [Google Scholar] [CrossRef] [PubMed]
  36. Peng, Y.; Zhou, Z.; Tong, R.; Hu, X.; Du, K. Anatomy and ultrastructure adaptations to soil flooding of two full-sib poplar clones differing in flood-tolerance. Flora 2017, 233, 90–98. [Google Scholar] [CrossRef]
  37. Caverzan, A.; Passaia, G.; Barcellos Rosa, S.; Ribeiro, C.; Lazzarotto, F.; Margis-Pinheiro, M. Plant responses to stresses: Role of ascorbate peroxidase in the antioxidant protection. Genet. Mol. Biol. 2012, 35, 1011–1019. [Google Scholar] [CrossRef] [PubMed]
  38. Yuan, L.-B.; Dai, Y.-S.; Xie, L.-J.; Yu, L.-J.; Zhou, Y.; Lai, Y.-X.; Yang, Y.-C.; Xu, L.; Chen, Q.-F.; Xiao, S. Jasmonate Regulates Plant Responses to Postsubmergence Reoxygenation through Transcriptional Activation of Antioxidant Synthesis. Plant Physiol. 2017, 173, 1864–1880. [Google Scholar] [CrossRef]
  39. Farhangi-Abriz, S.; Ghassemi-Golezani, K. Jasmonates: Mechanisms and functions in abiotic stress tolerance of plants. Biocatal. Agric. Biotechnol. 2019, 20, 101210. [Google Scholar] [CrossRef]
  40. Bailey-Serres, J.; Voesenek, L.A. Flooding stress: Acclimations and genetic diversity. Annu. Rev. Plant Biol. 2008, 59, 313–339. [Google Scholar] [CrossRef]
  41. Petra, R.; Planta, M.J. Flooding tolerance of Carex species. I. Root structure. Planta 1998, 207, 189–198. [Google Scholar]
  42. Crawford, R.M.M.; Walton, J.C.; Wollenweber-Ratzer, B. Similarities between post-ischaemic injury to animal tissues and post-anoxic injury in plants. Proc. R. Soc. Edinb. Sect. B Biol. Sci. 1994, 102, 325–332. [Google Scholar] [CrossRef]
  43. Chen, J.; Nolan, T.M.; Ye, H.; Zhang, M.; Tong, H.; Xin, P.; Chu, J.; Chu, C.; Li, Z.; Yin, Y. Arabidopsis WRKY46, WRKY54, and WRKY70 Transcription Factors Are Involved in Brassinosteroid-Regulated Plant Growth and Drought Responses. Plant Cell 2017, 29, 1425–1439. [Google Scholar] [CrossRef]
  44. Nitsch, L.M.C.; Oplaat, C.; Feron, R.; Ma, Q.; Wolters-Arts, M.; Hedden, P.; Mariani, C.; Vriezen, W.H. Abscisic acid levels in tomato ovaries are regulated by LeNCED1 and SlCYP707A1. Planta 2009, 229, 1335–1346. [Google Scholar] [CrossRef] [PubMed]
  45. Liu, J.-X.; Howell, S.H. Managing the protein folding demands in the endoplasmic reticulum of plants. New Phytol. 2016, 211, 418–428. [Google Scholar] [CrossRef] [PubMed]
  46. Liu, R.; Xia, R.; Xie, Q.; Wu, Y. Endoplasmic reticulum-related E3 ubiquitin ligases: Key regulators of plant growth and stress responses. Plant Commun. 2021, 2, 100186. [Google Scholar] [CrossRef] [PubMed]
  47. Lü, S.; Zhao, H.; Des Marais, D.L.; Parsons, E.P.; Wen, X.; Xu, X.; Bangarusamy, D.K.; Wang, G.; Rowland, O.; Juenger, T.; et al. Arabidopsis ECERIFERUM9 Involvement in Cuticle Formation and Maintenance of Plant Water Status. Plant Physiol. 2012, 159, 930–944. [Google Scholar] [CrossRef] [PubMed]
  48. Doblas, V.G.; Amorim-Silva, V.; Posé, D.; Rosado, A.; Esteban, A.; Arró, M.; Azevedo, H.; Bombarely, A.; Borsani, O.; Valpuesta, V.; et al. The SUD1 Gene Encodes a Putative E3 Ubiquitin Ligase and Is a Positive Regulator of 3-Hydroxy-3-Methylglutaryl Coenzyme A Reductase Activity in Arabidopsis. Plant Cell 2013, 25, 728–743. [Google Scholar] [CrossRef] [PubMed]
  49. Zhao, H.; Zhang, H.; Cui, P.; Ding, F.; Wang, G.; Li, R.; Jenks, M.A.; Lü, S.; Xiong, L. The Putative E3 Ubiquitin Ligase ECERIFERUM9 Regulates Abscisic Acid Biosynthesis and Response during Seed Germination and Postgermination Growth in Arabidopsis. Plant Physiol. 2014, 165, 1255–1268. [Google Scholar] [CrossRef] [PubMed]
  50. Li, L.-M.; Lü, S.-Y.; Li, R.-J. The Arabidopsis endoplasmic reticulum associated degradation pathways are involved in the regulation of heat stress response. Biochem. Biophys. Res. Commun. 2017, 487, 362–367. [Google Scholar] [CrossRef] [PubMed]
  51. Peng, Y.; Gu, X.; Zhou, Q.; Huang, J.; Liu, Z.; Zhou, Y.; Zheng, Y. Molecular and physiologic mechanisms of advanced ripening by trunk girdling at early veraison of ‘Summer Black’ grape. Front. Plant Sci. 2022, 13, 1012741. [Google Scholar] [CrossRef]
  52. Kim, D.; Langmead, B.; Salzberg, S.L. HISAT: A fast spliced aligner with low memory requirements. Nat. Methods 2015, 12, 357–360. [Google Scholar] [CrossRef]
  53. Pertea, M.; Pertea, G.M.; Antonescu, C.M.; Chang, T.C.; Mendell, J.T.; Salzberg, S.L. StringTie enables improved reconstruction of a transcriptome from RNA-seq reads. Nat. Biotechnol. 2015, 33, 290–295. [Google Scholar] [CrossRef]
  54. Li, B.; Dewey, C.N. RSEM: Accurate transcript quantification from RNA-Seq data with or without a reference genome. BMC Bioinform. 2011, 12, 323. [Google Scholar] [CrossRef] [PubMed]
  55. Love, M.I.; Huber, W.; Anders, S. Moderated estimation of fold change and dispersion for RNA-seq data with DESeq2. Genome Biol. 2014, 15, 550. [Google Scholar] [CrossRef] [PubMed]
  56. Xie, C.; Mao, X.; Huang, J.; Ding, Y.; Wu, J.; Dong, S.; Kong, L.; Gao, G.; Li, C.Y.; Wei, L. KOBAS 2.0: A web server for annotation and identification of enriched pathways and diseases. Nucleic Acids Res. 2011, 39, W316–W322. [Google Scholar] [CrossRef] [PubMed]
  57. Wang, X.; Sun, G.; Feng, T.; Zhang, J.; Huang, X.; Wang, T.; Xie, Z.; Chu, X.; Yang, J.; Wang, H.; et al. Sodium oligomannate therapeutically remodels gut microbiota and suppresses gut bacterial amino acids-shaped neuroinflammation to inhibit Alzheimer’s disease progression. Cell Res. 2019, 29, 787–803. [Google Scholar] [CrossRef] [PubMed]
  58. Xie, M.; Chen, W.; Lai, X.; Dai, H.; Sun, H.; Zhou, X.; Chen, T. Metabolic responses and their correlations with phytochelatins in Amaranthus hypochondriacus under cadmium stress. Environ. Pollut. 2019, 252, 1791–1800. [Google Scholar] [CrossRef]
Figure 1. Principal component analysis (PCA) and statistical analysis of differentially expressed genes (DEGs). (A) PCA of the 18 RNA-seq libraries. (B) Numbers of DEGs. (C) Venn diagram of DEGs.
Horticulturae 09 00980 g001
Figure 2. Significantly enriched KEGG pathways under flooding and post-flooding conditions in the Kyoho and SO4 grapevine cultivars.
Horticulturae 09 00980 g002
Figure 3. Analysis of differentially expressed genes (DEGs) encoding transcription factors (TFs). (A) Statistical analysis of differentially expressed TF gene numbers at the gene family level. (B) The log2 fold-change values of candidate TF genes related to flood tolerance. All values are from comparisons of treatment vs. control groups. NS, not significantly changed in comparison with control.
Horticulturae 09 00980 g003aHorticulturae 09 00980 g003b
Figure 4. PLS-DA, quantitative analysis, and classification of DEMs (differentially expressed metabolites). (A) PLS-DA map of the 18 metabolomic libraries. (B) Numbers of upregulated and downregulated DEMs during flooding and post-flooding conditions. (C) Classification of DEMs according to the HMDB database.
Horticulturae 09 00980 g004aHorticulturae 09 00980 g004b
Figure 5. Fold-changes for the log10 values of DEMs in the (A) phenylpropanoids and polyketides superclass, (B) organic acids and derivatives superclass, and (C) organic oxygen compounds superclass. Values for metabolites are the fold-change of their log10 values. All values are from comparisons of treatment vs. control groups. NS, not significantly changed in comparison with control.
Horticulturae 09 00980 g005aHorticulturae 09 00980 g005b
Figure 6. Integrative analysis of transcriptome and metabolome data for the two grapevine cultivars. (A) Procrustes analysis of the six groups. (B) KEGG enrichment analysis and corresponding p-value.
Horticulturae 09 00980 g006aHorticulturae 09 00980 g006b
Figure 7. Metabolite changes and expression change of genotype-specific DEGs (differentially expressed genes) related to JA response (A) and ETH response (B) under flooding (at day 7) in the Kyoho and SO4 grapevine cultivars. Values for metabolites are the fold-change of their log10 values; those for DEGs are their log2 fold-change values. All values are from the comparisons of the treatment vs. control groups. NS, not significantly changed in comparison with control. The left blocks belong to KF7, while the right blocks belong to SF7.
Horticulturae 09 00980 g007aHorticulturae 09 00980 g007b
Figure 8. Metabolite changes and expression change of genotype-specific DEGs (differentially expressed genes) related to carbohydrates metabolism under flooding (day 7) in the Kyoho and SO4 grapevine cultivars. Values of metabolites are the fold-change of their log10 values; those for DEGs are their log2 fold-change values. All values are from the comparisons of the treatment vs. control groups. NS, not significantly changed. The left blocks belong to KF7, while the right blocks belong to SF7.
Horticulturae 09 00980 g008
Figure 9. Metabolite changes and expression change of genotype-specific DEGs (differentially expressed genes) related to phytohormone regulation under post-flooding (day 10) in the Kyoho and SO4 grapevine cultivars. (A) JA; (B) BR and CK; (C) ETH, GA, and ABA. Values for metabolites are the fold-change of their log10 values; those for DEGs are their log2 fold-change values. All values are from the comparisons of the treatment vs. control groups. NS, not significantly changed in comparison with control. The left blocks belong to KF7R, while the right blocks belong to SF7R.
Horticulturae 09 00980 g009aHorticulturae 09 00980 g009b
Figure 10. Metabolite changes and expression change of genotype-specific DEGs (differentially expressed genes) related to (A) flavonoid and monolignol biosynthesis and (B) endoplasmic reticulum-associated degradation (ERAD) under post-flooding (day 10) in the Kyoho and SO4 grapevine cultivars. Values for metabolites are the fold-change values of their log10 values; those for DEGs are their log2 fold-change values. All values are from the comparison of the treatment vs. control groups. NS, not significantly changed in comparison with control. The left blocks belong to KF7R, while the right blocks belong to SF7R.
Horticulturae 09 00980 g010
Figure 11. A brief schematic introducing the research steps used in this study.
Horticulturae 09 00980 g011
Figure 12. A briefly summary of the mechanism of the flooding response and post-flooding response in flood-tolerant SO4.
Horticulturae 09 00980 g012
Table 1. Description of sample groups.
Sample GroupCultivarTreatment
KCK0KyohoSeedlings sampled before flooding treatment, serving as the control
KF7KyohoSeedlings were flooded for 7 days
KF7RKyohoSeedlings recovered for 3 days after a 7-day flooding treatment
SCK0SO4Seedlings sampled before flooding treatment, serving as the control
SF7SO4Seedlings were flooded for 7 days
SF7RSO4Seedlings recovered for 3 days after a 7-day flooding treatment
Disclaimer/Publisher’s Note: The statements, opinions and data contained in all publications are solely those of the individual author(s) and contributor(s) and not of MDPI and/or the editor(s). MDPI and/or the editor(s) disclaim responsibility for any injury to people or property resulting from any ideas, methods, instructions or products referred to in the content.

