
Improvement of Environmental Uniformity in a Seedling Plant Factory with Porous Panels Using Computational Fluid Dynamics


Abstract
:1. Introduction
2. Materials and Methods
2.1. The Experimental Seedling Plant Factory
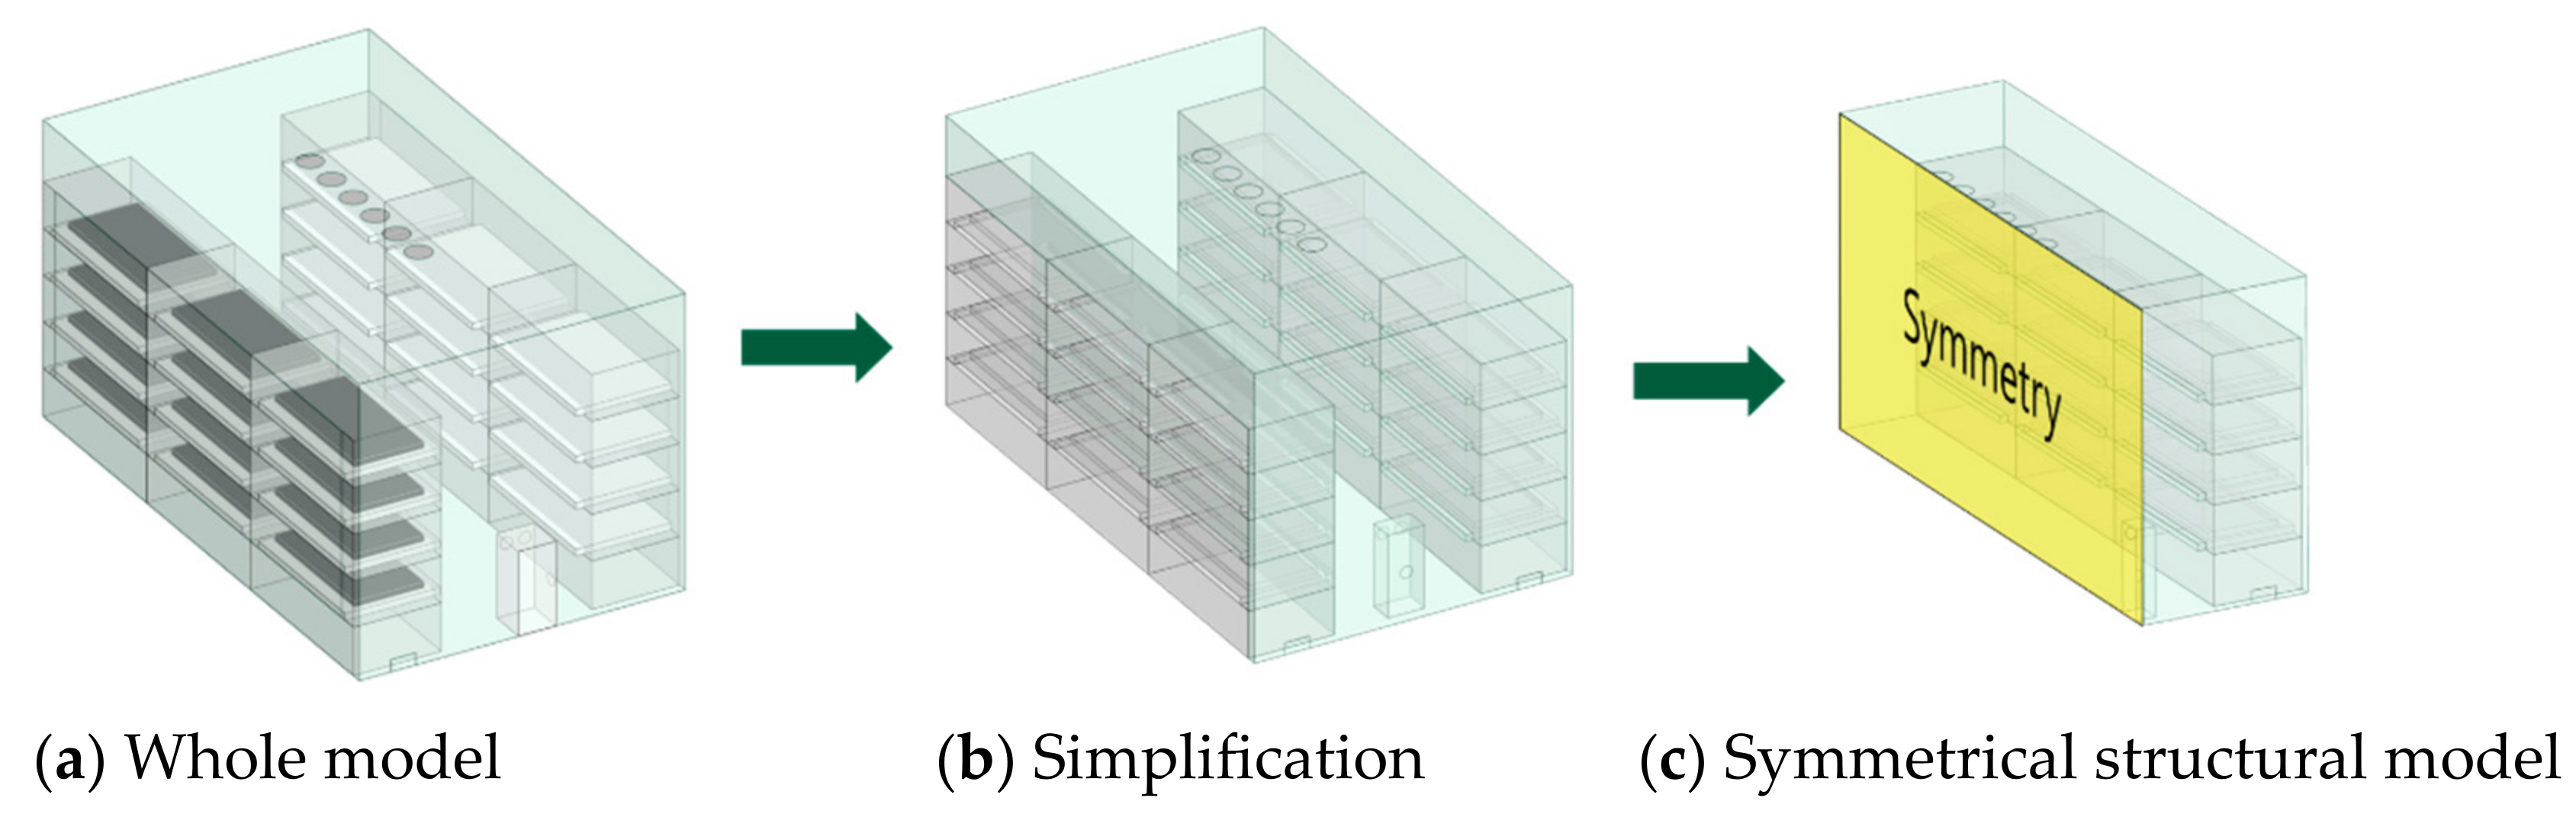
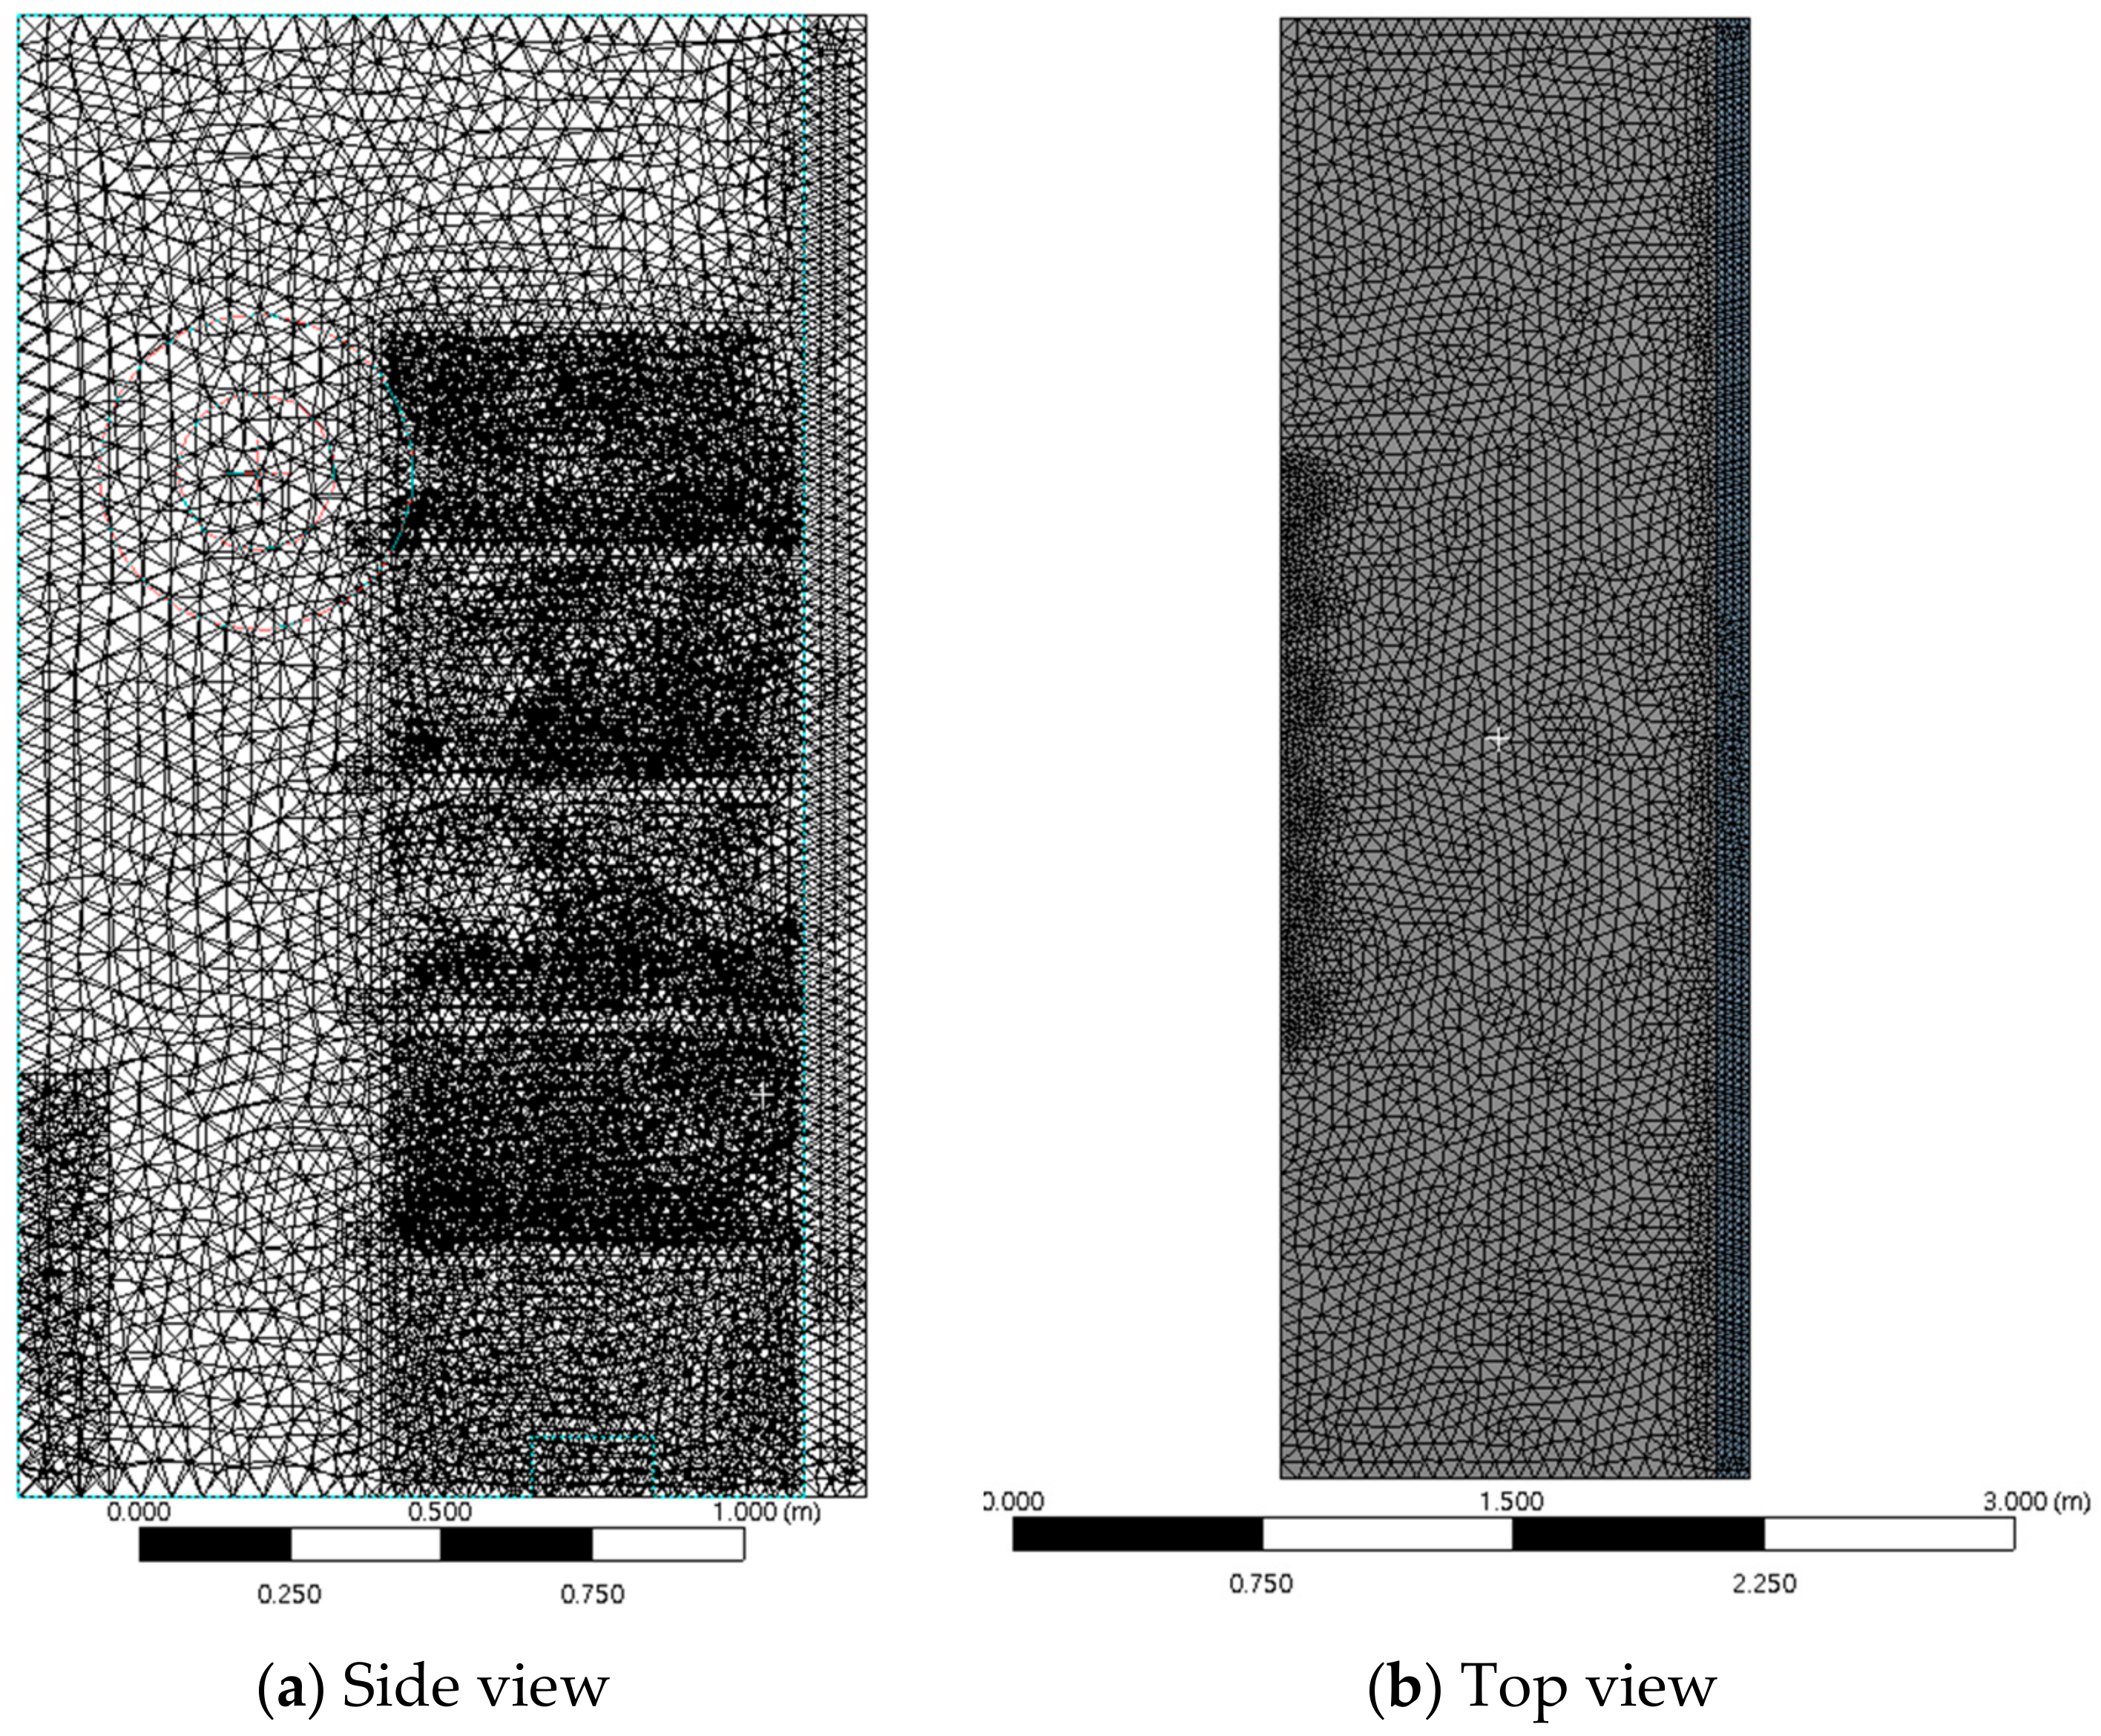
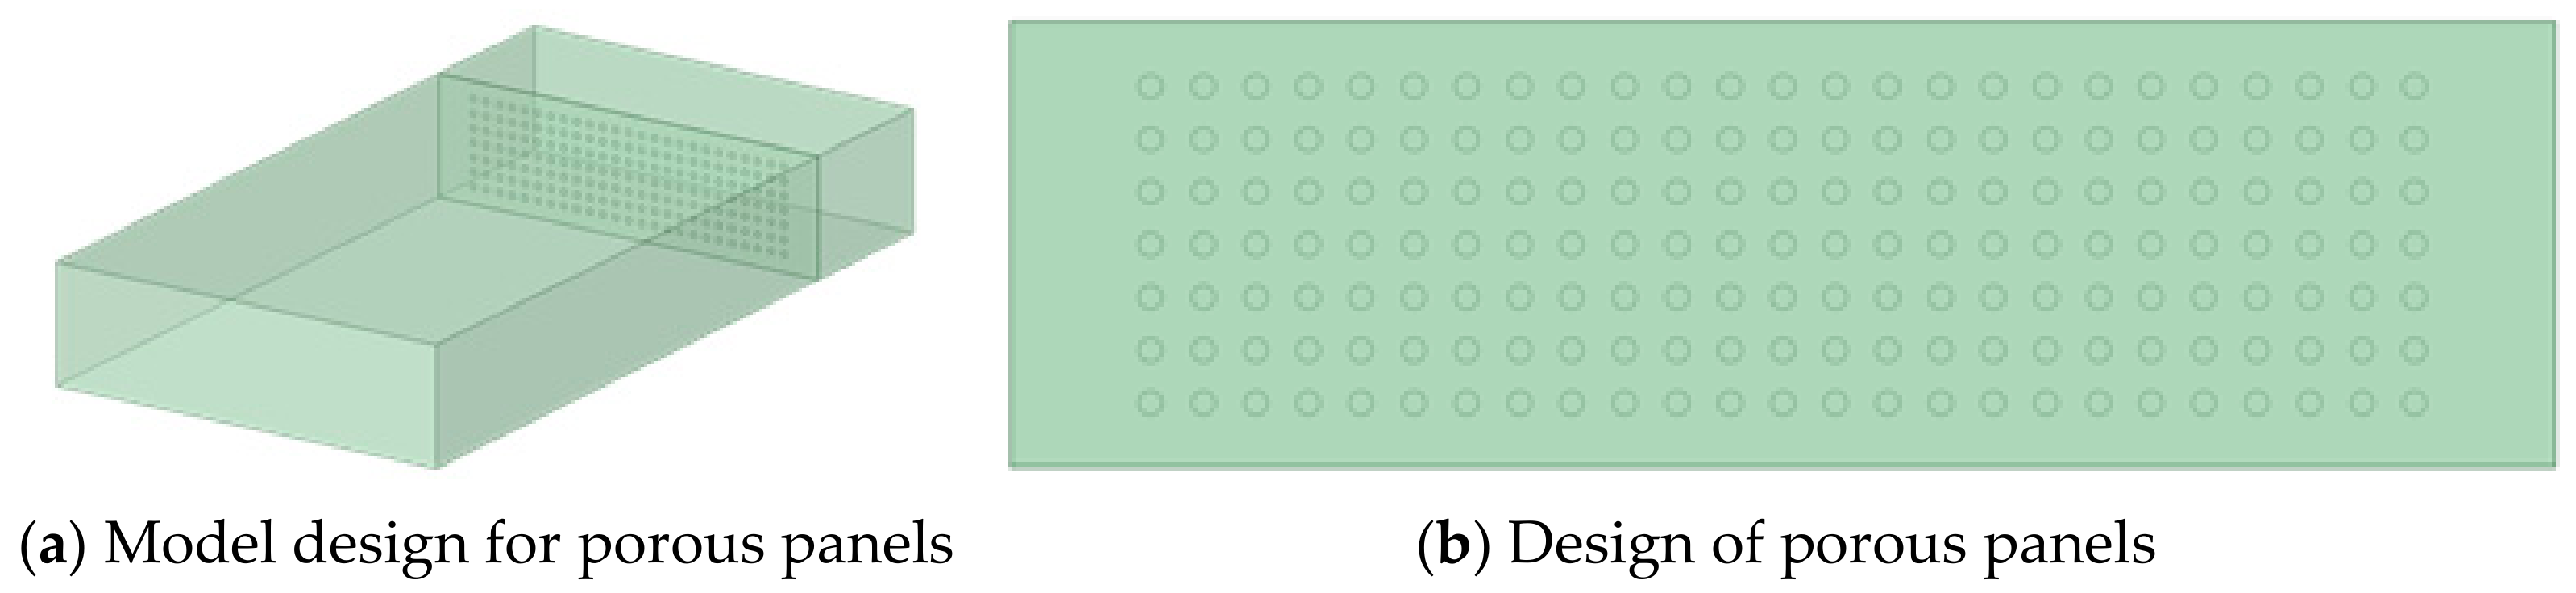
2.2. Computational Fluid Dynamics
2.3. Experimental Procedure
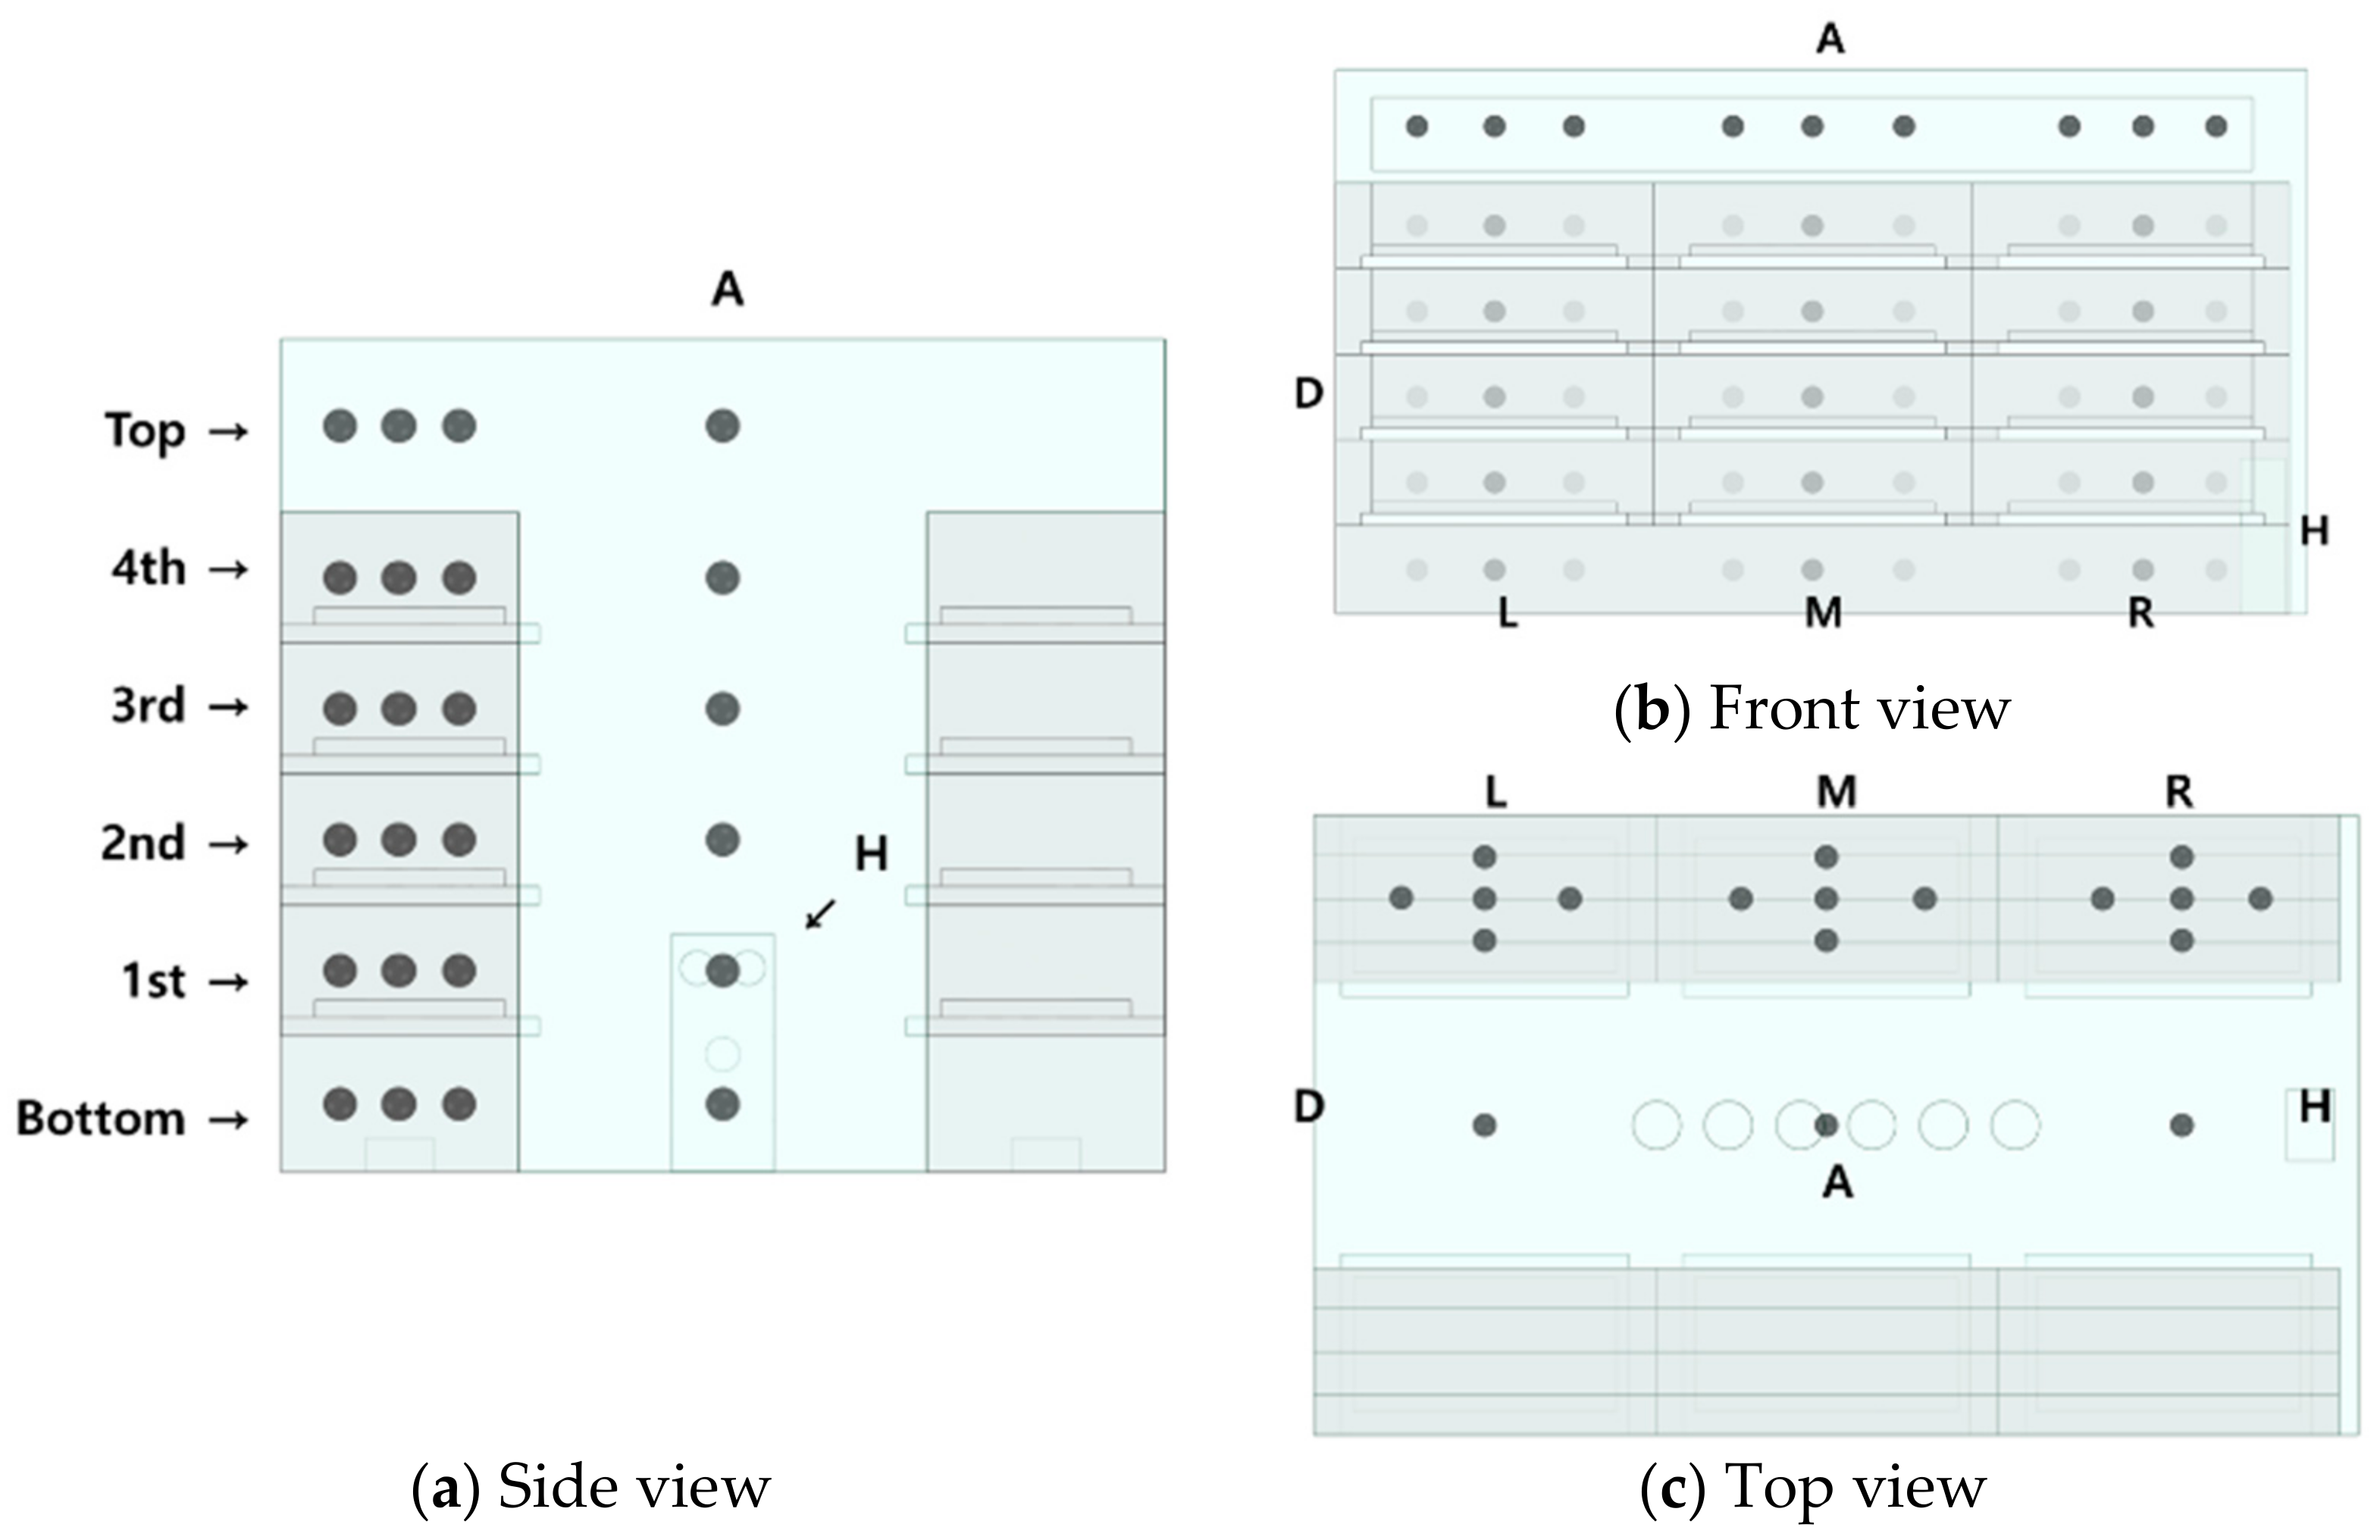
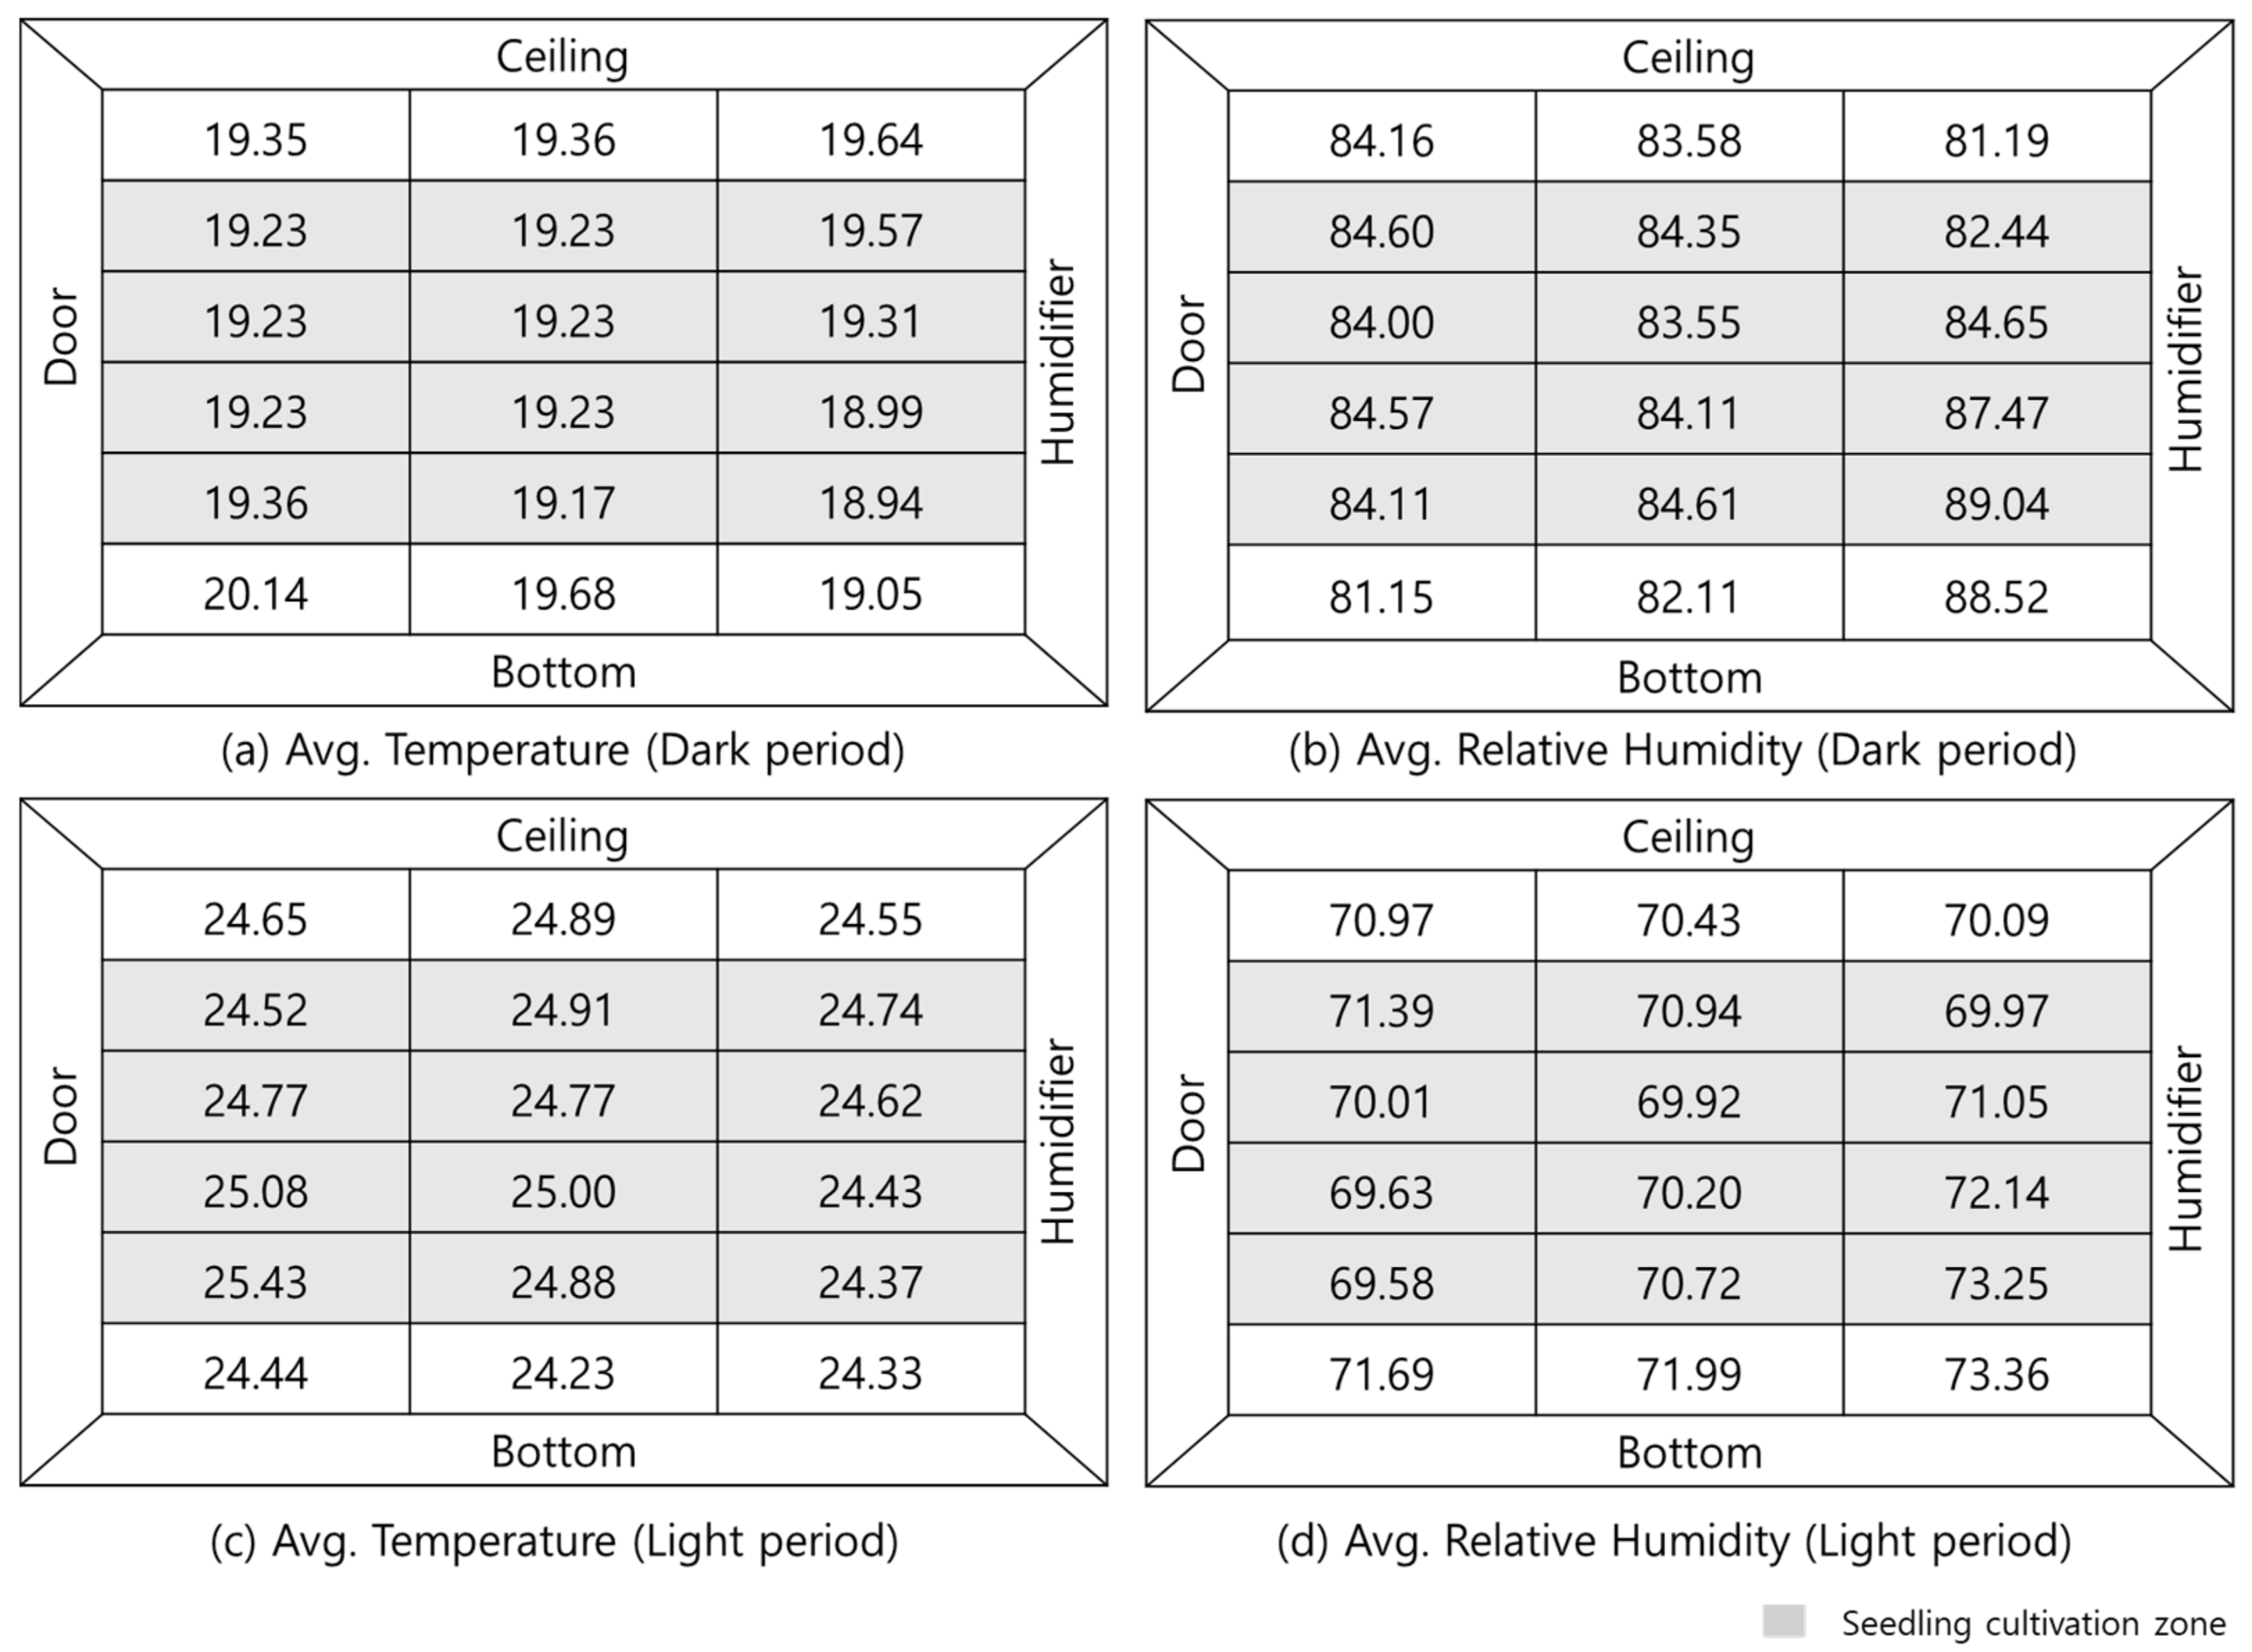
2.3.1. Field Monitoring in Seedling Plant Factory
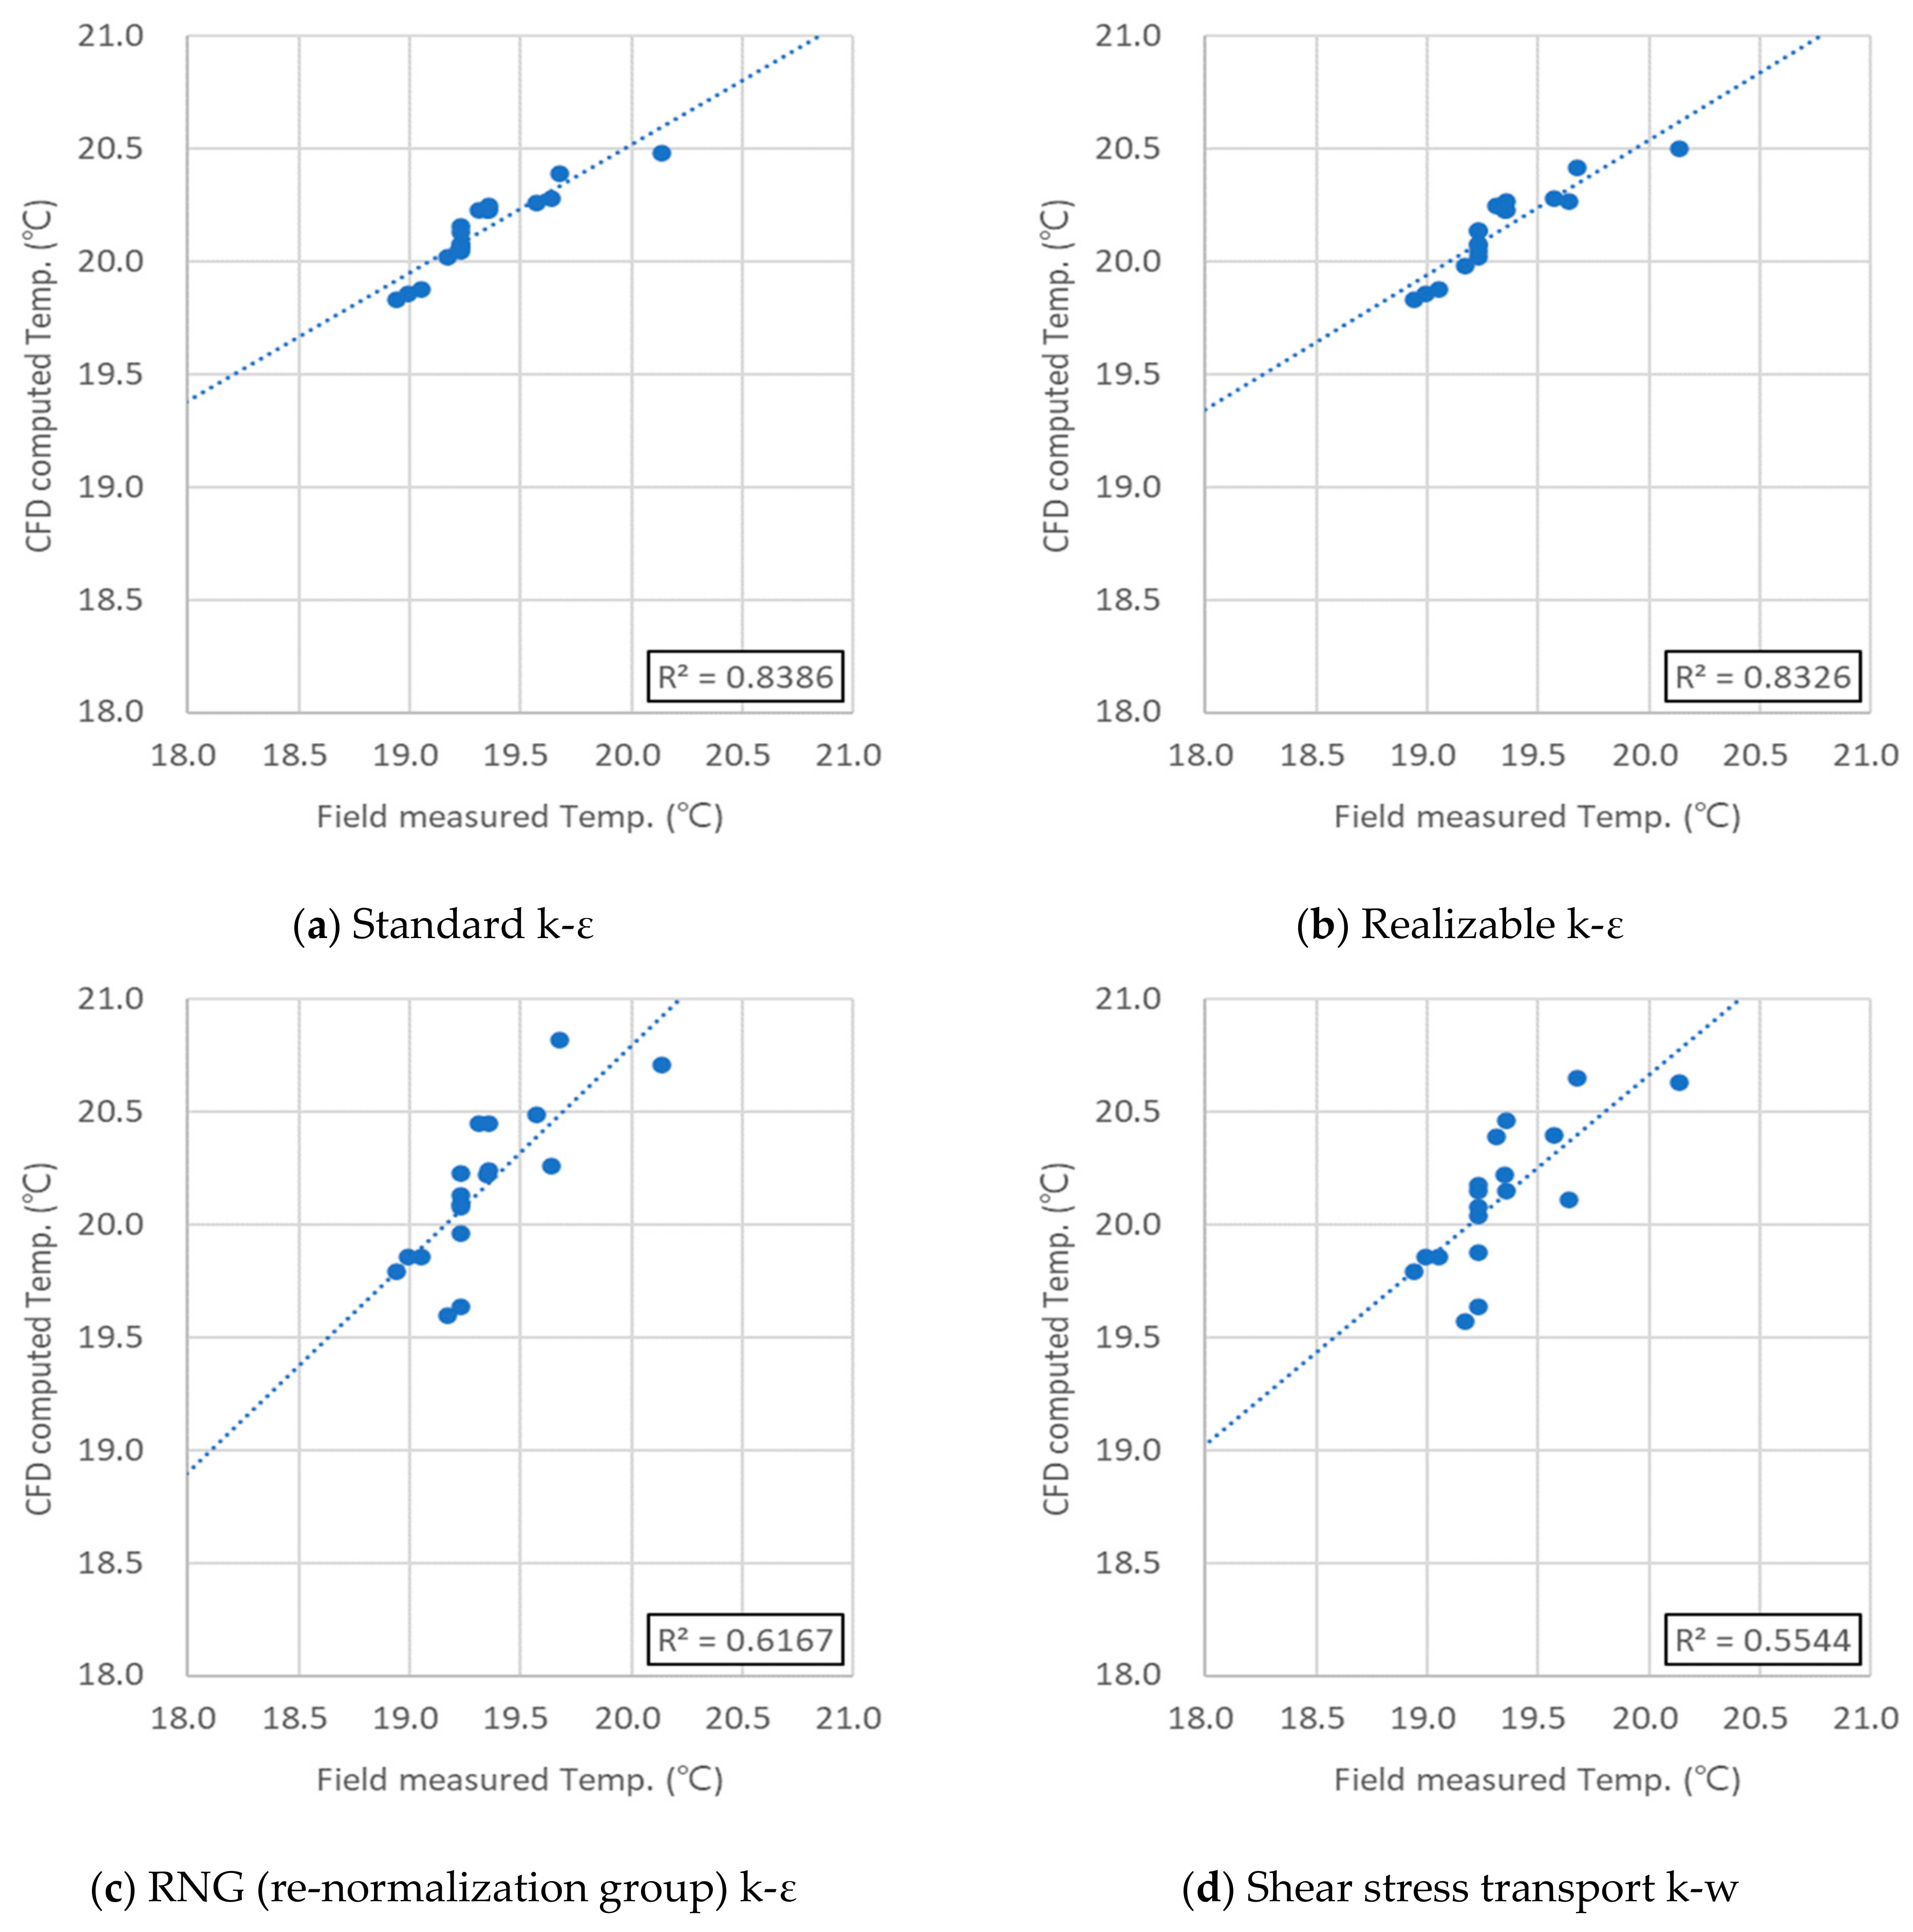
2.3.2. CFD Model Validation
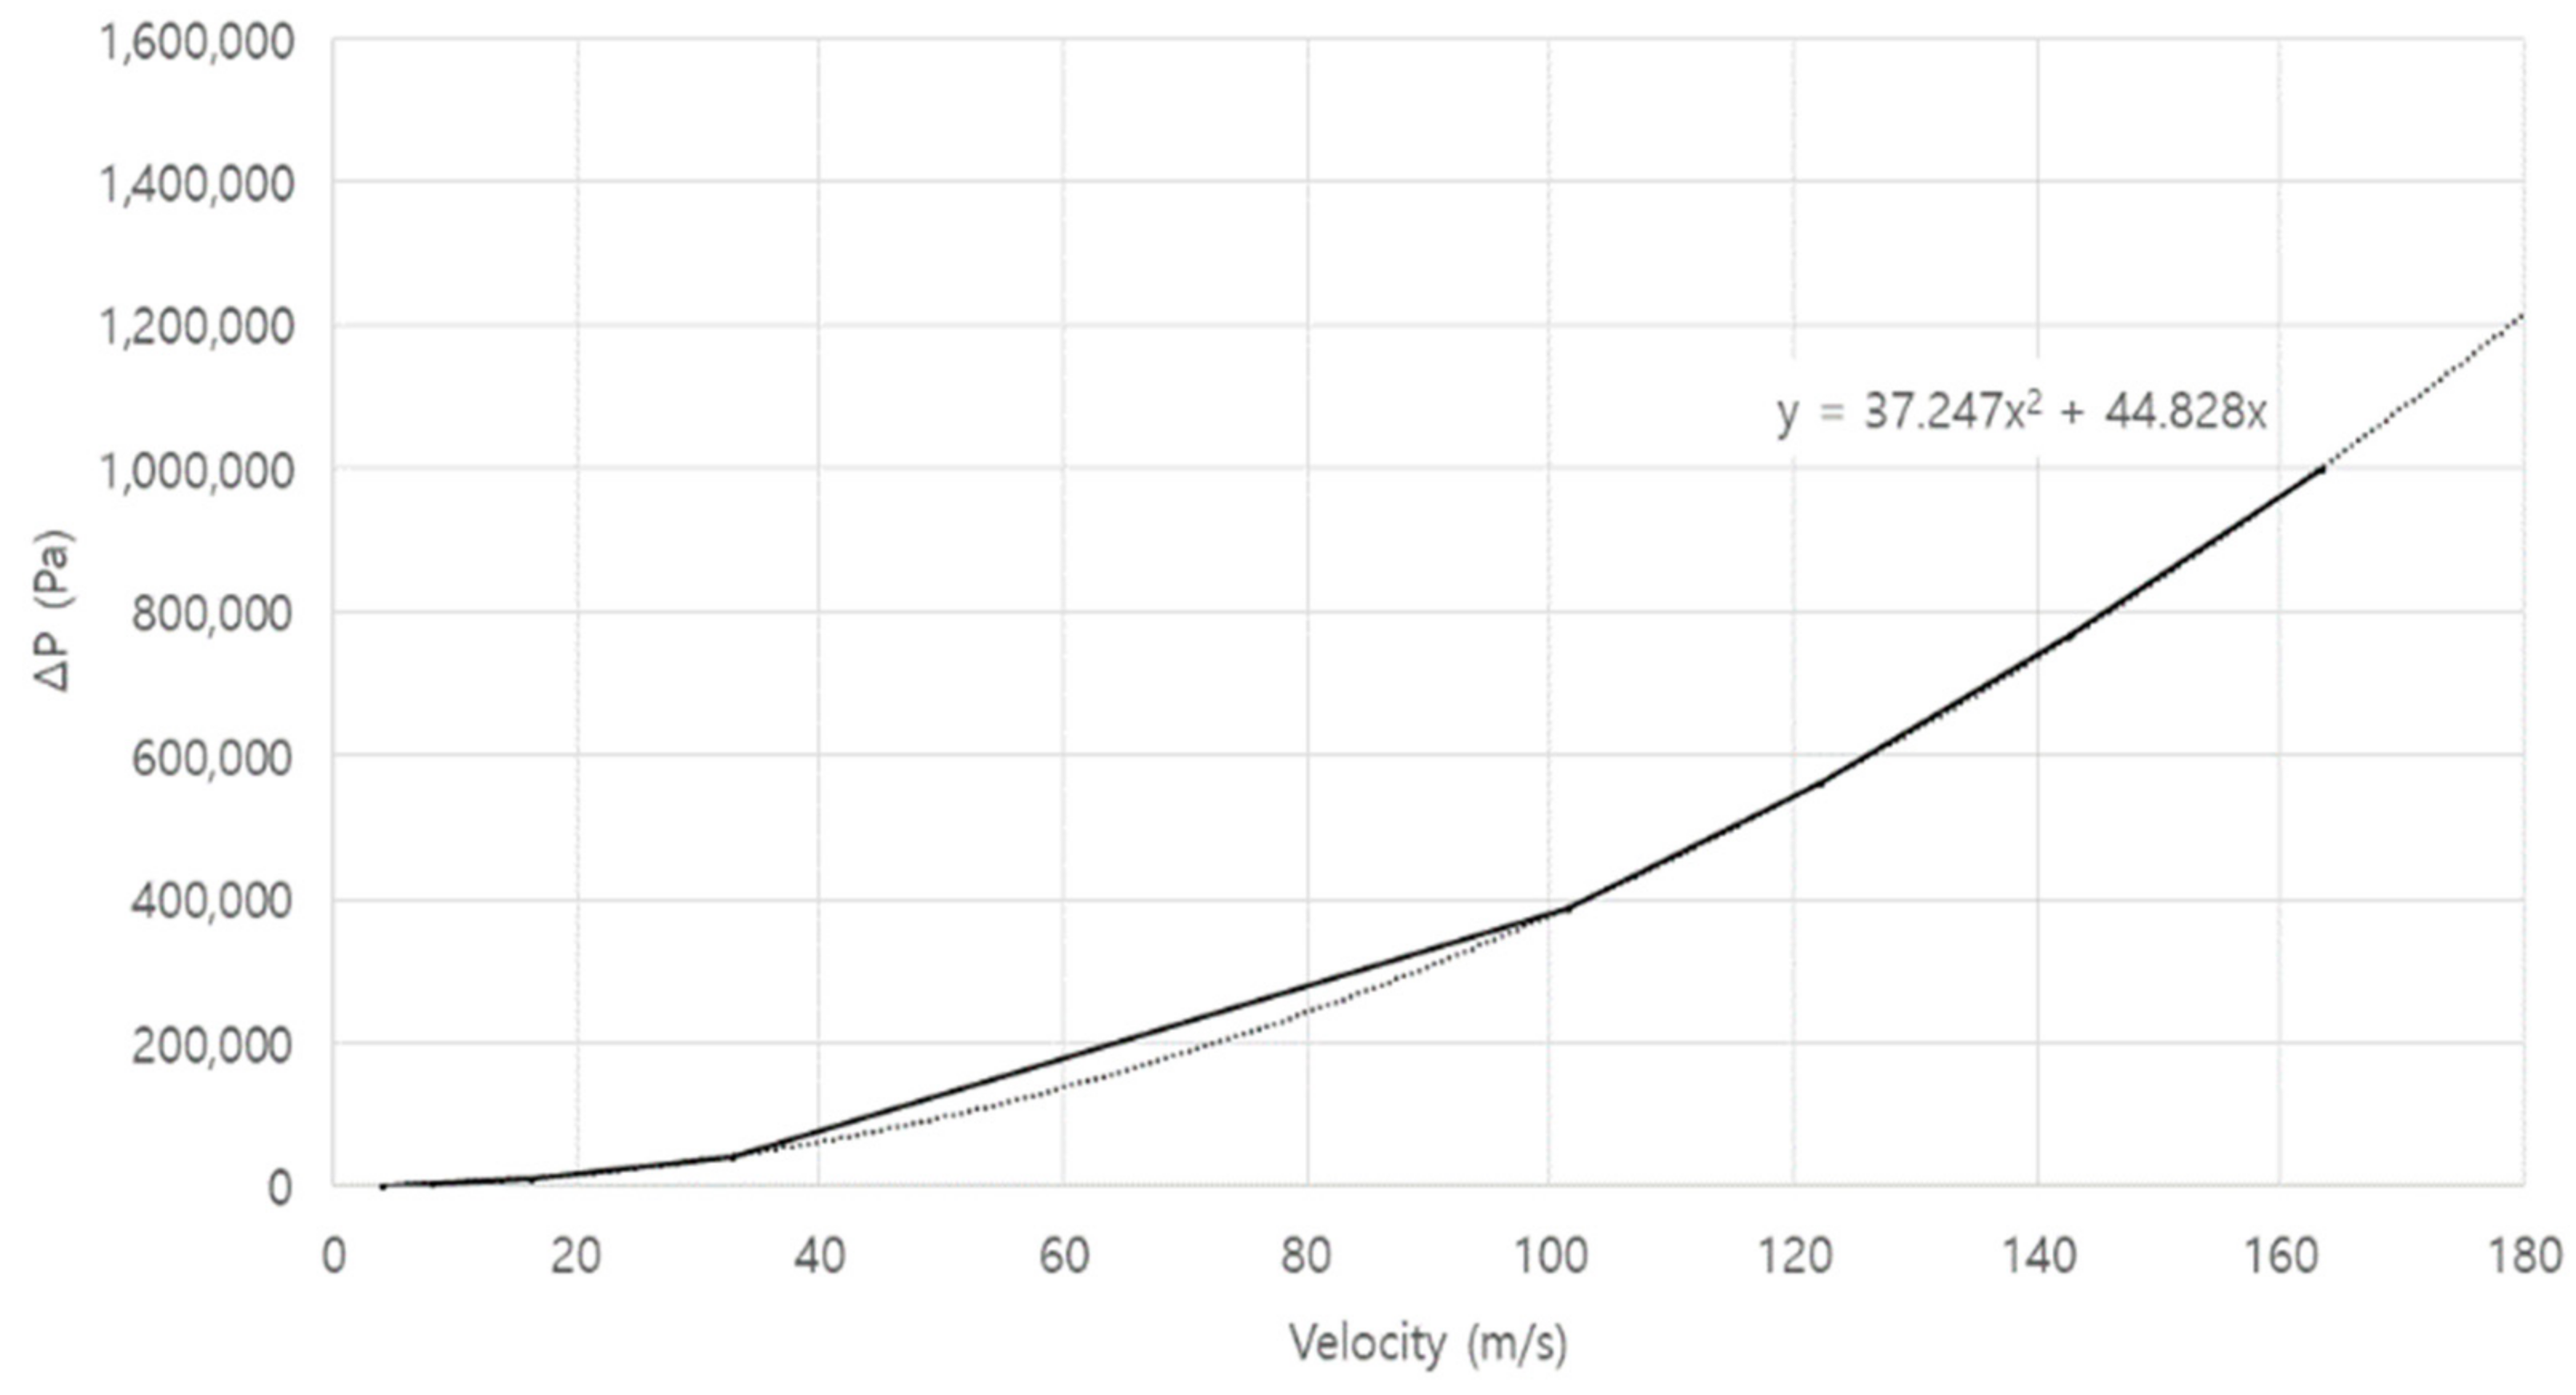
2.3.3. Aerodynamic Analysis Using CFD
3. Results
3.1. Field Monitoring Using Installed Porous Panels
3.2. CFD Model Validation
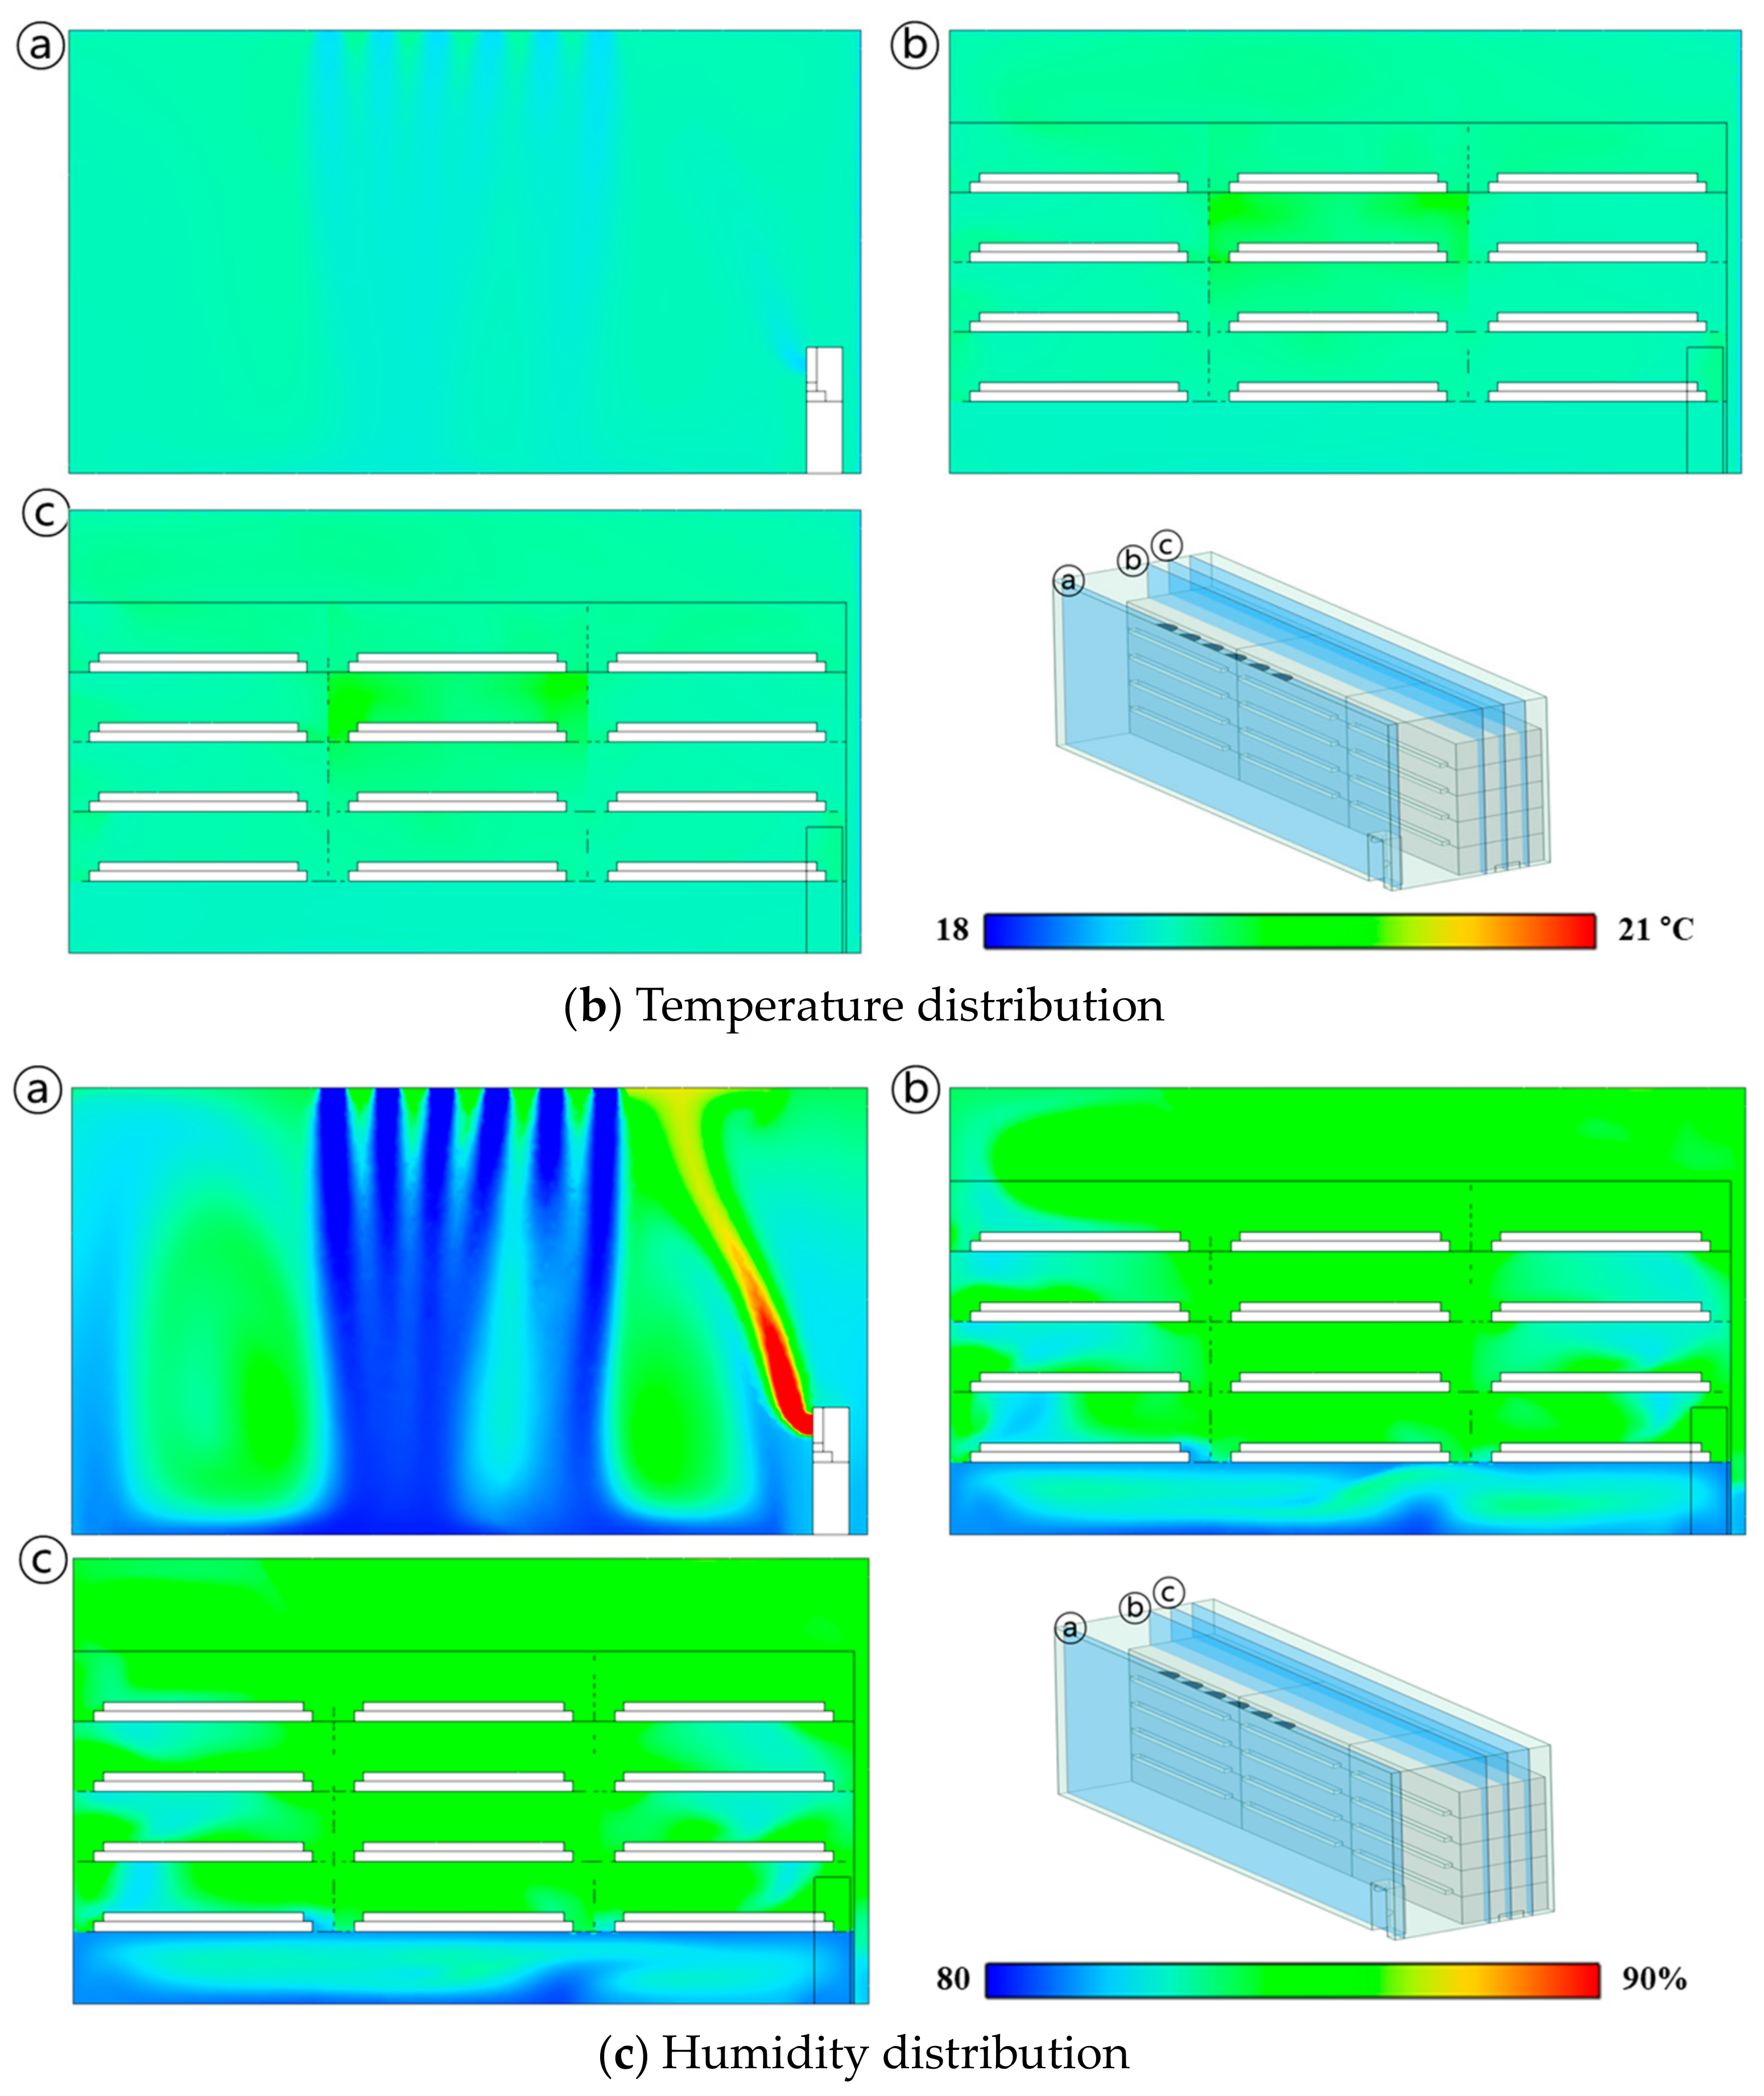
3.3. Aerodynamic Analysis Using CFD
4. Discussion
5. Conclusions
Author Contributions
Funding
Data Availability Statement
Conflicts of Interest
References
- Mariani, L.; Ferrante, A. Agronomic management for enhancing plant tolerance to abiotic stresses—Drought, salinity, hypoxia, and lodging. Horticulturae 2017, 3, 52. [Google Scholar] [CrossRef]
- Shibuya, T.; Kozai, T. Effects of air current speed on net photosynthetic and evapotranspiration rates of a tomato plug sheet under artificial light. Environ. Control Biol. 1998, 36, 131–136. [Google Scholar] [CrossRef]
- Savvas, D.; Passam, H. Hydroponic Production of Vegetables and Ornamentals; Embryo Publications: Athens, Greece, 2002. [Google Scholar]
- Kitaya, Y.; Tsuruyama, J.; Shibuya, T.; Yoshida, M.; Kiyota, M. Effects of air current speed on gas exchange in plant leaves and plant canopies. Adv. Space Res. 2003, 31, 177–182. [Google Scholar] [CrossRef] [PubMed]
- Ritchie, J.; Nesmith, D. Temperatures and crop development. In Modeling Plant and Soil Systems; Agronomy Monograph No. 31; ASA-CSSA-SSSA: Madison, WI, USA, 1991. [Google Scholar]
- Sase, S. Air movement and climate uniformity in ventilated greenhouses. In Proceedings of the International Symposium on Greenhouse Cooling 719, Almería, Spain, 24–27 April 2006; pp. 313–324. [Google Scholar] [CrossRef]
- Chen, C. Humidity in plant tissue culture vessels. Biosyst. Eng. 2004, 88, 231–241. [Google Scholar] [CrossRef]
- Körner, C. Significance of temperature in plant life. In Plant Growth and Climate Change; Blackwell Publishing Ltd.: Hoboken, NJ, USA, 2006; pp. 48–69. [Google Scholar] [CrossRef]
- Deng, L.; Wang, K.; Li, J.; Zhao, G.; Shangguan, Z. Effect of soil moisture and atmospheric humidity on both plant productivity and diversity of native grasslands across the Loess Plateau, China. Ecol. Eng. 2016, 94, 525–531. [Google Scholar] [CrossRef]
- Lakhiar, I.A.; Gao, J.; Syed, T.N.; Chandio, F.A.; Buttar, N.A. Modern plant cultivation technologies in agriculture under controlled environment: A review on aeroponics. J. Plant Interact. 2018, 13, 338–352. [Google Scholar] [CrossRef]
- Knowledge Industry Information Institute (KNIN). Analysis of the Latest Technological Trends in the Agricultural and Livestock Industry/Agricultural Machinery and R&D Strategies in the High Value-Added Food Industry Korea; Knowledge Industry Information Institute (KNIN): Seoul, Republic of Korea, 2020. [Google Scholar]
- Zhou, Y.; Wang, S.; Hu, H.; Shen, Y.; Zhu, Y.; Liu, X.; Wei, J.; Yu, X.; Liu, S.; Ma, H. GmCDPKSK5 Interacting with GmFAD2-1B Participates in Regulation of Seed Development in Soybean under High Temperature and Humidity Stress. Plant Mol. Biol. Report. 2022, 40, 402–417. [Google Scholar] [CrossRef]
- Zhang, Y.; Kacira, M. Analysis of environmental uniformity in a plant factory using computational fluid dynamics (CFD) analysis. In Proceedings of the International Symposium on New Technologies for Environment Control, Energy-Saving and Crop Production in Greenhouse and Plant Factory—GreenSys 2017, Beijing, China, 20–24 August 2017; pp. 607–614. [Google Scholar] [CrossRef]
- Kozai, T. Current status of plant factories with artificial lighting (PFALs) and smart PFALs. In Smart Plant Factory: The Next Generation Indoor Vertical Farms; Springer: Singapore, 2018; pp. 3–13. [Google Scholar] [CrossRef]
- Hadavi, E.; Ghazijahani, N. Closed and semi-closed systems in agriculture. In Sustainable Agriculture Reviews 33: Climate Impact on Agriculture; Springer Nature: Cham, Switzerland, 2018; pp. 295–310. [Google Scholar] [CrossRef]
- Zhang, Y.; Kacira, M. Air Distribution and Its Uniformity. In Smart Plant Factory: The Next Generation Indoor Vertical Farms; Springer: Singapore, 2018; pp. 153–166. [Google Scholar] [CrossRef]
- Den Besten, J. Vertical Farming Development; The Dutch Approach; Elsevier: Amsterdam, The Netherlands, 2019; pp. 307–317. [Google Scholar]
- Zhang, Y.; Kacira, M.; An, L. A CFD study on improving air flow uniformity in indoor plant factory system. Biosyst. Eng. 2016, 147, 193–205. [Google Scholar] [CrossRef]
- Yu, H.; Yu, H.; Zhang, B.; Chen, M.; Liu, Y.; Sui, Y. Quantitative Perturbation Analysis of Plant Factory LED Heat Dissipation on Crop Microclimate. Horticulturae 2023, 9, 660. [Google Scholar] [CrossRef]
- Haibo, Y.; Lei, Z.; Haiye, Y.; Yucheng, L.; Chunhui, L.; Yuanyuan, S. Sustainable Development Optimization of a Plant Factory for Reducing Tip Burn Disease. Sustainability 2023, 15, 5607. [Google Scholar] [CrossRef]
- Fatnassi, H.; Pizzol, J.; Senoussi, R.; Biondi, A.; Desneux, N.; Poncet, C.; Boulard, T. Within-crop air temperature and humidity outcomes on spatio-temporal distribution of the key rose pest Frankliniella occidentalis. PLoS ONE 2015, 10, e0126655. [Google Scholar] [CrossRef] [PubMed]
- Fang, H.; Li, K.; Wu, G.; Cheng, R.; Zhang, Y.; Yang, Q. A CFD analysis on improving lettuce canopy airflow distribution in a plant factory considering the crop resistance and LEDs heat dissipation. Biosyst. Eng. 2020, 200, 1–12. [Google Scholar] [CrossRef]
- Noh, A.M.; Noor, H.M.; Ahmad, F. CFD Simulation of the Airflow Distribution Inside Cube-Grow. CFD Lett. 2021, 13, 81–89. [Google Scholar] [CrossRef]
- Boulard, T.; Kittas, C.; Roy, J.; Wang, S. SE—Structures and environment: Convective and ventilation transfers in greenhouses, part 2: Determination of the distributed greenhouse climate. Biosyst. Eng. 2002, 83, 129–147. [Google Scholar] [CrossRef]
- De Baerdemaeker, J.; Delele, M.A.; Verboven, P.; Nicolaï, B.M. Multiscale modelling of postharvest storage of fruit and vegetables in a plant factory context. IFAC Proc. Vol. 2011, 44, 616–620. [Google Scholar] [CrossRef]
- Baek, M.-S.; Kim, K.-M.; Kwon, S.-Y.; Kong, H.; Lim, J.-H. CFD Based Internal Fan Control Simulation for Improvement of Cultivation Environment in Plant Factory. Adv. Sci. Technol. Lett. 2015, 120, 550–553. [Google Scholar] [CrossRef]
- Niam, A.; Muharam, T.; Widodo, S.; Solahudin, M.; Sucahyo, L. CFD simulation approach in determining air conditioners position in the mini plant factory for shallot seed production. In AIP Conference Proceedings, Proceedings of the 10th International Meeting of Advances in Thermofluids (IMAT 2018): Smart City: Advances in Thermofluid Technology in Tropical Urban Development, Bali, Indonesia, 16–17 November 2018; AIP Publishing LLC: Melville, NY, USA, 2019. [Google Scholar]
- Fan, R.; Liu, H.; Zhou, S.; He, Z.; Zhang, X.; Liu, K.; Wang, J.; Yang, Q.; Zheng, Y.; Lu, W. CFD simulation of the airflow uniformity in the plant factory. IOP Conf. Ser. Earth Environ. Sci. 2020, 560, 012074. [Google Scholar] [CrossRef]
- Zhou, S.; Liu, H.; Fan, R.; He, Z.; Zhang, Y.; Chen, Y.; Sun, X.; Zhou, X.; Yang, Q.; Zheng, Y. Temperature field simulation using CFD in the plant factory. IOP Conf. Ser. Earth Environ. Sci. 2020, 560, 012036. [Google Scholar] [CrossRef]
- Chu, C.-R.; Lan, T.-W.; Tasi, R.-K.; Wu, T.-R.; Yang, C.-K. Wind-driven natural ventilation of greenhouses with vegetation. Biosyst. Eng. 2017, 164, 221–234. [Google Scholar] [CrossRef]
- Seo, I.-H.; Lee, H.J.; Wi, S.H.; Lee, S.-W.; Kim, S.K. Validation of an air temperature gradient using computational fluid dynamics in a semi-open type greenhouse and determination of kimchi cabbage physiological responses to temperature differences. Hortic. Environ. Biotechnol. 2021, 62, 737–750. [Google Scholar] [CrossRef]
- Miguel, A.F.; Silva, A. Porous materials to control climate behaviour of enclosures: An application to the study of screened greenhouses. Energy Build. 2000, 31, 195–209. [Google Scholar] [CrossRef]
- Teitel, M.; Dvorkin, D.; Haim, Y.; Tanny, J.; Seginer, I. Comparison of measured and simulated flow through screens: Effects of screen inclination and porosity. Biosyst. Eng. 2009, 104, 404–416. [Google Scholar] [CrossRef]
- Santolini, E.; Pulvirenti, B.; Benni, S.; Barbaresi, L.; Torreggiani, D.; Tassinari, P. Numerical study of wind-driven natural ventilation in a greenhouse with screens. Comput. Electron. Agric. 2018, 149, 41–53. [Google Scholar] [CrossRef]
- Norton, T.; Sun, D.-W.; Grant, J.; Fallon, R.; Dodd, V. Applications of computational fluid dynamics (CFD) in the modelling and design of ventilation systems in the agricultural industry: A review. Bioresour. Technol. 2007, 98, 2386–2414. [Google Scholar] [CrossRef] [PubMed]
- Kwon, K.-s.; Lee, I.-b.; Ha, T. Identification of key factors for dust generation in a nursery pig house and evaluation of dust reduction efficiency using a CFD technique. Biosyst. Eng. 2016, 151, 28–52. [Google Scholar] [CrossRef]
- Piscia, D.; Montero, J.I.; Baeza, E.; Bailey, B.J. A CFD greenhouse night-time condensation model. Biosyst. Eng. 2012, 111, 141–154. [Google Scholar] [CrossRef]
- Peiro, E.; Pannico, A.; Colleoni, S.G.; Bucchieri, L.; Rouphael, Y.; De Pascale, S.; Paradiso, R.; Gòdia, F. Air distribution in a fully-closed higher plant growth chamber impacts crop performance of hydroponically-grown lettuce. Front. Plant Sci. 2020, 11, 537. [Google Scholar] [CrossRef]
- Zhou, S.; Zhang, X.; He, Z.; Liu, H.; Liu, K.; Chen, Y.; Peng, F.; Yang, Q.; Zheng, Y.; Lu, W. Experimental validation of CFD model with the air velocity and temperature in the plant factory. IOP Conf. Ser. Earth Environ. Sci. 2020, 560, 012089. [Google Scholar] [CrossRef]
- Versteeg, H.K.; Malalasekera, W. An Introduction to Computational Fluid Dynamics: The Finite Volume Method; Pearson Education: London, UK, 2007. [Google Scholar]
- Seo, I.-H.; Lee, I.-B.; Moon, O.-K.; Kim, H.-T.; Hwang, H.-S.; Hong, S.-W.; Bitog, J.; Yoo, J.-I.; Kwon, K.-S.; Kim, Y.-H.; et al. Improvement of the ventilation system of a naturally ventilated broiler house in the cold season using computational simulations. Biosyst. Eng. 2009, 104, 106–117. [Google Scholar] [CrossRef]
- Bournet, P.E.; Khaoua, S.O.; Boulard, T. Numerical prediction of the effect of vent arrangements on the ventilation and energy transfer in a multi-span glasshouse using a bi-band radiation model. Biosyst. Eng. 2007, 98, 224–234. [Google Scholar] [CrossRef]
- Kim, K.; Yoon, J.-Y.; Kwon, H.-J.; Han, J.-H.; Son, J.E.; Nam, S.-W.; Giacomelli, G.A.; Lee, I.-B. 3-D CFD analysis of relative humidity distribution in greenhouse with a fog cooling system and refrigerative dehumidifiers. Biosyst. Eng. 2008, 100, 245–255. [Google Scholar] [CrossRef]
- Tamimi, E.; Choi, C.Y.; An, L. Analysis of microclimate uniformity in a naturally vented greenhouse with a high-pressure fogging system. Trans. ASABE 2013, 56, 1241–1254. [Google Scholar] [CrossRef]
- Seo, I.-H.; Lee, I.-B.; Hwang, H.-S.; Hong, S.-W.; Bitog, J.P.; Kwon, K.-S.; Lee, C.-G.; Kim, Z.-H.; Cuello, J.L. Numerical investigation of a bubble-column photo-bioreactor design for microalgae cultivation. Biosyst. Eng. 2012, 113, 229–241. [Google Scholar] [CrossRef]
- Wang, L.; Zhang, L.; Lian, G. A CFD simulation of 3D air flow and temperature variation in refrigeration cabinet. Procedia Eng. 2015, 102, 1599–1611. [Google Scholar] [CrossRef]
- ANSYS Inc. ANSYS FLUENT 12.01. Theory Guide; ANSYS Inc.: Canonsburg, PA, USA, 2009; p. 67. [Google Scholar]
- Naranjani, B.; Najafianashrafi, Z.; Pascual, C.; Agulto, I.; Chuang, P.-Y.A. Computational analysis of the environment in an indoor vertical farming system. Int. J. Heat Mass Transf. 2022, 186, 122460. [Google Scholar] [CrossRef]


| Model | Property | |
|---|---|---|
| Energy model | Activated | |
| Viscous model | Standard k-ε, Realizable k-ε, re-normalization group k-ε, Shear stress transport k-ω | |
| Multiphase model | Mixture model (Air and water vapor) | |
| Species model | Species transport model | |
| Parameter | Boundary conditions | Property |
| Air conditioner | Velocity inlet | Derived wind profile Set temperature: 293.16 K |
| Humidifier | Velocity inlet | Velocity: 1.44 m/s Mass fraction of water: 0.010347 |
| Perforated plate | Porous jump | Permeability coefficient α: 1.20 × 10⁻⁹ Pressure drop coefficient C2: 19,204 |
| Walls | Wall | Thermal property of silicone polyester, steel, ABS plastic |
| Turbulence Model | RSME | MAE | PBIAS | |
|---|---|---|---|---|
| Temperature (°C) | Standard k-ε | 0.382 | 0.289 | −1.36 |
| Realizable k-ε | 0.382 | 0.290 | −1.37 | |
| Re-normalization group k-ε | 0.383 | 0.288 | −1.37 | |
| Shear stress transport k-ω | 0.384 | 0.291 | −1.39 | |
| Relative Humidity (%) | Standard k-ε | 3.674 | 4.028 | −2.86 |
| Realizable k-ε | 3.587 | 3.971 | −2.78 | |
| Re-normalization group k-ε | 3.694 | 4.009 | −2.76 | |
| Shear stress transport k-ω | 3.561 | 3.795 | −2.65 |
| Location (Average) | Door (0.25) | Cooler (0.27) | Humidifier (0.34) |
|---|---|---|---|
| Perforated Plate | |||
| Ceiling (0.40) | 0.51 | 0.49 | 0.42 |
| 4th (0.25) | 0.15 ± 0.03 | 0.29 ± 0.16 | 0.12 ± 0.04 |
| 3rd (0.14) | 0.10 ± 0.02 | 0.20 ± 0.05 | 0.17 ± 0.01 |
| 2nd (0.19) | 0.13 ± 0.02 | 0.38 ± 0.04 | 0.13 ± 0.04 |
| 1st (0.39) | 0.25 ± 0.06 | 0.38 ± 0.04 | 0.23 ± 0.07 |
| Bottom (0.33) | 0.36 | 0.28 | 0.55 |
| Corridor | |||
| Location (Average) | Door (20.10) | Cooler (20.07) | Humidifier (20.30) |
|---|---|---|---|
| Perforated Plate | |||
| Ceiling (20.09) | 20.2 | 20.2 | 20.2 |
| 4th (20.17) | 20.3 ± 0.05 | 20.3 ± 0.05 | 20.3 ± 0.03 |
| 3rd (20.26) | 20.1 ± 0.03 | 20.6 ± 0.13 | 20.0 ± 0.02 |
| 2nd (20.24) | 20.1 ± 0.02 | 20.4 ± 0.03 | 20.0 ± 0.01 |
| 1st (20.12) | 20.1 ± 0.03 | 20.2 ± 0.03 | 20.0 ± 0.04 |
| Bottom (19.86) | 19.8 | 19.9 | 19.9 |
| Corridor | |||
| Location (Average) | Door (83.9) | Cooler (84.1) | Humidifier (84.9) |
|---|---|---|---|
| Perforated Plate | |||
| Ceiling (84.0) | 84.9 | 85.3 | 85.0 |
| 4th (84.8) | 84.0 ± 0.36 | 85.0 ± 0.01 | 85.0 ± 0.03 |
| 3rd (84.7) | 84.6 ± 0.14 | 85.0 ± 0.01 | 83.6 ± 0.40 |
| 2nd (84.6) | 83.7 ± 0.41 | 85.0 ± 0.01 | 84.2 ± 0.40 |
| 1st (84.3) | 83.5 ± 0.59 | 84.8 ± 0.07 | 84.4 ± 0.42 |
| Bottom (82.8) | 82.8 | 83.0 | 82.6 |
| Corridor | |||
Disclaimer/Publisher’s Note: The statements, opinions and data contained in all publications are solely those of the individual author(s) and contributor(s) and not of MDPI and/or the editor(s). MDPI and/or the editor(s) disclaim responsibility for any injury to people or property resulting from any ideas, methods, instructions or products referred to in the content. |
© 2023 by the authors. Licensee MDPI, Basel, Switzerland. This article is an open access article distributed under the terms and conditions of the Creative Commons Attribution (CC BY) license (https://creativecommons.org/licenses/by/4.0/).
Share and Cite
Lee, S.-W.; Seo, I.-H.; An, S.-W.; Na, H.-Y. Improvement of Environmental Uniformity in a Seedling Plant Factory with Porous Panels Using Computational Fluid Dynamics. Horticulturae 2023, 9, 1027. https://doi.org/10.3390/horticulturae9091027
Lee S-W, Seo I-H, An S-W, Na H-Y. Improvement of Environmental Uniformity in a Seedling Plant Factory with Porous Panels Using Computational Fluid Dynamics. Horticulturae. 2023; 9(9):1027. https://doi.org/10.3390/horticulturae9091027
Chicago/Turabian StyleLee, Seong-Won, Il-Hwan Seo, Se-Woong An, and Hae-Young Na. 2023. "Improvement of Environmental Uniformity in a Seedling Plant Factory with Porous Panels Using Computational Fluid Dynamics" Horticulturae 9, no. 9: 1027. https://doi.org/10.3390/horticulturae9091027
APA StyleLee, S.-W., Seo, I.-H., An, S.-W., & Na, H.-Y. (2023). Improvement of Environmental Uniformity in a Seedling Plant Factory with Porous Panels Using Computational Fluid Dynamics. Horticulturae, 9(9), 1027. https://doi.org/10.3390/horticulturae9091027