Article

Detecting Surface Defects of Achacha Fruit (Garcinia humilis) with Hyperspectral Images

by
Ngo Minh Tri Nguyen
and
Nai-Shang Liou
*
Department of Mechanical Engineering, Southern Taiwan University of Science and Technology, Tainan 710, Taiwan
*
Author to whom correspondence should be addressed.
Horticulturae 2023, 9(8), 869; https://doi.org/10.3390/horticulturae9080869
Submission received: 30 June 2023 / Revised: 23 July 2023 / Accepted: 24 July 2023 / Published: 31 July 2023
(This article belongs to the Section Postharvest Biology, Quality, Safety, and Technology)

Abstract

:
Hyperspectral imaging data within the wavelength range of 400–1000 nm were used to classify the common skin conditions (i.e., normal, scar, decay, and insect bite) of achacha fruits. The band ratio (BR) and spectral angle mapper (SAM) algorithms were used in a binary classification. Furthermore, SAM, support vector machine (SVM), and artificial neural network (ANN) models were used in a multiclass classification. The performances of the binary and multiclass classification models were assessed. For the binary-classification approach, the three defective classes were merged into one, and the accuracies of the BR (990 nm/600 nm) and SAM were 78.70% and 75.02%, respectively. Furthermore, the SAM, SVM, and ANN accuracies in the four class problems were 58.36%, 83.59%, and 99.88%, respectively. A principal component analysis (PCA) was used for the data reduction. Nine characteristic wavelengths were extracted from the weighting-coefficient curves of the first four principal components. Using only the nine selected bands, the accuracies of the SAM, SVM, and ANN models were 51.49%, 80.76%, and 96.85%, respectively. Compared with the models using full bands, the classification accuracies of the models using only nine characteristic bands decreased slightly; however, the gain in classification speed and the potential data-acquisition speed can expedite the classification of achacha fruits.

1. Introduction

The achacha fruit (Garcinia humilis) originates in Bolivia [1,2] and is increasingly popular in Taiwan due to its flavor and nutrition. Therefore, the development of sorting and grading methods and criteria is an urgent need in the postharvest process of achacha fruits. Fruits with defects can cause severe consequences if left undetected during postharvest processing. Fruit defects in a specific fruit not only degrade the quality of the fruit but can also affect the surrounding fruits [3,4]. For example, fungi on the surface of a fruit can spread to surrounding fruits during storage and transportation.
Traditionally, fruit-defect assessment was performed manually by experienced workers. However, it is subjective, inconsistent, slow, and affected by eye fatigue during continuous work over a long time period [3,5]. Moreover, manual fruit-defect evaluation proved unsuitable when productivity increased and labor became increasingly expensive. With improvements in hardware and software, machine vision has become valued in fruit evaluation due to its non-invasiveness, fast speed, and accessibility [6]. Researchers commonly use machine vision based on RGB images for surface-defect detection, such as classifying healthy and defective tomatoes [7], mangos, and guavas [8]. However, due to the limitation of the use of three broadband channels, different skin statuses can be similar in RGB images [9]. For example, thrips scarring and oleocellosis in citruses were misclassified as normal skin due to the similarities in color [10]. Furthermore, when performing defect classification on green plums, rain spots can be misclassified as scars due to the stem end, or as normal skin due to low light intensity and shadow [11].
Hyperspectral imaging (HSI) systems can acquire spatial and spectral data and, therefore, provide much more information than RGB cameras. Moreover, HSI systems have recently become increasingly popular for investigating food and agricultural products [12,13]. For example, HSI data have been used to estimate the ripeness of avocados [14] and to detect the quality parameters in the apples [15]. Moreover, this system spectral data within infrared wavelength ranges can provide more information than RGB images. For example, researchers used near-infrared HSI data to establish the differences between the normal and defective skins of jujubes [16] and peaches [17]. Furthermore, the HSI data in the visible and near-infrared were used to detect common skin defects in citrus [18], early downy mildew in grapevines [19], and damage in the apples [20].
The band ratio (BR) method and spectral angle mapper (SAM) are typical signature-based methods for HSI data analysis. The BR is an algorithm calculating the ratio between two spectral bands to increase the contrast between two classes. Global thresholding is commonly applied to BR images to separate the two types after contrast enhancement. Based on spectral characteristics, three ratios, including 987 nm/1464 nm, 1160 nm/1464 nm, and 1285 nm/1464 nm, were treated as the potential to classify insect-infested and normal skin in jujubes [16]. Next, the ratio of 1160 nm/1464 nm was chosen based on visual observation, after which the global threshold T = 0.7 was used to classify the defects. Li et al. considered three wavelengths, 781 nm, 815 nm, and 848 nm, to classify normal skin and defects in the bi-colored peaches [17]. Of the three combination pairs, 781 nm/848 nm was selected as the best option, through visual observation, for increasing contrast before global thresholding (T = 0.7). Zhang et al. [21] used the 680 nm/715 nm ratio to detect the stem end in a fruit mask. Spectral angle mapper (SAM) classification uses an n-dimension (n equals the number of bands) angle to match the HSI data to reference spectra. Smaller angles represent closer matches to the reference spectrum. This method is relatively insensitive to illumination and albedo effects. The SAM method was used for surface-defect detection in citrus [22] and pears [23].
Machine learning (ML), using data and algorithms to imitate human learning, has been successfully used for classification problems. For example, the artificial neural network (ANN) and support vector machine (SVM) are two popular ML algorithms used for the surface-defect classification of fruits. The ANN was developed based on the electrical activity of the nervous system. For classification problems, ANN uses weights and biases for modeling the relationship between the data and labels. The ANN was used to detect chilling injury in Red Delicious apples [24], as well as bruising in the apples, chikoos, and guavas [25]. The SVM, as introduced, is used as a binary classifier that can separate two classes using a hyperplane. A multiclass SVM was extended using a one-versus-one (one-vs-one) or one-versus-all (one-vs-all) approach with a decision function. Using the kernel trick, the SVM can increase flexibility in dealing with nonlinearly separable problems. The SVM approach is widely used in surface-defect detection in fruits with the HSI data. Furthermore, the SVM was used to detect defective jujubes [26] and cracked tomatoes [27].
This study aimed to detect common surface defects in achacha fruit using the HSI data. The conventional HSI data analysis methods (BR and SAM) and ML-based classification models (SVM and ANN) were used, and the accuracies of these approaches were compared. Furthermore, a procedure for detecting the stem ends of achacha fruit to prevent misclassification during defect classification was developed.

2. Materials and Methods

2.1. Achacha Samples and HSI-Data Acquisition

Achacha fruits with three defect types were collected in Pingtung, Taiwan, and kept at room temperature before the experiment without pretreatment. A custom-made hyperspectral image acquisition system was used to obtain the image data. A description of the system can be found in the previous work [28]. The HSI data were obtained within two days after the harvest. The spectral data within the 400–1000 nm wavelength range were collected and used to classify the normal skin and the three surface defects of the achacha fruits. Figure 1 shows the pseudo RGB image of the typical samples. In this study, the fruit samples’ ripeness levels are within levels 4 to 7, as defined in the previous study [28].

2.2. Defect Classification Methods with HSI Data

The classification methods based on the hyperspectral image data, including the convention signature-based detection algorithms such as the BR and SAM, and the ML algorithms including the ANN and SVM, were used for surface defect detection of the achacha fruits. Both binary and multiple-class classification approaches were evaluated. For the binary classification approach, the BR and SAM methods were used to differentiate the normal and defective surfaces; furthermore, the four different surface conditions (normal and three defects) were classified by the SAM, SVM, and ANN.
The BR method and thresholding were applied to classify the normal and defective skin. The two optimized bands were determined by the maximizing correlation squared, using the method proposed by Lee et al. [29]. Dummy variables 0 and 1 represented normal and defective skin conditions, respectively. The band ratios were calculated for all possible combinations. Next, the correlation between the band ratio and dummy variable was evaluated. The 2-band combination with the highest squared correlation value (R2) was selected. Next, the optimized threshold was applied to separate normal and defective classes. The referenced spectra of the SAM classification were obtained by taking the average of the normalized spectra of the training data points of each corresponding class. A pixel would be classified as the class with the smallest spectral angle between the vector of the pixel and the vector of the referenced spectrum of each class in the n-dimensional spectral space. The SVM model used radial basis function (RBF) as the kernel, and the regularization parameter was 1. Moreover, the ANN model consists of four layers, including one input layer (121 nodes), two hidden layers (200 nodes each layer, ReLU activation function), and one output layer (four nodes, softmax activation function). Furthermore, a binary ANN model was trained to create a fruit mask within the HSI image. The labeled data for training and test were selected from the pixels inside the fruit mask areas of the 225 samples. The pixels of the normal, scar, decay, and insect skin types were selected from 88, 85, 80, and 62 of the 225 samples, respectively. Please note that a fruit sample could contain more than one skin type. For each skin type, 7000 data points were selected and labeled; 5000 and 2000 data points were used as training and testing sets, respectively. For binary classification performed by the BR and SAM, all data points of the defects were merged into one data set of the defective class.

2.3. Data Reduction Using Principal Component Analysis

The multidimensional data set of the hyperspectral images consists of valuable and redundant data. Therefore, the data reduction methods are usually used when analyzing the HSI data. The principal component analysis (PCA) is one of the unsupervised data reduction algorithms for the HSI data [5,9]. The PCA can be efficiently used for band selection to reduce the number of spectral bands while retaining the most helpful information to reduce the storage requirements and computation time for the data processing. Based on the PCA results, the bands were selected to classify strawberries into three ripeness levels [30], to detect the skin defects of the bi-colored peaches [17], and to identify the typical defects on oranges [18]. This study used PCA to select useful characteristic wavelengths to classify the four skin types. The weighting coefficients of the PC components were obtained based on the training data. Peaks and valleys of PCs, which can explain most of the variance of skin types, were selected as the optimal wavelengths. The optimal wavelengths were used by the ANN and SVM skin defect classification models, and the accuracies were assessed.

2.4. Stem End Detection

The stem end, a component connecting the fruit to the tree branch, can be misclassified as a defect, so it should usually be identified and excluded when performing the fruit defect classification. When performing defect detection with the RGB image, for the apple which has only one defect candidate region, features of the region should be extracted, and a pattern recognition algorithm should be applied to determine whether the apple is sound or defective [31,32]. When the skin defect detection of the fruits with HSI data is performed, a method involving the size and shape of the defective candidate regions was used to differentiate the stems from the actual defects of the bi-colored peaches [17]. The corrected single-wavelength image at 666 nm was used to distinguish the stem end from the decayed region of the tomato [33]. The achacha fruit is nearly egg-shaped, and the stem end is generally located at the sharp end. Based on this fact, a stem-end detection algorithm was developed. The gravity center location of the fruit was identified first. Next, the pixel in the fruit, which is furthest from the gravity center of the fruit, was considered the tip of the stem end. Finally, the pixels of the fruit, within a search range ( R s e a r c h ) to the stem end tip, were considered belonging to the stem end. In this study, the search range was proportional to the square root of the fruit area, and the scale factor was determined experimentally.

3. Results and Discussion

3.1. Spectral Characteristics

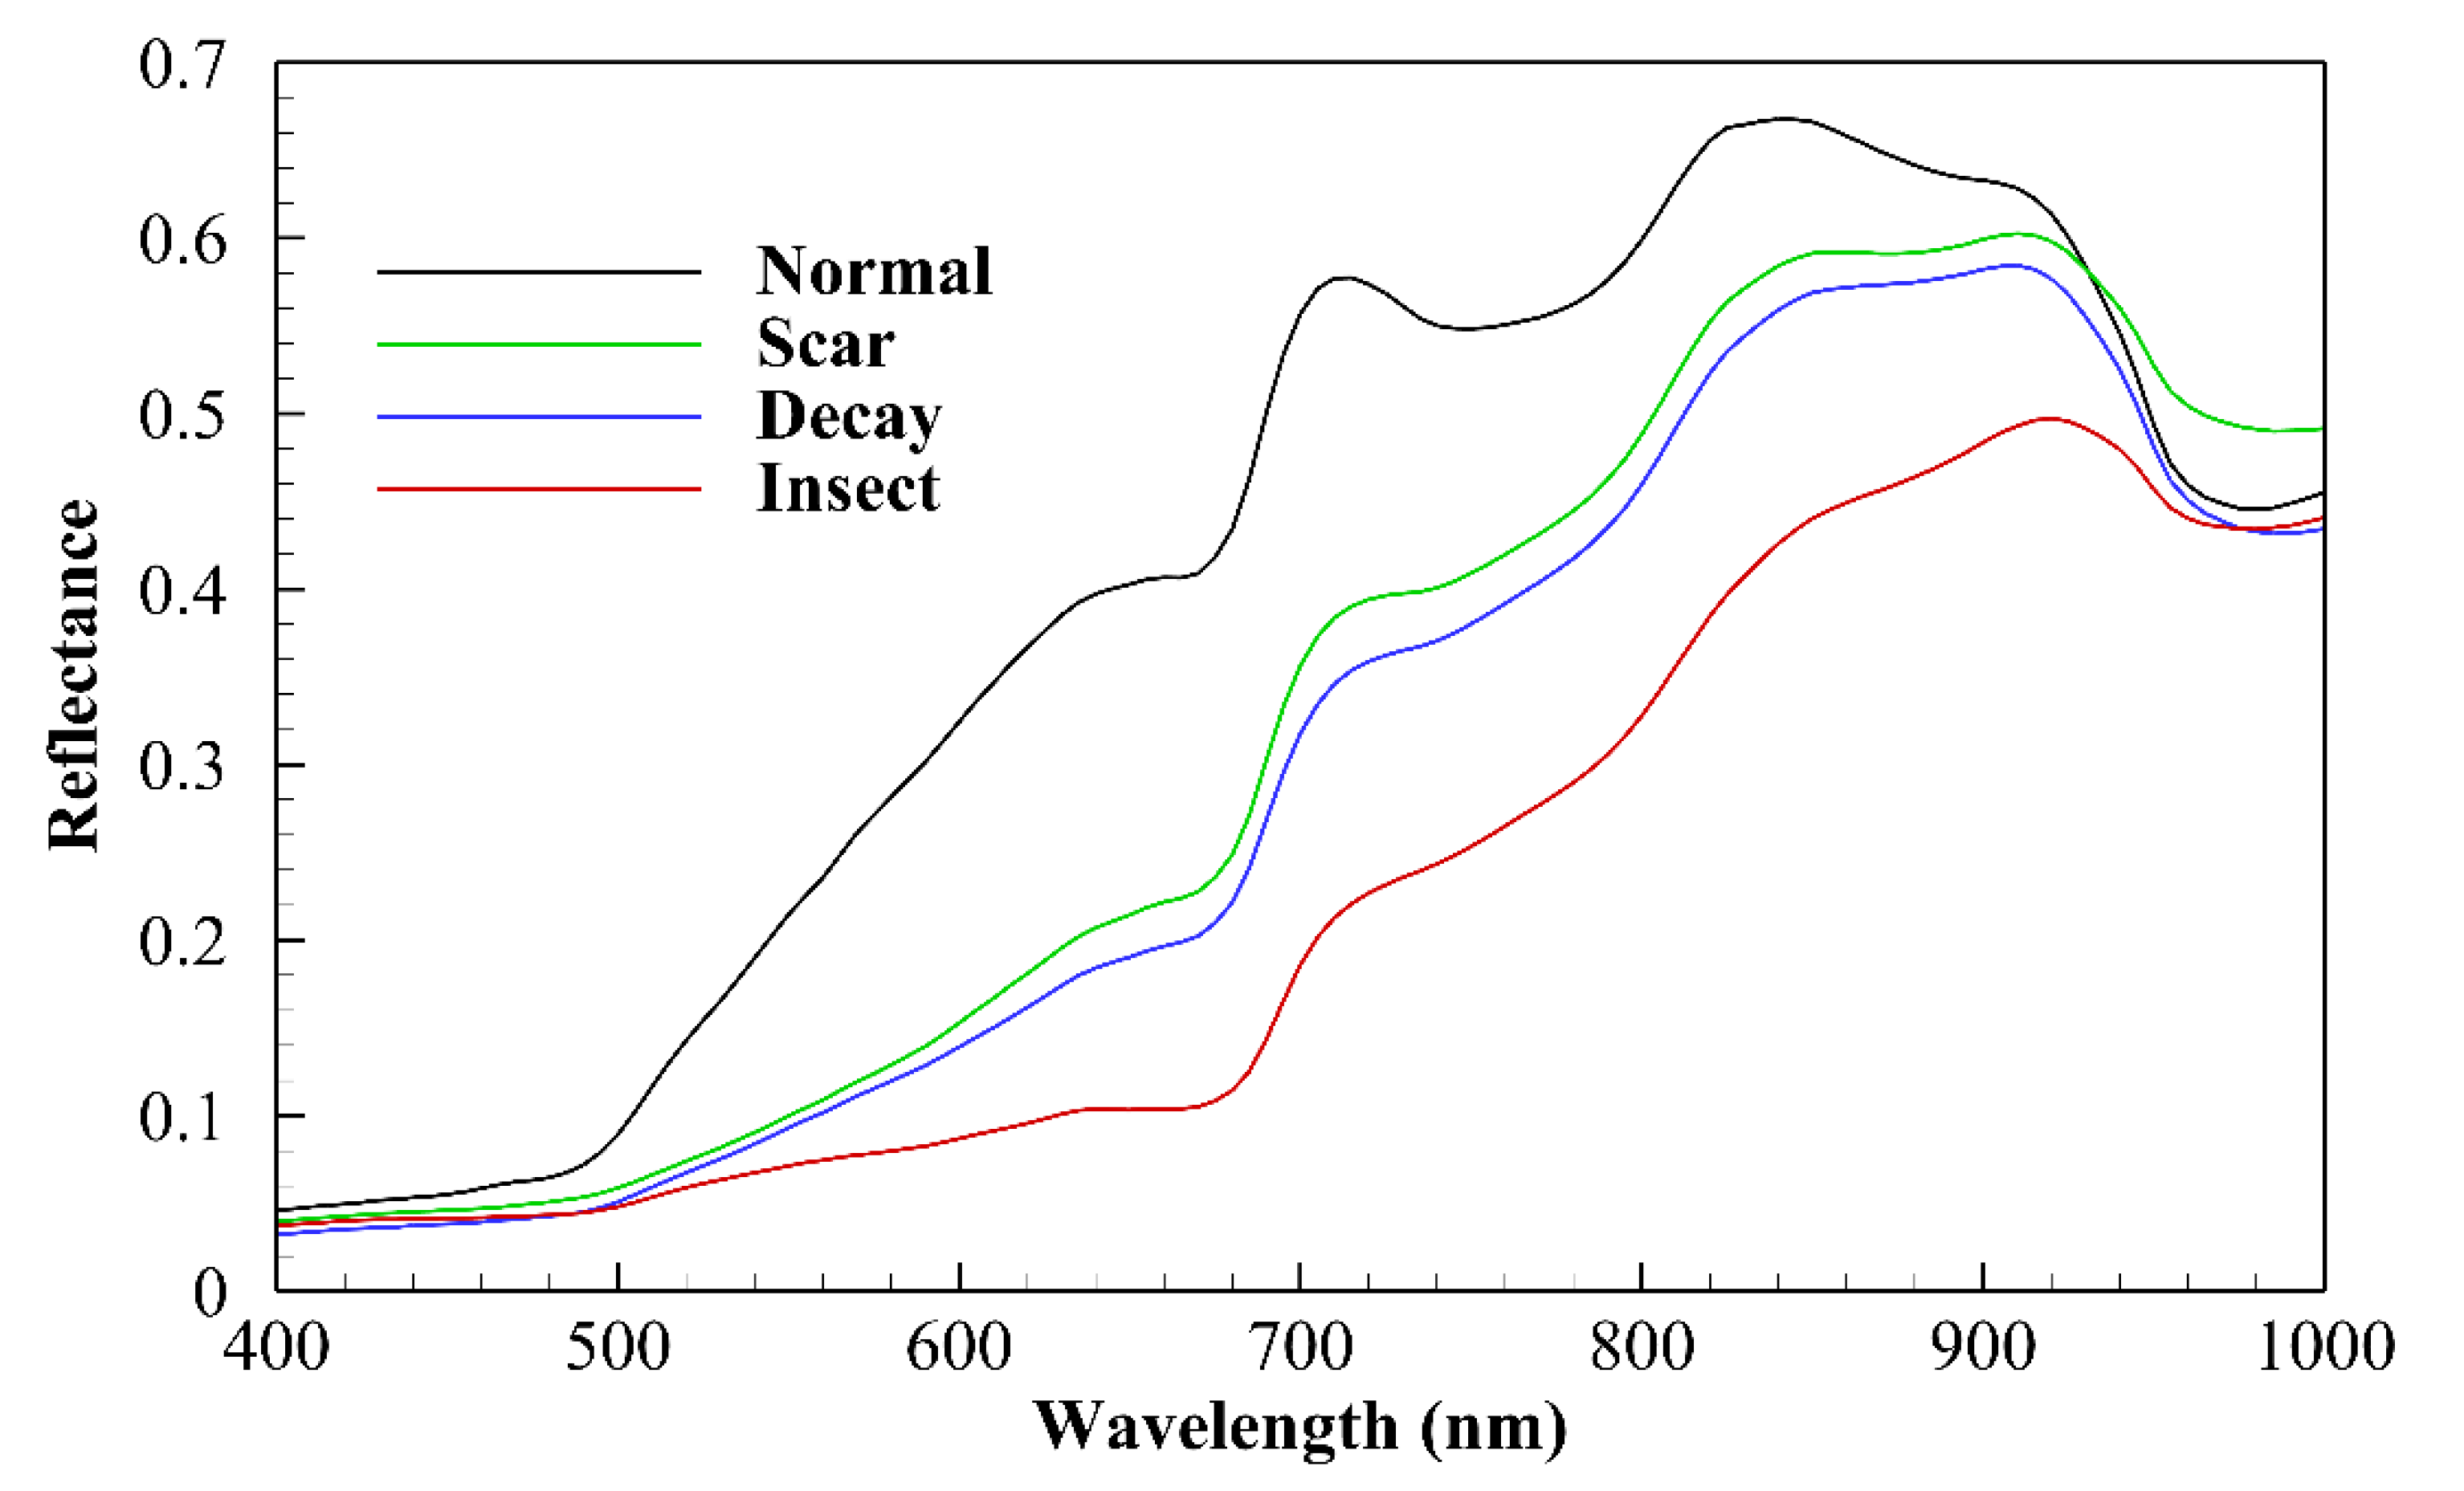
Figure 2 shows the averaged spectra of the four skin types. The reflectance spectra of all skin types are low and similar within the wavelength range of 400–485 nm, and the reflectance of the normal skin is slightly higher than those of all defective skin types. There is a turn-over point at about 485 nm for the reflectance of all skin types. The increases in reflectance for wavelengths higher than the turn-over point are faster than the increases in reflectance Within the wavelength range of 500–850 nm, the reflectance of normal skin is much higher than those of the other skin types; the insect bite skin has the lowest reflectance. Moreover, rusty and decaying skins have a relatively similar spectrum.
Although the average reflectance intensity of normal skin is higher than that of all the defective skin types within most of the wavelength range (400–920 nm), using reflectance intensity to differentiate between normal and defective skin is problematic. As the curvature of the achacha fruit leads to non-uniform illumination when using point light sources, the reflectance intensity of the defective skin located in the center of the fruit could be higher than that of the normal skin near the fruit border in the image. One thing that can be noticed is that within the wavelength ranges of 715–745 nm and 845–915 nm, the slopes of the reflectance intensity of the normal skin are negative; however, those of all defective skin types are positive. This finding can potentially be used for the derivative analysis of the HSI data. For example, the second derivative of the spectra was used to detect fungal infection in strawberries [34] and in the pits of cherries [35].

3.2. The BR and SAM Algorithms for Binary Classification

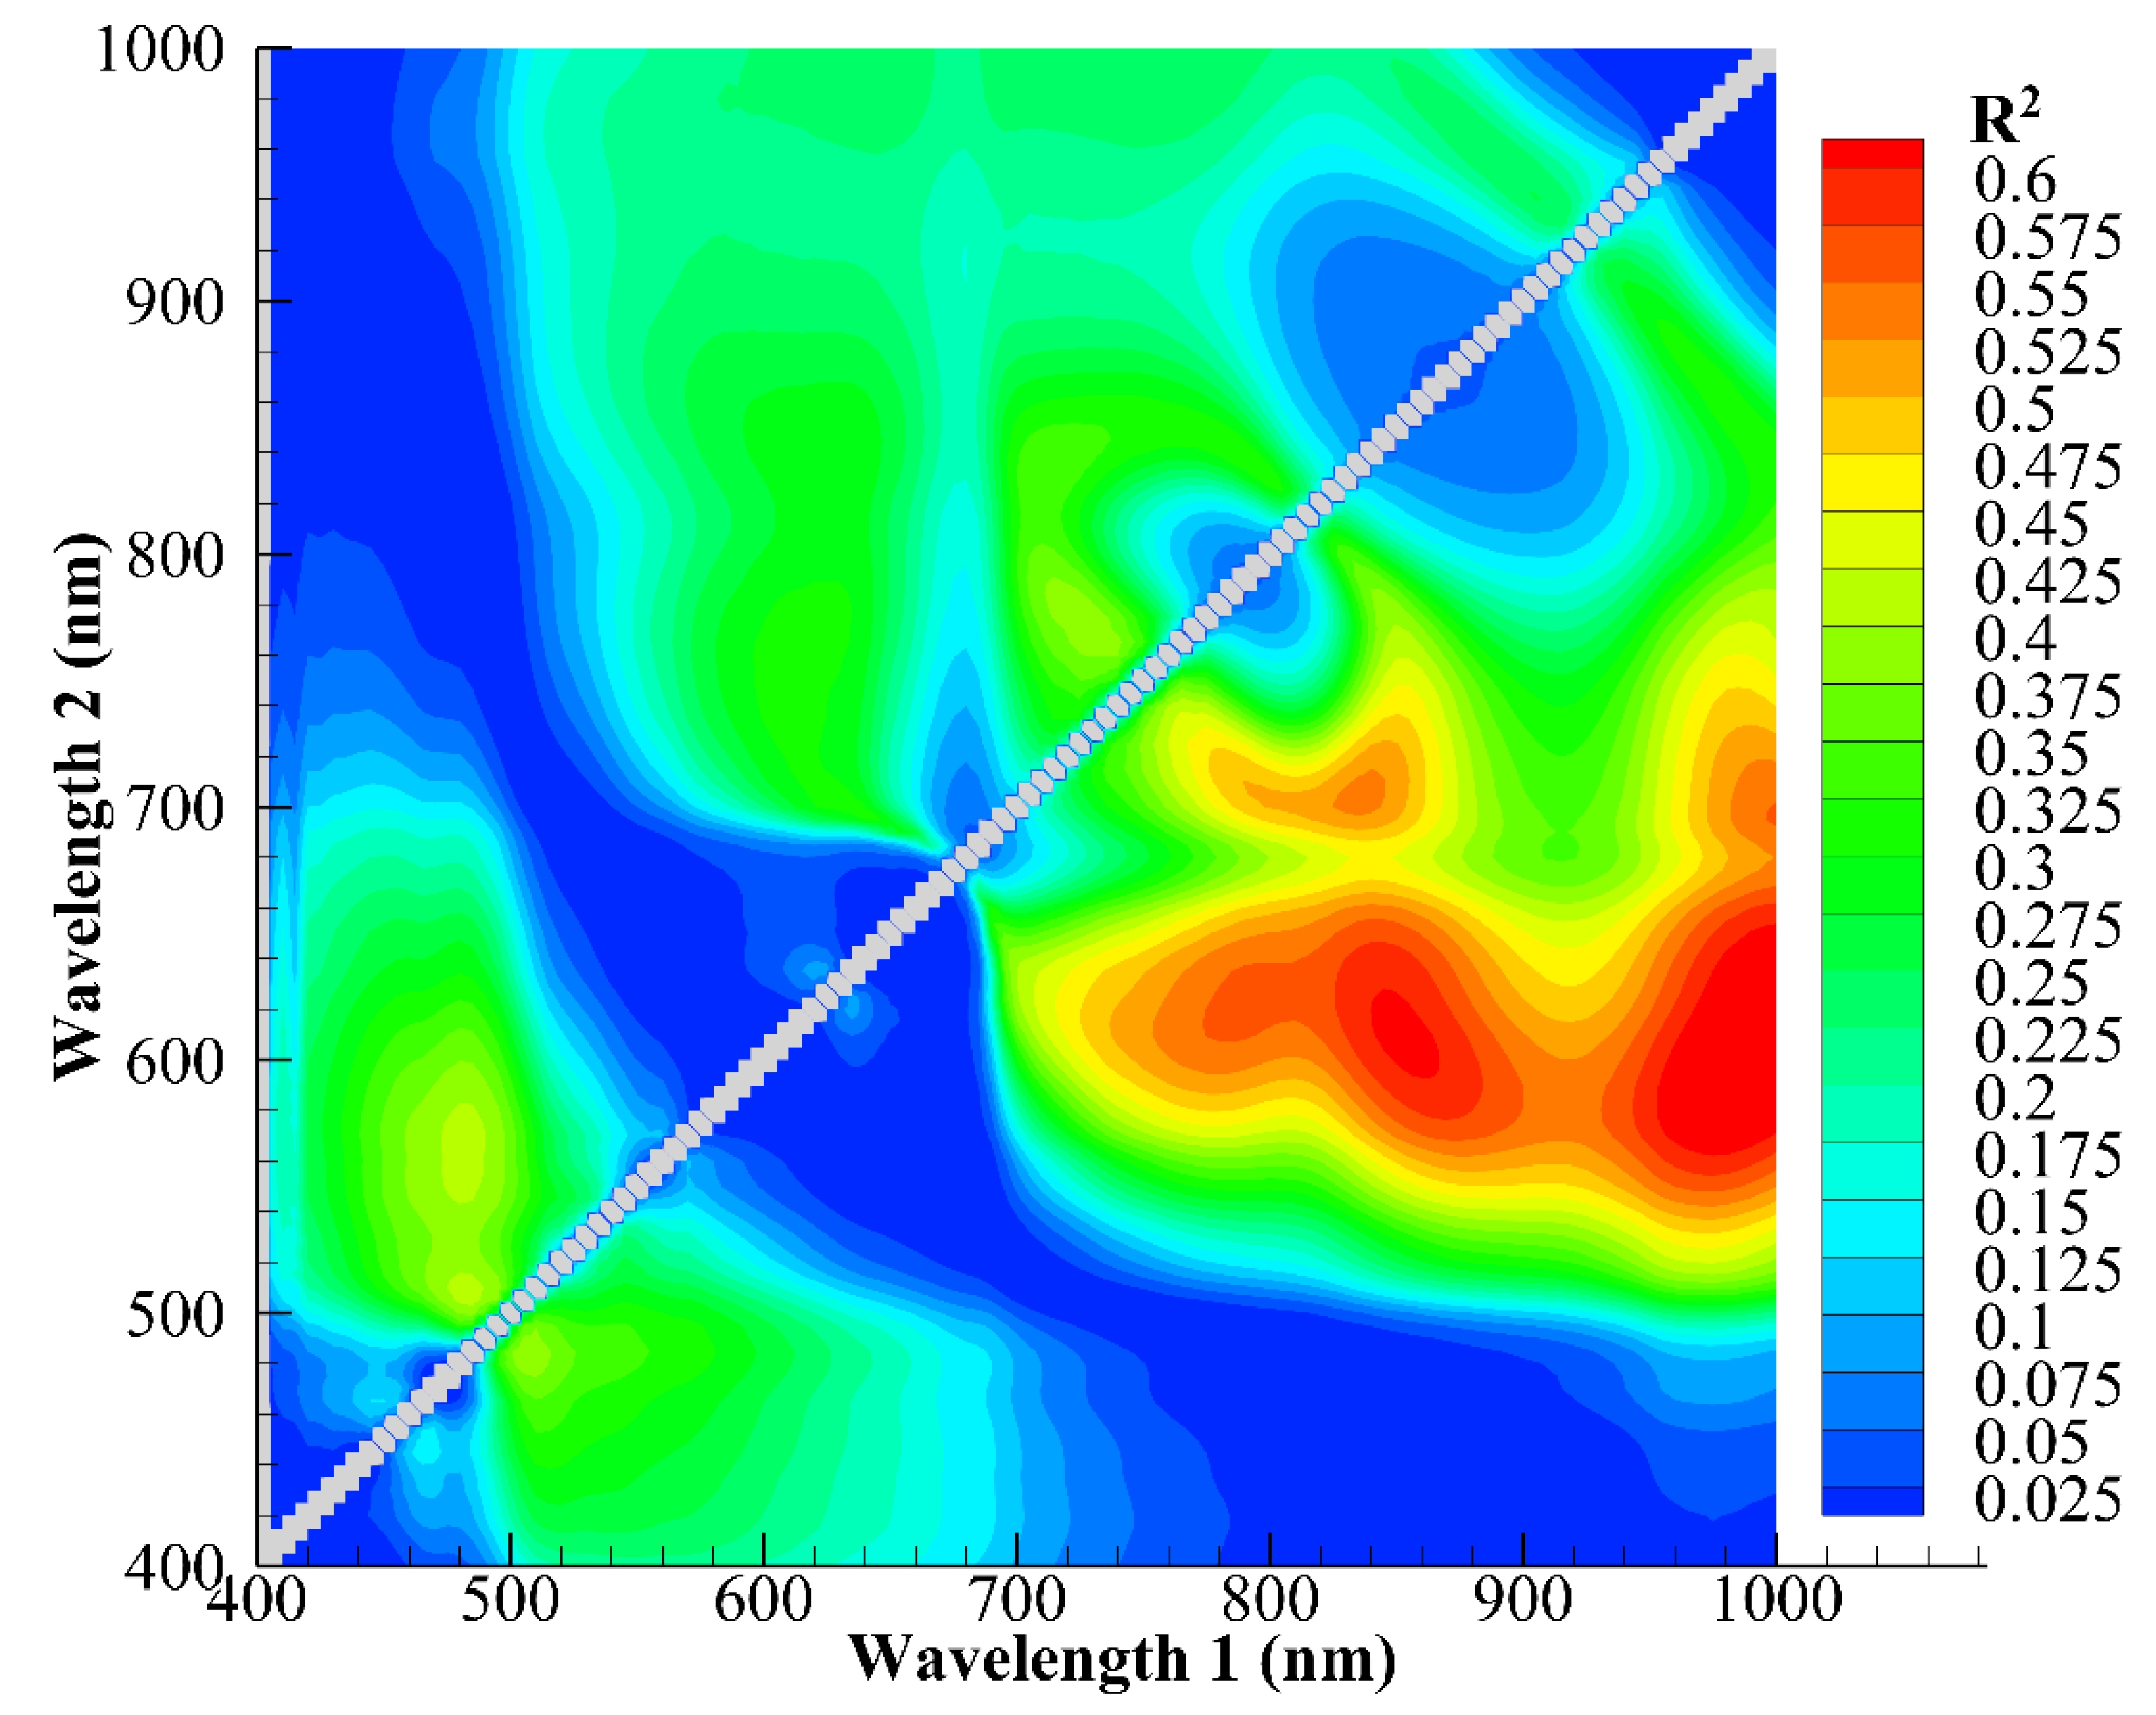
The binary defect classification (normal or defective) was performed using the BR and SAM algorithms. Figure 3 shows the contour plot of the R2 values of the BR pairs. Two high R2 regions centered at 840 nm/600 nm and 980 nm/600 nm were found, and the BR with the highest correlation coefficient is 990 nm/600 nm (R2 = 0.6490). Furthermore, when applied to the training data, the optimized threshold for this BR is 1.7726 with a 0.9375 accuracy value.
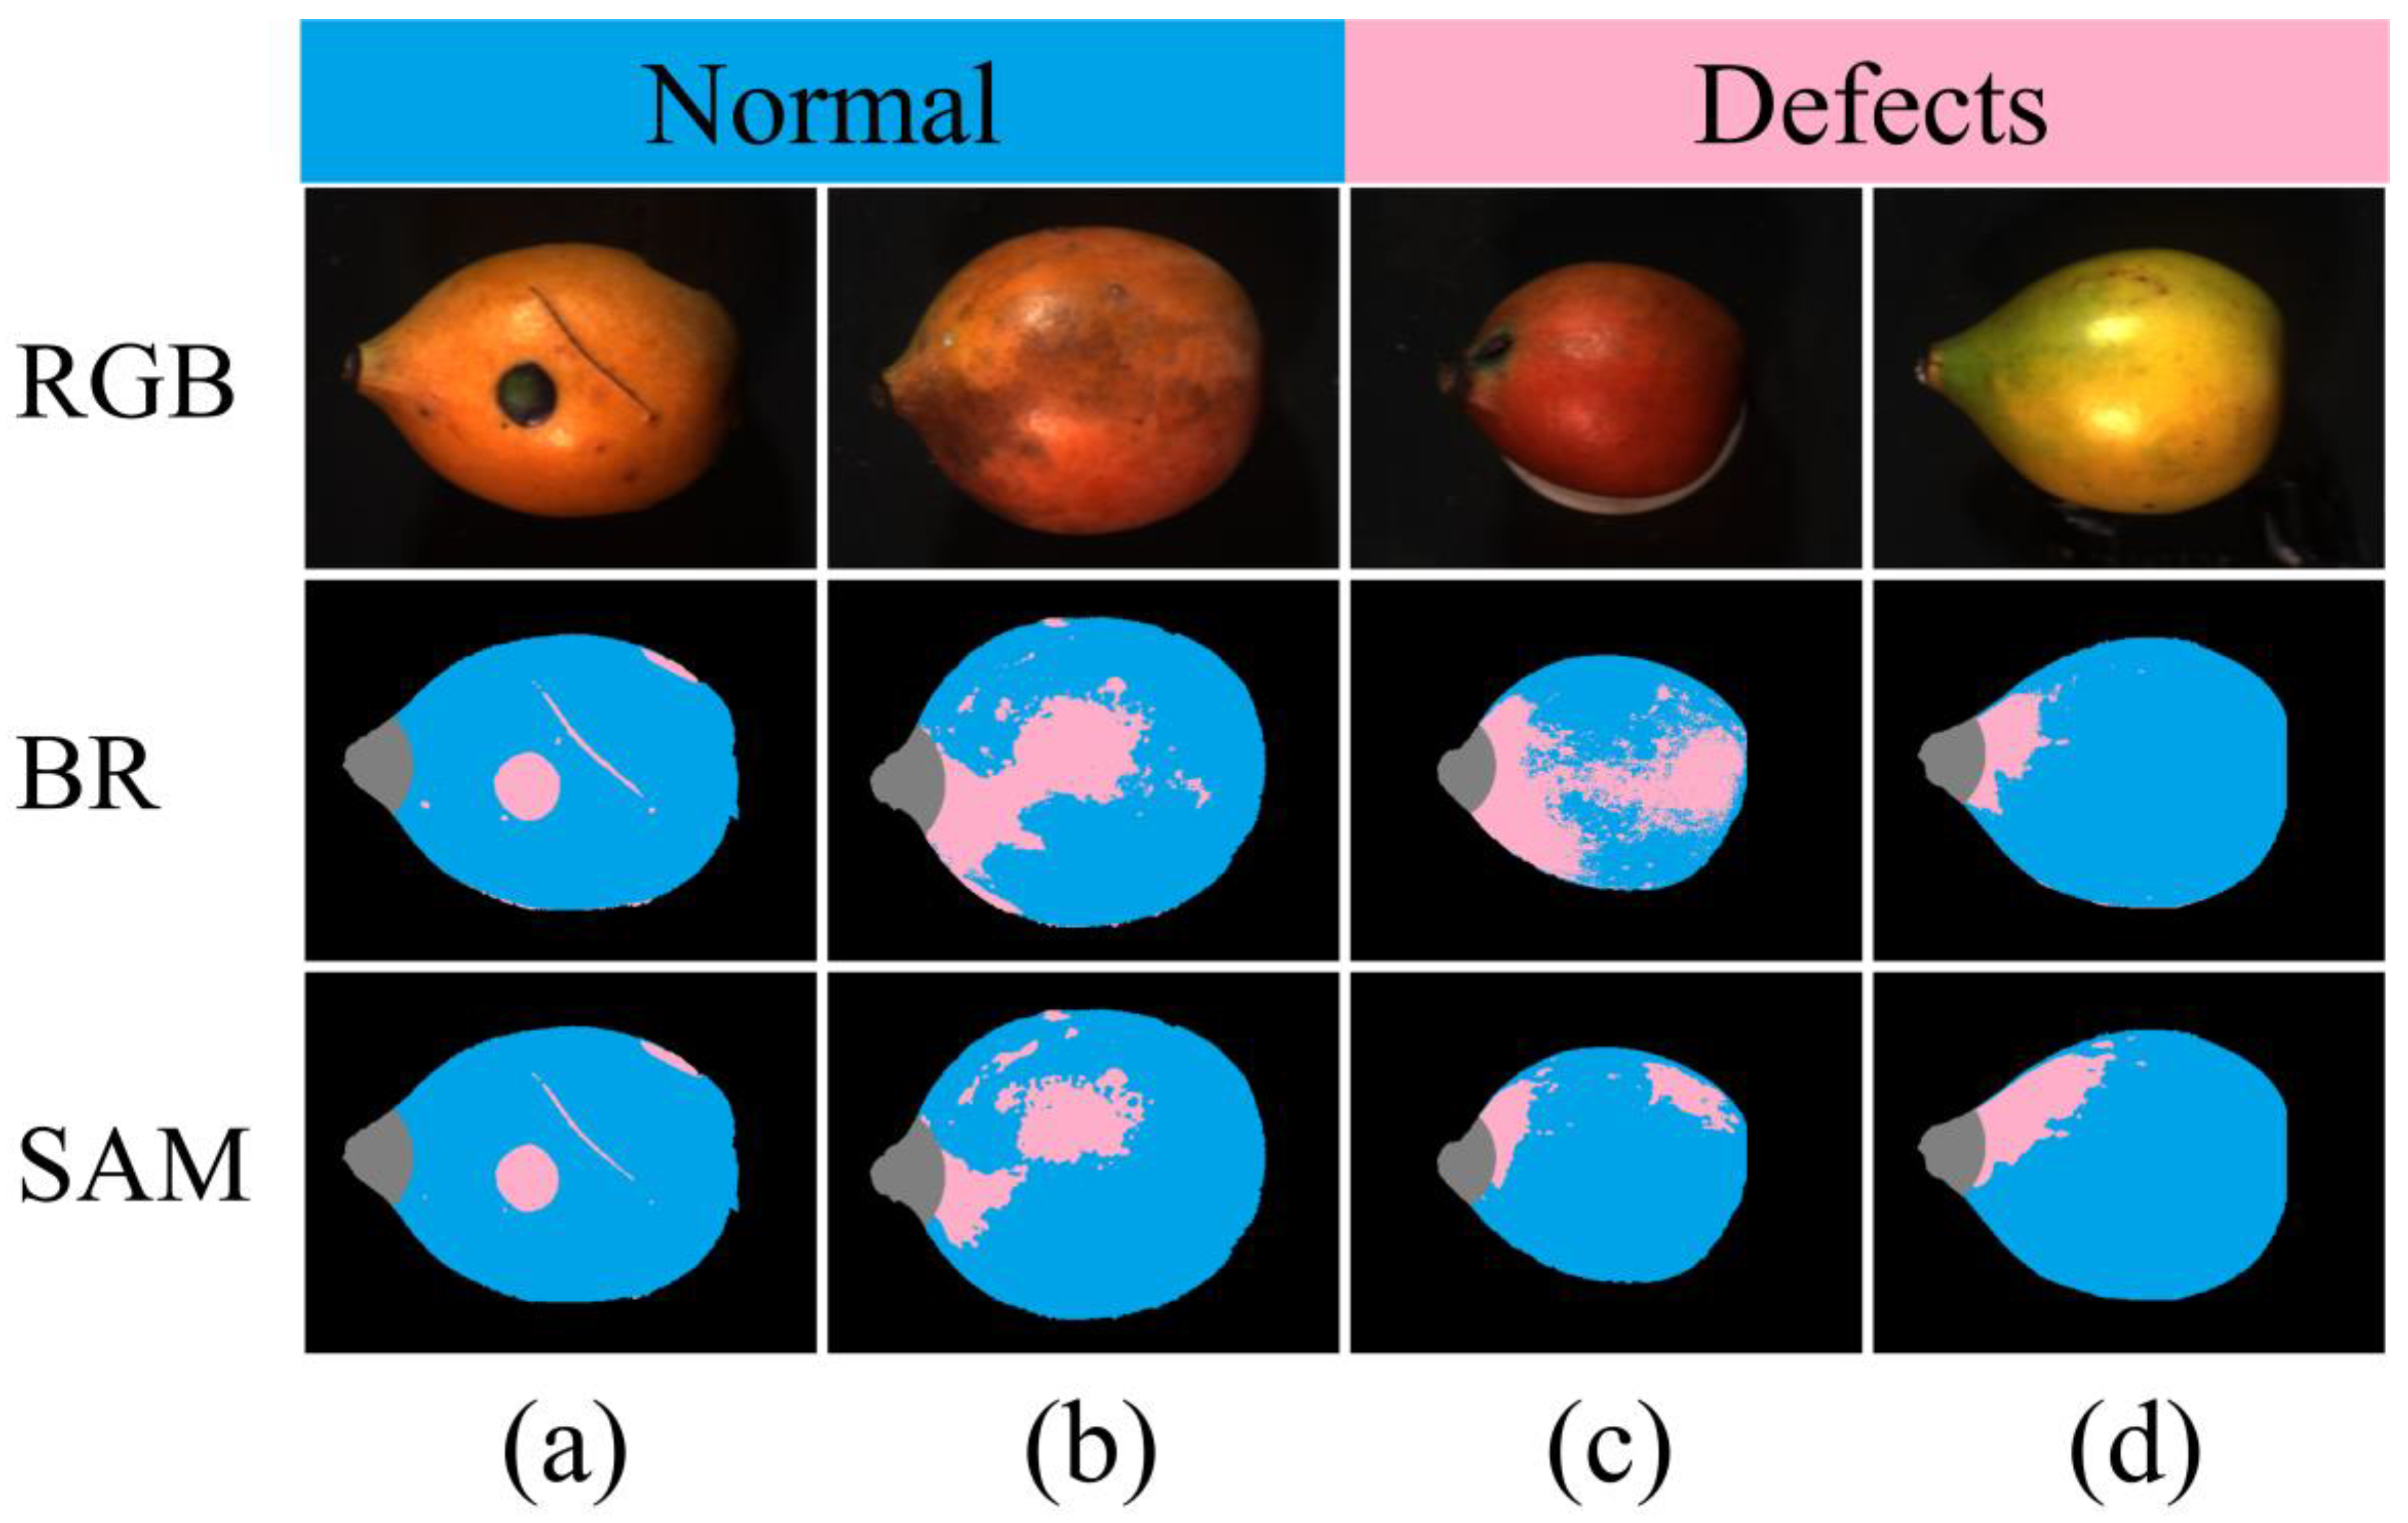
The accuracies of the BR and binary SAM were 78.70% and 75.02% for the test data set, respectively. Figure 4 shows the classification results of the typical samples predicted by the BR and binary SAM methods. In Figure 4, the sample results are as follows: (a) results show that the BR and SAM algorithms can appropriately classify the scar and insect bite spot correctly; furthermore, it can be seen from the results of sample (b) that the BR can predict decay better than the SAM. When an achacha fruit ripens, its color changes from green to yellow to dark orange. Therefore, the spectra of the achacha fruits with different ripeness levels vary and could lead to the difficulty of using a single band ratio to classify the defects on achacha fruits of all ripeness levels. For example, samples (c) and (d) are the achacha fruits with high and low ripeness, respectively. Therefore, the dark red normal skin of sample (c) and the less ripening region in sample (d) were misclassified as defects.
The gray regions shown in Figure 4 were the stem end regions defined by the stem end detection algorithm proposed in this study. Through visual examination, the optimized scale factor was 1/4; therefore, the search radius was defined as:
R search = Mask   area 4

3.3. The SAM and ML Models for Multiple-Class Classification

The confusion matrices and accuracies of the SAM, SVM, and ANN models are shown in Table 1. Among the three models, the SAM model has the lowest accuracy (58.36%), and the ANN model has the highest accuracy (99.88%). For the SAM model, the misclassification rate between the two classes (i.e., normal and insect bite) with the most different spectral characteristics is the lowest. Furthermore, these two classes have higher accuracy (85.2% and 72.6%) than the other two classes (36.1% and 39.3%).
Figure 2 shows that the spectral profiles of the scar and decay skin types are the most similar if the shape and reflectance magnitude are considered simultaneously. Therefore, compared with other skin type pairs, the chances of misclassification are high between these two classes. The misclassification rates of the scar to decay and the decay to scar are 17.8% and 23.9%, respectively. However, there is an exception for the scar skin type in that the misclassification rate of a scar to the insect bite is the highest (39.9%). The reason could be that the SAM model uses only the n-dimension angle of the pixel to match the angle of the reference spectra without considering the magnitude of the n-dimension spectrum vector. Therefore, if the angle between the vector of the scar skin pixel and the reference spectrum vector of the insect bite is smaller than that between the decay reference spectrum vector, the scar pixel could be misclassified as the insect bite class, rather than the decay classes by the SAM algorithm.
Instead of only using the angle information of the n-dimension spectral data, both the SVM and ANN models can use the angle and magnitude of the spectral vectors simultaneously. The accuracy of the SVM model is 83.5%. Similar to the SAM model, the normal (92.8%) and insect bite (89.3%) classes have higher accuracies. Moreover, compared to the SAM model, the misclassification rate of a scar to the insect bite decreased to 12.0%. For the ANN model, the misclassification rates for all classes were no greater than 0.2%. This result implied that the ANN model could be trained appropriately and used to validate the data set used in this study. Although the accuracy of the ANN model is high and the computation speed is fast, the use of the ANN model in practice, such as the online sorting of the achacha fruits during the postharvest process, should be further investigated. Due to the high model complexity, the ANN model is prone to overfitting [36].
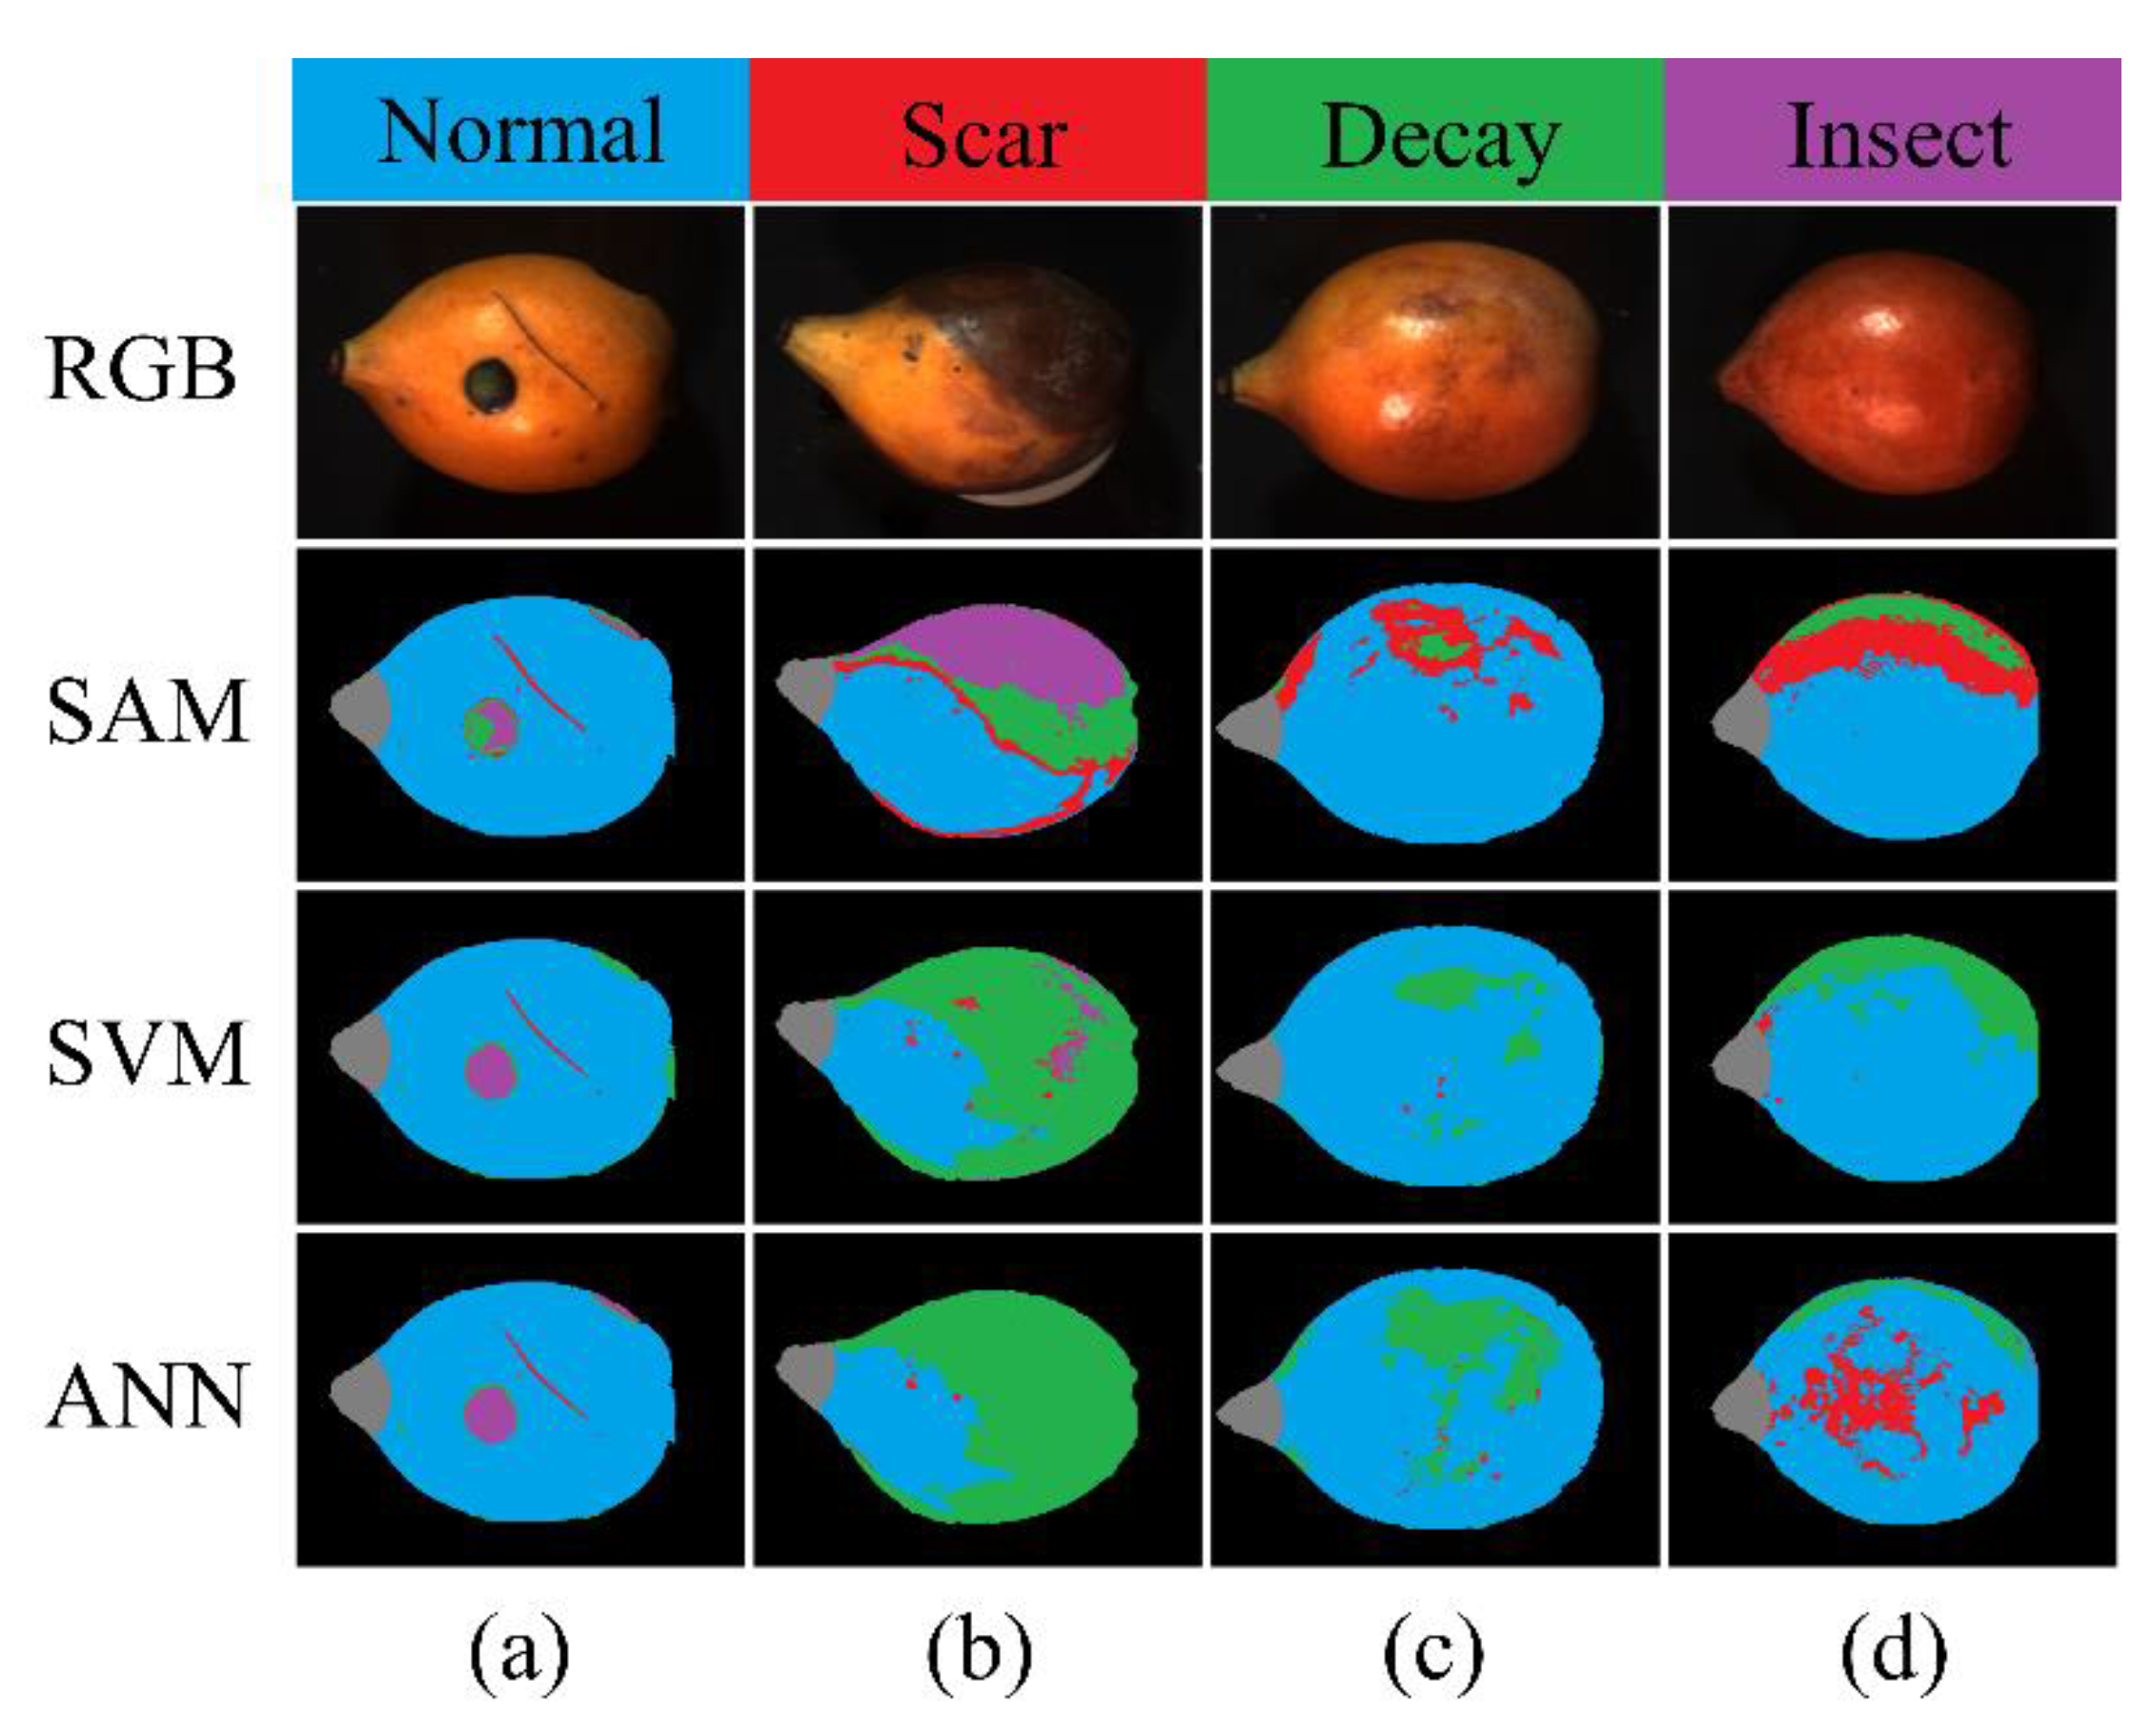
Figure 5 shows the typical classification results of the samples using the SAM, SVM, and ANN models. The skin color changes from green to yellow to dark orange when the achacha fruits ripen, and sample (d) has the highest ripeness stage. Moreover, samples (a)–(c) are under uniform illumination. However, the illumination for sample (d) is relatively non-uniform; the upper part of this sample is under lower illumination.
It can be seen, from the first row of classification results, that the SAM can correctly identify normal skin with proper illumination; however, the SAM cannot identify the normal skin of the sample with a high ripeness stage under low illumination. Therefore, under relatively low illumination, the upper part of sample (d) (high ripeness stage sample) was misclassified as either the decay or scar regions. Compared to the SVM and ANN models, the misclassification rate between defect classes is high for the SAM model. For example, a significant portion of the fully developed decayed area in sample (b) was misclassified as an insect bite area. Furthermore, the newly developed decay regions on samples (b) and (c) were misclassified as a scar class.
The models (i.e., SVM and ANN) based on the machine learning algorithms can classify the defect classes better than the SAM model. For example, the sample (b) classification results by the SVM and ANN models show that both models can classify the fully developed decay correctly. Furthermore, the newly developed decay regions located on the border of normal skin and fully developed decay regions in sample (b) and the newly onset decay in sample (c) can also be identified. One thing that should be pointed out is that there are external contamination spots on the fully developed decay region of sample (b). The contamination did not affect the classification results of the ANN model; however, the SVM model classified the decay regions with the contamination as insect bite spots. Therefore, this finding should be considered when applying the above-mentioned models to the sorting line.
Sample (d) classification results can show how low illumination affects the classification results of the high ripeness stage achacha fruits. In addition, the results show that the SAM model, among the three models, is most sensitive to non-uniform illumination. Under relatively low illumination, the SAM model classified the upper part of sample (d) as either the decay or scar regions. Moreover, the ANN is the model least sensitive to low illumination. It can be seen that the misclassification of normal to decayed regions of the ANN model is smaller than that of the SVM model. Except for the high ripeness level (level 7) samples, the ripeness level does not affect the classification result of the classification models used in this study.
At the end of the ripening stage, the dark orange achacha fruits either decay or dehydrate. The ripening and decaying of fruits are continuous processes. Therefore, compared to a classification model, a regression model would be more appropriate to evaluate the fruit’s level of ripeness or decay. However, defective identification models are classification models. Therefore, when using a classification model to identify surface defects (including decay) of the achacha fruits, selecting data points with suitable ripeness and decay level for the training data set is critical for adequately separating the normal skin types from other low reflectance skin types. Moreover, the data selecting and labeling task of the normal data set for model training would involve an iterative trial and error procedure. The classification results of sample (d) show that the SVM model could correctly identify the normal skin type in the properly illuminated area of this high-ripeness stage sample; however, the ANN model misclassified a large portion of normal skin as scars. Therefore, to reduce the ANN model's misclassification of normal skin at the high ripeness stage of achacha fruit, sufficient representative data points should be selected and added to the training and test sets of the ANN model.

3.4. Principal Component Analysis

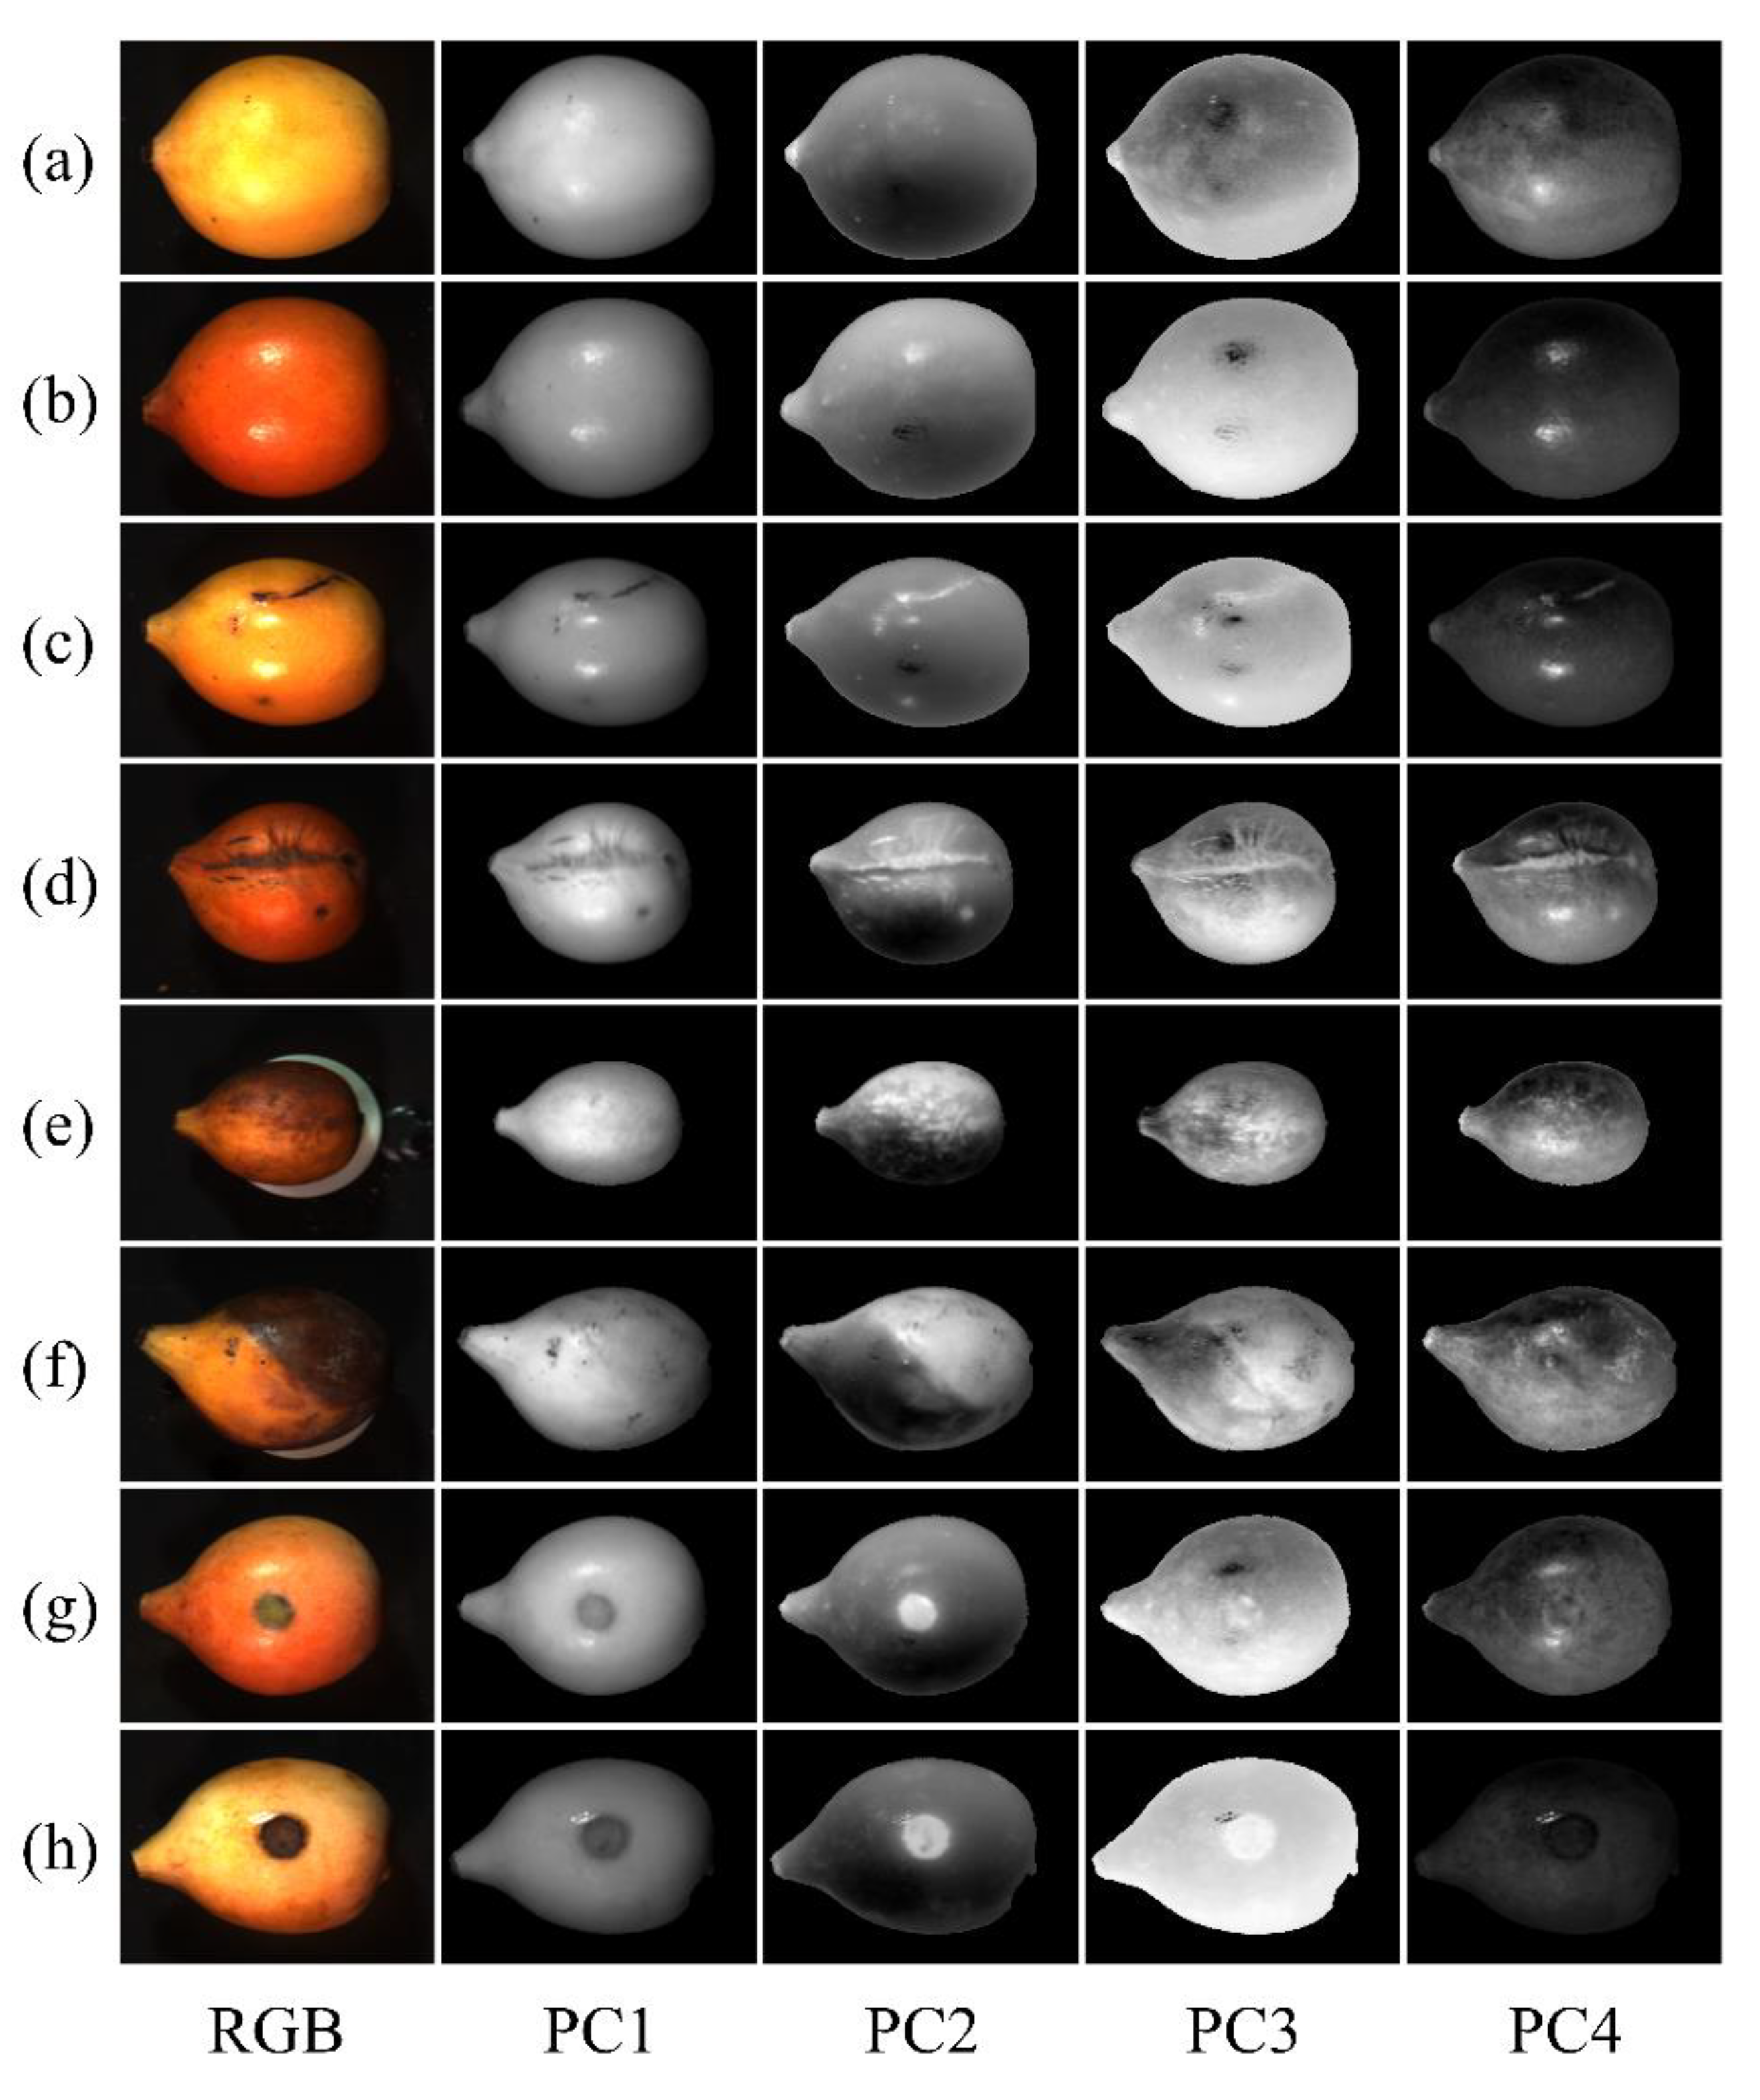
Figure 6 shows the first four PC images of eight typical samples (two samples per class). The first four PCs can explain 98.75% of the total variance (PC1: 81.77%, PC2: 13.08%, PC3: 2.80%, and PC4: 1.10%). The PC1 images are similar to the grayscale image of the samples, and these images do not provide extra information other than the original spectral images for surface defect detection. However, by investigating the images of PC2~4, a distinguishable contrast of different skin types can be found in the PC image(s). Among the four PCs, PC2 could be the most valuable for detecting defects, especially decay and insect bite. Due to the contrast between decay and normal, insect bite and normal is high. In addition, the contrast between scar and normal is distinguishable. Furthermore, in PC3 and PC4 images, the defects and normal skin can also be differentiated with low contrast.
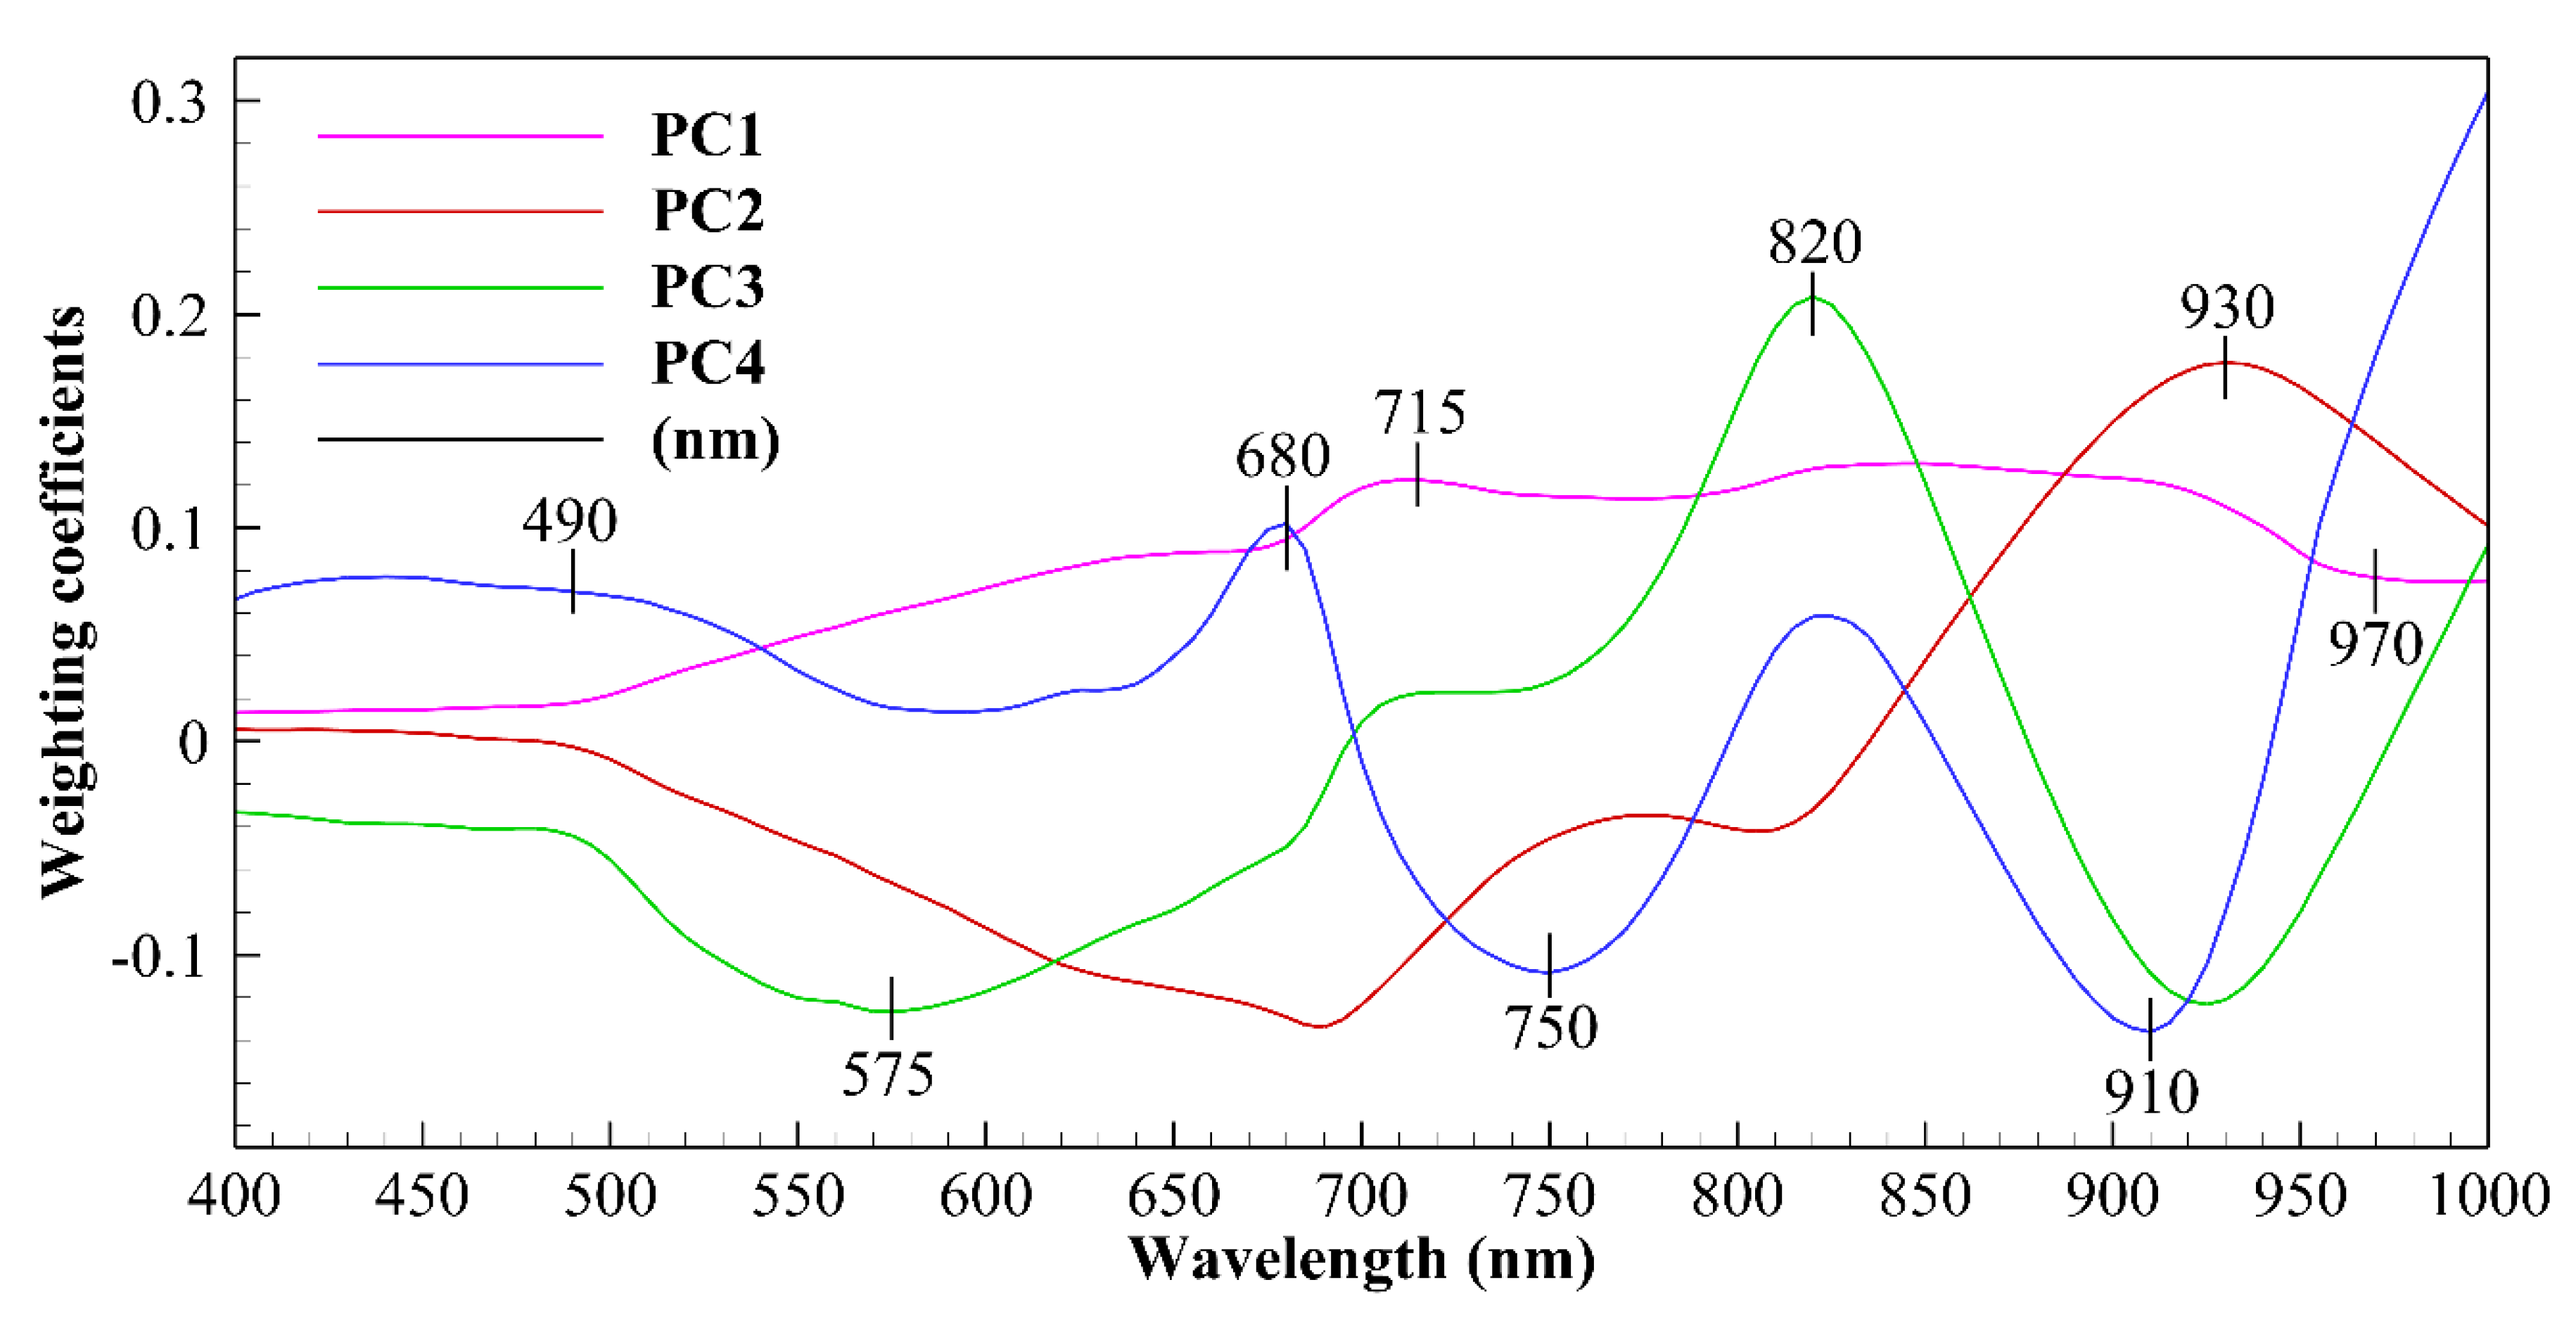
Figure 7 shows the weighting-coefficient curves of the first four PCs and the wavelengths selected for the training of the classification models. The local minimums and maximums of the weighting-coefficient curves correspond to the effective wavelengths that significantly contribute to the PC images. Therefore, the wavelengths corresponding to the local minimums and maximums of the weighting-coefficient curves were selected to train the SVM and ANN models for a further data reduction analysis [16].
Table 2 shows the performance of the SAM, SVM, and ANN models using the characteristic-wavelength data selected from the PCA analysis. The accuracies of the SAM, SVM, and ANN models trained with the selected nine bands are 51.49%, 80.76%, and 96.85%, respectively. For the ANN model, the accuracy decreased by 3.13%; however, the number of spectral bands reduced from 121 to 9. Using only nine characteristic wavelengths for surface defect detection can improve the training and classification speeds and provide more options for image data acquisition. In addition to using a push-broom system to obtain the full-range bands and to select the nine characteristic bands, a snapshot multispectral camera with nine-channel Bayer-like mosaic filters could be custom-made to obtain the nine wavelength bands in one shot. Reducing the classification and image acquisition times is essential for the vision-based online sorting systems of agricultural products.
In Taiwan, achacha is an emerging fruit with a long juvenile period. The achacha fruit samples are relatively difficult to obtain at the current stage. The small number of fruit samples used in this preliminary study were obtained from the same farm in the same season. The significant difference in the accuracy of ANN vs. SAM pointed out the possibility of overfitting in the ANN model, and this issue will be investigated by using a larger dataset of the independent samples to train the models in future work. Furthermore, different cultivar and environmental factors could affect the physicochemical properties of the achacha fruits; therefore, the reflection spectra of the four skin types investigated in this study could have a variance for the achacha fruits obtained from the different farms or obtained in other years. Therefore, collecting the hyperspectral image data of the achacha fruits from different farms in other seasons to diversify the training and test data set will also be included in future work; therefore, the robustness of the classification models can be improved.

4. Conclusions

This study showed that the HSI data within the wavelength range of 400–1000 nm could be used to accurately classify the normal and three common defective skin types of the achacha fruit. Both the conventional hyperspectral image data analysis algorithms and the machine learning algorithms were used as classifiers for the skin defect detection of the achacha fruits. However, due to the complexity of the skin defect detection problem of the achacha fruits, the conventional HSI data analysis methods, such as the BR and SAM, cannot classify the skin statuses well, even in binary classification problems. The ML algorithms like the SVM and ANN can give significantly better prediction results than the BR and SAM. In terms of accuracy in multiple-class problems with full spectra, the accuracies of the ANN (99.88%) and SVM (83.59%) are significantly higher than that of the SAM (58.36%). Therefore, it is worth spending more on computation costs for the ML algorithms and using them for sorting achacha fruits during postharvest processing, especially with the recent fast development of computer hardware. The ANN model has the highest accuracy of all the models used in this study and the fastest computation speed. Therefore, the ANN model is a good candidate for the postharvest processing of the achacha fruits, such as online sorting. However, due to the high model complexity, the ANN model is prone to overfitting. To improve the robustness of the ANN model, collecting the hyperspectral image data of the achacha fruits from different farms in other seasons to diversify the training and test data set would be a good option. The accuracy of the models using only characteristic wavelengths selected based on PCA decreased; however, the reduction of the bands can improve training and classification speeds and provide more options for image data acquisition. For example, a snapshot multispectral camera could potentially expedite the data acquisition for only the selected nine characteristic bands. Classification speed is critical for the online sorting system of fruits. Additionally, the stem end detection algorithm developed based on the fruit shape can correctly identify the stem end location, and it can be used to avoid misclassifying the stem end as a defect during the online sorting of the achacha fruits.

Author Contributions

N.M.T.N.: Analysis, visualization, investigation, initial draft preparation. N.-S.L.: Conceptualization, review and editing. All authors have read and agreed to the published version of the manuscript.

Funding

This research was funded by the Ministry of Science and Technology, Taiwan (MOST 110-2637-E-218-005).

Data Availability Statement

Not applicable.

Conflicts of Interest

The authors declare no conflict of interest.

References

  1. Nunes, R.; Broering, M.F.; De Faveri, R.; Goldoni, F.C.; Mariano, L.N.B.; Mafessoli, P.C.M.; Delle Monache, F.; Cechinel, V.; Niero, R.; Santin, J.R.; et al. Effect of the metanolic extract from the leaves of Garcinia humilis Vahl (Clusiaceae) on acute inflammation. Inflammopharmacology 2021, 29, 423–438. [Google Scholar] [CrossRef] [PubMed]
  2. Almeida, R.L.J.; Santos, N.C.; Alves, I.L.; Andre, A.M.M.C.N. Evaluation of thermodynamic properties and antioxidant activities of Achachairu (Garcinia humilis) peels under drying process. Flavour. Frag. J. 2021, 36, 213–222. [Google Scholar] [CrossRef]
  3. Wang, N.N.; Sun, D.W.; Yang, Y.C.; Pu, H.B.; Zhu, Z.W. Recent Advances in the Application of Hyperspectral Imaging for Evaluating Fruit Quality. Food Anal. Method 2016, 9, 178–191. [Google Scholar] [CrossRef]
  4. Cubero, S.; Lee, W.S.; Aleixos, N.; Albert, F.; Blasco, J. Automated systems based on machine vision for inspecting citrus fruits from the field to postharvest—A review. Food Bioprocess. Technol. 2016, 9, 1623–1639. [Google Scholar] [CrossRef] [Green Version]
  5. Elmasry, G.; Kamruzzaman, M.; Sun, D.W.; Allen, P. Principles and Applications of Hyperspectral Imaging in Quality Evaluation of Agro-Food Products: A Review. Crit. Rev. Food Sci. 2012, 52, 999–1023. [Google Scholar] [CrossRef]
  6. Patel, K.K.; Kar, A.; Jha, S.N.; Khan, M.A. Machine vision system: A tool for quality inspection of food and agricultural products. J. Food Sci. Technol. 2012, 49, 123–141. [Google Scholar] [CrossRef] [PubMed] [Green Version]
  7. Da Costa, A.Z.; Figueroa, H.E.H.; Fracarolli, J.A. Computer vision based detection of external defects on tomatoes using deep learning. Biosyst. Eng. 2020, 190, 131–144. [Google Scholar] [CrossRef]
  8. Khoje, S.; Bodhe, S. Comparative performance evaluation of fast discrete curvelet transform and colour texture moments as texture features for fruit skin damage detection. J. Food Sci. Technol. 2015, 52, 6914–6926. [Google Scholar] [CrossRef]
  9. Lorente, D.; Aleixos, N.; Gomez-Sanchis, J.; Cubero, S.; Garcia-Navarrete, O.L.; Blasco, J. Recent Advances and Applications of Hyperspectral Imaging for Fruit and Vegetable Quality Assessment. Food Bioprocess. Technol. 2012, 5, 1121–1142. [Google Scholar] [CrossRef]
  10. Blasco, J.; Aleixos, N.; Molto, E. Computer vision detection of peel defects in citrus by means of a region oriented segmentation algorithm. J. Food Eng. 2007, 81, 535–543. [Google Scholar] [CrossRef]
  11. Zhou, H.Y.; Zhuang, Z.L.; Liu, Y.; Liu, Y.; Zhang, X. Defect Classification of Green Plums Based on Deep Learning. Sensors 2020, 20, 6993. [Google Scholar] [CrossRef] [PubMed]
  12. Tan, W.K.; Husin, Z.; Yasruddin, M.L.; Ismail, M.A.H. Recent technology for food and beverage quality assessment: A review. J. Food Sci. Technol. 2023, 60, 1681–1694. [Google Scholar] [CrossRef] [PubMed]
  13. Qi, X.; Jiang, J.; Cui, X.; Yuan, D. Identification of fungi-contaminated peanuts using hyperspectral imaging technology and joint sparse representation model. J. Food Sci. Technol. 2019, 56, 3195–3204. [Google Scholar] [CrossRef] [PubMed]
  14. Davur, Y.J.; Kämper, W.; Khoshelham, K.; Trueman, S.J.; Bai, S.H. Estimating the ripeness of Hass avocado fruit using deep learning with hyperspectral imaging. Horticulturae 2023, 9, 599. [Google Scholar] [CrossRef]
  15. Hasanzadeh, B.; Abbaspour-Gilandeh, Y.; Soltani-Nazarloo, A.; Hernández-Hernández, M.; Gallardo-Bernal, I.; Hernández-Hernández, J.L. Non-Destructive Detection of Fruit Quality Parameters Using Hyperspectral Imaging, Multiple Regression Analysis and Artificial Intelligence. Horticulturae 2022, 8, 598. [Google Scholar] [CrossRef]
  16. Liu, G.S.; He, J.G.; Wang, S.L.; Luo, Y.; Wang, W.; Wu, L.G.; Si, Z.H.; He, X.G. Application of Near-Infrared Hyperspectral Imaging for Detection of External Insect Infestations on Jujube Fruit. Int. J. Food Prop. 2016, 19, 41–52. [Google Scholar] [CrossRef]
  17. Li, J.B.; Chen, L.P.; Huang, W.Q.; Wang, Q.Y.; Zhang, B.H.; Tian, X.; Fan, S.X.; Li, B. Multispectral detection of skin defects of bi-colored peaches based on vis-NIR hyperspectral imaging. Postharvest Biol. Technol. 2016, 112, 121–133. [Google Scholar] [CrossRef]
  18. Zhang, H.L.; Chen, Y.; Liu, X.M.; Huang, Y.F.; Zhan, B.S.; Luo, W. Identification of Common Skin Defects and Classification of Early Decayed Citrus Using Hyperspectral Imaging Technique. Food Anal. Method 2021, 14, 1176–1193. [Google Scholar] [CrossRef]
  19. Hernández, I.; Gutiérrez, S.; Ceballos, S.; Iñíguez, R.; Barrio, I.; Tardaguila, J. Artificial intelligence and novel sensing technologies for assessing downy mildew in grapevine. Horticulturae 2021, 7, 103. [Google Scholar] [CrossRef]
  20. Shurygin, B.; Smirnov, I.; Chilikin, A.; Khort, D.; Kutyrev, A.; Zhukovskaya, S.; Solovchenko, A. Mutual Augmentation of Spectral Sensing and Machine Learning for Non-Invasive Detection of Apple Fruit Damages. Horticulturae 2022, 8, 1111. [Google Scholar] [CrossRef]
  21. Zhang, H.; Zhang, S.; Dong, W.; Luo, W.; Huang, Y.; Zhan, B.; Liu, X. Detection of common defects on mandarins by using visible and near infrared hyperspectral imaging. Infrared Phys. Technol. 2020, 108, 103341. [Google Scholar] [CrossRef]
  22. Kim, D.W.; Burks, T.F.; Ritenour, M.A.; Qin, J.W. Citrus black spot detection using hyperspectral imaging. Int. J. Agric. Biol. Eng. 2014, 7, 20–27. [Google Scholar] [CrossRef]
  23. Pan, T.T.; Chyngyz, E.; Sun, D.W.; Paliwal, J.; Pu, H.B. Pathogenetic process monitoring and early detection of pear black spot disease caused by Alternaria alternata using hyperspectral imaging. Postharvest Biol. Technol. 2019, 154, 96–104. [Google Scholar] [CrossRef]
  24. ElMasry, G.; Wang, N.; Vigneault, C. Detecting chilling injury in Red Delicious apple using hyperspectral imaging and neural networks. Postharvest Biol. Technol. 2009, 52, 1–8. [Google Scholar] [CrossRef]
  25. Vetrekar, N.; Gad, R.S.; Fernandes, I.; Parab, J.S.; Desai, A.R.; Pawar, J.D.; Naik, G.M.; Umapathy, S. Non-invasive hyperspectral imaging approach for fruit quality control application and classification: Case study of apple, chikoo, guava fruits. J. Food Sci. Technol. 2015, 52, 6978–6989. [Google Scholar] [CrossRef]
  26. Wu, L.G.; He, J.G.; Liu, G.S.; Wang, S.L.; He, X.G. Detection of common defects on jujube using Vis-NIR and NIR hyperspectral imaging. Postharvest Biol. Tecnol. 2016, 112, 134–142. [Google Scholar] [CrossRef]
  27. Lee, H.; Kim, M.S.; Jeong, D.; Delwiche, S.R.; Chao, K.; Cho, B.K. Detection of Cracks on Tomatoes Using a Hyperspectral Near-Infrared Reflectance Imaging System. Sensors 2014, 14, 18837–18850. [Google Scholar] [CrossRef] [Green Version]
  28. Nguyen, N.M.T.; Liou, N.-S. Ripeness Evaluation of Achacha Fruit Using Hyperspectral Image Data. Agriculture 2022, 12, 2145. [Google Scholar] [CrossRef]
  29. Lee, K.; Kang, S.; Delwiche, S.R.; Kim, M.S.; Noh, S. Correlation analysis of hyperspectral imagery for multispectral wavelength selection for detection of defects on apples. Sens. Instrum. Food Qual. Saf. 2008, 2, 90–96. [Google Scholar] [CrossRef]
  30. Zhang, C.; Guo, C.T.; Liu, F.; Kong, W.W.; He, Y.; Lou, B.G. Hyperspectral imaging analysis for ripeness evaluation of strawberry with support vector machine. J. Food Eng. 2016, 179, 11–18. [Google Scholar] [CrossRef]
  31. Zhang, B.H.; Huang, W.Q.; Gong, L.; Li, J.B.; Zhao, C.J.; Liu, C.L.; Huang, D.F. Computer vision detection of defective apples using automatic lightness correction and weighted RVM classifier. J. Food Eng. 2015, 146, 143–151. [Google Scholar] [CrossRef]
  32. Fan, S.X.; Li, J.B.; Zhang, Y.H.; Tian, X.; Wang, Q.Y.; He, X.; Zhang, C.; Huang, W.Q. On line detection of defective apples using computer vision system combined with deep learning methods. J. Food Eng. 2020, 286, 110102. [Google Scholar] [CrossRef]
  33. Wang, H.T.; Hu, R.; Zhang, M.Y.; Zhai, Z.Q.; Zhang, R.Y. Identification of tomatoes with early decay using visible and near infrared hyperspectral imaging and image-spectrum merging technique. J. Food Process Eng. 2021, 44, e13654. [Google Scholar] [CrossRef]
  34. Siedliska, A.; Baranowski, P.; Zubik, M.; Mazurek, W.; Sosnowska, B. Detection of fungal infections in strawberry fruit by VNIR/SWIR hyperspectral imaging. Postharvest Biol. Technol. 2018, 139, 115–126. [Google Scholar] [CrossRef]
  35. Siedliska, A.; Baranowski, P.; Zubik, M.; Mazurek, W. Detection of pits in fresh and frozen cherries using a hyperspectral system in transmittance mode. J. Food Eng. 2017, 215, 61–71. [Google Scholar] [CrossRef]
  36. Zhang, A.; Lipton, Z.C.; Li, M.; Smola, A.J. Dive into deep learning. arXiv 2021, arXiv:2106.11342. [Google Scholar]
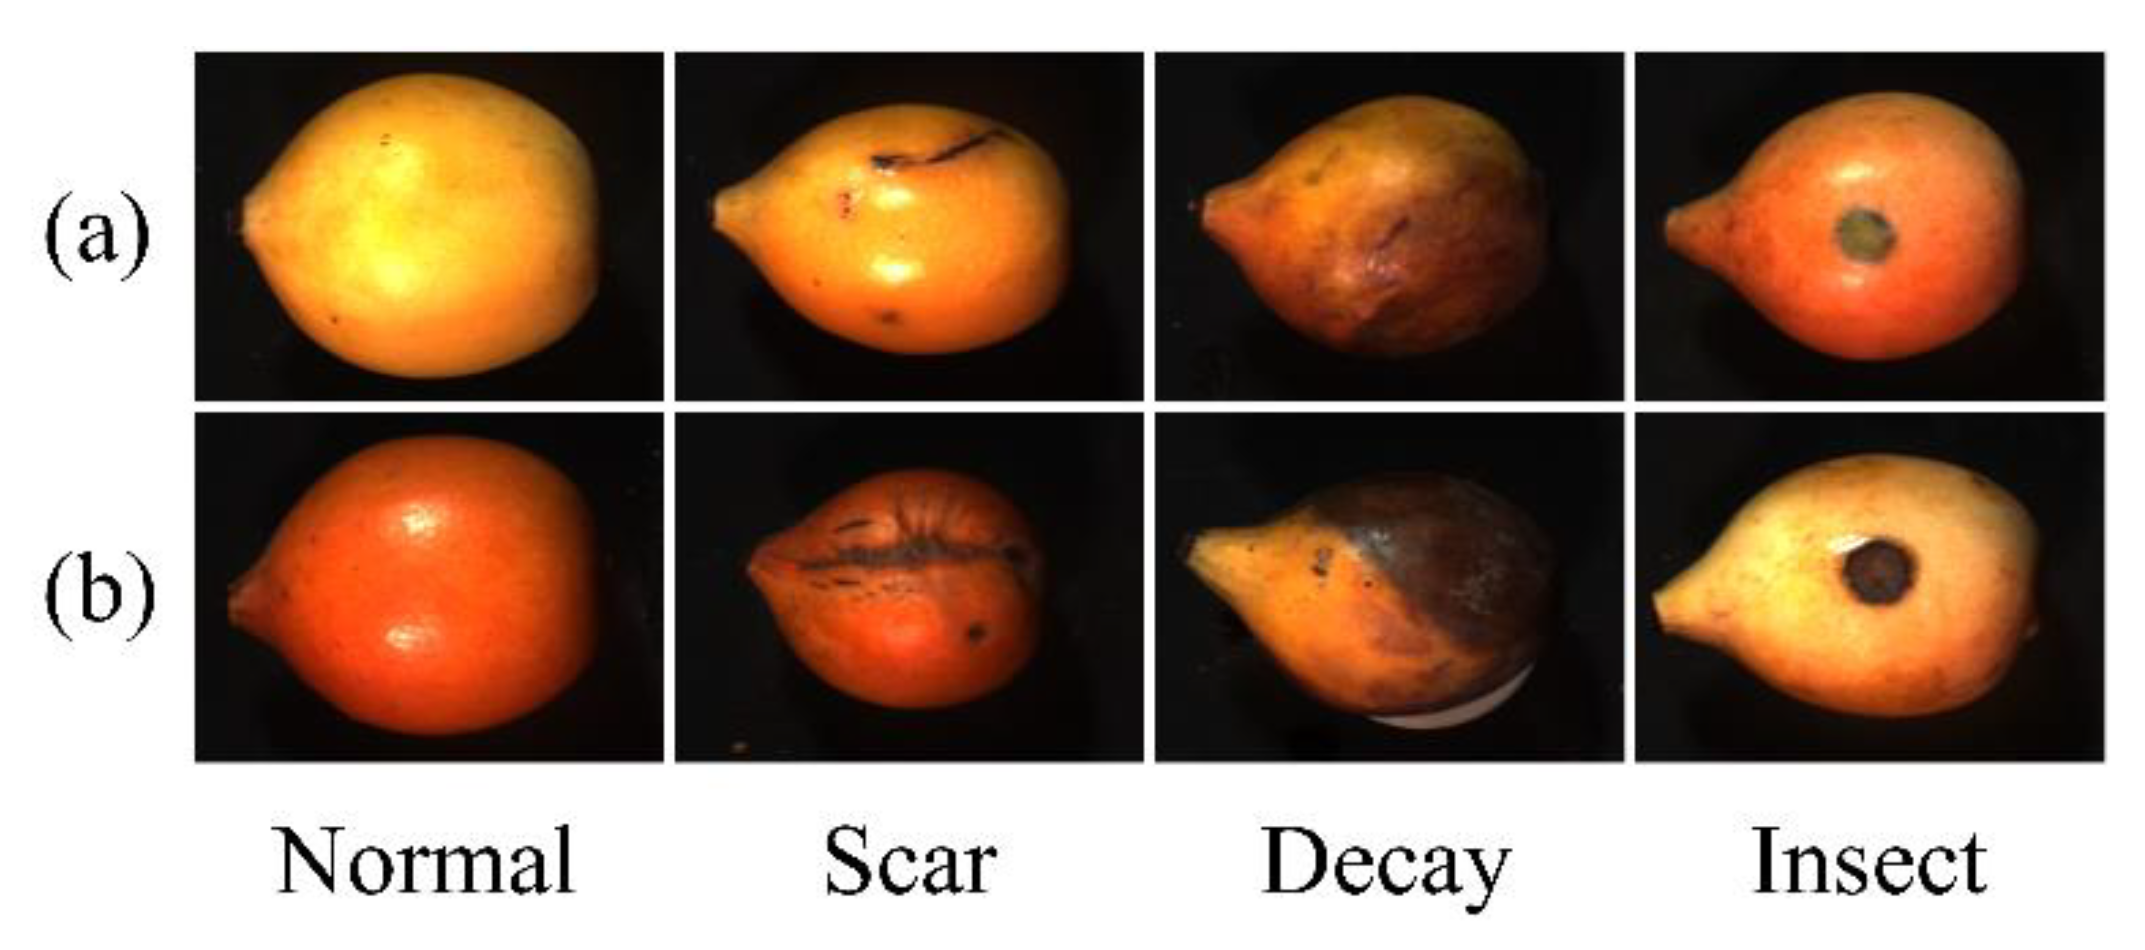
Figure 1. Pseudo RGB images of achacha samples (R: 622 nm, G: 530 nm, and B: 465 nm). (a) Samples with medium ripeness level, and (b) samples with high ripeness level.
Horticulturae 09 00869 g001
Figure 2. The averaged spectra of four skin types of achacha fruit.
Horticulturae 09 00869 g002
Figure 3. Contour plot of R2 of BR combination.
Horticulturae 09 00869 g003
Figure 4. The typical binary classification results using BR and SAM algorithms. (a) Scar and insect bite, (b) decay, (c) high ripeness level, and (d) low ripeness level.
Horticulturae 09 00869 g004
Figure 5. Typical classification results of SAM, SVM, and ANN models using full spectra. Samples with (a) scar and insect bite, (b,c) decay, and (d) highest ripeness level.
Horticulturae 09 00869 g005
Figure 6. PC images of different skin statuses of achacha fruit. (a,b) Normal, (c,d) scar, (e,f) decay, and (g,h) insect bite.
Horticulturae 09 00869 g006
Figure 7. Weighting coefficients of the first four PC components.
Horticulturae 09 00869 g007
Table 1. Confusion matrices of ANN, SVM, and SAM models using full spectral data.
ModelActualClassified as (%)Accuracy
NormalScarDecayInsect
SAMNormal85.211.33.40.158.36%
Scar6.236.117.839.9
Decay13.423.939.523.2
Insect2.510.414.572.6
SVMNormal92.83.24.0083.59%
Scar1.678.57.812.0
Decay4.811.773.79.9
Insect0.24.56.089.3
ANNNormal99.90.10099.88%
Scar099.90.10.1
Decay0.10.199.80
Insect000.1100.0
Table 2. Confusion matrices of SAM, SVM, and ANN models (using characteristic wavelengths).
ModelActualClassified as (%)Accuracy
NormalScarDecayInsect
SAMNormal76.818.93.70.651.49%
Scar10.628.116.844.5
Decay18.319.730.231.8
Insect3.78.317.270.9
SVMNormal90.85.04.00.180.76%
Scar1.174.29.814.8
Decay4.514.169.412.0
Insect0.53.57.488.5
ANNNormal98.70.80.40.196.85%
Scar0.196.50.92.5
Decay0.74.093.81.5
Insect01.10.598.4
Disclaimer/Publisher’s Note: The statements, opinions and data contained in all publications are solely those of the individual author(s) and contributor(s) and not of MDPI and/or the editor(s). MDPI and/or the editor(s) disclaim responsibility for any injury to people or property resulting from any ideas, methods, instructions or products referred to in the content.