Article

Enhanced Differentiation of Wild and Feeding Civet Coffee Using Near-Infrared Spectroscopy with Various Sample Pretreatments and Chemometric Approaches

1
Department of Food and Agricultural Product Technology, Faculty of Agricultural Technology, Gadjah Mada University, Yogyakarta 55281, Indonesia
2
Department of Analytical Chemistry, Faculty of Sciences, Agrifood Campus of International Excellence (CeiA3), Instituto de Investigación Vitivinícola y Agroalimentaria (IVAGRO), University of Cadiz, 11510 Puerto Real, Spain
3
Department of Agricultural Engineering, Faculty of Agriculture, University of Lampung, Bandar Lampung 35145, Indonesia
*
Author to whom correspondence should be addressed.
Horticulturae 2023, 9(7), 778; https://doi.org/10.3390/horticulturae9070778
Submission received: 7 June 2023 / Revised: 2 July 2023 / Accepted: 4 July 2023 / Published: 7 July 2023

Abstract

:
Civet coffee is the world’s most expensive and rarest coffee bean. Indonesia was the first country to be identified as the origin of civet coffee. First, it is produced spontaneously by collecting civet feces from coffee plantations near the forest. Due to limited stock, farmers began cultivating civets to obtain safe supplies of civet coffee. Based on this, civet coffee can be divided into two types: wild and fed. A combination of spectroscopy and chemometrics can be used to evaluate authenticity with high speed and precision. In this study, seven samples from different regions were analyzed using NIR Spectroscopy with various preparations: unroasted, roasted, unground, and ground. The spectroscopic data were combined with unsupervised exploratory methods (hierarchical cluster analysis (HCA) and principal component analysis (PCA)) and supervised classification methods (support vector machine (SVM) and random forest (RF)). The HCA results showed a trend between roasted and unroasted beans; meanwhile, the PCA showed a trend based on coffee bean regions. Combining the SVM with leave-one-out-cross-validation (LOOCV) successfully differentiated 57.14% in all sample groups (unground, ground, unroasted, unroasted–unground, and roasted–unground), 78.57% in roasted, 92.86% in roasted–ground, and 100% in unroasted–ground. However, using the Boruta filter, the accuracy increased to 89.29% for all samples, to 85.71% for unground and unroasted–unground, and 100% for roasted, unroasted–ground, and roasted–ground. Ultimately, RF successfully differentiated 100% of all grouped samples. In general, roasting and grinding the samples before analysis improved the accuracy of differentiating between wild and feeding civet coffee using NIR Spectroscopy.

1. Introduction

Civet coffee, known as the world’s most expensive and rarest coffee, was first discovered in Indonesia [1]. Civet coffee beans are eaten by civets or luwak (Paradoxurus hermaphrodites), a nocturnal cat. They are then fermented in the digestive tract and come out along with the feces. Civets will naturally choose the ripest and sweetest coffee cherries to consume. Civets eat coffee cherries by opening the pulp and eating the beans and the mucilage. Civets are unable to digest the beans, so the beans will come out intact with feces. A natural process that occurs in the civets’ stomachs changes the chemical composition of coffee beans, so they have a different taste than regular coffee beans [1,2,3,4].
Initially, civet coffee was spontaneously produced by collecting the feces of civets from coffee plantations near the forest. Due to limited stock, the farmers began feeding the civets to obtain safe supplies of civet coffee. Based on this, civet coffee is divided into two types: natural (wild) and feeding (caged) civet coffee products [5,6,7]. The small number of supplies and the complex process of collecting civets’ feces make wild civet coffee more expensive than feeding.
To protect the authenticity of wild civet coffee and consumers’ expectations of higher prices, an easy and simple analytical method is required to discriminate between wild and feeding civet coffee products. Near-infrared spectroscopy (NIRS) has been successfully applied for various purposes, particularly in coffee, such as variety discrimination, adulteration, and origin classification [2,8,9,10,11]. Spectroscopic data combined with chemometric tools can rapidly assess the authenticity of a product while providing precise analytical results. This approach has been widely used to identify and classify adulterants, ensure agricultural product quality, and evaluate different product characteristics [12,13,14,15].
Hierarchical cluster analysis (HCA) and principal component analysis (PCA) are unsupervised methods for classifying multivariate data based on similarities either among samples or variables with unknown tendencies [16]. In contrast, supervised methods, such as support vector machine (SVM) and random forest (RF), must be applied to generate predictive classification. SVM is a group of supervised learning algorithms that can build a model as initially trained [17]. RF is a bootstrapping algorithm that produces decision trees for prediction or classification. RF has extremely rapid decision tree construction, making training much faster than the training of artificial neural networks [16]. Choosing a suitable model parameter is crucial when SVM and RF are used to solve real problems because it might affect the accuracy and performance of the model [13].
NIR spectroscopic data combined with chemometric techniques have been successfully applied to the characterization of geographical and botanical origins and the quality of different coffees [10,18]. However, using non-parametric classification techniques, specific differences can be found in highly similar samples [19,20]. SVM is used to discriminate different types of coffee based on chemical or spectral features, ensuring the identification and quality control, while RF can handle different data sources and capture non-linear relationships to provide feature importance insights [18,21,22,23,24]. Hence, it is possible to use NIRS combined with chemometric techniques to differentiate between wild and feeding civet coffee. Therefore, this study aimed to determine the appropriate sample preparation process and the best chemometric tools to enhance discrimination between wild and feeding civet coffee using NIRS.

2. Materials and Methods
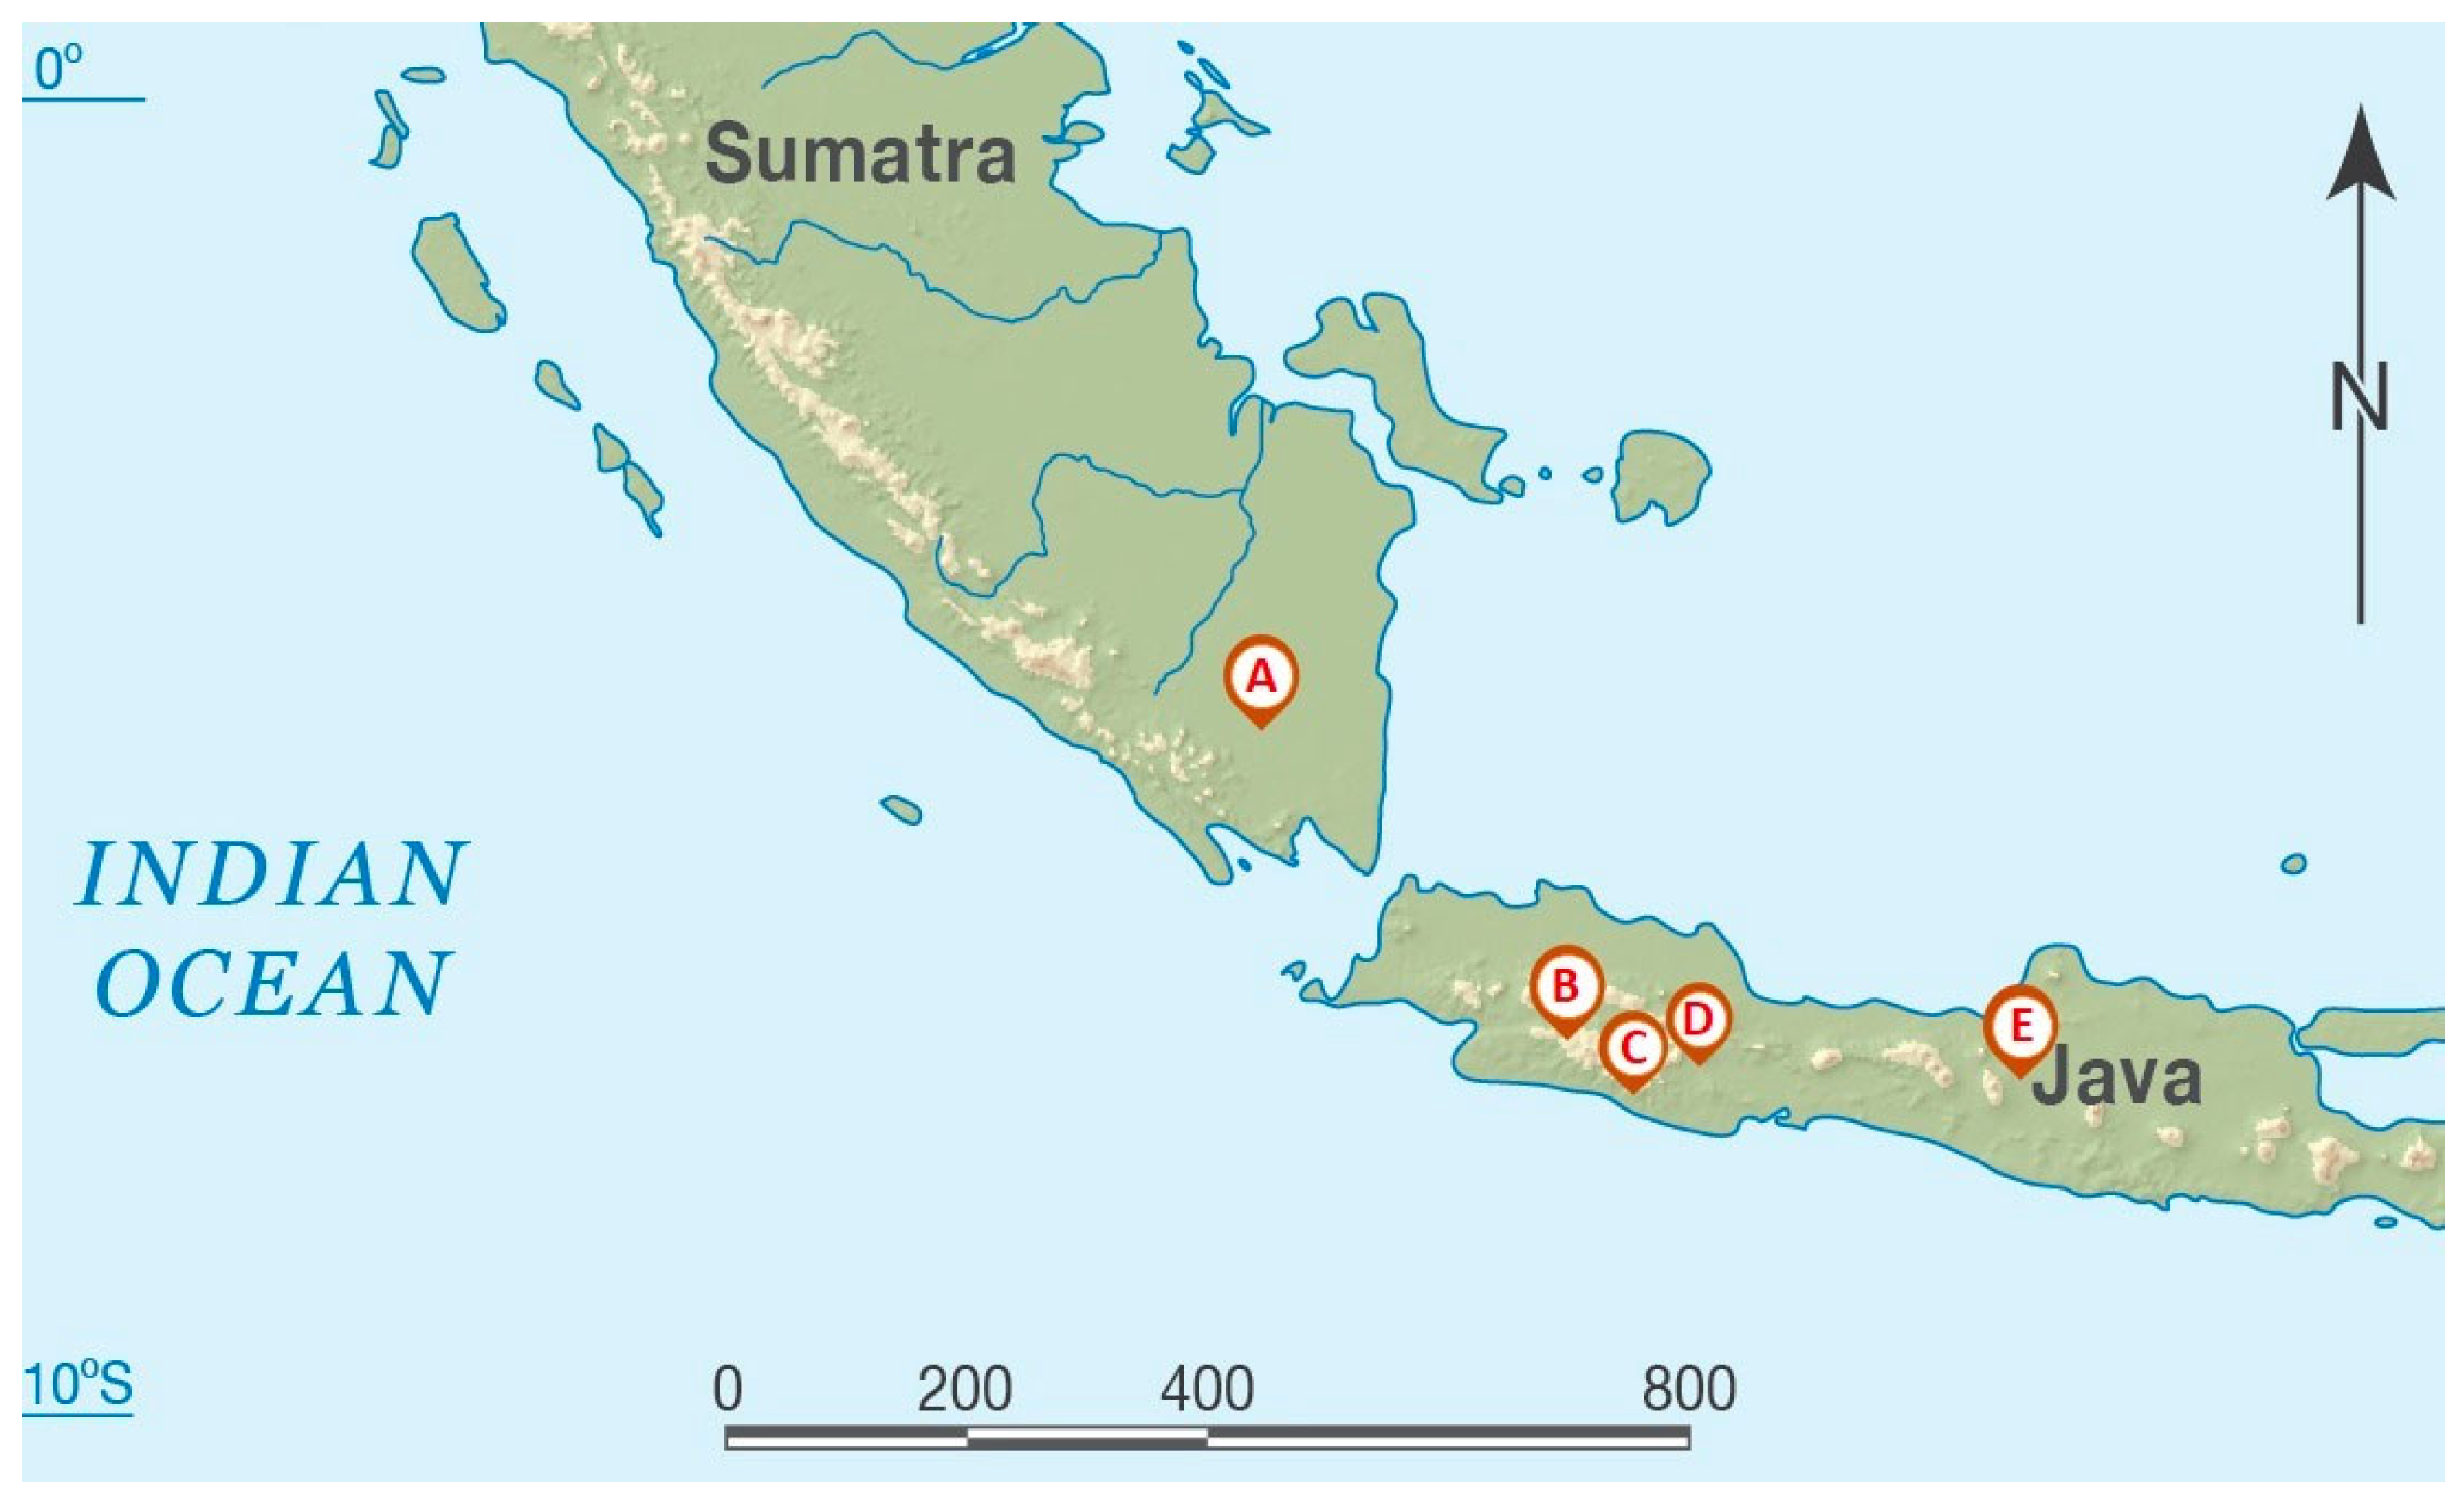
2.1. Coffee Samples

Four wild civet coffee samples and three feeding civet coffee samples were collected from five different origins (Figure 1): Lampung (Lampung), Papandayan (West Java), Halu (West Java), Cikuray (West Java), and Temanggung (Central Java), Indonesia. Coffee cherries were harvested between June and August 2021 from trees approximately 5–7 years old. All cherries then underwent a natural post-harvest process that involved drying under sunlight for 4–6 weeks until their water content reached 12–13%. Subsequently, dried cherries were hulled to remove coffee pulp and silver skin to collect green beans that were suitable for sampling.
Half of the green beans were roasted at 210 °C for ±15 min (medium roasting) using a D12 Roaster (Berto Coffee Roaster, Banten, Indonesia). Half of the green and roasted beans were ground into a 0.35 µm mesh of particle size using a Retsch ZM 200 (Fisher Scientific SL, Madrid, Spain). All samples were stored in a glass bottle with minimal headspace in a cool room (4–7 °C). The exact geographical origin and sample pre-treatment of the studied civet coffee are presented in Table 1.

2.2. NIR Spectroscopy

Vis-NIR spectra were acquired using a FOSS XDS Rapid Content Analyzer with XDS near-infrared technology (FOSS Analytical, Hilleroed, Denmark), equipped with a single light beam analyzer and a rapid solid module with spot size (d = 17.25 mm). The spectra were recorded in duplicate using dust sampling bucket vials (Figure S1) (Ø = 12 mm). The samples were scanned in a Foss XDS from 400–2500 nm, averaging 32 scans (approximately 1 min) with a resolution of 0.5 nm.

2.3. Data Analysis

No data pre-treatment was performed. All collected data were analyzed using unsupervised and supervised chemometric tools using RStudio software (R version 4.1.2, Boston, MA, USA). HCA and PCA were applied as unsupervised methods, whereas SVM and RF were applied as supervised methods. Data analysis was carried out using several packages: ggplot2 and factoextra for graphical displays, prospectr to apply the first derivative and Savitzky–Golay filter, mclust to perform model-based clustering, and caret to apply the various algorithms for classification. The Boruta algorithm was also used as a pre-treatment for the dataset. Each combination of parameter selection was examined using LOOCV to optimize these hyperparameters, and the parameters with the highest cross-validation accuracy were chosen.
Accuracy represents the percentage of experience that was accurately anticipated. Various metrics have been proposed as performance indicators. The true positive rate (TPR) is the percentage of sample labels (wild and feeding civet coffee) that the model can identify. The proportion of correctly detected samples (TP) compared to all detected samples (TP + FP) is known as the precision. The false positive rate (FPR) is the percentage of incorrectly labeled samples, such as wild civet coffee classified as feeding civet coffee or vice versa. The ideal model will strike a balance between high TPR and low FPR [21,25].
a c c u r a c y = ( T P + T N ) ( T P + T N + F P + F N )
  • TP: True Positive
  • FP: False Positive
  • TN: True Negative
  • FN: False Negative

3. Results and Discussion

The original spectra of the coffee samples are shown in Figure 2. The red line shows the signal from feeding civet coffee, while the blue line shows the signal from wild civet coffee. The spectra of feeding and wild coffee mostly overlapped because of their similarity in major chemical composition, grind size, post-harvest processing, roasting degree, and other factors. Hence, more than a simple visual analysis was required to distinguish between them. However, some data analyses must be performed to reach discrimination models, as was conducted for the discrimination among different coffee varieties or roasting degrees [26,27].
As shown in Figure 2, the coffee samples had similar spectra with slightly different intensities. A similar occurrence was previously reported when the botanical spectra of Robusta and Conilon overlapped [19], indicating that they had similar spectrochemical properties. Low-grade Robusta shows a different spectral behavior from other Robusta, demonstrating how effective bean processing can improve the quality of coffee beans. This finding reveals that feeding and wild civet coffees contain the same major compounds, and only minor differences appear in the Vis-NIR spectra owing to slight differences in their levels or different minor compounds.
Vis-NIR spectra, encompassing both the visible and near-infrared ranges, play a crucial role in analyzing the chemical composition of substances. These spectra were defined by absorption bands arising from the vibrations of different chemical bonds [10]. The visible range spans from 400 to 750 nm, whereas the NIR range extends from 750 to 2500 nm. This spectroscopic region is invaluable for assessing compounds predominantly consisting of C-H, S-H, O-H, and N-H bonds, which are closely associated with numerous organic chemical constituents found in coffee, including carbohydrates, lipids, caffeine, chlorogenic acid derivatives, and proteins. The absorption bands corresponding to these bonds provide valuable information about the presence and concentration of these organic components in coffee samples [10,26,28].
Examining Vis-NIR spectra can provide more information about the chemical composition of coffee and its organic components. These data are useful for quality assurance, confirming the legitimacy of coffee samples, and analyzing the general composition and traits of various coffee types. A quick and accurate evaluation of the chemical makeup of coffee samples is made possible by the nondestructive and effective Vis-NIR spectroscopy method [23,26].
The red line shows higher absorption at 450–550 nm. This result indicates that feeding civet coffee is darker than wild civet coffee. In contrast, in the range of 1400–2500 nm, the blue line generally exhibits higher absorbance than the red line, indicating that wild civet coffee contains higher levels of chemical components than feeding civet coffee. These observations highlight the need for quantitative analysis and data modeling techniques to effectively discriminate between feeding and wild civet coffee, based on their Vis-NIR spectra. By employing appropriate data analysis methods, it is possible to uncover subtle variations and establish classification models that leverage the unique spectral characteristics of different coffee types.

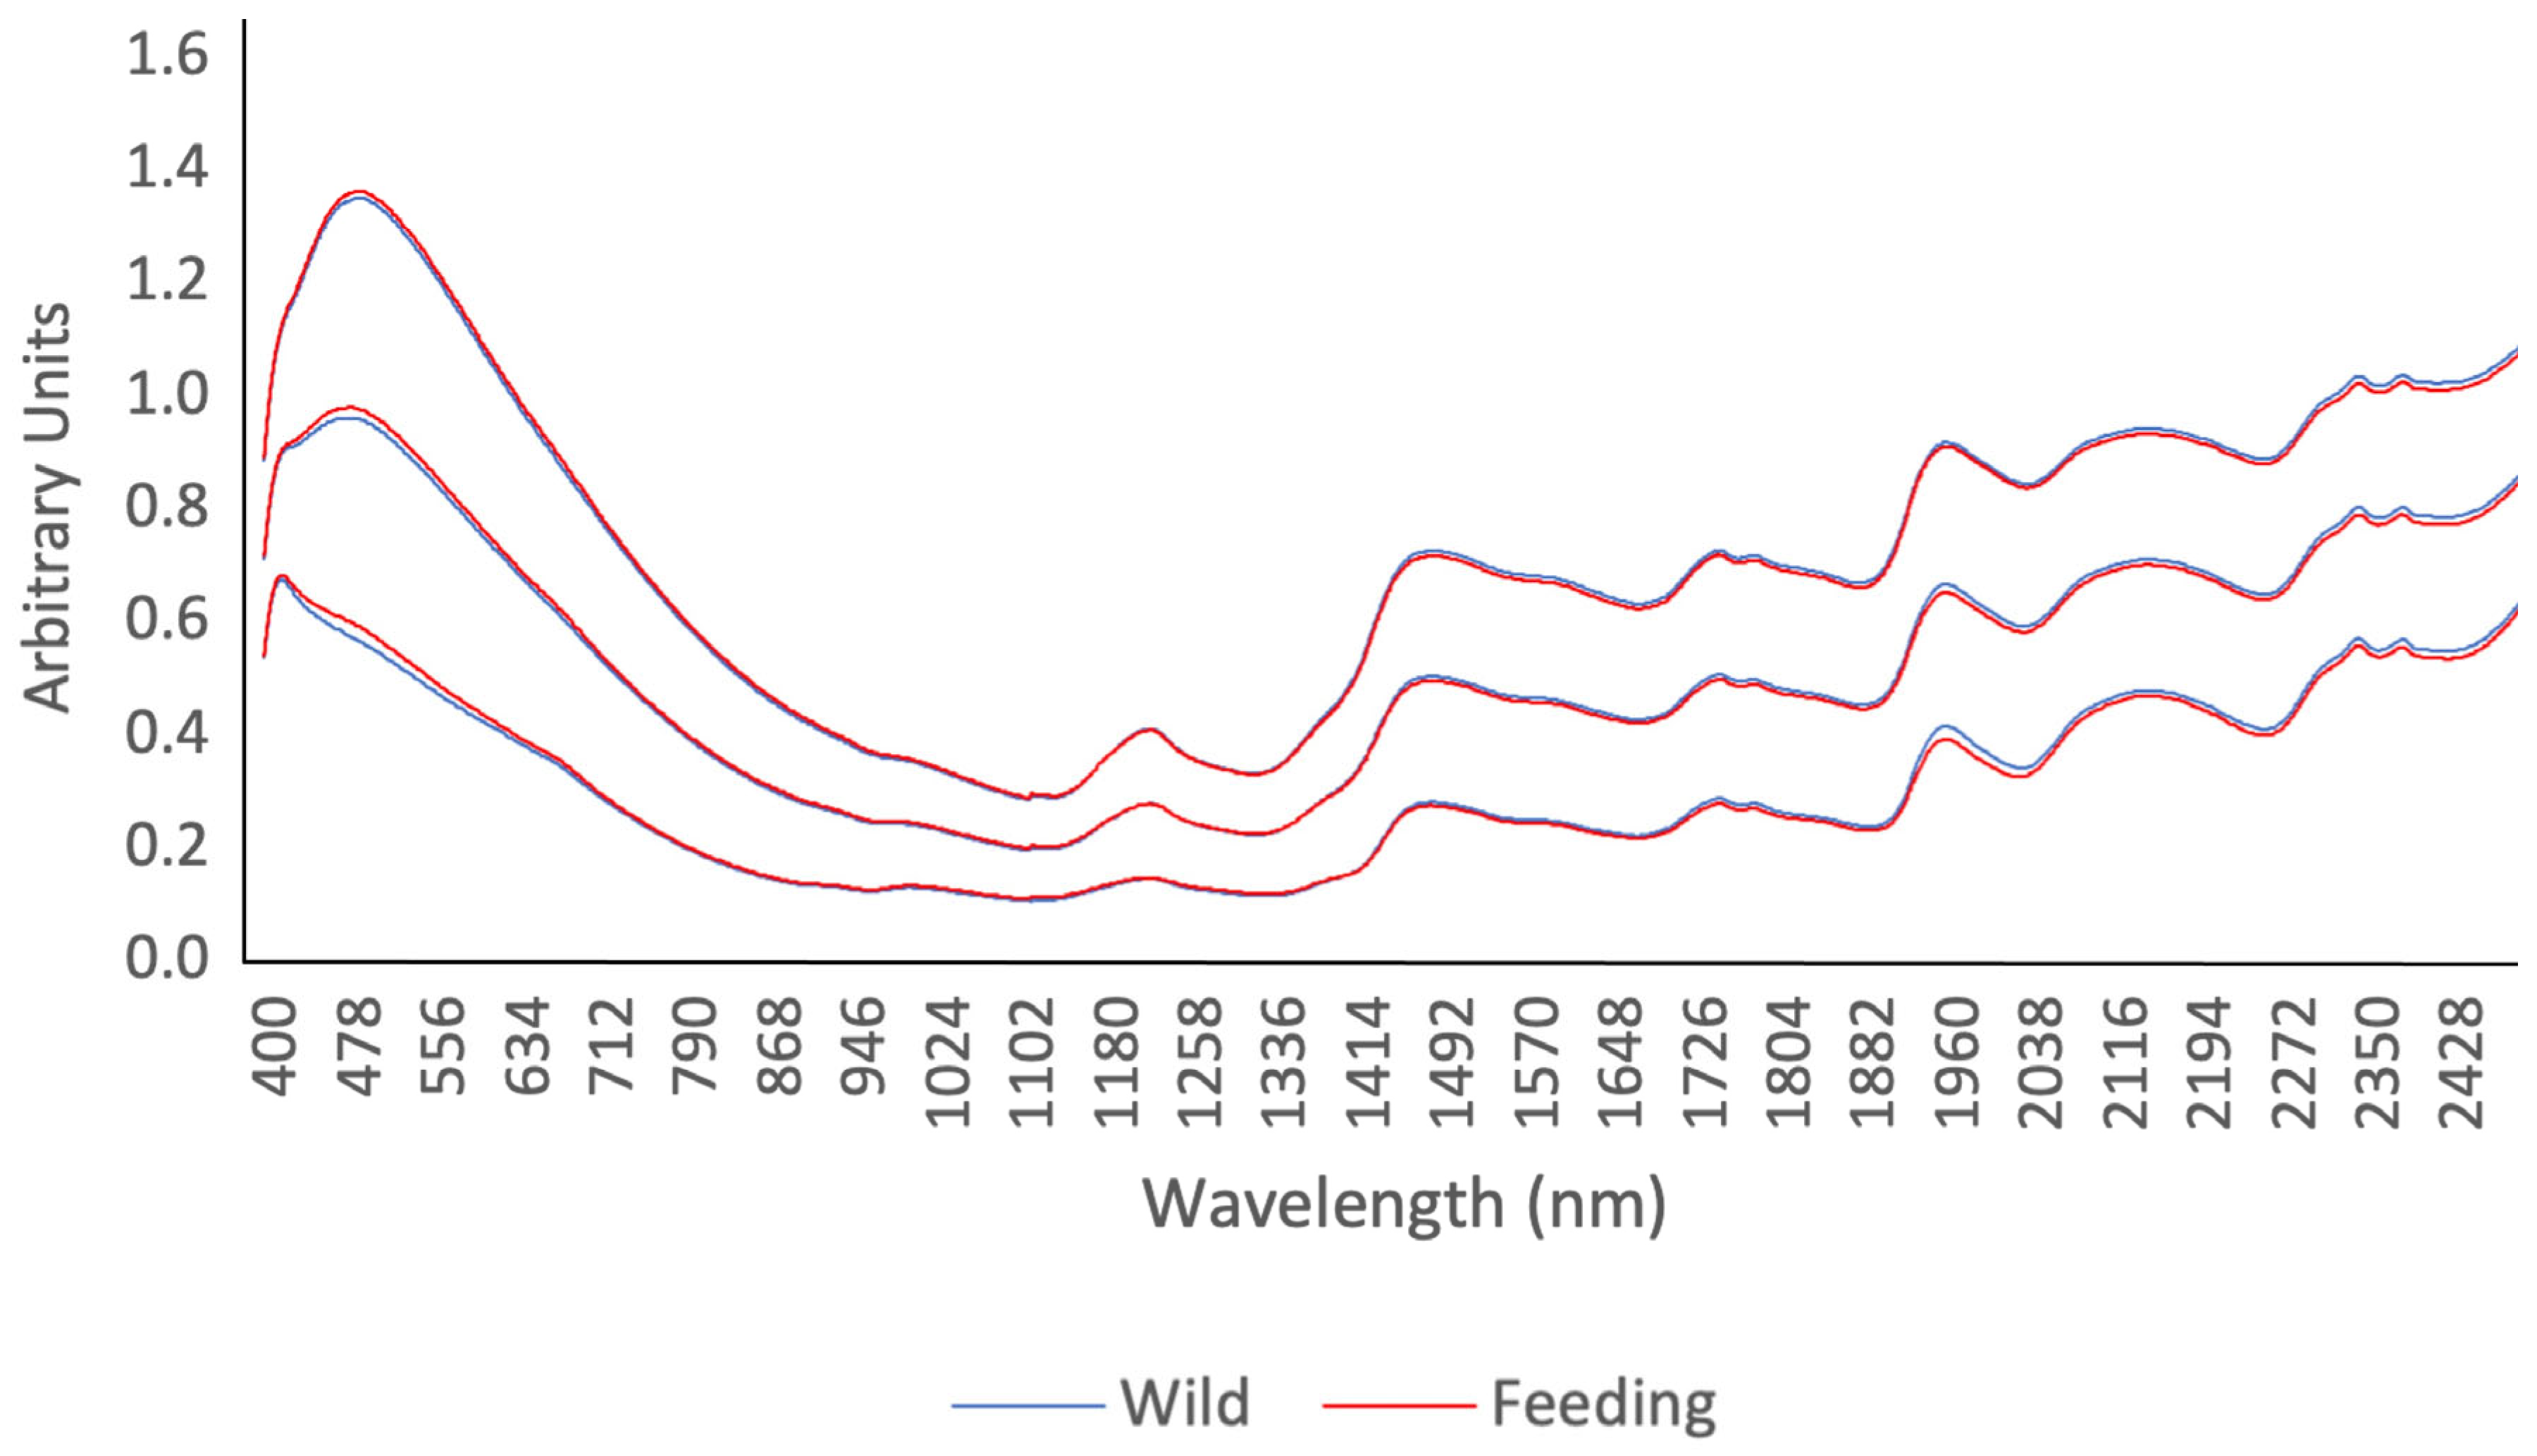
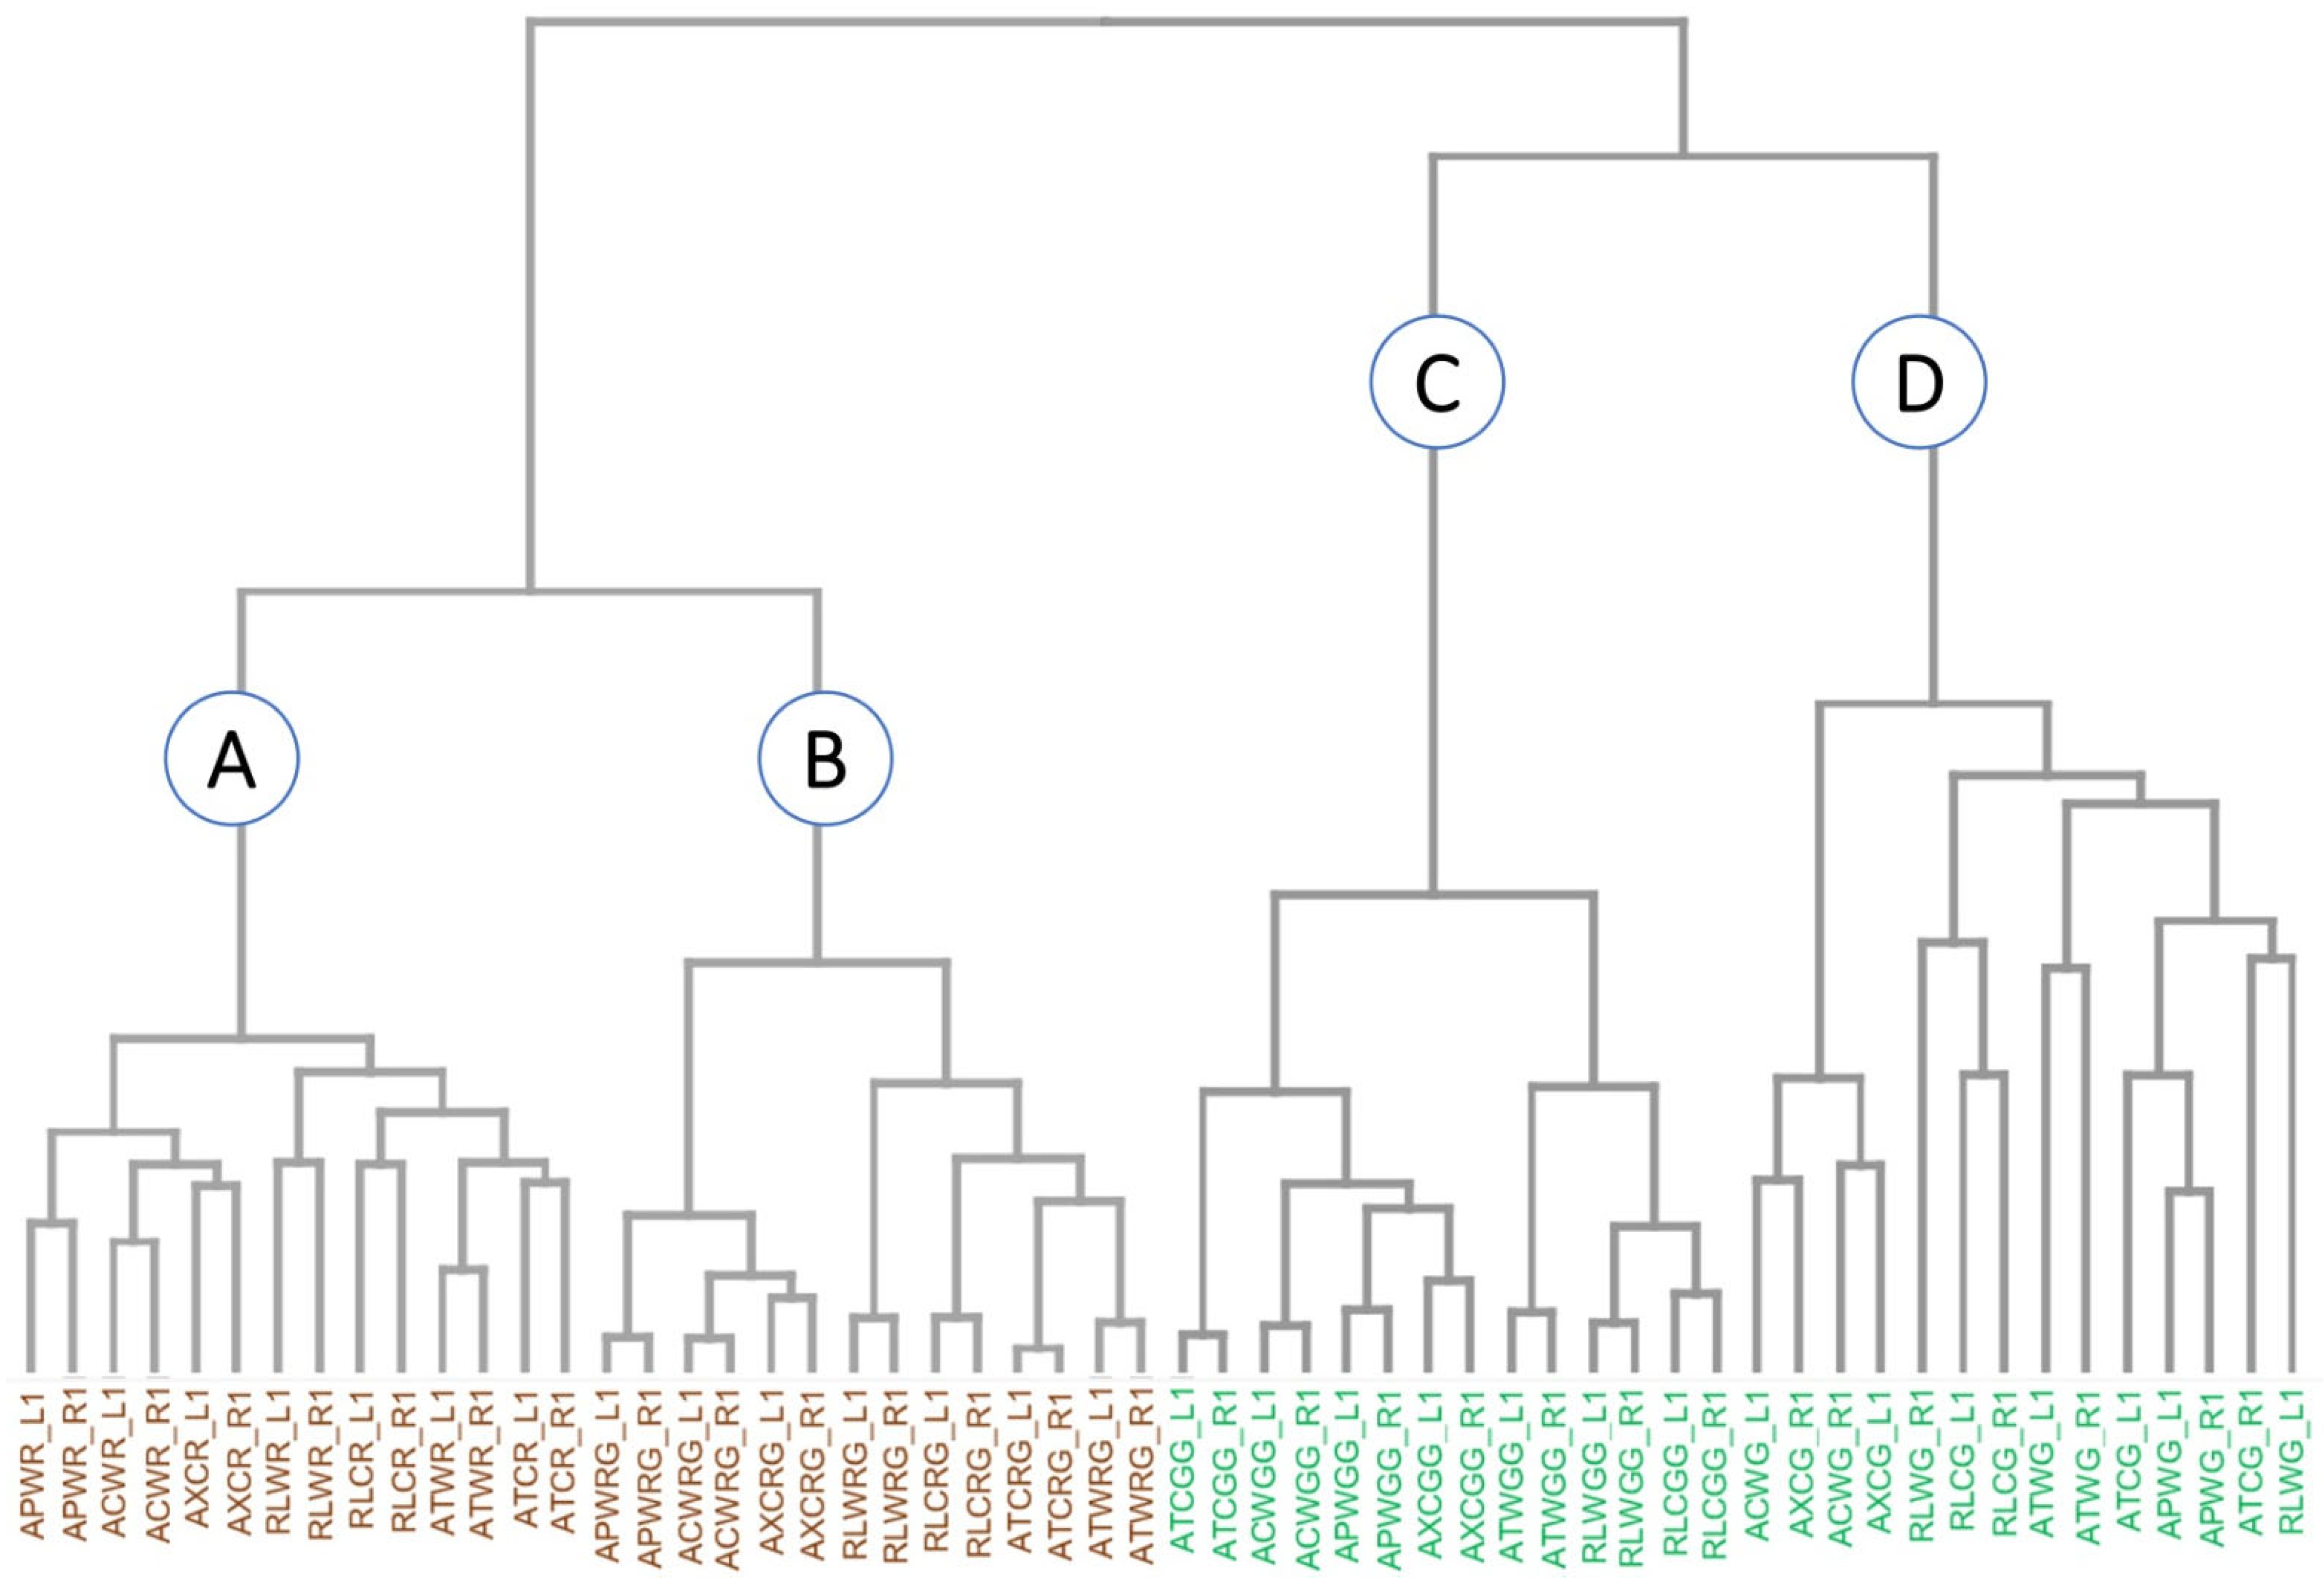
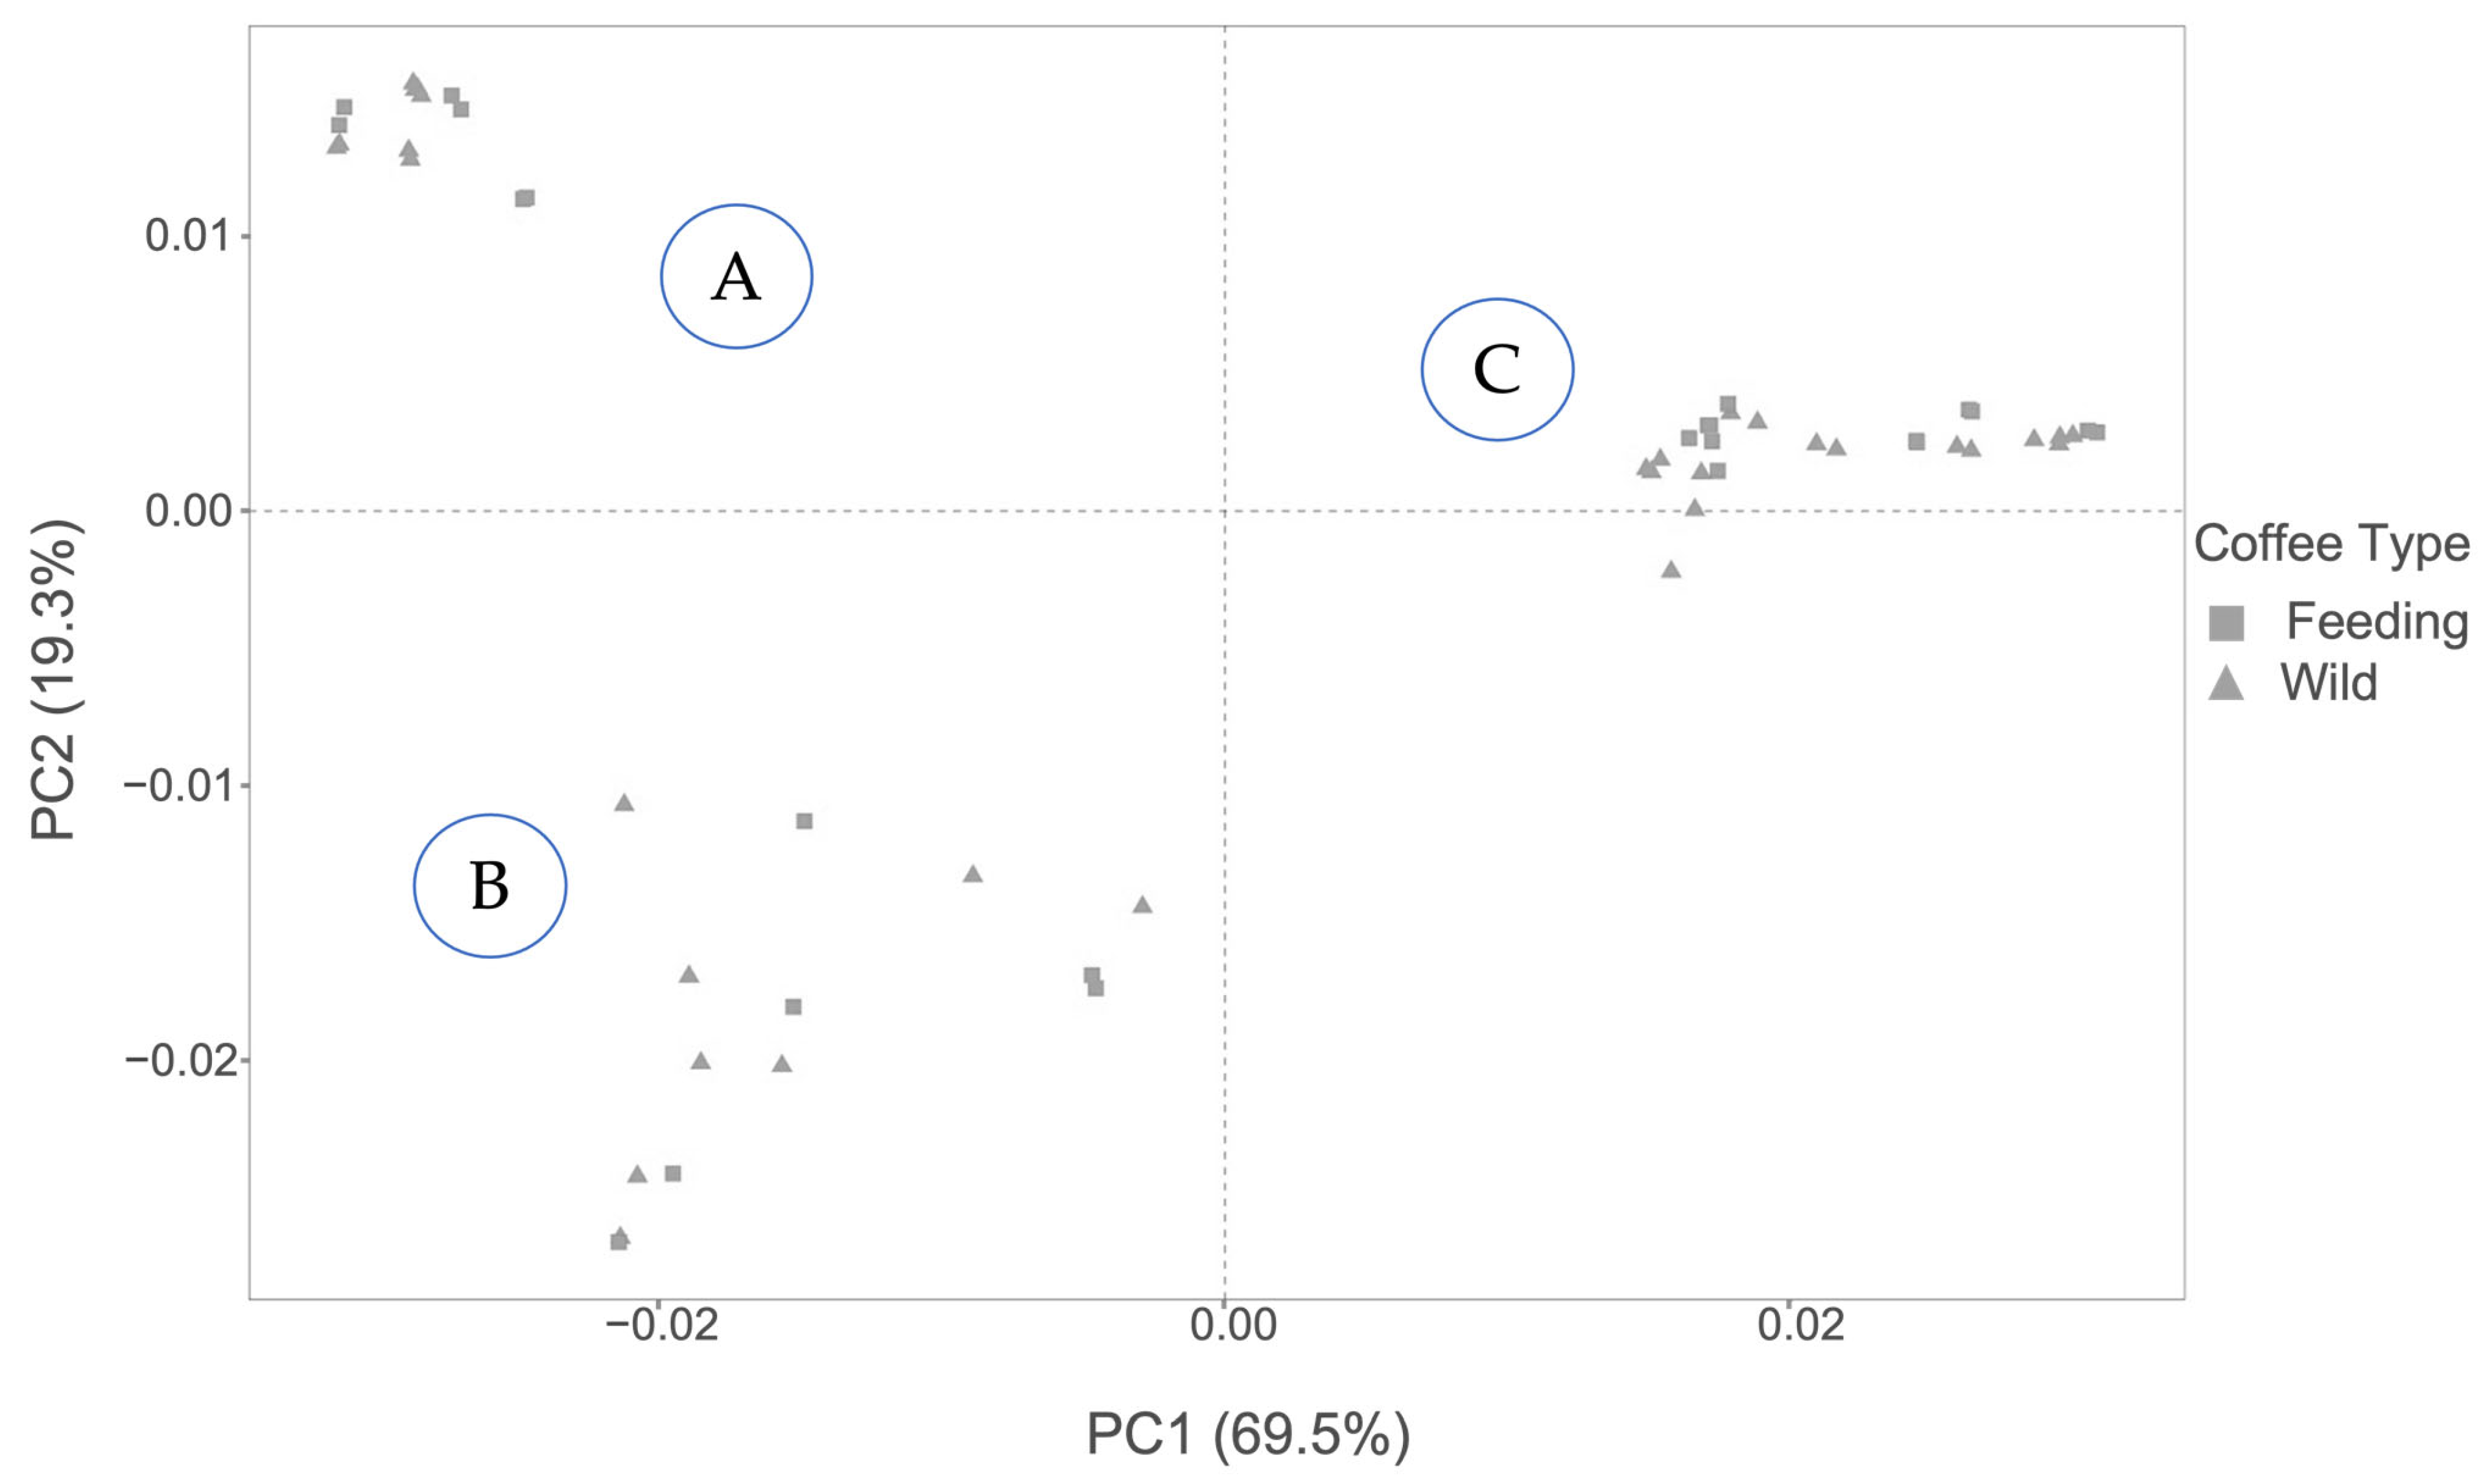
3.1. Exploratory Analysis (Unsupervised Method: HCA and PCA)

The original spectra were modified for baseline variations using a Savitzky–Golay filter to generate a second-order derivative. This preprocessing step enhances the spectral features and removes any unwanted baseline effects, allowing for a more accurate analysis of the Vis-NIR spectra. To explore and identify the differences among the Vis-NIR spectra, an unsupervised pattern recognition approach was employed. Two commonly used techniques, hierarchical cluster analysis (HCA) and principal component analysis (PCA), were used in this investigation [11,29].
Full cross-validation was used during the HCA and PCA processes to provide robust and reliable results. By applying HCA and PCA to the modified spectra, it becomes possible to uncover hidden patterns, groupings, or clusters based on Vis-NIR data. Clustering plays a crucial role in unsupervised machine learning as it helps uncover underlying patterns or structures in a dataset without any prior knowledge or labelled examples. These techniques serve as exploratory tools that pave the way for further analysis and subsequent classification tasks [30,31]. In the context of the analysis of wild and feeding civet coffee samples, HCA was employed to create a hierarchical classification based on the similarity of the spectral data.
HCA aims to organize samples into a hierarchy of clusters, where each cluster contains objects that are similar to each other and dissimilar to objects in other clusters. The process starts with individual samples being treated as separate clusters and progressively merging them based on their similarity, forming a dendrogram that depicts the hierarchical relationships among the clusters. The hierarchical nature of the classification allows for different levels of granularity, with smaller clusters nested within larger ones, providing a comprehensive view of the data’s structure [12,32]. A hierarchical classification for wild and feeding civet coffee samples was created based on the similarity of the spectral data of the samples within a cluster (Figure 3).
Several linkage methods can be employed in HCA to determine the similarities or dissimilarities between clusters or individual samples. One common measure used is the Canberra distance, which considers the differences between feature values across samples. To assess the quality of the clustering structure generated by HCA, the agglomerative coefficients were calculated. It can measure how well samples or clusters are grouped together based on their similarities. A value closer to 1 indicates a more solid clustering structure, with samples in the same cluster highly similar to each other.
In this analysis, the inter-individual similarity matrix was calculated using Canberra distance, which captures the dissimilarity between pairs of samples. The inter-group measure, on the other hand, was determined using the average method, which calculates the average dissimilarity between samples across clusters. By comparing the agglomerative coefficients obtained from various linkage methods (such as single, complete, average, ward, and centroid), it was found that the average method produced the highest coefficients, with a value of 0.9591.
This finding shows that the clustering structure of the average linkage method was relatively strong, demonstrating well-defined and unique clusters within the wild and feeding civet coffee samples. The high agglomerative coefficients of the average linkage method support the idea that the samples within each cluster have a great deal in common and can be categorized as separate groups. This also implies that the average linkage approach successfully reflects the underlying structure and patterns found in the spectrum data of wild and feeding civet coffee samples. This provides confidence in the clustering results derived through HCA.
The resulting dendrogram (Figure 3) shows a clear trend of the samples being classified according to their physical appearance. The main clusters identified in the dendrogram correspond to the distinction between green, unroasted, and roasted beans. This classification is in line with the expected trend, as roasting significantly alters the chemical and physical properties of coffee beans. Within each main cluster, further subgroups were observed based on the processing state of the beans. Cluster A and D represent the sub-groups of whole or unground beans, while clusters B and C correspond to the sub-group of ground beans. This division indicates the different forms in which coffee is commonly consumed, with whole beans typically used for grinding and brewing, whereas ground beans are directly used for making coffee. In any case, HCA cannot differentiate between wild and feeding civet coffee.
Previous research has highlighted the specific wavelength ranges associated with the moisture content and chemical bonds present in unroasted and roasted coffee. For example, wavelengths around 980, 1200, and 1450 nm have been associated with higher moisture content in unroasted coffee, while wavelengths around 1200 nm, 1360 nm, and 1450 nm are characteristic of roasted coffee. However, these specific features related to wild and feeding civet coffee were not captured by HCA in this study [23].
Another interesting observation from the dendrogram is the clustering pattern within the lower group, which indicates similarities based on geographical factors. Coffee samples from Arabica farms located in Papandayan, Cikuray, and Halu, all situated in West Java, with altitudes ranging from 1500 to 2000 m.a.s.l., tend to cluster together. Similarly, Arabica samples from Temanggung and Robusta samples from Lampung, both grown at lower altitudes ranging from 600 to 1200 m.a.s.l., also form a distinct cluster. This result suggests that altitude and geographical proximity have contributed to the similarities observed in the spectral characteristics of these coffee samples.
The HCA successfully classified coffee samples based on their physical attributes, such as color and size and, to some extent, geographical factors. However, it did not differentiate between wild and feeding civet coffee. Hence, another unsupervised pattern recognition approach, viz., PCA, was applied to further explore and identify the differences among the Vis-NIR spectra.
PCA is a powerful multivariate method used to analyze datasets with multiple correlated variables. Its primary objective is to reduce the dimensionality of the dataset by transforming the original variables into a new set of variables known as principal components (PCs). These PCs are linear combinations of the original variables and are chosen such that they capture the maximum amount of variance present in the data [33]. The PCA results for the wild and feeding civet coffee samples are shown in Figure 4. PCA was performed to explore the relationships and patterns within the dataset.
Figure 4 shows the scatter plot obtained from the PCA analysis. The plot was divided into three groups: A is a group of samples that were not roasted but ground (unroasted–ground); B is a group of samples that were not roasted and not ground (unroasted–unground); and C is a group of samples that were roasted (roasted–ground and roasted–unground). PC 1 explained a significant portion of the variance in the dataset, accounting for 69.5% of the data. PC 1 played a crucial role in grouping the samples based on color. It distinguished between unroasted samples, characterized by their green color, and roasted samples, which exhibited a dark brown color. Therefore, PC 1 effectively captured the main source of variation related to the roasting process and its influence on the color of coffee samples. PCA successfully revealed the major patterns in the dataset related to roasting and grinding processes. The distinct separation of the unroasted–ground, unroasted–unground, and roasted samples suggests that PCA can effectively discriminate between the different processing conditions based on their spectral characteristics. It is important to note that PCA does not explicitly consider the classification of wild and feeding civet coffee.
There are three critical factors in NIRS: the particle size, moisture content, and temperature of the samples. Diffuse reflectance and transmittance result from a combination of tool shape, sample size, sample shape, and sample distribution [34]. Samples with large particles cannot spread as much radiation as they are absorbed [35]. This limitation can lead to differences in the spectra and affect the accuracy of the analysis, which caused the formation of groups A and B. Moreover, the moisture content of the sample affected the NIRS results, which caused the formation of group C, which was roasted beans that consisted of lower moisture content and experienced a significant thermic process, thereby altering the chemical and physical characteristics [23]. The temperature of the samples can also influence the NIRS results. Roasted beans, for example, undergo significant thermal processing, resulting in chemical and physical changes compared with unroasted beans. These changes can affect the spectral characteristics and contribute to the formation of different groups during the analysis.
Given the results of HCA and PCA, it is necessary to apply multivariate techniques, including supervised pattern recognition algorithms, to attempt to reach an accurate classification and guarantee the generation of a mathematical model that may be used to make predictions in the future. Two supervised classification methods, SVM and RF, were applied and compared to predict the type of civet coffee (wild or feeding) based on NIRS data. The accuracy metric was used to assess the created SVM and RF models, which measured the proportion of correct predictions for all input data.

3.2. Multivariate Techniques (Supervised Method: SVM and RF)

SVM is a supervised technique frequently used to categorize data into multiple groups. This is based on the concept of a hyperplane. The fundamental goal of SVM is to separate the classes with a minimum classification error by identifying the best hyperplane (boundary) that optimizes the margin between the support vectors (data points nearest to the hyperplane). SVM is typically used with datasets in which the response variables can be linearly separated [13,21]. For this purpose, each dataset was randomly divided into 70% of the training set and 30% of the test set.
To optimize these hyperparameters, each combination of parameter choices was checked by leave-one-out cross-validation (LOOCV), and the parameters with the best cross-validation accuracy were selected. LOOCV involves systematically excluding one sample from the training set, training the model on the remaining samples, and testing the performance of the model on the left-out sample. This process was repeated for each sample in the dataset, and the hyperparameters that yielded the best cross-validation accuracy were selected [23,25]. LOOCV is particularly suitable when working with a small number of samples, because it maximizes the utilization of the available data for training and validation. In such cases, LOOCV often outperforms other cross-validation techniques, such as five-fold cross-validation, which may lead to higher variance owing to the limited sample size. The performance of SVM for each group of samples is presented in Table 2. The data results with all samples showed a very low accuracy (57%). This lower accuracy can be attributed to the inclusion of numerous variables in the experiment, such as roasting and grinding. Therefore, the samples were further divided into smaller groups, i.e., unground and ground samples, to enhance the accuracy. However, the new group still needed higher accuracy (57%), as the unroasted and roasted samples were still in the same group. The accuracy of unroasted beans (57%) was lower than that of roasted beans (79%) because the color similarity of the beans after roasting was more homogeneous than that of unroasted beans. In addition, the difference in particle size (ground and whole beans) also affected the level of accuracy. The accuracy of unroasted–unground (57%), roasted–unground (57%), unroasted–ground (100%), and roasted–ground (93%) varied.
The accuracy of whole beans was lower than that of the ground. This disparity can be explained by the presence of a significant amount of empty space in vials containing whole beans, leading to biased NIR results. In contrast, the ground bean samples exhibited a more homogeneous and flatter surface, enabling better coverage within the vial and yielding more accurate NIR readings. The unroasted ground beans provided a higher accuracy than the roasted ground beans. The roasted samples contained silver parts in the skin, which contributed to the inhomogeneous ground sample. Different cases were observed for the whole bean samples, where green and roasted beans were inhomogeneous in color due to uneven fermentation.
The accuracy of the SVM classification model varied depending on the specific groups and characteristics of the coffee samples, such as the degree of roasting, particle size, and color homogeneity. These factors influence the accuracy and highlight the importance of carefully considering sample attributes when developing classification models.
The Boruta filter is a wrapper for selecting all essential features. The important features are estimated by comparing the importance of the original attribute with the importance achieved at random, performed using permutations [23,26]. Based on the data analysis, Boruta provided better results in all groups except ground and unroasted. This indicates that variable importance was not observed in these groups. High accuracy was achieved for all samples (96%), unground (89%), and unroasted–unground (86%); moreover, roasted, roasted-unground, unroasted–ground, and roasted–ground reached 100% accuracy. According to the explanation above, the most suitable sample to classify wild and feeding civet coffee using NIR spectrophotometry combined with the SVM method was, therefore, roasted and ground beans.
These findings highlight the significance of selecting appropriate features and considering the specific characteristics of samples when developing classification models. By leveraging the Boruta filter and SVM algorithm, this study successfully identified the key features and achieved high accuracy in distinguishing between wild and feeding civet coffee samples. Because the SVM algorithm design prevents the selection of the most relevant features for the model’s construction, a different non-parametric technique known as RF was used to examine the variables that might define the distinctions between wild and feeding civet coffee samples for classification.
RF is a nonparametric supervised method frequently used for regression and classification tasks. The RF model consists of numerous independent decision trees trained using various randomly generated training sets produced by bootstrapping (sampling with replacement). Each tree develops from a bootstrap sample obtained with replacement from the original data, which means that two-thirds of the original data, also known as “inside the bag” data, are used for training, and one-third of the original data, also known as “out of the bag” (OOB) data, is used to make the final prediction. Therefore, a cross-validation approach of these OOB instances can be utilized to calculate an unbiased generalization error to assess the model performance [14,15,25].
The RF algorithm operates by aggregating the predictions of multiple decision trees, utilizing techniques such as averaging (for regression tasks) or voting (for classification tasks), to make the final prediction. This ensemble approach enhances the model’s stability and robustness, allowing it to handle complex relationships and improve overall prediction accuracy. RF offers several advantages, including its ability to handle high-dimensional data, deal with missing values, and capture nonlinear relationships between variables. Additionally, the RF algorithm is less prone to overfitting compared to individual decision trees, making it a reliable and widely used approach in various domains [27,36].
The performance of the RF for each group of samples is presented in Table 2. The data showed that all groups had 100% accuracy, including all samples, unground, ground, unroasted, roasted, unroasted–unground, roasted–unground, unroasted–ground, and roasted–ground. For the Boruta filter, important variables were not generated for ground and unroasted; therefore, the system was unable to calculate the accuracy. However, high accuracy (100%) was achieved for all samples, unground, roasted, unroasted–unground, unroasted–ground, roasted–unground, and roasted–ground. Based on these results, it can be concluded that NIR spectrophotometry combined with the RF algorithm is an effective and reliable method for classifying wild and feeding civet coffee samples. The high accuracy achieved across various groups of samples demonstrated the robustness and suitability of this approach for distinguishing between the two types of civet coffee.

4. Conclusions

A combination of NIR spectrophotometry and chemometric techniques facilitates the analysis of civet coffee samples, enabling discrimination among different production processes, including those involving wild and feeding civets. For the SVM method, 100% accuracy was achieved when the samples were roasted and ground, and the Boruta filter was applied, as shown for the SVM green ground, SVM Boruta roasted, roasted beans, green ground, and roasted ground. This finding indicates that the physical state of the sample influences the discrimination capability of the method. In contrast, the RF method required no special treatment of the samples. RF shows 100% accuracy for unroasted, roasted, unground, ground, or a combination of these sample variables. As it consistently performs well across various sample conditions without the need for preprocessing methods, it can be concluded that the RF approach for differentiating wild and civet coffees provides reliable predictions. Therefore, the new method, which utilizes machine learning tools applied to spectroscopic data, allows for the discrimination between wild and civet coffees.

Supplementary Materials

The following supporting information can be downloaded at: https://www.mdpi.com/article/10.3390/horticulturae9070778/s1, Figure S1: Dust sampling bucket vials.

Author Contributions

Conceptualization, W.S., D.P. and M.P.; methodology, M.P. and D.S.; software, J.L.P.C.; validation, M.P., J.L.P.C. and D.S.; formal analysis, D.P.; investigation, D.P., M.Á. and M.B.-S.; resources, M.P. and D.S.; data curation, M.Á., M.B.-S. and J.L.P.C.; writing—original draft preparation, D.P.; writing—review and editing, W.S., D.S. and M.P.; visualization, D.P. and W.S.; supervision, W.S. and M.P.; project administration, W.S.; funding acquisition, W.S. All authors have read and agreed to the published version of the manuscript.

Funding

The APC was supported by Universitas Gadjah Mada through the Final Project Recognition Grant (Rekognisi Tugas Akhir, RTA) 2023 with assignment number 5075/UN1.P.II/Dit-Lit/PT.01.01/2023.

Data Availability Statement

The data presented in this study are contained within the article.

Acknowledgments

The authors are grateful to the Instituto de Investigación Vitivinícola y Agroalimentaria (IVAGRO) for providing the necessary support to complete the research.

Conflicts of Interest

The authors declare no conflict of interest.

References

  1. Muzaifa, M.; Hasni, D.; Febriani; Patria, A.; Abubakar, A. Chemical composition of green and roasted coffee bean of Gayo arabica civet coffee (kopi luwak). In IOP Conference Series: Earth and Environmental Science, Proceedings of the 1st International Conference on Agriculture and Bioindustry 2019, Banda Aceh, Indonesia, 24–26 October 2019; Institute of Physics Publishing: Bristol, UK, 2020. [Google Scholar] [CrossRef]
  2. Suhandy, D.; Yulia, M. The Use of Partial Least Square Regression and Spectral Data in UV-Visible Region for Quantification of Adulteration in Indonesian Palm Civet Coffee. Int. J. Food Sci. 2017, 2017, 6274178. [Google Scholar] [CrossRef]
  3. Sunarharum, W.B.; Williams, D.J.; Smyth, H.E. Complexity of coffee flavor: A compositional and sensory perspective. Food Res. Int. 2014, 62, 315–325. [Google Scholar] [CrossRef]
  4. Ifmalinda, I.; Setiasih, I.S.; Muhaemin, M.; Nurjanah, S. Chemical Characteristics Comparison of Palm Civet Coffee (kopi luwak) and Arabica Coffee Beans. J. Appl. Agric. Sci. Technol. 2019, 3, 280–288. [Google Scholar] [CrossRef]
  5. Muzaifa, M.; Hasni, D.; Rahmi, F.; Syarifudin. What is kopi luwak? A literature review on production, quality and problems. In IOP Conference Series: Earth and Environmental Science, Proceedings of the International Conference on Agricultural Technology, Engineering and Environmental Sciences, Banda Aceh, Indonesia, 21–22 August 2019; Institute of Physics Publishing: Bristol, UK, 2019. [Google Scholar] [CrossRef]
  6. Muzaifa, M.; Hasni, D.; Yunita, D.; Febriani; Patria, A.; Abubakar, A. Amino acid and sensory profile of Kopi Luwak (Civet Coffee). In IOP Conference Series: Materials Science and Engineering, Proceedings of the 8th Annual International Conference (AIC) 2018 on Science and Engineering, Aceh, Indonesia, 12–14 September 2018; Institute of Physics Publishing: Bristol, UK, 2019. [Google Scholar] [CrossRef]
  7. Lachenmeier, D.W.; Schwarz, S. Digested civet coffee beans (Kopi luwak)—An unfortunate trend in specialty coffee caused by mislabeling of coffea liberica? Foods 2021, 10, 1329. [Google Scholar] [CrossRef]
  8. De Carvalho Couto, C.; Freitas-Silva, O.; Morais Oliveira, E.M.; Sousa, C.; Casal, S. Near-infrared spectroscopy applied to the detection of multiple adulterants in roasted and ground arabica coffee. Foods 2022, 11, 61. [Google Scholar] [CrossRef]
  9. Suhandy, D.; Yulia, M. Authentication of Six Indonesian Ground Roasted Specialty Coffees according to Variety and Geographical Origin using NIR Spectroscopy with Integrating Sphere. In IOP Conference Series: Earth and Environmental Science, Proceedings of the International Conference on Science, Infrastructure Technology and Regional Development, South Lampung, Indonesia, 23–25 October 2020; IOP Publishing Ltd.: Bristol, UK, 2021. [Google Scholar] [CrossRef]
  10. Giraudo, A.; Grassi, S.; Savorani, F.; Gavoci, G.; Casiraghi, E.; Geobaldo, F. Determination of the geographical origin of green coffee beans using NIR spectroscopy and multivariate data analysis. Food Control 2019, 99, 137–145. [Google Scholar] [CrossRef]
  11. Manuel, M.N.B.; da Silva, A.C.; Lopes, G.S.; Ribeiro, L.P.D. One-class classification of special agroforestry Brazilian coffee using NIR spectrometry and chemometric tools. Food Chem. 2022, 366, 130480. [Google Scholar] [CrossRef]
  12. Aliaño-González, M.J.; Ferreiro-González, M.; Espada-Bellido, E.; Palma, M.; Barbero, G.F. A screening method based on Visible-NIR spectroscopy for the identification and quantification of different adulterants in high-quality honey. Talanta 2019, 203, 235–241. [Google Scholar] [CrossRef] [PubMed]
  13. Barea-Sepúlveda, M.; Ferreiro-González, M.; Calle, J.L.P.; Barbero, G.F.; Ayuso, J.; Palma, M. Comparison of different processing approaches by SVM and RF on HS-MS eNose and NIR Spectrometry data for the discrimination of gasoline samples. Microchem. J. 2022, 172, 106893. [Google Scholar] [CrossRef]
  14. Dankowska, A.; Kowalewski, W. Tea types classification with data fusion of UV–Vis, synchronous fluorescence and NIR spectroscopies and chemometric analysis. Spectrochim. Acta A Mol. Biomol. Spectrosc. 2019, 211, 195–202. [Google Scholar] [CrossRef]
  15. Ferreiro-González, M.; Espada-Bellido, E.; Guillén-Cueto, L.; Palma, M.; Barroso, C.G.; Barbero, G.F. Rapid quantification of honey adulteration by visible-near infrared spectroscopy combined with chemometrics. Talanta 2018, 188, 288–292. [Google Scholar] [CrossRef]
  16. Barea-Sepúlveda, M.; Espada-Bellido, E.; Ferreiro-González, M.; Bouziane, H.; López-Castillo, J.G.; Palma, M.; Barbero, G.F. Toxic elements and trace elements in Macrolepiota procera mushrooms from southern Spain and northern Morocco. J. Food Compos. Anal. 2022, 108, 104419. [Google Scholar] [CrossRef]
  17. Qiu, S.; Wang, J.; Tang, C.; Du, D. Comparison of ELM, RF, and SVM on E-nose and E-tongue to trace the quality status of mandarin (Citrus unshiu Marc.). J. Food Eng. 2015, 166, 193–203. [Google Scholar] [CrossRef]
  18. Baqueta, M.R.; Alves, E.A.; Valderrama, P.; Pallone, J.A.L. Brazilian Canephora coffee evaluation using NIR spectroscopy and discriminant chemometric techniques. J. Food Compos. Anal. 2023, 116, 105065. [Google Scholar] [CrossRef]
  19. Scott, I.M.; Lin, W.; Liakata, M.; Wood, J.E.; Vermeer, C.P.; Allaway, D.; Ward, J.L.; Draper, J.; Beale, M.H.; Corol, D.I.; et al. Merits of random forests emerge in evaluation of chemometric classifiers by external validation. Anal. Chim. Acta 2013, 801, 22–33. [Google Scholar] [CrossRef]
  20. Renai, L.; Ancillotti, C.; Ulaszewska, M.; Garcia-Aloy, M.; Mattivi, F.; Bartoletti, R.; Del Bubba, M. Comparison of chemometric strategies for potential exposure marker discovery and false-positive reduction in untargeted metabolomics: Application to the serum analysis by LC-HRMS after intake of Vaccinium fruit supplements. Anal. Bioanal. Chem. 2022, 414, 1841–1855. [Google Scholar] [CrossRef]
  21. Calle, J.L.P.; Ferreiro-González, M.; Ruiz-Rodríguez, A.; Barbero, G.F.; Álvarez, J.Á.; Palma, M.; Ayuso, J. A methodology based on ft-ir data combined with random forest model to generate spectralprints for the characterization of high-quality vinegars. Foods 2021, 10, 1411. [Google Scholar] [CrossRef] [PubMed]
  22. Suhandy, D.; Kusumiyati; Yulia, M. Discrimination between arabica and robusta coffees using NIR-integrating sphere spectroscopy coupled with hierarchical clustering analysis. In IOP Conference Series: Earth and Environmental Science, Proceedings of the 4th International Conference on Agricultural Engineering for Sustainable Agriculture Production (AESAP 2021), Online, 11 October 2021; Institute of Physics: Bristol, UK, 2022. [Google Scholar] [CrossRef]
  23. Tugnolo, A.; Beghi, R.; Giovenzana, V.; Guidetti, R. Characterization of green, roasted beans, and ground coffee using near infrared spectroscopy: A comparison of two devices. J. Near Infrared Spectrosc. 2019, 27, 93–104. [Google Scholar] [CrossRef]
  24. Filho, V.R.A.; Polito, W.L.; Neto, J.A.G. Comparative Studies of the Sample Decomposition of Green and Roasted Coffee for Determination of Nutrients and Data Exploratory Analysis. J. Braz. Chem. Soc. 2007, 18, 47–53. [Google Scholar] [CrossRef]
  25. Ramos-Henríquez, J.M.; Gutiérrez-Taño, D.; Díaz-Armas, R.J. Value proposition operationalization in peer-to-peer platforms using machine learning. Tour. Manag. 2021, 84, 104288. [Google Scholar] [CrossRef]
  26. Nóbrega, R.O.; da Silva, S.F.; Fernandes, D.D.; Lyra, W.S.; de Araújo, T.K.; Diniz, P.H.; Araújo, M.C. Classification of instant coffees based on caffeine content and roasting degree using NIR spectrometry and multivariate analysis. Microchem. J. 2023, 190, 108624. [Google Scholar] [CrossRef]
  27. Setyaningsih, W.; Putro, A.W.; Fathimah, R.N.; Kurnia, K.A.; Darmawan, N.; Yulianto, B.; Jiwanti, P.K.; Carrera, C.A.; Palma, M. A microwave-based extraction method for the determination of sugar and polyols: Application to the characterization of regular and peaberry coffees. Arab. J. Chem. 2022, 15, 103660. [Google Scholar] [CrossRef]
  28. Buratti, S.; Sinelli, N.; Bertone, E.; Venturello, A.; Casiraghi, E.; Geobaldo, F. Discrimination between washed Arabica, natural Arabica and Robusta coffees by using near infrared spectroscopy, electronic nose and electronic tongue analysis. J. Sci. Food Agric. 2015, 95, 2192–2200. [Google Scholar] [CrossRef]
  29. Jollife, I.T.; Cadima, J. Principal component analysis: A review and recent developments. Philos. Trans. R. Soc. A Math. Phys. Eng. Sci. 2016, 374, 20150202. [Google Scholar] [CrossRef] [PubMed]
  30. Dridi, S. Supervised Learning—A Systematic Literature Review. 2021. Available online: https://www.researchgate.net/publication/354996999_Supervised_Learning_-_A_Systematic_Literature_Review (accessed on 26 September 2022).
  31. Rokach, L.; Maimon, O. Clustering Methods. In Data Mining and Knowledge Discovery Handbook; Springer: New York, NY, USA, 2005; pp. 321–352. [Google Scholar] [CrossRef]
  32. Ribeiro, J.S.; Ferreira, M.M.C.; Salva, T.J.G. Chemometric models for the quantitative descriptive sensory analysis of Arabica coffee beverages using near infrared spectroscopy. Talanta 2011, 83, 1352–1358. [Google Scholar] [CrossRef] [PubMed]
  33. Omprakash, S.; Gokila, S. Principal Component Analysis—A Survey. IJARCCE 2018, 7, 63–66. [Google Scholar] [CrossRef]
  34. Ciurczak, E.W.; Igne, B.; Workman, J.; Burns, D.A. Handbook of Near-Infrared Analysis, 4th ed.; Taylor and Francis: Boca Raton, FL, USA; CRC Press: Boca Raton, FL, USA, 2021. [Google Scholar] [CrossRef]
  35. Mechram, S.; Rahadi, B.; Kusuma, Z.; Soemarno. Nirs Technology (Near Infrared Reflectance Spectroscopy) for Detecting Soil Fertility Case Study in Aceh Province: Review. Galaxy Sci. 2021, 71–75. [Google Scholar] [CrossRef]
  36. Vázquez-Espinosa, M.; Fayos, O.; VGonzález-de-Peredo, A.; Espada-Bellido, E.; Ferreiro-González, M.; Palma, M.; Garcés-Claver, A.; Barbero, G.F. Changes in capsiate content in four chili pepper genotypes (Capsicum spp.) at different ripening stages. Agronomy 2020, 10, 1337. [Google Scholar] [CrossRef]
Figure 1. Sampling sites of the studied civet coffee: (A) Lampung (Lampung), (B) Papandayan (West Java), (C) Halu (West Java), (D) Cikuray (West Java), and (E) Temanggung (Central Java), Indonesia.
Horticulturae 09 00778 g001
Figure 2. Spectra of coffee samples without pre-treatment.
Horticulturae 09 00778 g002
Figure 3. Dendrogram from HCA analysis combined with the average’s method and Canberra distance: roasted unground (A), roasted ground (B), unroasted ground (C), and unroasted unground (D). Green represents unroasted beans and brown represents roasted beans.
Horticulturae 09 00778 g003
Figure 4. Scatter Plot from PCA analysis for the first two principal components (PC1 and PC2). A: unroasted-ground, B: unroasted-unground, C: roasted-ground and roasted-unground.
Horticulturae 09 00778 g004
Table 1. The origin, sample pre-treatment, and code of the studied civet coffee samples.
VarietyWild/CultivatedSample Pre-TreatmentSample CodeSampling Site
(Province, City, and Geographic Coordinate System)
Green/RoastedWhole/Ground
ArabicaWildGreenWholeATWGTemanggung,
Central Java
(−7.1752, 110.0170)
GroundATWGG
RoastedWholeATWR
GroundATWRG
GreenWholeAPWGPapandayan,
West Java
(−7.2994, 107.7987)
GroundAPWGG
RoastedWholeAPWR
GroundAPWRG
GreenWholeACWGCikuray,
West Java
(−7.2851, 107.8740)
GroundACWGG
RoastedWholeACWR
GroundACWRG
FeedingGreenWholeATCGTemanggung,
Central Java
(−7.1752, 110.0170)
GroundATCGG
RoastedWholeATCR
GroundATCRG
GreenWholeAXCGHalu,
West Java
(−7.0179, 107.3353)
GroundAXCGG
RoastedWholeAXCR
GroundAXCRG
RobustaWildGreenWholeRLWGLampung,
Lampung
(−4.8421, 104.7406)
GroundRLWGG
RoastedWholeRLWR
GroundRLWRG
FeedingGreenWholeRLCG
GroundRLCGG
RoastedWholeRLCR
GroundRLCRG
Table 2. The comparison of model performances for classification of wild and feeding civet coffees using various sample pre-treatments and chemometrics approaches.
MethodAccuracy (%)
All SamplesBeansGroundGreenRoastedGreen BeansRoasted BeansGreen GroundRoasted Ground
SVM5757575779575710093
SVM Boruta9689--10086100100100
RF100100100100100100100100100
RF
Boruta
100100--100100100100100
Accuracy was calculated using 70% of the training and 30% of the test sets. SVM: Support Vector Machine; RF: Random Forest.
Disclaimer/Publisher’s Note: The statements, opinions and data contained in all publications are solely those of the individual author(s) and contributor(s) and not of MDPI and/or the editor(s). MDPI and/or the editor(s) disclaim responsibility for any injury to people or property resulting from any ideas, methods, instructions or products referred to in the content.

