Article

Residual Effects of Phosphorus and Micronutrients in Vegetable Growing Areas under Different Organomineral Fertilizer Doses

by
Dinamar Márcia da Silva Vieira
1,*,
José Luiz Rodrigues Torres
2,
Reginaldo de Camargo
1,
Adriane de Andrade Silva
1,
Regina Maria Quintão Lana
1,
Hamilton César de Oliveira Charlo
2,
Ernane Miranda Lemes
1 and
Érica Reis Carvalho
2
1
Department of Agronomy, Agricultural Sciences Institute, Federal University of Uberlandia, Glória Campus, Uberlandia 38410-337, Minas Gerais, Brazil
2
Federal Institute of Triangulo Mineiro, Uberaba Campus, 4000 São João Batista Ribeiro St., Uberaba 38064-790, Minas Gerais, Brazil
*
Author to whom correspondence should be addressed.
Horticulturae 2023, 9(7), 761; https://doi.org/10.3390/horticulturae9070761
Submission received: 11 May 2023 / Revised: 20 June 2023 / Accepted: 21 June 2023 / Published: 1 July 2023
(This article belongs to the Special Issue Management Systems and Soil Quality for the Cultivation of Vegetables)

Abstract

:
Organomineral fertilizers (OFs) can provide the macro- and micronutrients contained in organic matter slowly and gradually throughout the crop cycle. However, the residual effect of this slow release is still unclear and needs to be better evaluated. In this context, the objective of this study was to evaluate the use of different doses of OF in the cultivation of vegetables and to quantify the residual effects of P, B, and Zn in the soil. A randomized block design was applied, using different doses of fertilizer as a P source, with four replications. In the randomized block design, different doses of OF were evaluated as a source of P (all with four repetitions): T1 = no P supplied (zero dose); T2 = 200 mg dm−3 of P2O5; T3 = 400 mg dm−3 of P2O5; T4 = 800 mg dm−3 of P2O5; and T5 = 1200 mg dm−3 of P2O5 plus an additional treatment with mineral fertilizer (MF) (200 mg dm−3 of P2O5). The fresh weight (FW) and dry weight (DW) and the nutritional status of the lettuce and cabbage were determined through leaf analysis at harvest. Soil analysis was also conducted before planting and immediately after harvest in order to assess soil P, B, and Zn content. The FW and DW cabbage production was higher when fertilization was used for the crop (either OF or MF). No differences were observed in the effects of the OF and MF doses in cabbage production, which ranged from 281.2 g plant−1 to 341.8 g plant−1, while lettuce production was highest in MF (45.1 g plant−1), followed by OF doses of 800 mg dm−3 (37.1 g plant−1) and 1200 mg dm−3 (36.8 g plant−1) of P2O5. OF fertilization had a beneficial residual effect on lettuce production, the FW and DW production of which increased as the OF doses increased (from 18.8 g plant−1 to 36.8 g plant−1 for FW and from 2.4 g plant−1 to 4.0 g plant−1 for DW). The highest doses of OF increased the availability of P and Zn in the soil and facilitated the absorption of nutrients by the cabbage and lettuce crops. In the cultivation of cabbage and lettuce, the residual effects of the P, B and Zn in the soil were higher under the highest doses of OF. An antagonistic effect between the P and Zn in the soil was evidenced in this study, and this needs to be confirmed in other subsequent studies.

1. Introduction

New technologies have emerged to meet the nutrient requirements of vegetables. These aim to reduce leaching losses of the mineral nutrients applied to soil by releasing the nutrients more slowly and gradually, thereby guaranteeing a more prolonged residual fertilizer effect [1,2]. Among these technologies, organomineral fertilizers (OFs) are an efficient way of supplying nutrients and organic matter when compared with exclusively mineral sources [3,4,5].
Among the most cultivated vegetables in Brazil (and worldwide), cabbage (Brassica oleracea var. capitata) and lettuce (Lactuca sativa L.) occupy a prominent place as they are plants of high nutritional value with medium and short cycles, respectively, and they can be cultivated at any time of the year and in any region of the country [2].
In addition, it is known that these vegetables need large amounts of micronutrients over relatively short periods of time, and these needs are generally met by adding high-solubility mineral fertilizers to the soil [6,7]. For brassicas, nutrient demand is concentrated over a short period, with the highest nutrient absorption rate occurring in the last days of its cycle [8], while for lettuce, absorption is greatest in the initial development phase due to its shorter cycle [9].
The use of OFs minimizes P adsorption problems in tropical soils since one of the ways to reduce P adsorption is to increase its availability by adding soil organic matter (SOM), which blocks adsorption sites [10]. The SOM allows P adsorption because the aluminum (Al), iron (Fe), and calcium (Ca) ions that adsorb onto the SOM retain phosphate anions [11,12]. By blocking specific sorption sites, desorption increases the cationic exchange capacity and decreases the point of zero charge, promoting both a decline in phosphate adsorption by the Al and Fe and organic acid competition for adsorption sites [13].
Although P is one of the nutrients least required by plants, it has increasingly limited agricultural production in Brazil, causing adsorption losses and slow P release [14]. Among micronutrients, B has a regulating effect on metabolism and carbohydrate translocation, which is associated with cell division and cell wall structure [15], while Zn is responsible for plant enzyme activation and controlling important growth regulators [16]. Both are essential for plant development, and the use of OFs may meet the needs of vegetables for these nutrients throughout the crop cycle [17].
Organic matter in the OF granules can supply up to 80% of total soil P content in addition to other macro and micronutrients needed for plant development [18]. In soils not fertilized with B, organic matter is one of the most important nutrient sources, since B is deficient in sandy soils, which are also typically deficient in organic matter and acids [19].
When compared with mineral fertilizers, OFs exhibit less reactive chemical potential in the soil, which can increase the residual effect of the phosphate fertilizer used, resulting in greater agronomic efficiency because their gradual solubilization releases nutrients during crop development [20]. However, the residual effect of soil OFs needs to be better assessed and quantified, relating SOM interactions with different P doses.
The hypothesis tested here is that the slow and gradual release of P, B, and Zn supplied by OFs provides a sufficient residual effect for the development of lettuce crops planted in succession. In this respect, the objective of this study was to evaluate the use of different doses of organomineral fertilizer in the cultivation of vegetables and to quantify the residual effects of P, B, and Zn in the soil.

2. Materials and Methods

2.1. Experimental Area

The study was conducted in an experimental area in the municipality of Uberaba, Minas Gerais, located between geographic coordinates 19°39′19″ S and 47°57′27″ W at an altitude of 795 m. The plants were kept in 6 dm 3 pots (24 cm × 20 cm × 16.5 cm) of soil placed on a wooden support 15 cm above the ground in an arch-shaped greenhouse between July and December 2017.
The climate in the region is classified as Aw (tropical hot) according to the Koppen Climate Classification System [21], with hot, wet summers and cold, dry winters, and annual rainfall of 1600 mm, an average temperature of 22.6 °C, and relative humidity of 68% [22].
The pots were filled with Oxisol [23], which has a sandy/clayey texture and exhibited the following physical characteristics in the 0.0–0.20 m layer: 220 g kg−1, 720 g kg−1, and 60 g kg−1 of clay, sand, and silt, respectively. The chemical traits were as follows: a pH (H2O) of 6.80; 0.85 mg dm−3 of P (meh-1); 28.00 mg dm−3 of K; 2.20 cmolc dm−3 of Ca; 0.85 cmolc dm−3 of Mg; 1.63 cmolc dm−3 of H + Al; 11.5 g kg−1 of organic matter; 6.50 g kg−1 of organic carbon; and a base saturation (V%) of 65.7. The B, Cu, Fe, Mn, and Zn values were 0.12 mg dm−3, 1.73 mg dm−3, 22.03 mg dm−3, 7.30 mg dm−3, and 0.47 mg dm−3, respectively.

2.2. Experimental Design

Two successive tests were conducted in the pots to assess the residual effects of different doses of OF as a P source. In the first test, cabbage (Brassica oleracea var. capitata) was grown between August and October 2017, and all the fertilizer recommended for the crop was applied. Lettuce (Lactuca sativa L.) was then grown in succession in the same soil between November and December 2017 without any complementary P fertilizer, but with nitrogen (N) and potassium (K) replenishment at doses of 75 mg dm−3 (150 kg ha−1) and 60 mg dm−3 (120 kg ha−1), respectively, in accordance with the recommendations for crops suggested by Ribeiro et al. [24].
A randomized block design was applied, and different doses of fertilizer were used as a P source (all with four repetitions): T1 = no P supplied; T2 = 200 mg dm−3 of P2O5; T3 = 400 mg dm−3 of P2O5; T4 = 800 mg dm−3 of P2O5; and T5 = 1200 mg dm−3 of P2O5 plus an additional treatment with mineral fertilizer at a dose of 200 mg dm−3 of P2O5.
Based on soil analyses and crop requirements, the additional treatment recommended by Ribeiro et al. included a 75 mg dm−3 (150 kg ha−1) dose of N, a 200 mg dm−3 (400 kg ha−1) dose of P2O5, and a 120 mg dm−3 (240 kg ha−1) dose of K2O [23].
During the second cycle, no fertilizer was applied to the lettuce crop; only the recommended doses of N and K were used.
Before the soil was placed in the pots, it was sifted and its pH was corrected with lime containing 36.4% calcium oxide, 14% magnesium oxide, 99.87% neutralizing power (NP), and 90.28% total relative neutralizing power (TRNP), raising the base saturation to 70%.
After acid correction, the soil was placed in plastic bags, maintaining the initial volume of 6.0 dm−3, and taken into the greenhouse, where water was added to moisten it. Next, the bags were sealed and left to rest for 30 days to allow a complete reaction with the lime to occur. The soil was then placed in the pots and the fertilizer was added.

2.3. Complementary Information

The OF formulation used was based on the filter cake available in the sugarcane agroindustries (5–17–10 (N–P–K) (0.1% B + 3% silicon (Si) + 0.4% Zn and 8% total organic compound (TOC), produced by the company Geociclo, located in Uberlândia-MG, Brazil). The P doses were applied and complemented with fertilizer for all the other nutrients so that all the treatments were equally fertilized.
The filter cakes used in the composition of the OF contained 1.2% to 1.8% P and about 70% moisture, a high calcium (Ca) content, and considerable amounts of micronutrients [2].
The cabbage and lettuce seedlings used in the first and second crops, respectively, were produced in a covered greenhouse in 128-cell Styrofoam trays containing Bioplant commercial substrate. When 4 or 5 fully expanded leaves emerged, both the cabbage and lettuce seedlings were transplanted, one seedling per pot, using eight pots per plant (cabbage and lettuce) for each experimental unit, and a total of thirty-two pots for each treatment.
After transplantation, the fertilizers were placed around the seedlings at equidistant points 5 cm deep and covered with a layer of soil. At the end of the cabbage experiment, the lettuce seedlings were transplanted into the same pots and fertilized with N (urea) and K2O (potassium chloride).
These transplanted seedlings were subjected to daily drip irrigation, and the water depth was calculated based on the reference evapotranspiration (ETo), estimated using data obtained by the IFTM weather station. In order to determine the water depth, daily temperature values were collected and reference evapotranspiration was calculated using the Hargreaves equation [25]:
Eto = 0.0134 × K t × Q o ( t m a x t m i n ) 0.5 × ( t a v e + 17.3 )
where ETo is reference evapotranspiration (mm day−1), Kt is the nondimensional constant for the region of Uberaba, MG (0.162), tmax is the maximum temperature recorded on the day (°C), tmin is the minimum temperature (°C), and tave is the average temperature (°C). The average temperature was 24.5 °C, the reference evapotranspiration was 7.01 mm, the Kc was 1.07, and the applied water depth was 7.50 mm day−1 for a volume (pot) of 462 mL, with an irrigation time (the time required to replenish 100% of the water depth used) of 17.3 min.

2.4. Assessments

The cabbage was collected when the heads reached the ideal harvesting point, typically between 85 and 100 days after planting (DAP), while all the lettuce was collected 45 DAP. Both vegetable crops were cut at ground level and their fresh weights (FWs), i.e., total vegetable production, including leaves and heads, were determined. Next, the plant material was taken to the laboratory and placed in a forced air circulation/renewal oven (Marconi brand, model 035/5) at 65 °C for 72 h to determine the dry weight (DM), the results of which are expressed in grams per plant (g plant−1).
Immediately after harvesting, 40 newly matured leaves were collected per cabbage and lettuce plot, in accordance with the methodology proposed by Martinez et al. [26]. After drying in an oven with forced air circulation at 65 °C for 72 h, these leaf samples were ground in Willey mills and then taken to the Soil Fertility Laboratory to determine their P, B, and Zn content, in accordance with the methodology proposed by Silva [27].
To determine the levels of P and Zn in the plant tissue, the samples were digested using HNO3 + HClO4 (3:1) (600 mL of HNO3 65% p.a. and 200 mL of HClO4 72% p.a.). For this step, 500 mg of plant tissue was transferred to an 80 mL digester and 8 mL of the acid mixture was added. The tube was kept cold for three hours and then placed in a digester block and heated to 200 °C (at the end of the process, from 3 h to 4 h). Subsequently, it was allowed to cool, and the volume was completed to 25 mL with deionized water.
In order to determine the P content, 5 mL of the extract was pipetted and the volume was completed to 20 mL with deionized water. From this solution, 10 mL was transferred to a 30 mL tube and 4 mL of the reagent mixture (equal parts of 5% molybdate solution and 0.25% vanadate solution) was added. After five minutes, a reading was taken using a spectrophotometer at 420 nm. The Zn content was determined directly using an atomic absorption spectrometer.
For the analysis of the B content in the plant tissue, dry digestion was carried out. In this step, 500 mg samples were transferred to porcelain crucibles that were subjected to a temperature of 500 °C in a muffle furnace for three hours. After cooling, 25 mL of 1 mol L−1 HNO3 was added. Next, 1 mL of this extract was transferred to a 30 mL tube and 2 mL of buffer solution (250 g of NH4OAc and 15 g of Na2EDTA in 400 mL of H2O + 125 mL of glacial HOAc, completed to 1000 mL with deionized water) was added along with 2 mL of azomethine-H solution (1.0 g of ascorbic acid in 80 mL of water + 0.45 g of azomethine-H, completed to 100 mL with deionized water). After 30 min of homogenization, a reading was taken using a spectrophotometer at 460 nm.
After the harvesting of the cabbage and lettuce, all the pots and treatments were sampled to analyze the soil fertility and assess the residual effect of the P from the organomineral and mineral fertilizers that had been applied. The following were assessed: hydrogen ion potential in water (pH H2O), P, B, and Zn [27,28,29].
To determine the pH of the soil, 10 cm3 portions of soil from each sample were placed in 100 mL plastic cups. Subsequently, 25 mL of deionized water was added and the mixture was stirred with a glass rod and left to rest for one hour. At the time of determination, the samples were stirred again with a glass rod and the pH was obtained by inserting an electrode into the homogenized suspension. For this purpose, a bench pH meter that had been calibrated with pH = 4.0 and pH = 7.0 buffers was used [27].
The available P, Zn, and B content in the soil samples was also determined. The available P and Zn were extracted using the Mehlich-1 solution (also called double-acid or North Carolina solution), which is a mixture of HCl 0.05 mol L−1 and H2SO4 0.0125 mol L−1. For the P content, 10 cm3 portions of soil from each sample were placed in 125 mL Erlenmeyer flasks, and 100 mL of the Mehlich-1 solution were then added and stirred for five minutes using horizontal circular shakers. After stirring and removing the mounds that formed at the bottom of the flasks, the solutions were allowed to decant overnight. A similar process was adopted for the extraction of the available Zn, but in this case the soil:extractor ratio was 1:5 [27].
To determine the available P content, 5 mL of the extract was placed in a 125 mL Erlenmeyer, and 10 mL of diluted ammonium molybdate acid solution and one measure (30 mg) of powdered ascorbic acid were then added. The mixture was then stirred for one minute in a horizontal circular shaker and, for color development, it was left to stand for one hour, after which a reading was taken using a spectrophotometer with a wavelength of 660 nm. For the Zn content, the extract was filtered through Whatman No. 42 filter paper, and the determination was performed using an atomic absorption spectrophotometer [29].
The available B content was determined by transferring 10 cm3 portions of each sample to polypropylene bags and adding 20 mL of barium chloride extractor solution (1.25 g of barium chloride (BaCl2·2H2O) in 1 L of deionized water). The containers were sealed and heated for 4 min in a microwave at 700 W. Next, the suspension was allowed to cool for thirty minutes and was then filtered using filter paper. The azomethine-H method was adopted, for which purpose 4 mL samples of each extract were transferred to test tubes and 1 mL of buffer solution (250 g of p.a. ammonium acetate + 15 g of EDTA in 400 mL of deionized water + 125 mL of glacial acetic acid) and 1 mL of azomethine-H solution (0.9 g of azomethine-H in 100 mL of L-ascorbic acid solution at 20 g L−1) were added. The tubes were then manually shaken and left to rest for thirty minutes, after which readings were taken using a spectrophotometer at 420 nm [27,28].

2.5. Statistical Analyses

The characteristics assessed were submitted to analysis of variance via the F test and, when significant, to regression analysis of quantitative factors (doses), and the means of the qualitative factors (soil) were compared using Tukey’s test at 5% probability with R Core Team software, version 2020. The means of the treatments and the additional treatments were compared using Dunnett’s test (p < 0.05).

3. Results

3.1. Fresh and Dry Weight Production

When analyzing the fresh weight (FW) and dry weight (DW) production of cabbage, it was observed that there were no differences between the OF doses used when compared with the MF; that is, the values were similar when there was some form of fertilization and higher when compared with the treatment with no phosphate fertilizer (zero dose) (Table 1).
These results show that in the first cycle, the lowest OF doses (200 mg dm−3) performed as well as the highest (1200 mg dm−3), and that OF doses greater than or equal to 200 mg dm−3 of P2O5 performed similarly to the MF (200 mg dm−3 of P).
In the lettuce, the highest FW and DW production was observed in the plants treated with MF (200 mg dm−3 of P2O5), closely followed by those treated with the two highest doses of OF (800 mg dm−3 and 1200 mg dm−3 of P2O5). It was also observed that the highest dose of OF (1200 mg dm−3 of P2O5) resulted in a 78.7% increase in DW production and a 78.9% increase in FW production, while the MF treatment resulted in an 82.5% increase in DW production and an 86.4% increase in FW production when compared with the control (no P supplied).
With respect to the OF doses, a regression analysis revealed an exponential increase in FW and DW cabbage production up to 200 mg dm−3 of P2O5 (p < 0.05; F = 14.90), beyond which it remained constant until a dose of 1200 mg dm−3 of P2O5. For the lettuce, a quadratic adjustment was observed: the FW and DW production increased significantly (p < 0.05) up to an equivalent dose of 1000 mg dm−3 of P2O5 (p < 0.05, F = 24.30), beyond which production started to decline (Figure 1).

3.2. Influence of Mineral and Organomineral Fertilizers on Some Soil Chemical Properties

The pH value of the soil at zero dose (without the application of OF or MF) and before planting the cabbage was determined vary between 6.17 and 6.90. However, with the OF treatments, the pH values declined as the increased doses were applied, and they were significantly higher (p < 0.05) than the pH value observed with the MF treatment, which was the lowest value initially found (6.17) (Table 2).
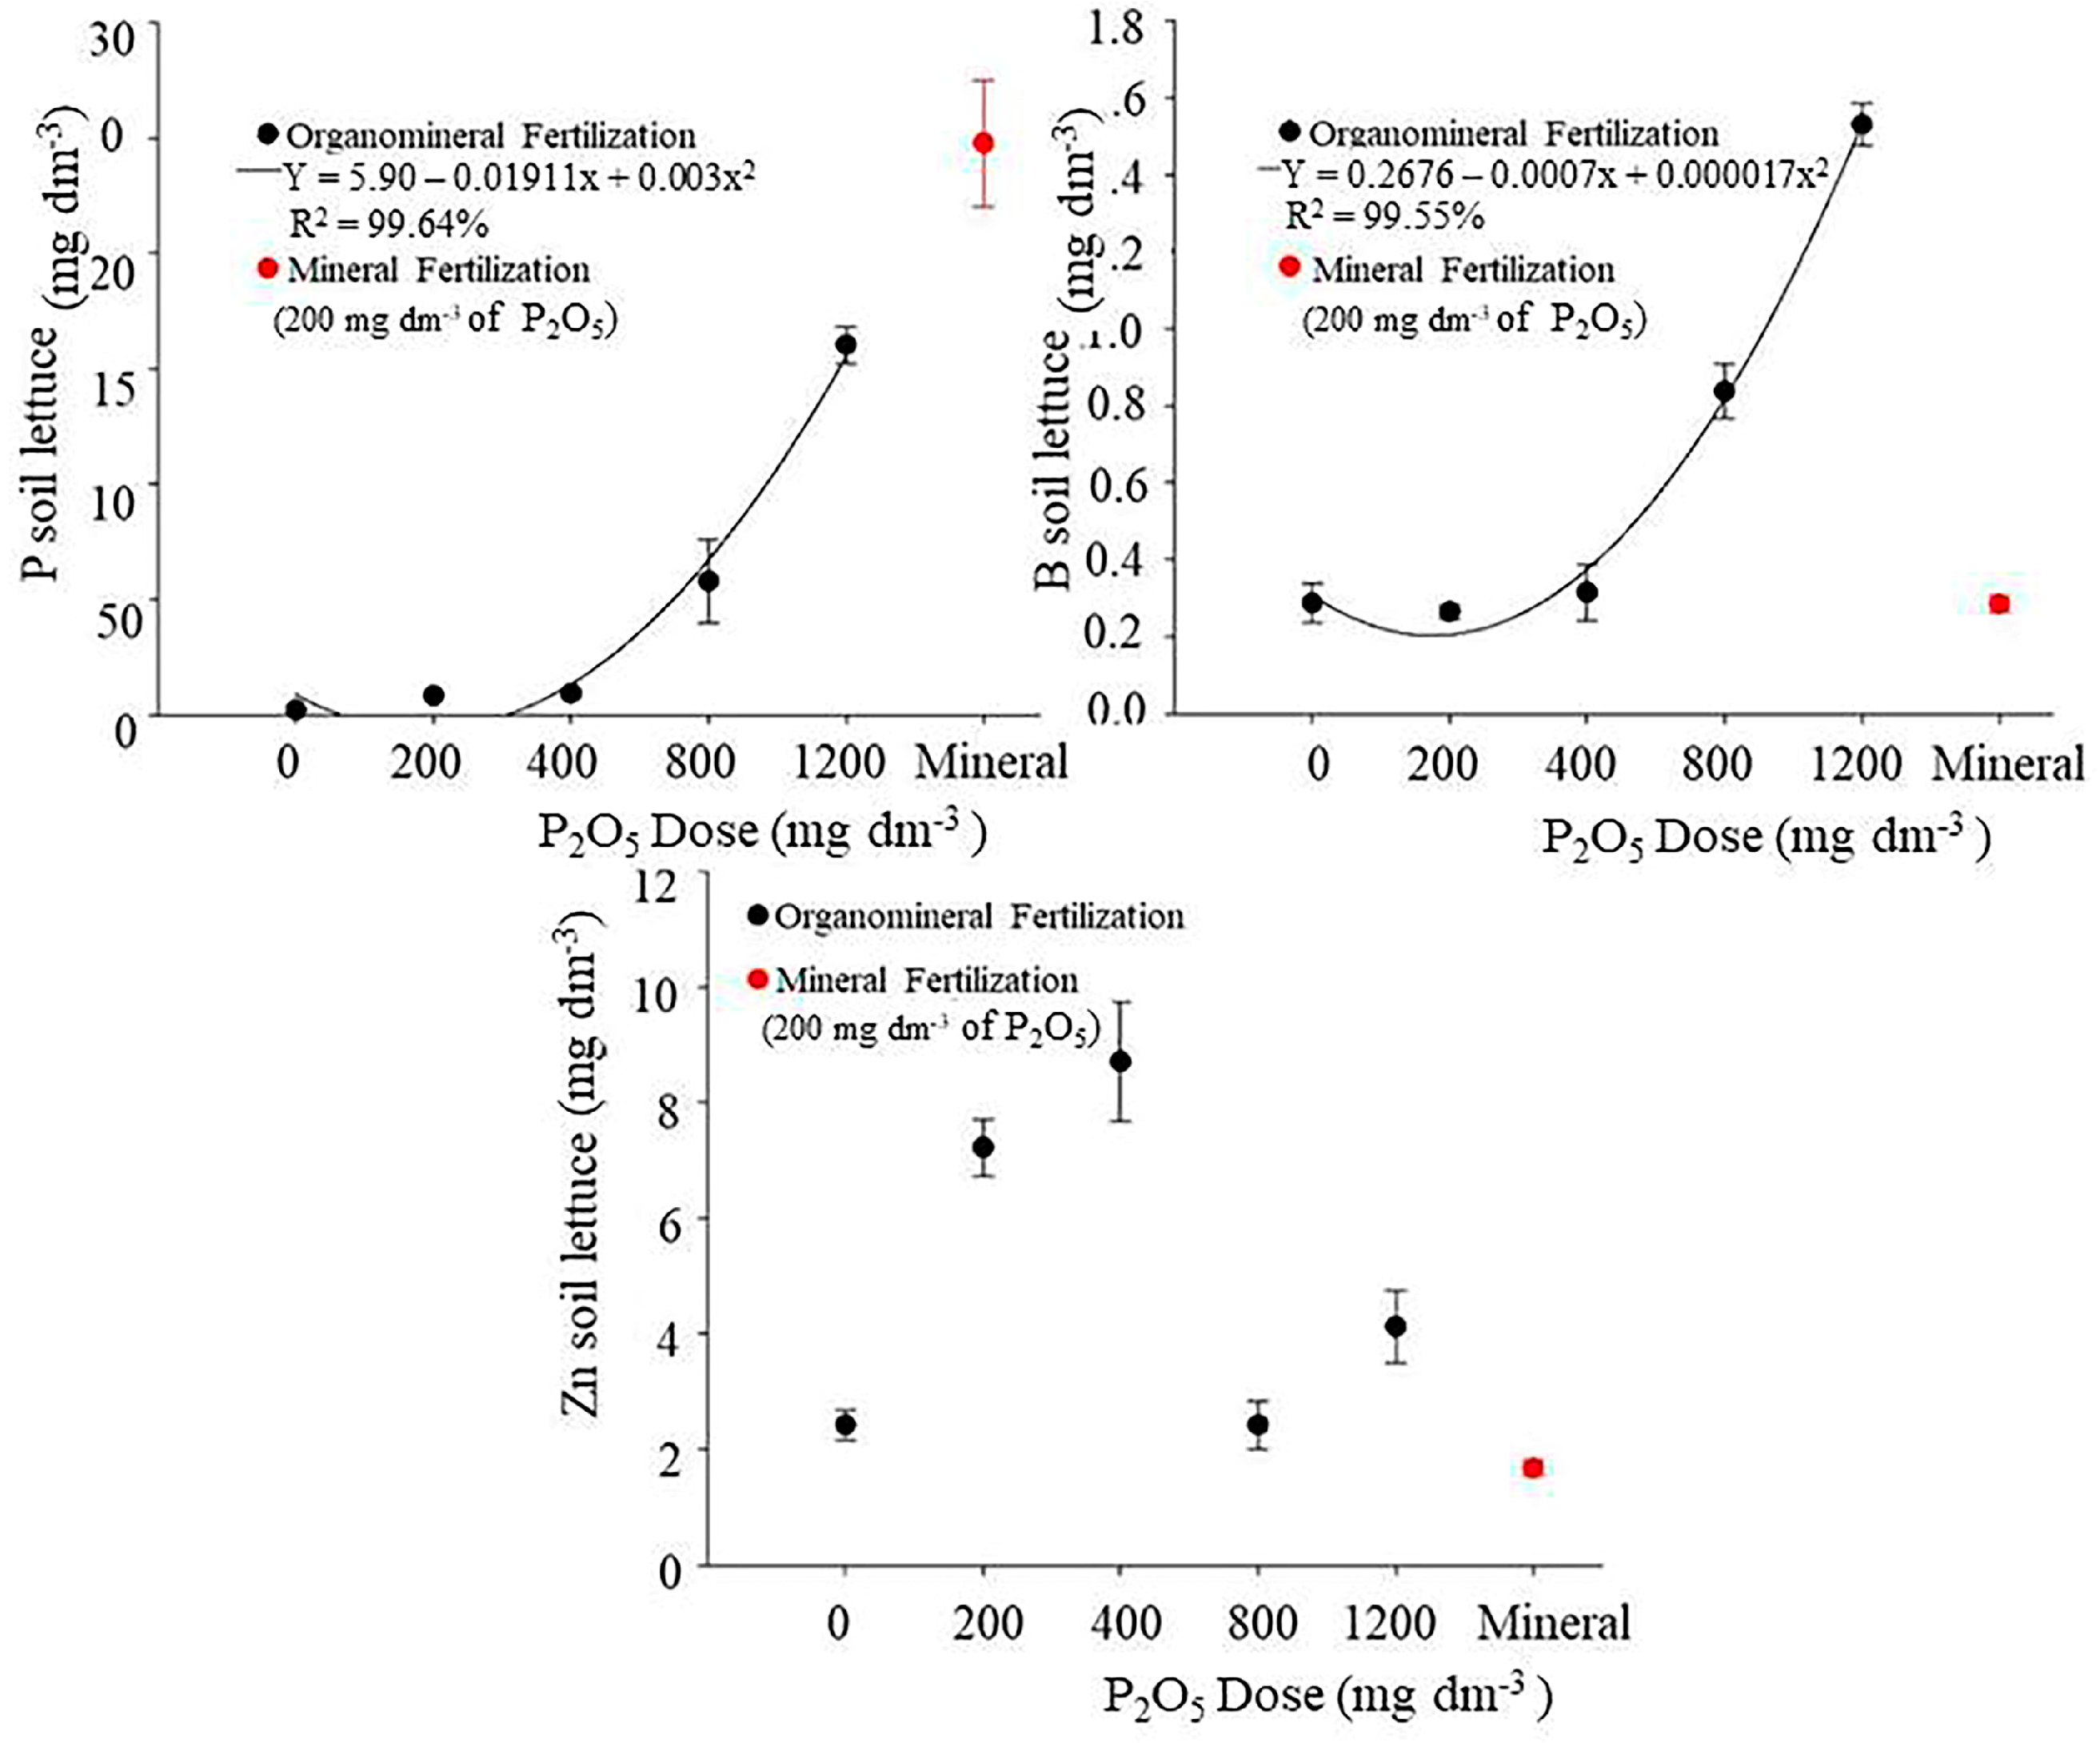
In the second crop (lettuce), initial soil acidification was significant at doses of 400 mg dm−3, 800 mg dm−3, and 1200 mg dm−3 of OF and 200 mg dm−3 of MF (p < 0.05): the pH declined from 6.30 to 5.97, but it was still considered suitable. The amount of organic matter supplied by the OF increased the residual effect of the phosphate fertilizer via the gradual release of nutrients into the soil in both the cabbage and lettuce crops (Figure 2 and Figure 3).
With respect to soil B in the first cabbage crop, the levels were higher when the OF was applied, varying from 0.30 mg dm−3 to 0.44 mg dm−3, when compared with the treatment without P, or when the MF was applied at a dose of 200 mg dm−3 of P2O5. In the lettuce, at doses of 800 mg dm−3 and 1200 mg dm−3 of OF, the soil B contents were 0.84 dm−3 and 1.67 dm−3, respectively, values that were higher than those observed under any of the other OF and MF doses assessed (Table 2), indicating the capacity of OF to supply B to the soil–plant system.
In the soil used in the present study, after initial correction, the Zn content was 0.47 mg dm−3, but this increased significantly after all of the OF and MF treatments were applied, exhibiting statistically equal values varying from 10.45 mg dm−3 to 14.20 mg dm−3 in the cabbage crop. For the green leaf lettuce, the soil Zn content increased only at doses of 200 mg dm−3, 400 mg dm−3, and 800 mg dm−3 of OF, varying between 8.22 mg dm−3 and 142 mg dm−3, but it declined to 4.12 mg dm−3 and 1.67 mg dm−3, respectively, at OF and MF doses of 1200 mg dm−3 (Table 2).
The Zn content increased significantly as the OF doses rose, especially at doses greater than or equal to 400 mg dm−3 (Figure 2). The regression analysis demonstrated that there was no increase in soil B content up to an OF dose of 200 mg dm−3, after which the soil P content rose progressively and linearly. Thus, the higher the OF dose, the greater the availability of B in the soil. On the other hand, for the Zn content, curve fitting could not be performed for the doses applied in relation to the nutrient increases in the soil (Figure 2).
After the second (lettuce) crop was harvested, where the residual effects of the fertilizers were assessed, the soil P and B content exhibited a quadratic fit for the OF doses used. A stable effect was observed in the soil P and B content up to an equivalent OF dose of 400 mg dm−3, after which an increase in the amount of OF applied led to a rise in the soil P and B content (Figure 3). The soil B content at OF doses above 400 mg dm−3 was significantly higher than that reported for MF (Figure 3).
The maximum soil P and B content was observed at the highest OF dose (1200 mg dm−3 of OF) after two crop cycles, that is, at the end of the lettuce crop. For Zn, as was observed for the cabbage crop, curve fitting was not possible in the regression analysis of the increase in soil Zn (Figure 3).

3.3. Assessment of Plant Nutritional Status

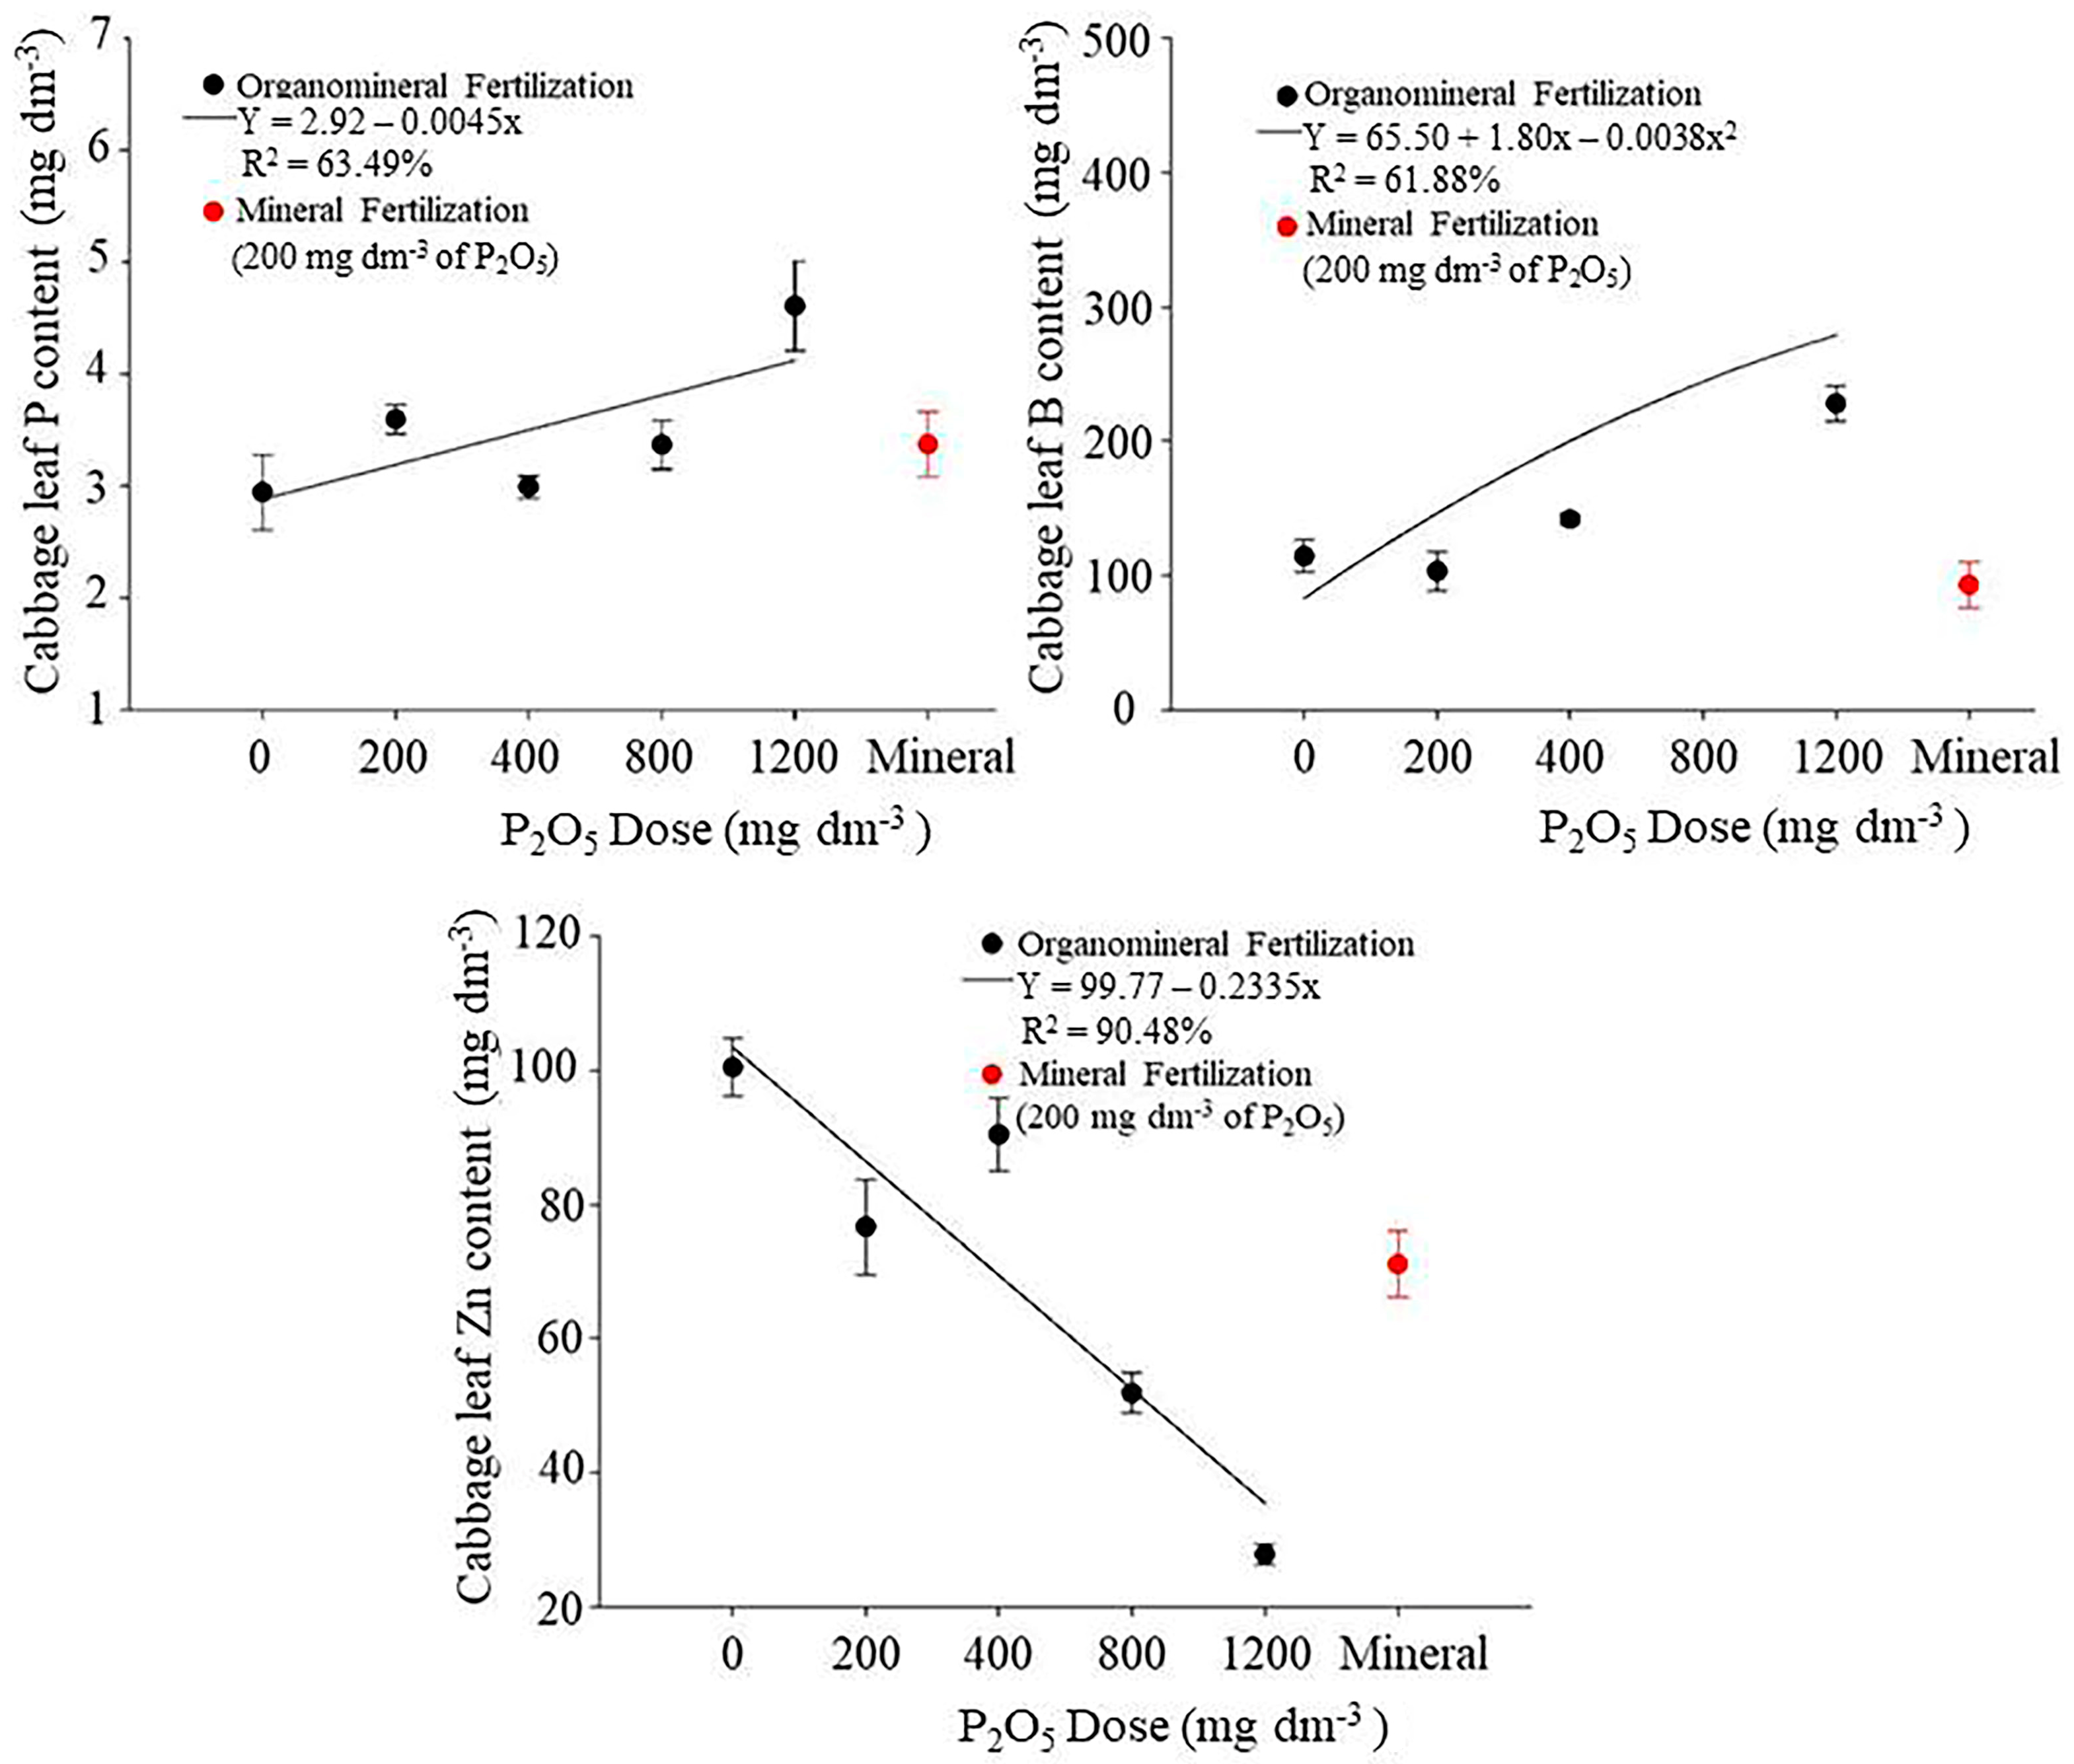
A regression analysis of cabbage leaf P, B, and Zn content showed that P and B content grew steadily as a function of the doses applied, indicating an increase in leaf nutrient content up to an OF dose of 1200 mg dm−3. An inverse effect occurred with Zn: there was a linear decline in leaf nutrient concentration as the OF doses in the soil rose (Figure 4). This is because the increase in OF doses raised the P and B content in the cabbage crop (Figure 2), resulting in greater plant absorption (Figure 4).
A comparison of the cabbage leaf nutrient content observed under the different OF and MF doses demonstrated that OF doses of 800 mg dm−3 and 1200 mg dm−3 provided the highest P and B concentrations, and that these were higher than those observed under the MF dose (200 mg dm−3) (p < 0.05). There was an antagonistic effect between the P and Zn: when P was not applied (no P2O5), the Zn concentration in the cabbage leaf was highest (Table 3).
An increase in P doses, and consequently its availability (Figure 2 and Figure 3) to plants and greater absorption (Figure 4 and Figure 5), reduced cabbage and lettuce leaf Zn content.

4. Discussion

4.1. Fresh and Dry Weight Production

The results presented in Table 1 show that the FW cabbage production ranged from 281.2 g plant−1 to 341.8 g plant−1 while the DW production ranged from 44.3 g plant−1 to 50.5 g plant−1 as it is a crop with a shorter cycle. Cabbage takes better advantage of the nutrients that are available in mineral form or cycled from the organic matter in OFs as the release of nutrients occurs more slowly during its cycle [30]. These results are corroborated by Silva [31], who evaluated the influences of P doses and application modes and determined the nutrient accumulation curve in a cabbage crop, observing that the highest P absorption rate in cabbage occurred during the last 10 days of its cycle.
The FW lettuce production increased from 18.8 g plant−1 to 36.8 g plant−1 and the DW production increased from 2.4 g plant−1 to 4.0 g plant−1 as the OF doses rose. However, at all OF doses, production was lower than that obtained with MF. This observation can be explained by the fact that P is released more quickly into the soil solution when MF is used, and lettuce is a plant that absorbs high concentrations in a short period of time since it has a maximum cycle of 45 days until harvest.
The large P demand of lettuce was also confirmed: in the plot in which the nutrient was not applied, production was significantly lower than in the plots treated with P.
According to Trentini and Hojo [32] and Rodrigues [33], organic matter promote biological activity and the physical aspects of soil as the nutrients that are released are retained for longer in the soil, while mineral fertilizers promote rapid growth because they supply nutrients more quickly, providing better conditions for the development of certain crops (e.g., lettuce).
Lana et al. [34] underscore that in the absence of P, production is lower and plant diameters are smaller, indicating that lettuce responds positively to higher soil P content.
In general, the P that is retained in organic matter is released slowly and gradually from the OF, and thus plants with short cycles, such as lettuce, are not able to absorb the necessary amount of P for their normal development. This is not the case with MFs due to their high solubility and rapid release of nutrients (mainly P) for plant absorption [2].
While growing green leaf lettuce in a protected environment, Oliveira Junior et al. [35] observed that total FW varied between 151 g plant−1 and 232 g plant−1, while Borges et al. [36], who cultivated green leaf lettuce in a field, obtained FWs between 199 g plant−1 and 299 g plant−1, values that are 334% and 441% higher, respectively, than the maximum obtained here (45.1 g plant−1) with MF treatment (200 mg dm−3 P2O5). In relation to DW production, Grangeiro et al. [9] used Babá de Verão, Tainá, and Verônica cultivars and reported respective DWs of 8.9 g plant−1, 6.9 g plant−1, and 6.4 g plant−1, all of which are above the highest value (5.9 g plant−1) obtained in this study using MF treatment (200 mg dm−3 P2O5). The results observed by the aforementioned authors are higher than those found in the present study since both of the above studies were conducted in the field, while our investigation was carried out in greenhouse pots. As such, lower values than those reported in the literature were expected.
Comparing the results obtained using MF and OF on a green leaf lettuce crop in a protected environment between November and December 2019, Torres et al. [10] observed a FW of 108.5 g plant−1 and a DW of 6.4 g plant−1 at the highest OF dose (300 mg dm−3 of P2O5) and a FW of 205.8 g plant−1 and DW of 4.9 g plant−1 with the MF dose (150 mg dm−3 de P2O5), values are also higher than those obtained in this study.
The results of the present study suggest that even small OF doses can supply nutrients faster to the primary crop. As Figure 1 shows, the performance of the cabbage crop, the first to be planted, did not change when different OF concentrations were applied (from 200 mg dm−3 to 1200 mg dm−3 of P2O5). On the other hand, the residual effect and, consequently, the secondary crop performance, was altered, with the highest OF doses resulting in better lettuce crop performance (Figure 1).

4.2. Influence of Mineral and Organomineral Fertilizers on Some Soil Chemical Properties

The reductions in pH accompanying the treatments with the highest OF doses, described in Table 2, may have been due to the presence of organic matter in the fertilizer, which may have released organic acids into the soil solution, causing acidification and a lower pH.
In the initial analysis of the soil used as a substrate, the P content was 0.85 mg dm−3. However, after the treatments with OF and MF, the values increased substantially, but the P content in MF-treated soil was significantly higher (p < 0.05) in the first (266.65 mg dm−3) and second (247.77 mg dm−3) crop cycles when compared with that in the OF-treated soil. The soil P content rose (p < 0.05) as the OF doses increased, and the highest values were obtained with a dose of 1200 mg dm−3 (152.50 mg dm−3 and 160.45 mg dm−3 in the first and second crops, respectively).
This increase in P availability with OF is directly related to the presence of this nutrient, high pH, and soil organic matter content. According to Novais and Smyth [37], more P is available when soil pH varies between 6.5 and 7.0, and the combination of the nutrient with organic matter blocks soil Fe and Al oxide adsorption sites, thereby decreasing soil P adsorption capacity. This occurs naturally in more acidic soils. These authors also point out that plants absorb P in the anionic forms H2PO4 and HPO4, which are the forms with the highest occurrence in the pH range 4.0 to 8.5; that in tropical soils the total content of this element in the soil varies between 200 mg kg−1 and 3000 mg kg−1, with less than 0.1% of the total P content (0.002 mg L−1 to 2.0 mg L−1) found in the soil solution; and that these low available levels are due to the low solubility of P compounds and their immobilization due to the strong interactions of sorption, adsorption, or P fixation that occur with the constituents of these soils.
The p values in the soil in which P fertilization was applied using OF or MF ranged from 12.40 mg dm−3 to 266.65 mg dm−3 for the cabbage and from 8.45 mg dm−3 to 247.77 mg dm−3 for the lettuce (Table 2). These values were always above the sufficiency range of 3.0 g kg−1 to 7.5 g kg−1 for cabbage and 4.0 g kg−1 to 7.0 g kg−1 for curly lettuce, established by Trani and Raij (1997) [38], who confirmed the greater availability of the nutrient in soil treated with phosphate fertilizer compared with soil not treated with phosphate fertilizer.
According to Smith et al. [3] and Ferreira et al. [5], the increase in residual P that occurs in the soil (as is shown in Figure 2 and Figure 3) results from the competition over P adsorption sites and organic acids created by the mineralization of the organic matter that the MF adds to the soil. Kiehl [20] points out that the addition of organic matter to the soil via OF can increase the residual effect of phosphate fertilization through the gradual release of the nutrient into the soil as it promotes competition between the released organic acids and the phosphate ions for the sites of adsorption in the soil.
Assessing the P availability in clayey Argisol after OF and MF were applied at doses ranging from 0 kg ha−1 to 120 kg ha−1 of P2O5, Lana et al. [39] reported linear increases in P content for both sources, a trend also observed in this study.
In qualitative terms, Malavolta et al. [28] underscored that B content between 0.10 mg dm−3 and 0.30 mg dm−3 provides a moderate amount of this nutrient to plants. However, Alvarez et al. [18] found that a moderate level occurs when content is between 0.30 mg dm−3 and 0.60 mg dm−3. At any rate, after the application of OF and MF, nearly all the values obtained here were within or above this range, except for those obtained using the treatment with no fertilizer (26 mg dm−3), thus confirming the increase in soil B content, which was 0.12 mg dm−3 before treatment application.
At OF doses of 800 mg dm−3 and 1200 mg dm−3, the residual effect of the B in the soil during the second cycle increased by 90% and 279%, respectively, in relation to the residual effect observed in the soil after the cabbage cycle (Figure 2). This is directly related to the gradual release of this micronutrient, which is retained in the OF organic matter. This confirms that using OFs in sandy soils, which are poor in organic matter, and consequently in B [40], may be a good solution for vegetable crops.
B is an essential element for cell growth, primarily in younger plant parts. The main symptom of B deficiency is poor plant development; that is, purplish or light green leaves [18]. However, no visual sign of nutritional deficiency was observed in the cabbage or lettuce in the present study.
Unlike what occurred with the soil P and B content, there was no model fitting of soil Zn content after fertilizer application. Cerrado soils traditionally exhibit low Zn availability [40] as a function of the need to correct soil acidity using liming, and this consequently reduces the Zn available to plants.
According to Alvarez et al. [18], the Zn content considered adequate to meet a plant’s needs varies from 1.6 mg dm−3 to 2.2 mg dm−3 (Table 2). In the present study, all the values obtained were above this range and higher than the value in the soil (0.47 mg dm−3) before the treatments were introduced.
Zn is responsible for enzyme activation in plants and controls important growth regulators. The main symptom of Zn deficiency is young leaf necrosis, which is easily detected [14,15]. The condition was not observed in this study.
However, Araújo and Machado [41] underscore that adding P to soil may decrease Zn absorption due to altered rhizosphere pH, since when P fertilizers are dissolved, H+ ions are released, and Zn absorption is sensitive to pH variations. However, from our results, it can be observed that an antagonism between P and Zn occurs in the plant, though the same did not occur in the soil. We suggest that other studies should be carried out to confirm these results, since only one cycle was carried out for each crop. Zanão Júnior et al. [42] assessed the chemical properties of Oxisol in the Cerrado, observing that higher organic matter content occurred when soil Mn, Zn, and B was also high.

4.3. Assessment of Plant Nutritional Status

In the lettuce crop, there was a quadratic fit for leaf P, B, and Zn content. The leaf P and B content increased as the soil OF doses rose (Figure 5). There was an inverse effect for Zn content, whereby the leaf nutrient content declined as the OF doses increased (Figure 5). This was observed in the cabbage crop (Figure 4).
In the lettuce, the pattern of leaf Zn content was similar to that observed in the cabbage: leaf nutrient concentration declined as the OF doses increased. This can also be explained by the antagonistic reaction between P and Zn, since when there is high P content or the P supply increases, the available Zn concentration may decrease, negatively affecting Zn absorption and transport from the roots to the shoots, as has been reported by Araújo and Machado [41] and Silva and Trevisan [43].
There are also reports in the literature that adding P to soil may cause an increase in growth rate sufficient to lower the Zn concentration in plants to the deficiency level, given that the Zn absorption rate does not rise fast enough to maintain the necessary concentration in the shoots, characterizing the effect of dilution [44,45].
Lettuce Zn content varies as a function of the amount of fertilizer applied. Applying high Zn fertilizer doses may cause plant toxicity, which limits yield and quality [46]. However, when Zn is supplied via organic matter, this toxic effect does not occur because the nutrient is released slowly during organic matter mineralization.
According to Sinha et al. [47], low soil P content can interfere in B metabolism, thereby aggravating deficiency symptoms or causing toxicity. However, in this study, maintaining or increasing the P dose, and consequently raising soil P availability, increased the concentration of B in the leaves of the cabbage and the lettuce plants.
In their study on Vanda lettuce cultivar production with different organomineral doses as a source of P and micronutrients, Torres et al. [10] observed that B leaf content increased linearly until reaching its peak at a dose of 300 mg dm−3 of P2O5, while for Zn, the curve fitting was quadratic, given that the maximum leaf content increased to 216 mg dm−3 of P2O5, following which a decline in leaf nutrient content occurred. However, this fit exhibited a low coefficient of determination (46.13%).
In the lettuce, there were no differences in leaf P concentration under the OF and MF doses assessed (p < 0.05), and the B content was highest when the OF was applied. For Zn, the highest lettuce leaf concentration occurred when P was not applied, confirming the occurrence of an interaction in the plant as a function of the dilution effect or P interference in the absorption, translocation, and use of Zn by the plant [44,45,48].
Lettuce is a short-cycle plant that needs readily available nutrients in the soil, which can be obtained via fertilization, so that it can meet its nutritional needs at the beginning of its development. P is one of the macronutrients most required by the vegetable, which may explain the lack of differences in P content observed between the plants treated with OF and those treated with MF [6,12,33].

5. Conclusions

The fresh and dry mass production of cabbage was higher when the crop was fertilized, either with organomineral fertilizer (OF) or mineral fertilizer (MF).
There was no difference in production were observed between the cabbage crops treated with OF and those treated with MF, which ranged from 281.2 g plant−1 to 341.8 g plant−1, while the highest lettuce production was obtained using MF (45.1 g plant−1), followed by OF doses of 800 mg dm−3 (37.1 g plant−1) and 1200 mg dm−3 (36.8 g plant−1) of P2O5.
OF fertilization had a beneficial residual effect on lettuce production, whose MF and DM production increased as the OF doses increased (from 18.8 g plant−1 to 36.8 g plant−1 for FW and from 2.4 g plant−1 to 4.0 g plant−1 for DW). However, for all OF doses, the production values were lower than those obtained using MF.
The highest doses of OF increased the availability of P and Zn in the soil and favored the absorption of nutrients in the cabbage and lettuce crops.
The organomineral fertilizer provided a residual effect on the P, B, and Zn in the soil, which were higher when the highest doses of fertilizer were used in the cultivation of the cabbage and lettuce crops.
An antagonistic effect between the P and Zn in the soil was evidenced in this study, and this effect needs to be confirmed in other subsequent studies.

Author Contributions

Conceptualization, R.d.C., J.L.R.T. and D.M.d.S.V.; methodology, R.d.C., J.L.R.T., D.M.d.S.V., R.M.Q.L., A.d.A.S. and É.R.C.; formal analysis, R.d.C., J.L.R.T., D.M.d.S.V. and R.M.Q.L.; data curation, J.L.R.T., H.C.d.O.C., E.M.L. and R.d.C.; writing—original draft preparation, J.L.R.T., D.M.d.S.V. and R.d.C.; writing—review and editing, J.L.R.T., H.C.d.O.C., E.M.L. and R.d.C.; project administration, J.L.R.T., D.M.d.S.V. and É.R.C.; funding acquisition, J.L.R.T. All authors have read and agreed to the published version of the manuscript.

Funding

This research was funded by the National Council for Scientific and Technological Development (CNPq-Process 306151/2020-0) upon signature of the Term of Grant by their legal representatives.

Data Availability Statement

Data are contained within the article.

Acknowledgments

The authors thank the Federal Institute of Triângulo Mineiro (IFTM), Uberaba Campus for providing the equipment and laboratory space needed for carrying out the experiments and analyses, and the Brazilian National Council for Scientific and Technological Development (CNPq) for funding the research and for granting Research Productivity scholarships to the researchers and Scientific Initiation scholarships to the students involved with this project.

Conflicts of Interest

The authors declare no conflict of interest regarding the data and findings published in this article.

References

  1. Magela, M.L.M.; Camargo, R.; Lana, R.M.Q.; Carvalho, M.M.C. Application of organomineral fertilizers sourced from filter cake and sewage sludge can affect nutrients and heavy metals in soil during early development of maize. Aust. J. Crop Sci. 2019, 13, 863–873. [Google Scholar] [CrossRef]
  2. Vieira, D.M.S.; Camargo, R.; Torres, J.L.R.; Silva, A.A.; Lana, R.M.Q.; Carvalho, F.J. Growing vegetables in succession in different soils and doses of phosphorus in an organomineral fertilizer. Rev. Bras. Eng. Agric. Ambient. 2020, 24, 806–813. [Google Scholar] [CrossRef]
  3. Smith, W.B.; Wilson, M.; Pagliari, P. Organomineral fertilizers and their application to field crops. In Animal Manure—Production, Characteristics, Environmental Concerns, and Management; Waldrip, H.M., Pagliari, P.H., He, Z., Eds.; ASA and SSSA: Madison, WI, USA, 2020; Volume 67, pp. 229–243. [Google Scholar] [CrossRef]
  4. Silva, L.G.; Reginaldo, C.; Lana, R.M.Q.; Delvaux, J.C.; Fagan, E.B.; Machado, V.J. Chemical changes and development of soybean with use of pelletized organominerals fertilizer based of sewage sludge and filter cake. Acta Sci. Agron. 2020, 42, e44249. [Google Scholar] [CrossRef]
  5. Ferreira, J.B.N.; Gabetto, P.; Araujo, A.C.M.; Dias, R.C.; Sobrinho, N.M.B.; Zonta, E. Combining biosolid and mineral sources of phosphorus and potassium in organomineral fertilizers influences the dynamics and efficiency of nutrient release. Environ. Geo. Health 2023. [Google Scholar] [CrossRef]
  6. Queiroz, A.A.; Cruvinel, V.B.; Figueiredo, K.M.E. Produção de alface americana em função da fertilização com organomineral. Enc. Bios. 2017, 14, 1053–1063. [Google Scholar] [CrossRef]
  7. Ribeiro, R.R.; Torres, J.L.R.; Orioli Junior, V.; Charlo, H.C.O.; Vieira, D.M.S. Growth analysis of green-leaf lettuce under different sources and doses of organic and mineral fertilization. Rev. Col. Cienc. Hortic. 2019, 13, 237–247. [Google Scholar] [CrossRef]
  8. Castoldi, R.; Charlo, H.C.O.; Vargas, P.F.; Braz, L.T. Crescimento, acúmulo de nutrientes e produtividade da cultura da couve-flor. Hortic. Bras. 2009, 27, 438–446. [Google Scholar] [CrossRef] [Green Version]
  9. Grangeiro, L.C.; Costa, K.R.; Medeiros, M.A.; Salviano, A.M.; Negreiros, M.Z.; Bezerra Neto, F.; Oliveira, S.L. Acúmulo de nutrientes por três cultivares de alface cultivadas em condições do semiárido. Hortic. Bras. 2006, 24, 190–194. [Google Scholar] [CrossRef]
  10. Torres, J.L.R.; Silva, G.G.; Charlo, H.C.O.; Loss, A.; Lemes, E.M.; Vieira, D.M.S. Lettuce crop fertilized with organomineral source of phosphorus and micronutrients. Hortic. Bras. 2022, 40, 402–403. [Google Scholar] [CrossRef]
  11. Guppy, C.N.; Menzies, N.W.; Blamey, F.P.C.; Moody, P.W. Do decomposing organic matter residues reduce phosphorus sorption in highly weathered soils? Soil Sci. Soc. Am. J. 2005, 69, 1405–1411. [Google Scholar] [CrossRef]
  12. Hansel, F.D.; Amado, T.J.C.; Bortolotto, R.P.; Trindade, B.S.; Hansel, D.S.S. Influence of different phosphorus sources on fertilization efficiency. Appl. Res. Agrotechnol. 2014, 7, 103–111. [Google Scholar] [CrossRef]
  13. Borges, B.M.M.N.; Abdala, D.B.; Souza, M.F.; Viglio, L.M.; Coelho, M.J.A.; Pavinato, P.S.; Franco, H.C.J. Organomineral phosphate fertilizer from sugarcane byproduct and its effects on soil phosphorus availability and sugarcane yield. Geoderma 2019, 339, 20–30. [Google Scholar] [CrossRef]
  14. Yuri, J.E.; Resende, G.M.; Mota, J.H.; Rodrigues Júnior, J.C.; Souza, R.J.; Carvalho, J.G. Comportamento da alface americana em função do uso de doses e épocas de aplicação de boro em cultivo de inverno. Hortic. Bras. 2004, 22, 593–596. [Google Scholar] [CrossRef]
  15. Marschner, H. Mineral Nutrition of Higher Plants, 3rd ed.; Elsevier: London, UK, 2012; 643p. [Google Scholar]
  16. Pol, C.H.; Nogaroli, J.A. Omissão de nutrientes na cultura da alface (Lactuca sativa L.). Rev. Tuiuti Ciência Cult. 2020, 6, 68–87. [Google Scholar] [CrossRef]
  17. Rodrigues, M.; Pavinato, P.S.; Withers, P.J.A.; Teles, A.P.B.; Herrera, W.F.B. Legacy phosphorus and no tillage agriculture in tropical oxisols of the Brazilian savanna. Sci. Total Environ. 2016, 542, 1050–1061. [Google Scholar] [CrossRef]
  18. Alvarez, V.H.V.; Novais, R.F.; Barros, N.F.; Canturutti, R.B.; Lopes, A.S. Interpretação dos resultados das análises de solos. In Recomendações para Uso de Corretivos e Fertilizantes em Minas Gerais: 5ª Aproximação; Ribeiro, A.C., Guimarães, P.T.G., Alvarez, V.H.V., Eds.; Comissão de Fertilidade do solo do Estado de Minas Gerais: Viçosa, Brazil, 1999; pp. 25–32. [Google Scholar]
  19. Bergamin, L.G.; Cruz, M.C.P.; Ferreira, M.E.; Barbosa, J.C. Produção de repolho em função da aplicação de boro associada a adubo orgânico. Hortic. Bras. 2005, 23, 311–315. [Google Scholar] [CrossRef] [Green Version]
  20. Kiehl, E.J. Fertilizantes Organominerais, 4th ed.; Degaspari: Piracicaba, Brazil, 2008; 160p. [Google Scholar]
  21. Beck, H.; Zimmermann, N.; Mcvicar, T.; Vergopolan, N.; Berg, A.; Wood, E.F. Present and future Koppen-Geiger climate classification maps at 1-km resolution. Sci. Data 2018, 5, 180214. [Google Scholar] [CrossRef] [PubMed] [Green Version]
  22. INMET. Gráficos. Available online: http://www.inmet.gov.br/portal/index.php?r=tempo/graficos (accessed on 5 April 2019).
  23. Soil Survey Staff. Keys to Soil Taxonomy, 12th ed.; United States Department of Agriculture-Natural Resources Conservation Service: Washington, DC, USA, 2014; 360p.
  24. Ribeiro, A.C.; Guimarães, P.T.G.; Alvarez, V.V.H. Recomendações para o Uso de Corretivos e Fertilizantes em Minas Gerais: 5ª Aproximação; UFV: Viçosa, Brazil, 1999; 359p. [Google Scholar]
  25. Hargreaves, G.H.; Samani, Z.A. Estimating potential evapotranspiration. J. Irrig. Drain. Div. 1982, 108, 225–230. [Google Scholar] [CrossRef]
  26. Martinez, H.E.P.; Carvalho, J.G.; Souza, R.B. Diagnose foliar. In Recomendações para o Uso de Corretivos e Fertilizantes em Minas Gerais: 5ª. Aproximação; Ribeiro, A.C., Guimarães, P.T.G., Alvarez, V.V.H., Eds.; Universidade Federal de Viçosa: Viçosa, Brazil, 1999; pp. 143–168. [Google Scholar]
  27. Silva, F.C. (Ed.) Manual de Análises Químicas de Solos, Plantas e Fertilizantes, 2nd ed.; Embrapa Informação Tecnológica: Brasília, Brazil, 2009; 627p. [Google Scholar]
  28. Bataglia, O.C.; Furlani, A.M.C.; Teixeira, J.P.F.; Furlani, P.R.; Gallo, J.R. Métodos de análise química de plantas; Boletim técnico n. 78; Instituto Agronômico: Campinas, Brazil, 1983; 48p.
  29. Malavolta, E.; Vitti, G.C.; Oliveira, S.A. Avaliação do estado nutricional das plantas: Princípios e aplicações; POTAFOS: Piracicaba, Brazil, 1997; 201p. [Google Scholar]
  30. Ferreira Junior, J.J.; Torres, J.L.R.; Charlo, H.C.O.; Orioli Júnior, V.; Loss, A.; Barreto, A.C. No-till broccoli production using different cover crop residues and nitrogen doses. Hortic. Bras. 2023, 41, e2479. [Google Scholar] [CrossRef]
  31. Silva, L.O.D. Influência de doses e modos de aplicação de fósforo e determinação da curva de acúmulo de nutrientes na cultura do repolho. Master’s Dissertation, Universidade Federal de Viçosa, Viçosa, Brazil, 2016; 53p. [Google Scholar]
  32. Trentini, H.; Hojo, E.T.D. Uso de adubação orgânica e mineral na produtividade de alface americana cv. Amélia. Cult. Sab. 2019, 1, 83–90. [Google Scholar]
  33. Rodrigues, A.R.S.P. Viabilidade do uso de aditivos organominerais: Ênfase na produção sustentável de alimentos. Rev. Int. Saú. Hum. Tecn. 2023, 11, 1635–1642. [Google Scholar] [CrossRef]
  34. Lana, R.M.Q.; Zanão Júnior, L.A.; Luz, J.M.Q.; Silva, J.C. Produção da alface em função do uso de diferentes fontes de fósforo em solo de Cerrado. Hortic. Bras. 2004, 22, 525–528. [Google Scholar] [CrossRef]
  35. Oliveira Júnior, P.P.; Ferreira, R.L.F.; Araújo Neto, S.E.; Souza, L.G.S. Rendimento de alface em ambientes de cultivo utilizando mudas produzidas com volume crescente de substrato. Sci. Nat. 2020, 2, 499–507. [Google Scholar]
  36. Borges, E.C.; Schmid, D.M.; Saul, L.T.; Sordi, A. Produtividade de cultivares de alface (Lactuca sativa L.) em função de tipos de telas de sombreamento no município de Maravilha, SC. An. Pesq. Ext. Uno. São Mig. do Oeste 2020, 5, 1–9. [Google Scholar]
  37. Novais, R.F.; Smyth, T.J. Fósforo em solo e Planta em Condições Tropicais; Universidade Federal de Viçosa: Viçosa, Brazil, 1999; 399p. [Google Scholar]
  38. Trani, P.E.; Raij, B. Hortaliças. In Recomendações de adubação e calagem para o estado de São Paulo; Raij, B., Cantarella, H., Quaggio, J.A., Furlani, A.M.C., Eds.; Boletim técnico, 100; IAC: Campinas, Brazil, 1997; p. 163. [Google Scholar]
  39. Lana, A.M.Q.; Lana, R.M.Q.; Gozuen, C.F.; Bonotto, I.; Trevisan, L.R. Aplicação de reguladores de crescimento na cultura do feijoeiro. Biosc. J. 2009, 25, 13–20. [Google Scholar]
  40. Resende, A.V. Adubação Com Micronutrientes no Cerrado; Boletim Técnico; Embrapa Cerrado: Planaltina, Brazil, 2003; 41p. [Google Scholar]
  41. Araújo, A.P.; Machado, C.T.T. Fósforo. In Nutrição Mineral de Plantas; Fernandes, M.S., Ed.; SBCS: Viçosa, Brazil, 2006; pp. 253–280. [Google Scholar]
  42. Zanão Júnior, L.A.; Lana, R.M.Q.; Guimarães, E.C. Variabilidade espacial do pH, teores de matéria orgânica e micronutrientes em profundidade em um Latossolo Vermelho sob semeadura direta. Cienc. Rural 2007, 37, 1000–1007. [Google Scholar] [CrossRef] [Green Version]
  43. Silva, M.G.S.; Trevisan, A.R. Interações iônicas e seus efeitos na nutrição das plantas. Inf. Agron. 2015, 1, 10–16. [Google Scholar]
  44. Olsen, S.R. Micronutrients Interactions. In Micronutrients in Agriculture; Mortvedt, J.J., Giordano, P.M., Lindsay, W.L., Eds.; Soil Science Society of America: Madison, WI, USA, 1972; pp. 243–264. [Google Scholar]
  45. Loneragan, J.F.; Webb, M.J. Interactions between zinc and other nutrients affecting the growth of plants. In Zinc in Soil and Plants; Robson, A.D., Ed.; Kluwer Academic: Madison, WI, USA, 1993; pp. 119–134. [Google Scholar]
  46. Broadley, M.R.; Lochlainn, S.O.; Hammond, J.P.; Bowen, H.C.; Cakmak, I.; Eker, S.; Erdem, H.; King, G.J.; White, P.J. Shoot zinc (Zn) concentration varies widely within Brassica oleracea L.and is affected by soil Zn and phosphorus (P) levels. J. Hor. Sci. Biot. 2010, 85, 375–380. [Google Scholar] [CrossRef]
  47. Sinha, P.; Dube, B.K.; Chatterjee, C. Phosphorus stress alters boron metabolism of mustard. Commun. Soil Sci. Plant Anal. 2003, 34, 315–326. [Google Scholar] [CrossRef]
  48. Kaya, C.; Tuna, A.L.; Dikilitas, M.; Ashraf, M.; Koskeroglu, S.; Guneri, M. Supplementary phosfhorus can alleviate boron toxicity in tomato. Sci. Hortic. 2009, 121, 284–288. [Google Scholar] [CrossRef]
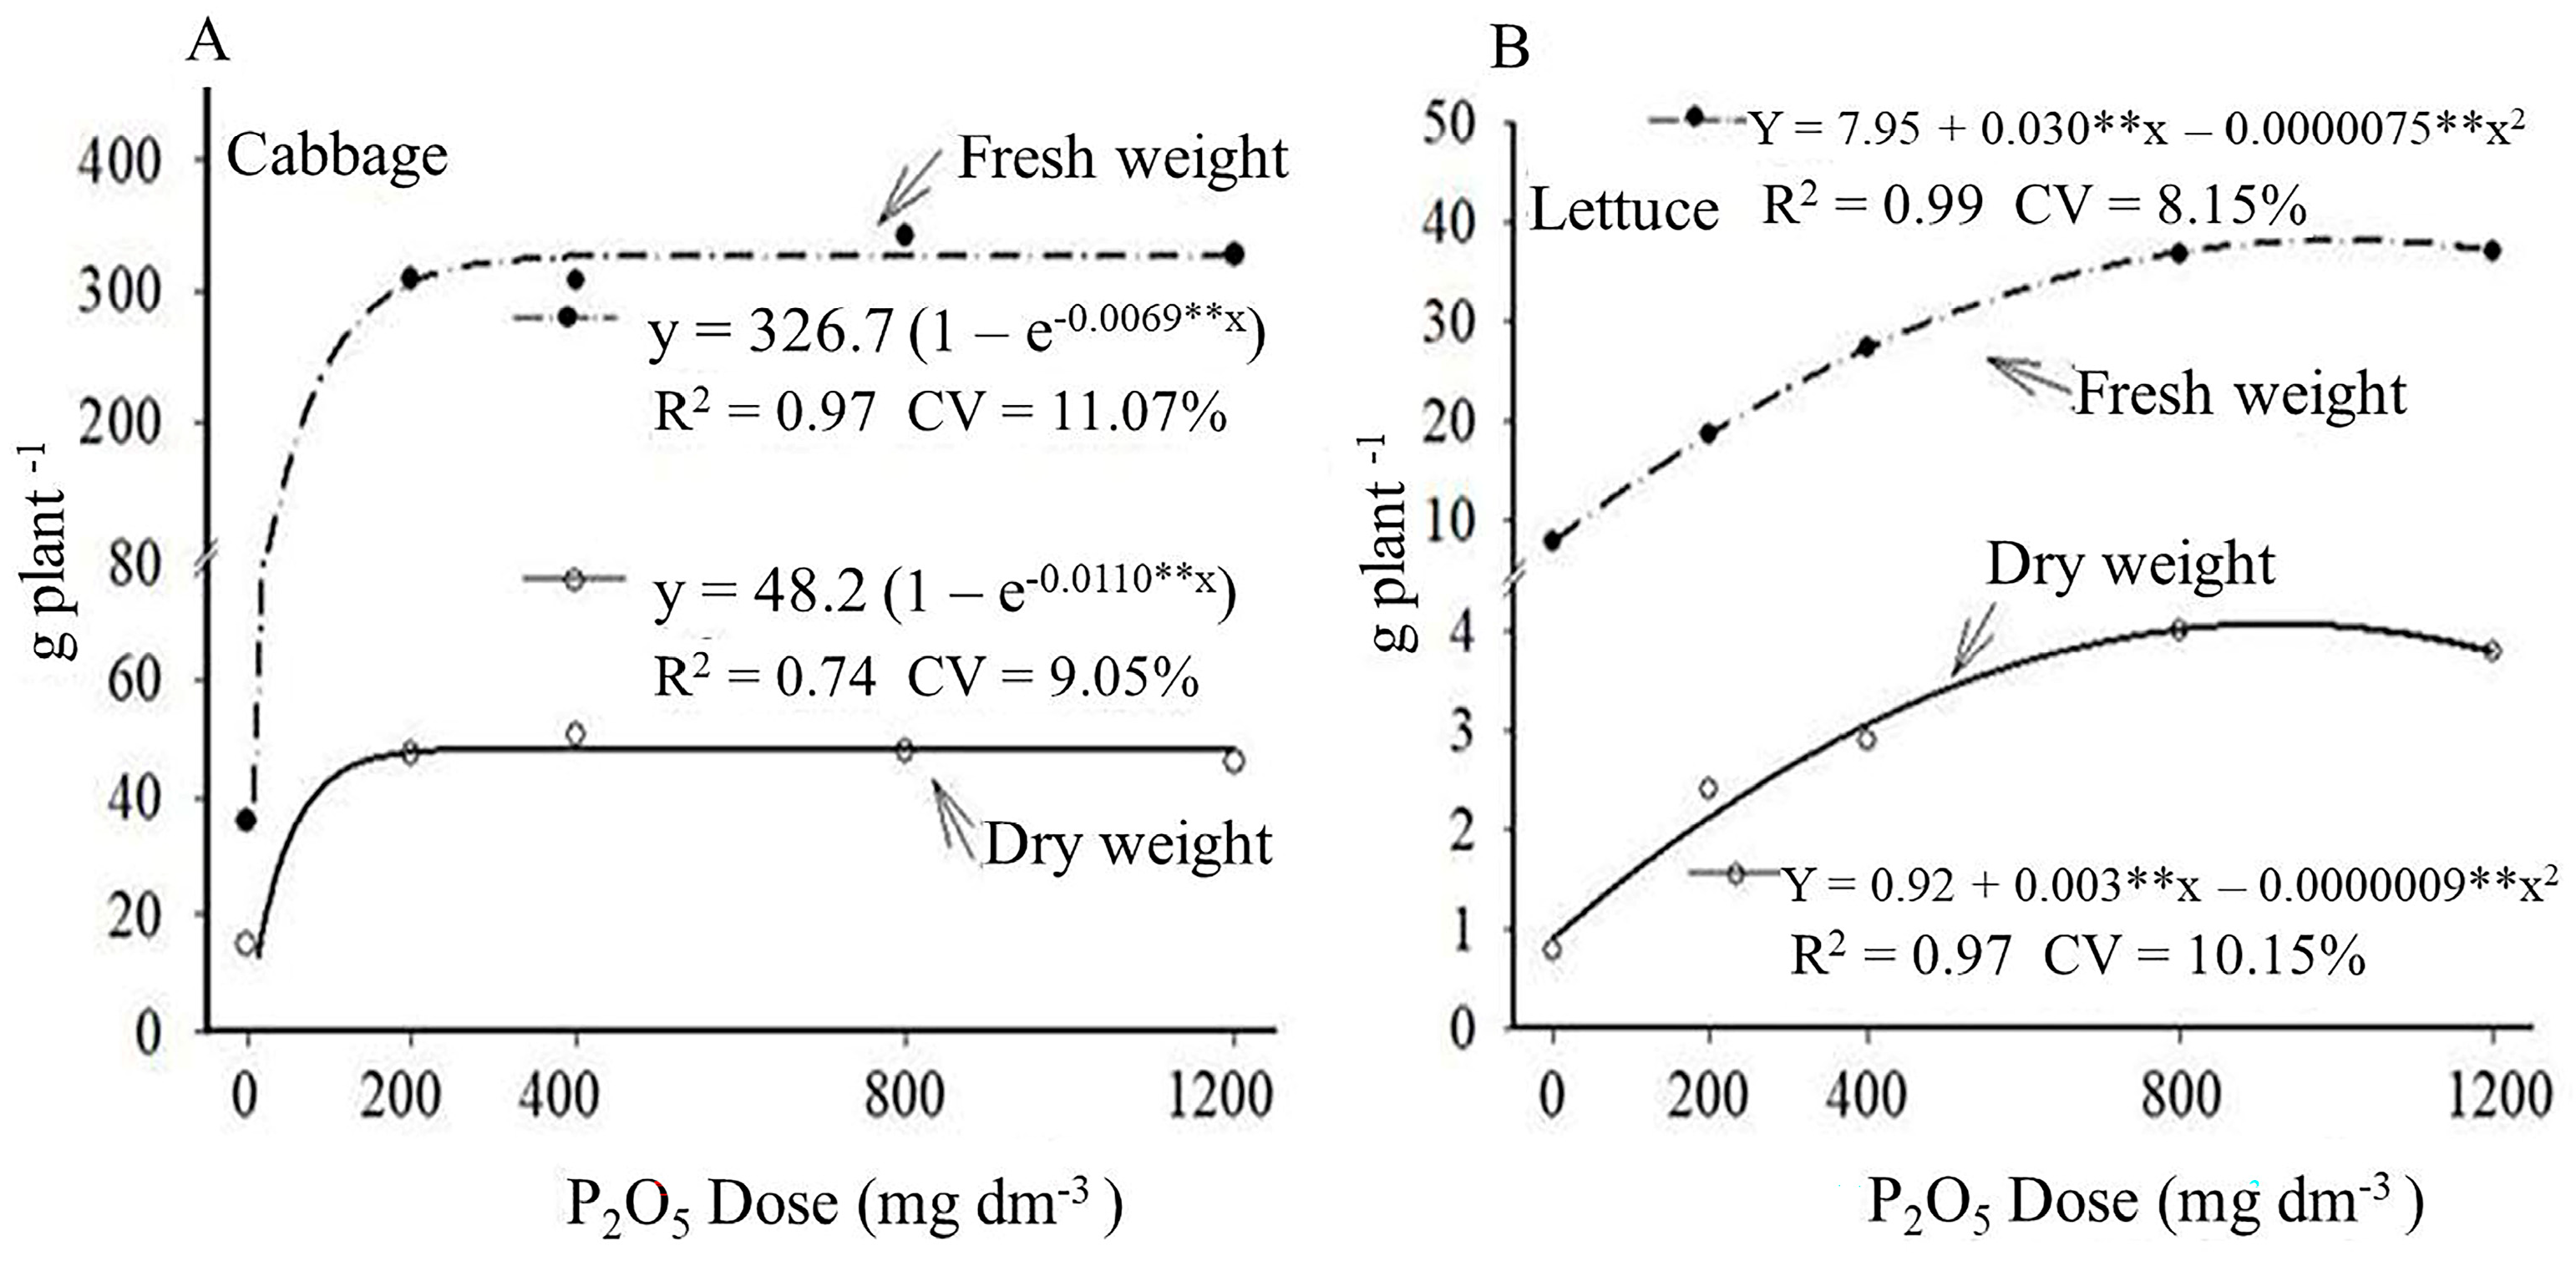
Figure 1. Fresh and dry weights of cabbage (A) and lettuce (B) as a function of P2O5 doses applied via organomineral fertilizer. ** = significant at 1%.
Horticulturae 09 00761 g001
Figure 2. Regression analysis curve fitting for soil P, B, and Zn availability after cabbage harvesting.
Horticulturae 09 00761 g002
Figure 3. Regression analysis curve fitting for soil P, B, and Zn availability after lettuce harvesting.
Horticulturae 09 00761 g003
Figure 4. Cabbage leaf P, Zn, and B content as a function of P2O5 doses applied via organomineral fertilizers.
Horticulturae 09 00761 g004
Figure 5. Lettuce leaf P, Zn, and B content as a function of P2O5 doses applied via organomineral fertilizers.
Horticulturae 09 00761 g005
Table 1. Fresh weights (FWs) and dry weights (DWs) of cabbage and lettuce grown with different organomineral fertilizers (OFs) in Uberaba, MG, Brazil.
DoseCabbageLettuce
P2O5FWDWFWDW
(mg dm−3)(g Planta−1)(g Planta−1)(g Planta−1)(g Planta−1)
0 (No P)35.8 b*14.8 b*7.9 e*0.8 d*
200—OF308.0 a47.5 a18.8 d*2.4 c*
400—OF308.3 a47.9 a27.4 c*2.9 c*
800—OF341.8 a50.5 a37.1 b*3.8 b*
1200—OF327.3 a46.1 a36.8 b*4.0 b*
200—MF281.2 a44.3 a45.1 a5.9 a
CV%18.212.720.721.0
Means followed by the same lowercase letters in the column do not differ according to Tukey’s test (p < 0.05). * = treatment with organomineral fertilizer (OF) differs from treatment with mineral fertilizer (MF) according to Dunnett’s test (p < 0.05). CV = coefficient of variation.
Table 2. The soil pH and B and Zn content after the application of different doses of organomineral fertilizer (OF) and mineral fertilizer (MF) observed during the growing of cabbage and lettuce in Uberaba, MG, Brazil.
Dose P2O5Soil pHPBZn
(mg dm−3)(H2O)(mg dm−3)(mg dm−3)(mg dm−3)
Cabbage
0 (No P)6.80 a*4.37 g*0.26 b+5.92 b+
200—OF6.70 b*12.40 e*0.30 a+13.45 a+
400—OF6.67 b*36.60 d*+0.40 a+14.20 a+
800—OF6.65 b*58.62 c*+0.44 a*+10.45 a+
1200—OF6.45 b*+152.50 b*+0.44 a*+10.50 a+
200—MF6.17 c+266.65 a0.27 b+13.37 a+
Initial6.80 a*8.50 f*0.12 c*0.47 c*
CV%1.6617.8322.3821.06
Lettuce
0 (No P)6.67 b*2.22 d*0.26 c2.42 c
200—OF6.50 b*8.45 d*0.30 c8.22 a*
400—OF6.30 c+9.48 d*0.31 c8.92 a+*
800—OF6.27 c+58.05 c*0.84 b+*12.42 a+
1200—OF5.97 d+160.45 b+*1.67 a+*4.12 b+
200—MF6.07 d+247.77 a+0.28 c1.67 c
Initial6.80 a*8.50 d*0.12 c0.47 d
CV%12.8026.3227.5934.62
Means followed by the same lowercase letters in each column do not differ according to Tukey’s test (p < 0.05). MF = mineral fertilizer. Initial = after liming and before applying the doses assessed. CV = coefficient of variation. * = treatment with OF differs from treatment with MF according to Dunnett’s test (p < 0.05). + = Treatment with OF or MF differs from the initial stage found in the soil after acidity correction and before planting according to Dunnett’s test (p < 0.05).
Table 3. Analysis of P, B, and Zn content in the leaves of cabbage and lettuce plants grown under different organomineral fertilizer (OF) and mineral fertilizer (MF) doses in Uberaba, MG, Brazil.
DoseCabbageLettuce
P2O5PBZnPBZn
(mg dm−3)(g kg−1)(mg kg−1)(mg kg−1)(g kg−1)(mg kg−1)(mg kg−1)
0 (No P)2.94 b103.17 c93.05 a*2.40 42.55 c*68.90 a*
200—OF2.99 b114.27 c76.62 b2.55 43.07 c*46.55 b
400—OF3.37 b141.70 c90.40 a*2.69 52.37 b*45.90 b
800—OF3.59 a365.22 a*51.85 c*2.84 91.25 a*38.40 c*
1200—OF4.61 a*228.02 b*27.80 d*2.7092.15 a*34.65 d*
200—MF3.37 b92.92 c71.07 b2.3731.67 d52.30 b
CV%15.3916.3916.3810.115.548.17
Means followed by the same lowercase letters in each column do not differ according to Tukey’s test (p < 0.05). MF = mineral fertilizer. CV = coefficient of variation. * = treatment with OF differs from treatment with MF according to Dunnett’s test (p < 0.05).
Disclaimer/Publisher’s Note: The statements, opinions and data contained in all publications are solely those of the individual author(s) and contributor(s) and not of MDPI and/or the editor(s). MDPI and/or the editor(s) disclaim responsibility for any injury to people or property resulting from any ideas, methods, instructions or products referred to in the content.