Article

Effect of Bat Guano and Biochar on Okra Yield and Some Soil Properties

by
Paulo Dimande
1,2,3,
Margarida Arrobas
3,4 and
Manuel Ângelo Rodrigues
3,4,*
1
Escola Superior de Desenvolvimento Rural, Universidade Eduardo Mondlane, Bairro 5º Congresso, VilanKulos 1304, Mozambique
2
Departamento de Biologia e Ambiente, Universidade de Trás-os-Montes e Alto Douro, Quinta de Prados, 5000-801 Vila Real, Portugal
3
Centro de Investigação de Montanha (CIMO), Instituto Politécnico de Bragança, Campus de Santa Apolónia, 5300-253 Bragança, Portugal
4
Laboratório para a Sustentabilidade e Tecnologia em Regiões de Montanha, Instituto Politécnico de Bragança, Campus de Santa Apolónia, 5300-253 Bragança, Portugal
*
Author to whom correspondence should be addressed.
Horticulturae 2023, 9(7), 728; https://doi.org/10.3390/horticulturae9070728
Submission received: 25 May 2023 / Revised: 15 June 2023 / Accepted: 19 June 2023 / Published: 21 June 2023
(This article belongs to the Section Plant Nutrition)

Abstract

:
The difficulty in obtaining commercial fertilizers by smallholder farmers in sub-Saharan Africa makes it very important to optimize the use of local organic resources. In VilanKulo, Mozambique, a study was carried out on okra (Abelmoschus esculentus) over two growing seasons. The soil was a haplic, loamy-sand textured Lixisol. As organic amendments, bat guano and biochar were used. Bat guano is a phosphorus (P)-rich and low-carbon (C)/nitrogen (N)-ratio material from natural deposits on a cave floor. Biochar is a C-rich material prepared via an artisanal process using forest residues as a feedstock. Bat guano was applied at two rates (5 and 10 t ha−1) just before sowing. It was also applied at the same rates one month before sowing. Biochar was used at two rates (5 and 10 t ha−1) applied at sowing. Biochar and guano were mixed at the rates of 1 and 4 t ha−1 and 2 and 8 t ha−1, respectively, and applied at sowing. The experiment also used a non-fertilized control. Field trials were arranged in a completely randomized design with three replicates. The treatments that received high rates of guano tended to show significantly higher fruit yields (>10 t ha−1 as the two-year average) in comparison with the control, which showed the lowest average okra fruit yield (6.21 t ha−1). In the guano treatments, the apparent recovery by okra of some important nutrients, such as N, was greater than the amount of the nutrient contained in the guano itself. This result, together with many others related to the tissue nutrient concentration, soil properties and residual fertilizing value in guano plots, indicated a strong mineralization of guano during the growing season. This was probably due to its low C/N ratio and favourable environmental conditions for the mineralization process. The result also suggests some kind of manuring effect, i.e., a fertilizing effect of guano beyond what can be explained by the nutrient supply. The use of biochar increased the total organic C in the soil and cation exchange capacity (CEC) compared with the control but did not affect the variables related to plant performance. Overall, the results showed that farmers can benefit from the use of guano in the short term because it releases nutrients, while with the use of biochar, the benefits can arise in the long term by improving the soil properties.

1. Introduction

The world’s okra (Abelmoschus esculentus (L.) Moench) production has increased over recent decades, reaching 10,822,249 t in 2021 [1]. Currently, the main producing continent is Asia (7,124,510 t), followed by Africa (3,600,881 t), the Americas (81,698 t) and Europe (9146 t) [1]. Okra can be grown in tropical, subtropical and warm temperate climates. Given this, and because it can be cultivated not only for food but also for several industrial purposes [2], it has the potential to become an even more economically important crop.
Okra is commonly valued for its green immature edible fruits. They contain water (~90%); carbohydrates (~7%); protein (~2%); fibres (alpha-cellulose, hemicellulose, lignin, pectin, etc.); and some important water-soluble vitamins and minerals, such as P, potassium (K), calcium (Ca), iron (Fe), magnesium (Mg) and zinc (Zn) [3]. It was also shown that okra may have many medicinal properties, such as antidiabetic, diuretic, anticancer, antioxidant, ophthalmic, cardiac and neurological effects [4,5,6]. Furthermore, due to the high content and quality of oil in its seeds and wide ecological adaptation, okra can be considered a contender as a source of oil for biodiesel production [7]. Okra has enormous potential to improve livelihoods in urban and rural areas of sub-Saharan countries due to the advantage of it being grown during the long warm season in these regions [8].
Another important issue for growing vegetables in Africa is the low fertility of the soil [9,10]. In the tropics, soil nutrients have been mined by small-scale farmers for decades because they do not use sufficient amounts of manure or fertilizer [11,12]. A sustainable approach to soil fertility management requires replenishing nutrients that are taken from the soil by cultivated plants [11,12]. There are different nutrient replacement techniques, but the most common is the use of commercial fertilizers, to which small-scale farmers do not generally have access for socioeconomic and geographic reasons. Thus, farmers must use all available fertilizing materials, especially organic amendments, to maintain soil fertility and the productivity of their crops.
In Mapinhane, VilanKulo district, southern Mozambique, there are natural deposits of bat excrement named guano that present a great opportunity for farmers to fertilize their crops. Previous studies showed a positive effect of applying guano in the improvement of soil properties and crop yields [13,14,15]. Farmers in this region have also learned how to make biochar through artisanal processes. Several studies also showed that biochar may enhance relevant soil properties, thereby improving its fertility [16,17,18]. Biochar may also improve crop growth and yield. A study using biochar in okra that was carried out under drought stress conditions showed a significant increase in plant growth and in several root morphological traits over the control [17]. The use of biochar was also tested in combination with NPK fertilizers, with results showing an improvement in various soil properties [18] or crop yield [19].
Thus, the hypotheses established for this study were as follows: (i) soil properties and/or crop productivity are improved by the application of bat guano and/or biochar, (ii) the early application of guano improves its effect on plants by bringing forward the release of nutrients, and (iii) the mixture of guano and biochar has synergistic effects that improve crop productivity.

2. Materials and Methods

2.1. Experimental Conditions

A field trial was carried out over two years in VilanKulo district, Joint Aid Management Life (JAM-Life) farm (21°59′05″ S, 35°09′39″ E), southern Mozambique. The plot where this trial took place has been cultivated with maize (Zea mays L.) as a monoculture for five years. VilanKulo experiences a semi-arid climate. Under the Köppen classification, it is located in the Aw type, which corresponds to a tropical savanna climate, or a wet and dry climate [20]. The climate in VilanKulo has two main seasons, the hot and rainy season (October to March) and the dry and cool season (April to September) [21]. Rainfall is erratic and is the environmental variable that raises major problems for the cultivation processes. The long-term average annual precipitation and temperature are 677 mm and 24.2 °C, respectively. The monthly variation in temperature and precipitation is shown in Table 1 [22].
The soil was a haplic Lixisol according to the FAO classification [23]; it is very weathered and derived from limestone [24]. At the beginning of the field trials, the plots of the land where okra was sown had the properties shown in Table 2.

2.2. Trial Layout and Treatments

The field trial was performed during the growing seasons of 2017/2018 and 2018/2019. The experiment was arranged as a factorial design with two factors: year and soil amendment. Guano was applied shortly before sowing at rates of 5 t ha−1 (G5) and 10 t ha−1 (G10). It was also applied one month before sowing at 5 t ha−1 (G5(-1)) and 10 t ha−1 (G10(-1)). Biochar was applied only at sowing at rates of 5 t ha−1 (B5) and 10 t ha−1 (B10). Biochar and guano were mixed in different combinations, namely, 1 + 4 t ha−1 (B1G4) and 2 + 8 t ha−1 (B2G8), to obtain two more treatments. The experimental design also included an unfertilized control. The rates of guano and biochar were set after considering the real possibility of having an effect on the crop and these amounts being effectively available to farmers. All treatments were laid out in the experimental area in three replicates and arranged in plots measuring 3.85 m × 2.40 m.
The guano used in this study was bat excrement, which was locally available from natural deposits. This organic material is often used by farmers as a soil amendment. Biochar is also a local material prepared from forest residues that are collected from sawmills and spontaneous vegetation. Biochar was prepared through an artisanal method of slow pyrolysis, which consisted of heating the biomass (feedstock) for one day in a reactor made from two metallic drums. For more details about slow pyrolysis, the reader is referred to Chun et al. [25]. Some properties of the guano and biochar used in this study are shown in Table 3.

2.3. Field Plot Management

The plots where this study took place were previously used for the production of maize monoculture. The soil was prepared mechanically using a disc plough and disc harrow in October, at the beginning of the hot season. Organic amendments were applied on two dates depending on the treatment, one month before and just before sowing.
In the growing season of 2017/2018, guano was applied on 11 November and 11 December 2017, with the latter also being the date of application of biochar and sowing. In the following season of 2018/2019, guano was applied on 8 February and 8 March 2019. On March 8, biochar was also applied and sowing was carried out. An open-pollinated variety of okra, namely, cv. Clemson Spineless, which is commonly grown in this region and available in local markets, was sown at a 0.77 m × 0.30 m spacing under a drip irrigation system with an allocation of ~2500 m3 water per growing season. The control of weeds was performed by hand during the two growing seasons. Okra was harvested twice a year on 14 and 30 March 2018, and the yield was reported as the sum of the two harvests. In 2019, the harvests took place on 23 June and 13 July.

2.4. Sampling Soils and Plant Tissues and Field Measurements

Three composite soil samples (10 individual cores per sample) were collected from the 0–0.20 m depth with a stainless steel handheld soil sampler for the initial soil characterization. At the end of each annual field trial, the soil was sampled again (5 individual cores per sample) at the same depth for the determination of the effect of the treatments on the general soil properties. It was also used to perform a pot experiment serving as a biological index of soil nutrient availability. After sampling, the soil was air-dried and sieved (2 mm mesh).
The plant height and phenological stages (BBCH (Biologische Bundesanstalt, Bundessortenamt und CHemische Industrie) scale) [26] were assessed periodically during the growing season. The plant height was measured using a meter from the ground to the highest point of the plant (leaves or male inflorescence).
Leaf samples were collected for elemental analysis and the monitoring of the plant’s nutritional status between the two principal growth stages “6—Flowering” and “7—Development of fruit” [26] when the crop had more than fifteen extended internodes. Twelve randomly selected young mature leaves were collected per experimental unit.
Okra was harvested by hand when the fruits were still tender and edible, namely, at the 71 growth stage [26], to obtain the crop yield. The aboveground biomass of the plant was also collected, weighed and dried to determine the total dry matter yield (DMY) and for determination of nutrient removal and apparent nutrient recovery after the determination of tissue elemental composition.

2.5. Pot Experiment

Subsamples of the soil taken at the end of the field trial were used for assessing the residual effect of the treatments on cabbage (Brassica oleracea L., cv. Tronchuda) that was grown in a pot experiment. The goal was to obtain a biological index of soil nutrient availability. Pots with 2.5 kg of dried soil were placed in an open space but protected from direct solar radiation on their sides with newsprint to prevent overheating of the rooting zone. In the first growing season, the cabbage was grown from 1 July to 16 August 2018, and in the second growing season from 29 August to 15 October 2019. Weeds that germinated in the pots were immediately removed by hand. The plants were watered by applying 150 mL of water per pot whenever there was insufficient precipitation. Plants were cut at ground level at phenological stage 18, corresponding to eight or more true unfolded leaves [26]. Thereafter, they were oven-dried at 70 °C and weighed and ground (1 mm mesh) before the elemental analysis.

2.6. Laboratory Analyses

Soil samples were air-dried and sieved (2 mm mesh) before the laboratory analysis. Soil samples were analyzed for pH (H2O, KCl) (soil:solution, 1:2.5), CEC (ammonium acetate, pH 7.0), exchange acidity (KCl extraction), easily oxidizable C (wet digestion, Walkley–Black method), total organic C (incineration), extractable P and K (ammonium lactate) and texture (soil fractions clay, silt and sand) [27]. Soil boron (B) was extracted using hot water and determined via the azomethine-H method [28]. Soil Fe, Zn, manganese (Mn) and copper (Cu) were extracted using ammonium acetate and EDTA and determined via atomic absorption spectrometry [29].
Okra samples of fruits, leaves and stalks, cabbage tissues and organic amendment samples were oven-dried at 70 °C and ground (1 mm mesh). The analyses of tissue samples for N were performed via the Kjeldahl method; for P and B via colorimetry; for K via flame emission spectrometry; and for Ca, Mg, Cu, Fe, Zn and Mn via atomic absorption spectrophotometry [30]. Guano and biochar were also analyzed for total organic C via incineration and for pH (organic amendment:solution, 1:2.5).

2.7. Data Analysis

The statistical software SPSS Statistics (v. 25, IBM SPSS, Chicago, IL, USA) was used for the data analysis. First, data were tested for normality and homogeneity of variances using the Shapiro–Wilk and Levene’s tests, respectively. The comparison of the effect of the treatments was provided via two-way ANOVA. When significant differences between soil treatments were found (p < 0.05), the multiple-range Tukey’s HSD test (α = 0.05) was used for the mean separation.

3. Results

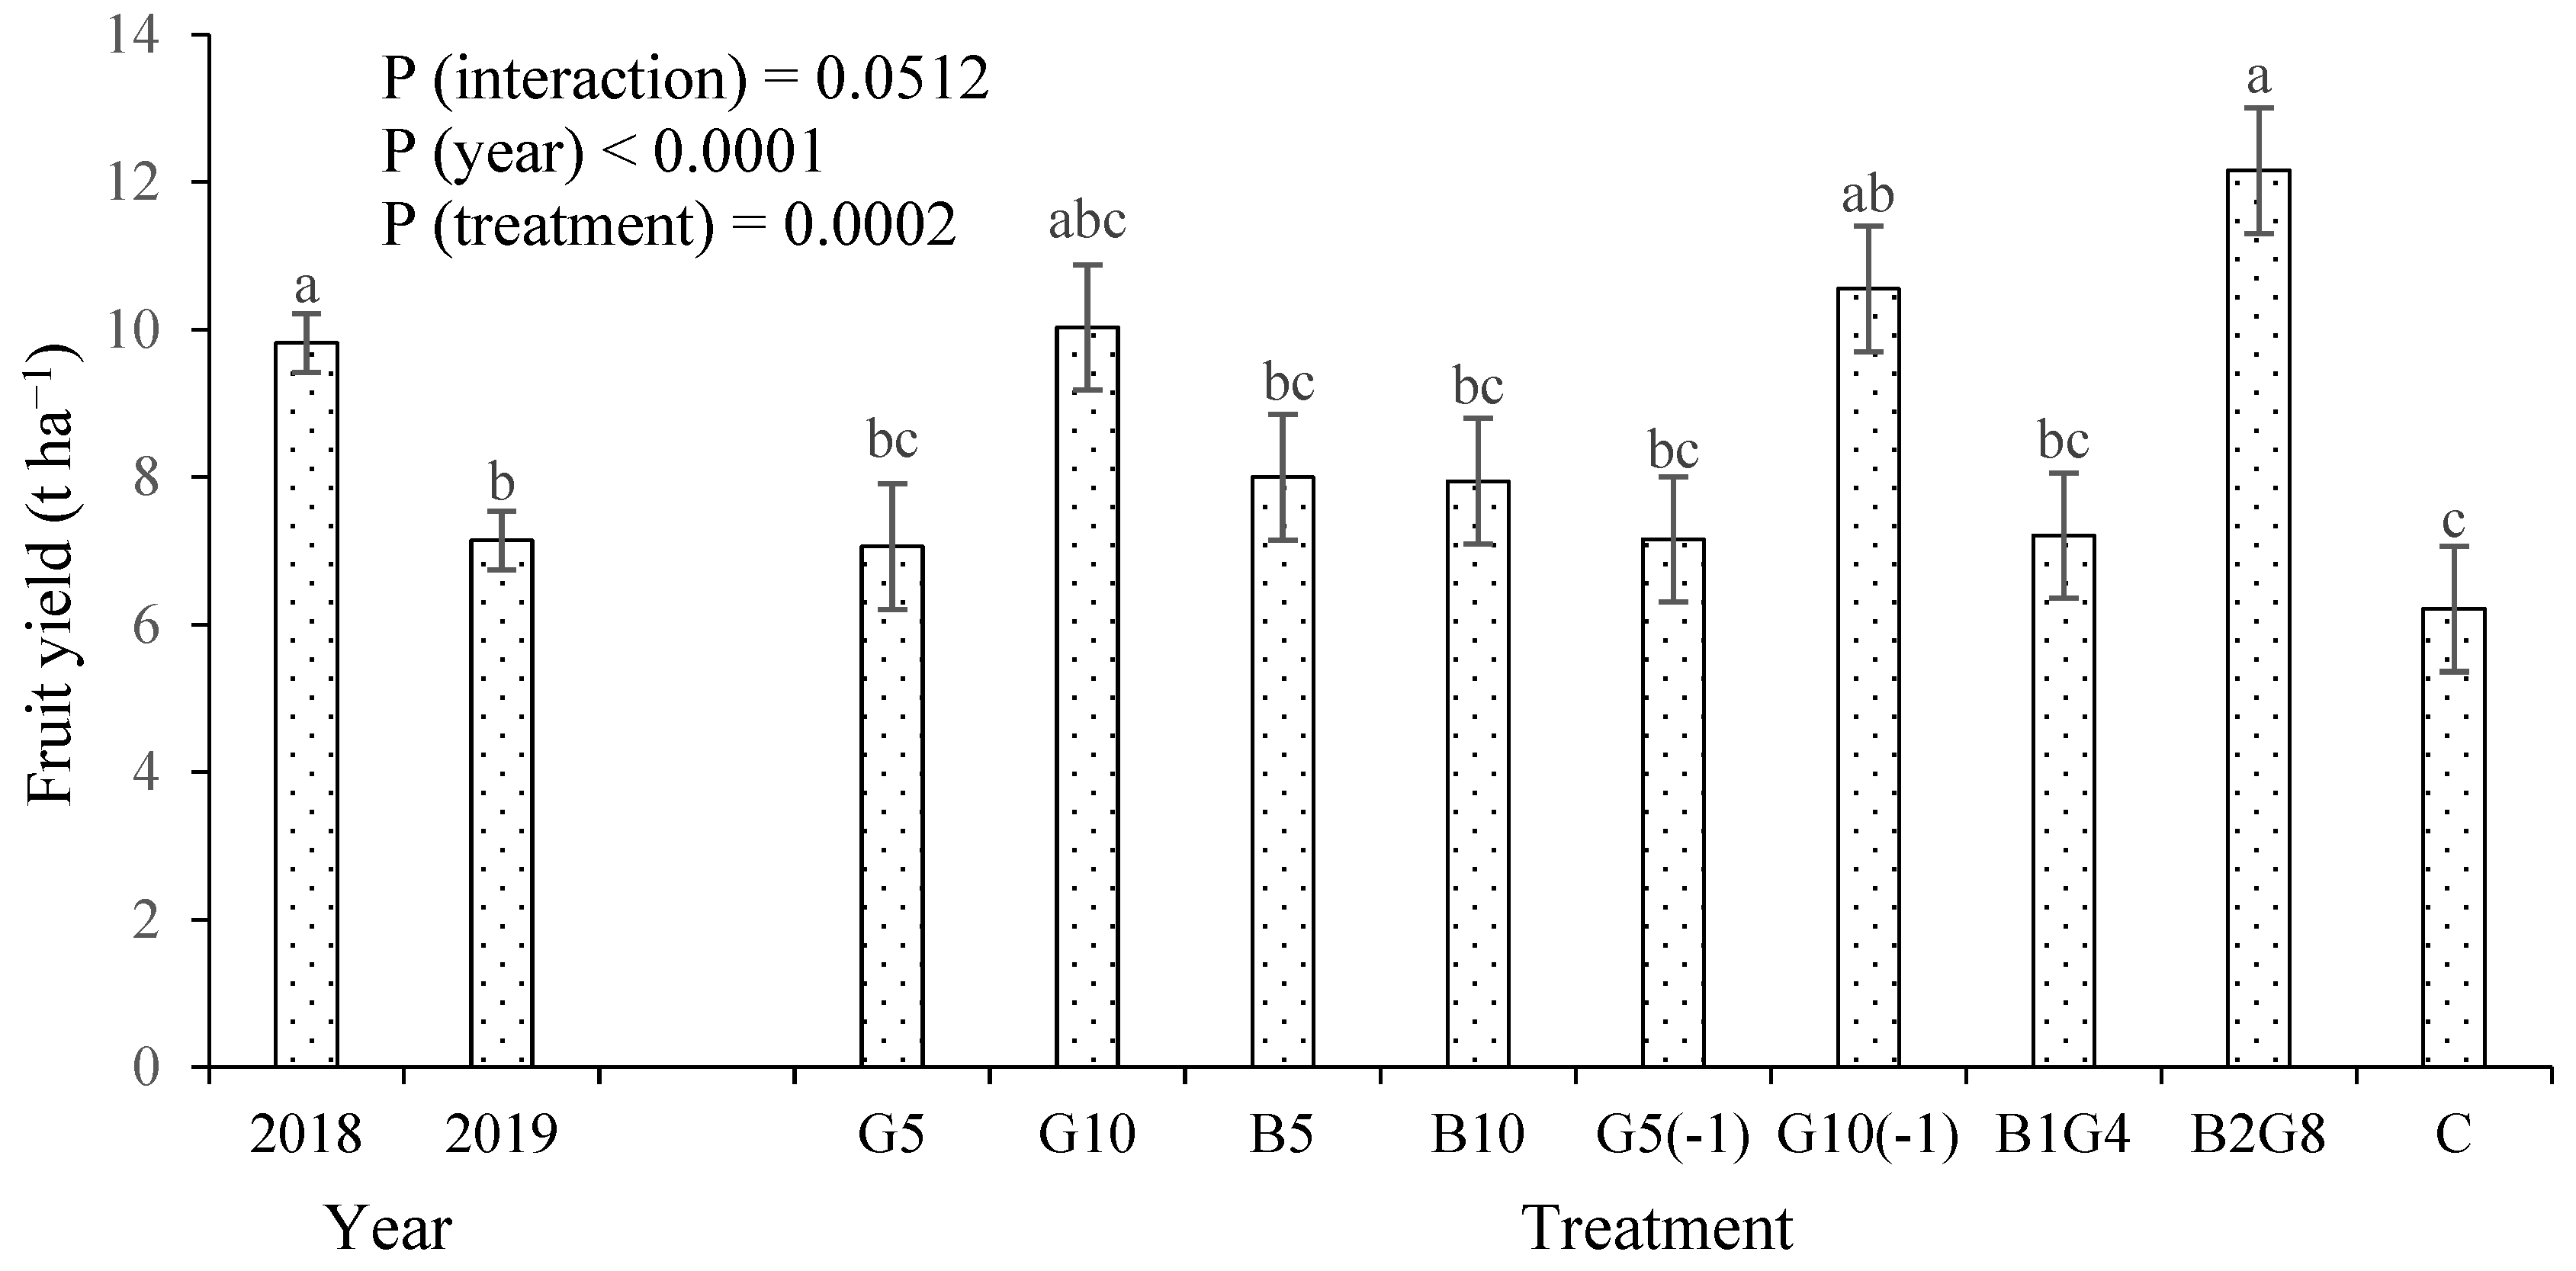
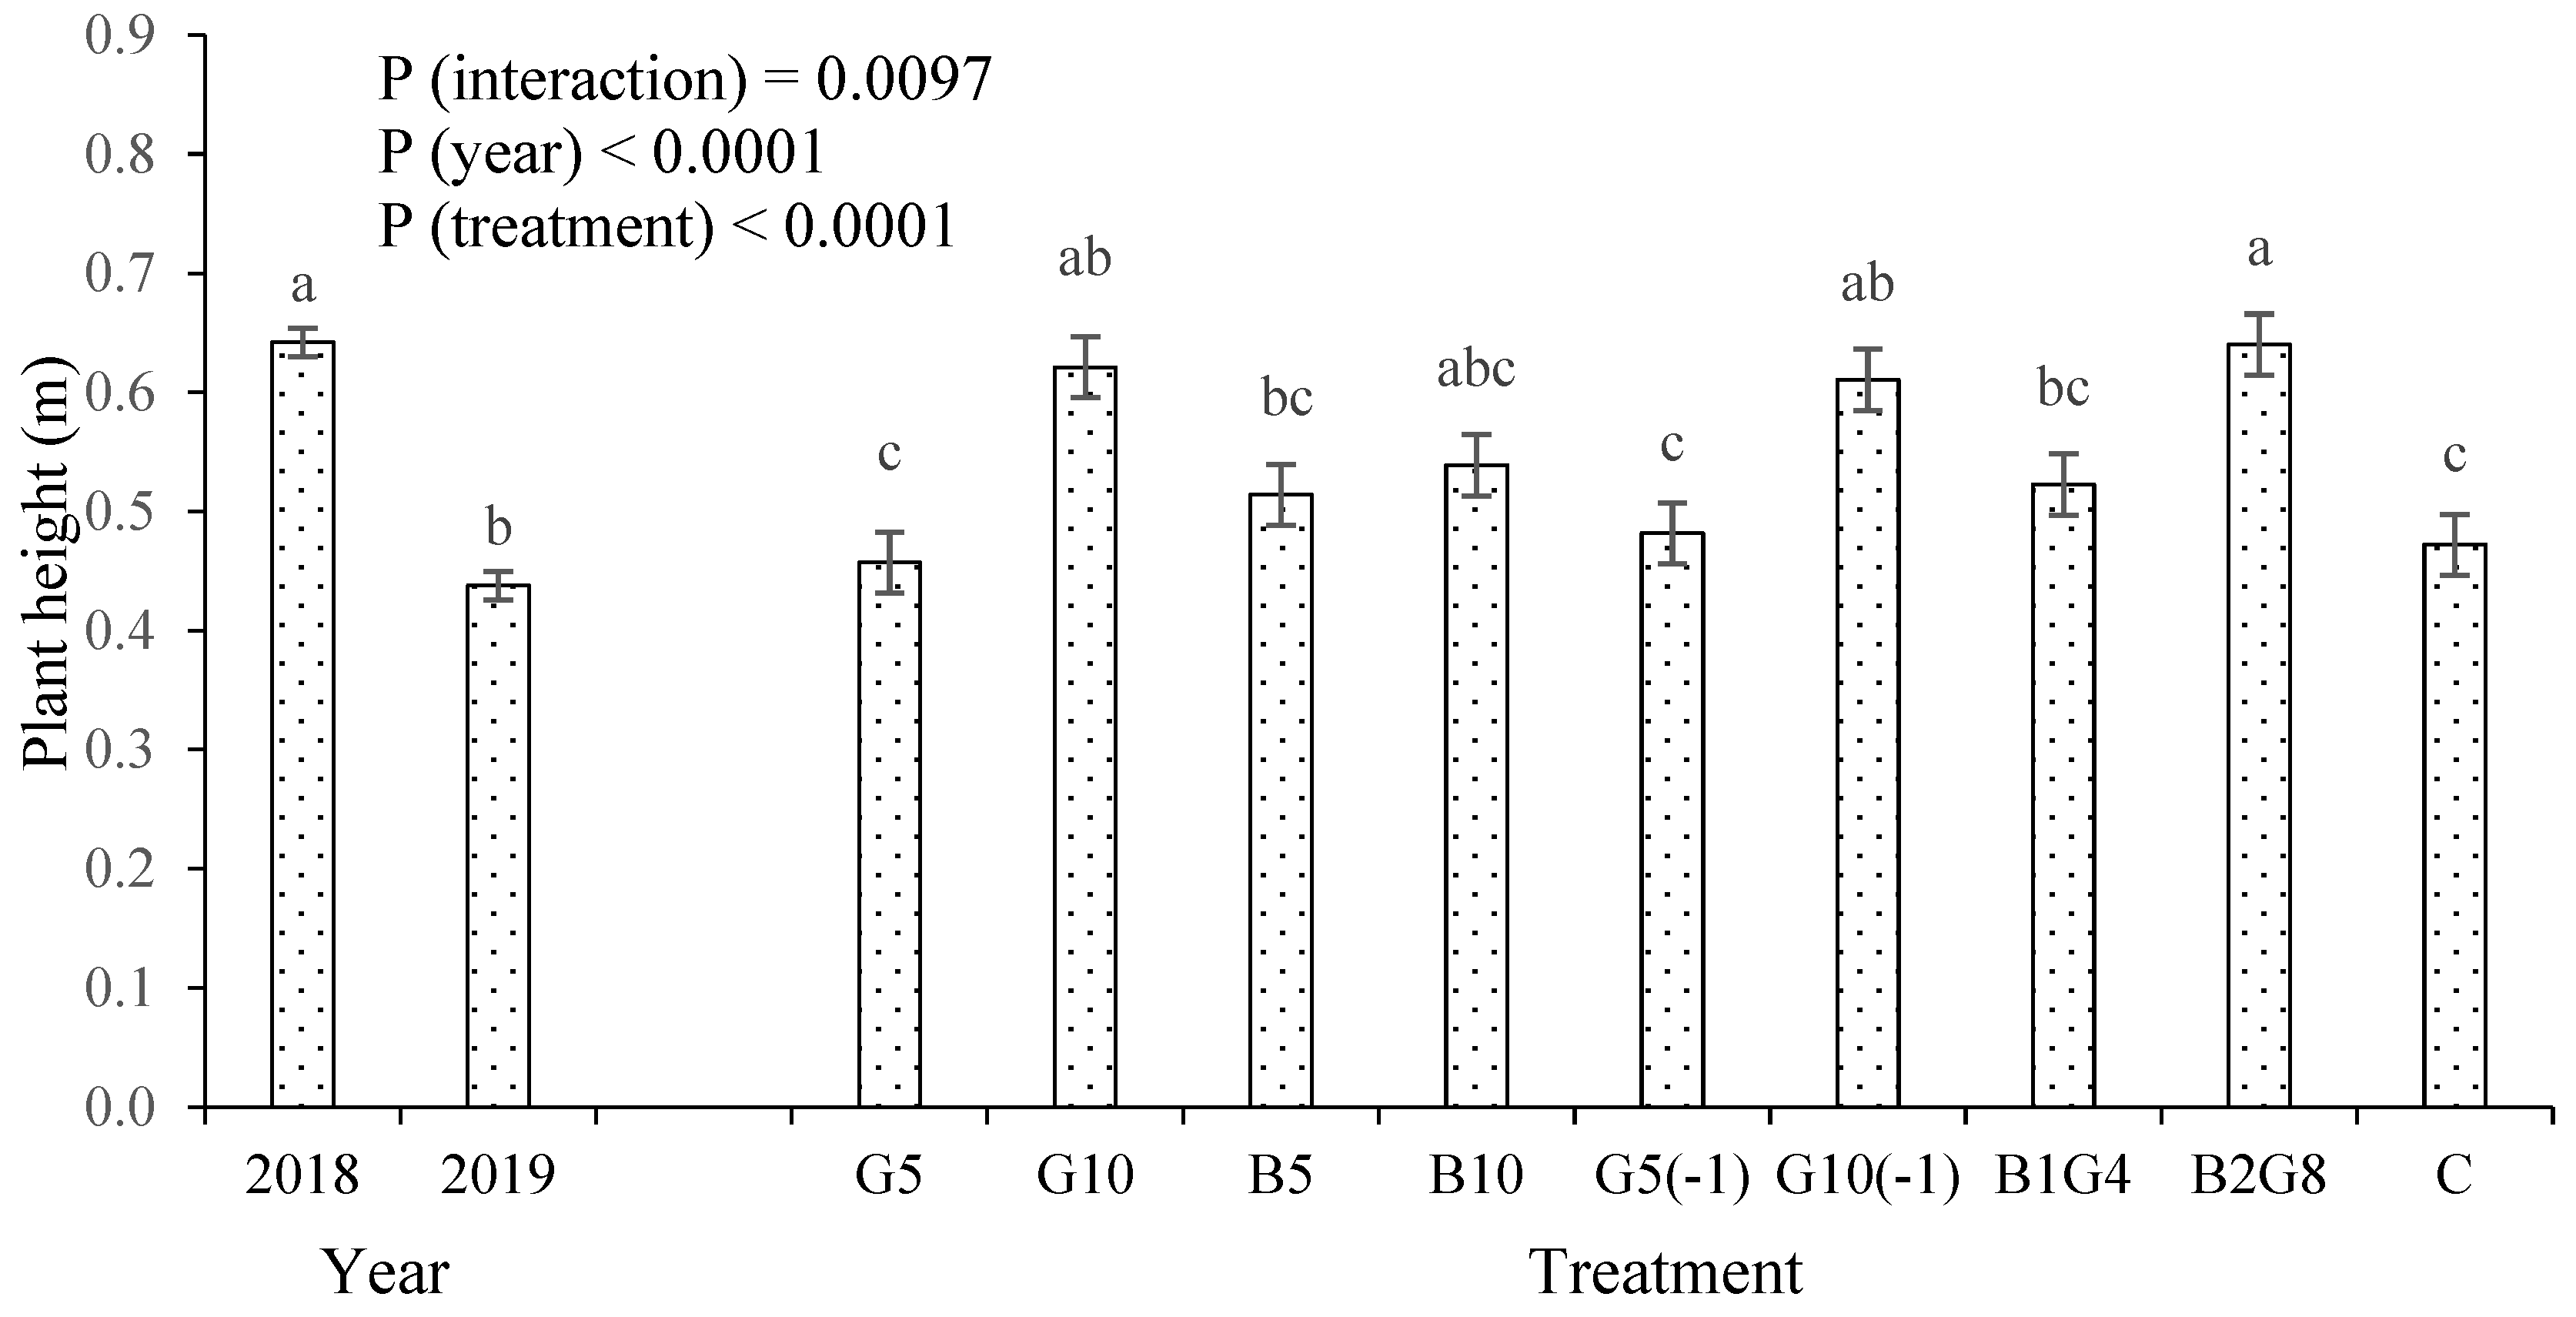
3.1. Okra Fruit Yield and Plant Height

No significant interaction (p = 0.0512) was found between the years and soil amendment treatments in the okra fruit yield (Figure 1). Crop production, however, varied significantly between the years and between soil amendment treatments. The okra fruit yield was significantly higher in 2018 (9.82 kg ha−1) in comparison with 2019 (7.14 kg ha−1). The treatments that received high rates of guano tended to show higher fruit yields, with the highest average value recorded in the treatment B2G8 (12.16 t ha−1), followed by G10(-1) (10.55 t ha−1) and G10 (10.03 t ha−1). The control treatments displayed the lowest okra fruit yield (6.21 t ha−1), although this value was only significantly lower than those of treatments B2G8 and G10(-1).
The pattern of response to the year and soil amendments for the plant height variable (Figure 2) was similar to that reported for the okra fruit yield (Figure 1). However, the interaction between the two factors, namely, year and soil amendment, was significant. In 2018, the plants reached a higher height than in 2019 (0.64 and 0.44 m, respectively). As observed for fruit production, the treatments that included high rates of guano gave taller plants regardless of year, despite the significant interaction between factors. The three treatments in which the plants reached the highest average heights were B2G8 (0.64 m), G10 (0.62 m) and G10(-1) (0.61 m), and the three treatments in which the plants were shorter were G5 (0.46 m), C (0.47 m) and G5(-1) (0.48 m).

3.2. Plant Nutritional Status and Nutrient Recovery

The leaf N concentration varied significantly between years but not with the soil amendment treatments (Table 4). In 2018, the average value was 20.8 g kg−1, and in 2019, it was 30.3 g kg−1. This difference was probably the result of a dilution effect since in 2018, the plants produced more fruit. In 2018, the average leaf N concentration was below the lower limit of the sufficiency range. The leaf P concentration varied significantly between the years and treatments. In 2018, the leaf P values were higher than in 2019. A tendency towards higher values was observed in the treatments receiving the higher rates of guano. Thus, the higher average values were found in the treatments G10(-1) (4.6 g kg−1) and G10 (4.2 g kg−1), and the lower values were found in the B10 (3.0 g kg−1) and the control (3.1 g kg−1) treatments. The leaf K concentration was significantly higher in 2019 in comparison with 2018. The leaf K concentration did not vary significantly nor was any trend observed between the soil amendment treatments. The leaf B levels varied significantly between years and showed significant differences between treatments, with a clear trend towards higher values in the treatments receiving the higher rates of guano. The other analyzed macro- and micronutrients behaved identically to that of K without significant differences and/or any tendency as a function of soil amendment type and rate (data not shown).
The nutrient recovery was estimated from the plant’s total DMY and the concentration of nutrients in its tissues. The results obtained for N, P, K and B are presented in Table 5. In comparison with the concentration of nutrients in leaves, which is subject to dilution and concentration effects, this variable showed much clearer differences between the treatments. For instance, the N recovery varied significantly between the treatments, and it was clear that the plants grown under the treatments receiving the higher rates of guano displayed higher average values. Thus, comparing these results with those in Table 4, it seems that they reflected the effect of treatments on crop production much more than on N concentration in plant tissues. The P, K and B recoveries followed the pattern reported for N. K is the most paradigmatic example since there was no trend attributable to the effect of the treatments on the K concentration in the leaves, but they showed higher K recovery values associated with the treatments that led to higher crop yields.
The apparent nutrient recovery measures the amount of nutrients taken up by the plant in relation to the amount of nutrients applied as a fertilizer or a soil amendment. The apparent recovery values of N, P, K and B (ANR, APR, AKR and ABR, respectively) of the treatments that received guano are shown in Table 6. In 2018, the ANR ranged from 42.0% (G5(-1)) to 146.8% (G5) and in 2019 from 32.1% (G5(-1)) to 127.0% (B2G8). Thus, it seems that the result did not depend on the rate of guano applied. In both years, some values were greater than 100%, which means that the plants took up more N than was contained in the applied guano. The APR varied between 18.6 and 40.2% in 2018 and between 10.2 and 23.9% in 2019, also regardless of the guano rate. In 2018, the AKR showed particularly high values, well above 100%, and in 2019, which was the least productive year for the okra, values varied between 21.2% and 185.9%. In 2019, it appears that the most productive plots had higher AKR values. The ABR ranged from 127.1 to 195.0% in 2018 and between 40.9 and 84.0% in 2019. The values were significantly higher in 2018, which was the most productive year, compared with 2019. In 2019, the higher values were associated with the most productive plots.

3.3. Soil Properties

The total organic C varied significantly between the years and between the treatments (Table 7). B10 recorded the highest average value (13.6 g kg−1). The control showed the lowest average value (8.7 g kg−1). Easily oxidizable C also varied significantly between the years and treatments. The higher average values were associated with the treatments receiving high rates of guano, such as G10 (8.2 g kg−1), G10(-1) (8.0 g kg−1) and B2G8 (8.0 g kg−1). The soil pH did not vary significantly between the years and soil amendment treatments. The average values ranged between 6.7 and 6.9. The levels of available P in the soil varied significantly between the years and treatments. The highest values, which were significantly different from those of the control, were associated with the treatments consisting of the higher guano rates, namely, G10(-1) (66.7 mg kg−1, P2O5) and G10 (63.4 mg kg−1, P2O5). The control treatment again presented the lowest average value (31.9 mg kg−1, P2O5).
The exchangeable Ca varied significantly between the years and treatments (Table 8). The average value was significantly higher in 2019 than in 2018. Regarding the soil amendment treatments, the highest mean values of exchangeable Ca were found in the treatments that received biochar, namely, B10 (5.36 cmolc kg−1) and B5 (4.53 cmolc kg−1), whose values were significantly different from those of the control (3.43 cmolc kg−1). The exchangeable Mg and K did not differ significantly between the treatments, although the exchangeable Mg values varied significantly between the years. The CEC varied significantly between the treatments, reflecting the effect of the exchangeable Ca on the CEC. Regarding the soil amendment treatments, the mean values varied between 5.12 (C) and 7.27 (B10) cmolc kg−1.

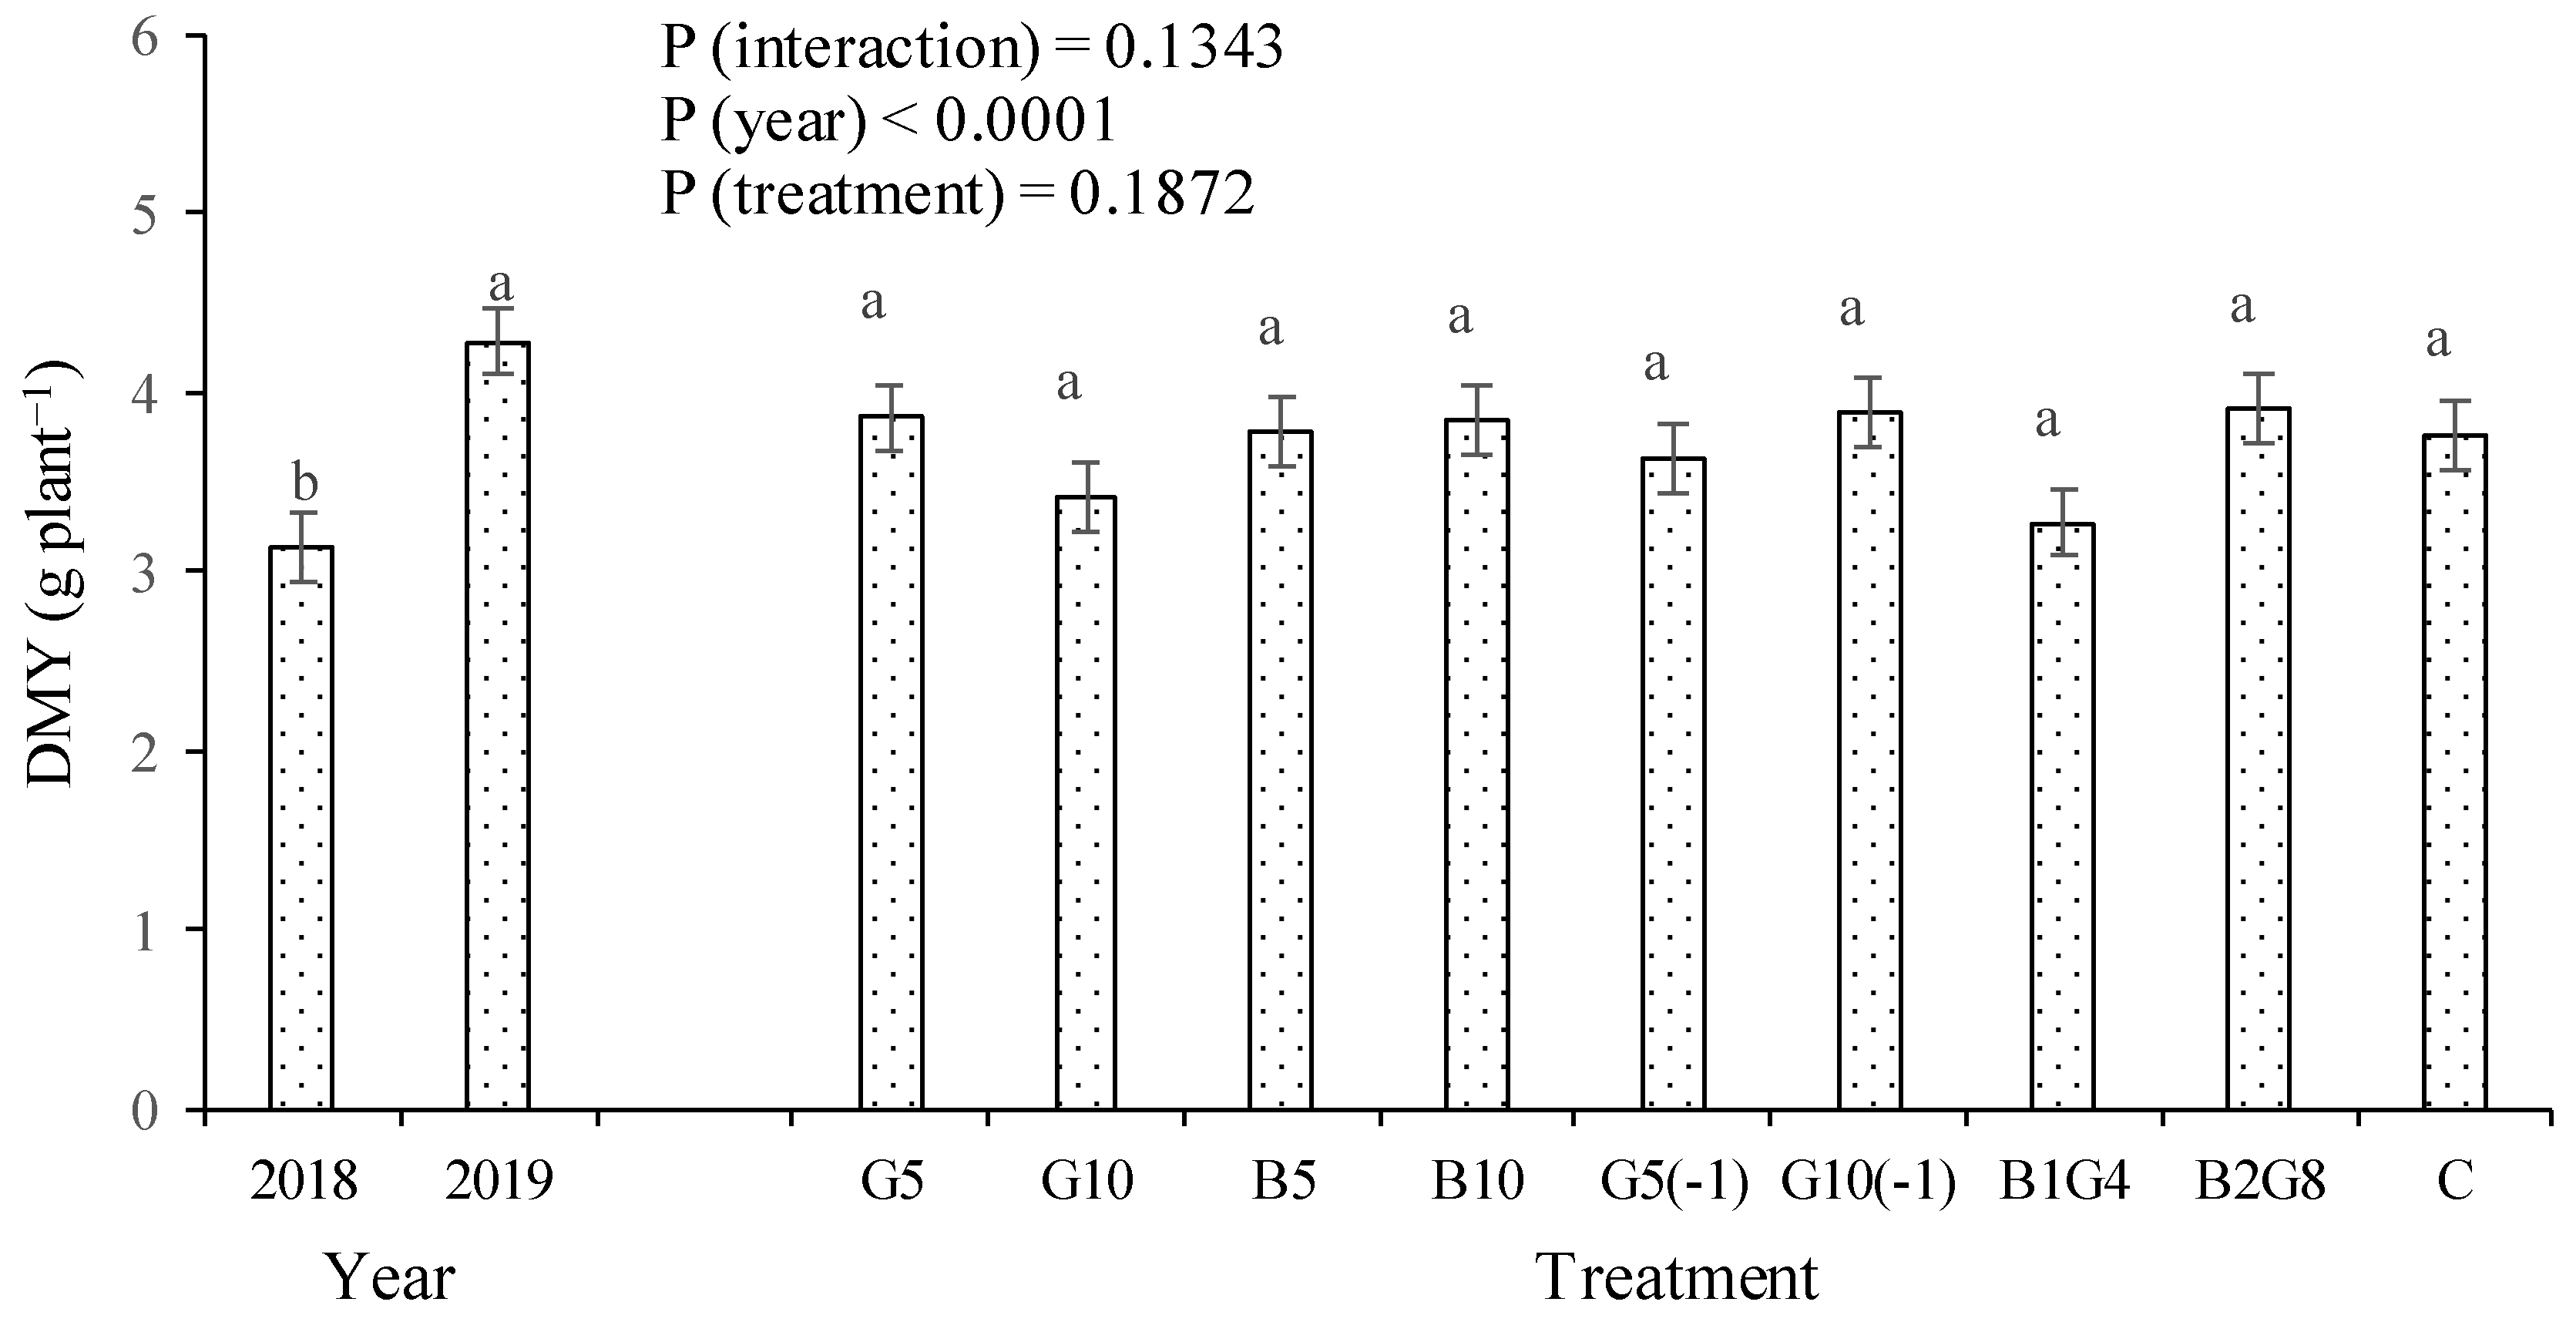
3.4. Growth and Nutrient Uptake by Cabbage Grown in Pots as a Biological Index of Soil Nutrient Availability

No significant interaction (p = 0.1872) was found between the years and soil amendment treatments on the cabbage DMY (Figure 3). In 2019, the cabbage DMY (4.28 g plant−1) was significantly higher than in the previous year (3.13 g plant−1). The DMY did not vary significantly with the soil amendment treatments and the two-year average values varied between 3.27 and 3.91 g plant−1. Thus, the response pattern of okra in the field to the soil amendment treatments was not maintained in the potted cabbage.
The N concentration in the cabbage tissues varied significantly between the years but not between the treatments (Table 9). The mean value in 2018 was 15.6 g kg−1, and in 2019, it was 11.0 g kg−1. Regarding the soil amendment treatments, the mean values were found to be between 13.6 and 15.8 g kg−1. The tissue P concentration varied significantly between the years and treatments. Among the soil amendment treatments, the highest and lowest mean values were recorded in G10 (3.5 g kg−1) and C (2.7 g kg−1), respectively. The tissue K concentrations varied significantly between the years but not between the treatments. The mean concentration of B in the tissues ranged between 32.4 and 35.0 mg kg−1 when comparing the years, with significant differences. Significant differences were also observed between the treatments, with the highest values recorded in treatment G10 (37.7 mg kg−1) and the lowest in the control treatment (28.5 mg kg−1). There was a general trend towards higher mean values in the guano treatments.

4. Discussion

4.1. Guano Increased Crop Growth and Yield, but Biochar Did Not

The okra fruit yield and plant height varied significantly between the treatments and years. The treatments that received the highest rates of guano (G10, G10(-1), B2G8) tended to enhance the performance of the crop. Organic amendments generally increase crop productivity, as they provide nutrients for plant uptake and improve general plant growth conditions by increasing the soil water holding capacity; aeration; and many other physical, chemical and biological soil properties [31,32]. Furthermore, in previous studies where bat guano were used, positive effects on soil properties and/or on variables related to plant growth and yield were reported [13,14,15,33]. In contrast, treatments receiving only biochar as a soil amendment did not increase the plant height or fruit yield compared with the control in these two short-term experiments. Biochar is a C-rich material that is difficult to be attacked by microorganisms, with high recalcitrance in the soil, making its use often recommended mainly based on its ability to sequester C [34,35,36]. Even though it contains some essential nutrients, its bioavailability tends to be reduced due to the slow mineralization process, which explains why biochar is mainly seen as a soil conditioner. Biochar can benefit long-term plant growth by improving soil properties [37,38]. However, in short-term assessments, the use of biochar alone without any other fertilizing materials often results in low yields that are usually no different from control treatments [33,39,40,41].
In field research, the year usually has a marked effect on plant performance, as it manifests itself as the sum of several environmental variables, such as solar radiation, temperature and precipitation [42,43]. In this study, along with these variables, the effect of the year was also due to the okra cultivation taking place in different plots of land.

4.2. Okra Plant Took Up Higher Amounts of Nutrients than Those Released by Guano

The guano increased the crop yield and N recovery but not the leaf N concentration. The increase in total plant biomass reduced the leaf N concentration due to a dilution effect, which is a phenomenon often reported in the literature [41,44]. The relatively low values of N concentration in the leaves when compared with the sufficiency range of okra [45] suggest that the amount of N provided by the guano enhanced the plant growth, but it was not enough to increase the concentration of the nutrient in the tissues. The interpretation of the results of the N bioavailability to plants became easier when the apparent recovery of the nutrient was taken into account (Table 5). Plants from some treatments recovered more N than that applied as a soil amendment (values greater than 100%) and the amount of N recovered was not directly related to the rate of guano applied. In most agro-systems, apparent N recovery tends to be low, typically between 40 to 60% [31,32], and generally decreases as the rate of N applied increases [40,46,47]. In this study, there seemed to be a tendency for higher values to be associated with more productive treatments. It seems that the application of guano enhanced plant growth beyond its nutrient content. That is, plants with better growing conditions took up more N from native soil organic matter than plants in poorer growing conditions. The phenomenon is called “priming” or “added N interaction” [48,49] and was reported in several other studies [33,50,51,52]. It seems that the use of fertilizers or organic amendments can stimulate biological processes in the soil that lead to an increase in the bioavailability of some nutrients.
Bat guano often has high levels of P [53,54] and the same was observed for the guano used in this study (Table 3). The high P content in bat guano was probably the main reason for the greater effect of guano on the P concentration than on the N concentration in the plant tissues. The APR often exceeded 20%, which is a value that can be considered high when taking into account the fact that several reactions related to soil pH can quickly fix P in relatively unavailable forms [31,55]. Thus, it was probably the intense mineralization of the organic substrate during the growing season, stimulated by a warm climate and a well-aerated sandy soil, which regularly supplied P to the plants and ensured the relatively high APR values. However, the values were well below 100%, meaning that much of the P remained immobilized in the soil. Given that these soils were limestone-derived, the decrease in P availability in the soil was probably due to the presence of Ca. In the presence of calcium carbonate, soluble P (monocalcium phosphate) rapidly evolves into a sequence of lower-solubility products, such as dicalcium phosphate and then tricalcium phosphate [32,33].
AKR values were particularly high in 2018, having exceeded 400% in some treatments. In 2019, the highest AKR values were related to the most productive treatments. This means that most of the K came from the soil and not from the organic amendment. This can be seen as a positive aspect, as it means that the soil itself can provide large amounts of K; however, a long-term fertilization strategy will still be of importance, as the crop will progressively remove K in a way that may not be sustainable. Nutrient mining is a relevant issue for agro-systems, as it corresponds to a negative balance between the nutrient input through fertilizers and manure and the output through crop removal [56]. This is of particular concern in sub-Saharan Africa due to the difficulties for smallholder farmers in accessing commercial fertilizers [57,58]. They should adopt practices of crop rotation and intercropping as a way of mitigating the loss of soil fertility whenever possible [9,10,59].
The results for B are also noteworthy. The leaf B concentration increased in the guano treatments, again suggesting high mineralization of the organic amendment. As the guano mineralized, the nutrient was released in sufficient quantity to change its concentration in plant tissues. Thus, the results for B were somewhat similar to those for N, perhaps also due to the close relationship between B availability and the dynamic of organic matter in the soil [60]. Local conditions, however, seemed to provide high amounts of this nutrient to plants since the leaf B concentration in the control was found close to the upper limit of the sufficiency range [45], indicating that B is not a major concern in crop fertilization.

4.3. Biochar Increased Total Soil Organic Carbon and Guano Increased the Easily Oxidizable Carbon

Soil amendment treatments significantly affected the soil C content. The total organic C (incineration) was more affected by biochar applications, whereas the easily oxidizable C (Walkley–Black) was more affected by the guano applications. Biochar is difficult to decompose due to a molar H/C ratio generally below that of the feedstock, which indicates polymerization and therefore potential recalcitrance [35]. This justifies its presence in the soil at the end of the growing season, being the direct result of its addition to the soil and a reduced rate of mineralization. In agreement with this, many previous studies showed the high capacity of biochar to contribute to C sequestration in the soil [34,35,36,40,61]. The data on nutrient uptake by okra suggested high mineralization of guano, probably due to the high temperature in the region and the well-aerated soil in which the study was carried out. Thus, the increase in easily oxidizable C would not have been due to the applied guano, as was reported in other studies [14,15], but perhaps more due to the products of photosynthesis, which can be deposited in the soil by plant roots and mycorrhizal fungal mycelia [52,62,63]. That is, the increase in easily oxidizable C observed in the soil at the end of the season was mainly due to crop residues, which were greater in the most productive treatments, namely, those that received guano, and less to the C initially contained in the organic amendment, which would have mostly been mineralized.
There seemed to be a pattern of high soil P values in the treatments that received higher rates of guano, perhaps due to their initial P content, as already mentioned, and to the high turnover of organic C in the most productive treatments since the P cycle is also linked to the dynamics of organic matter in the soil [31,32,55]. The biochar treatments did not increase the P availability in the soil. Some previous studies referred to an increase in the availability of P in the soil by the application of biochar, with the results being justified by the increase in the anion exchange capacity [35,64] or by the reduction in the formation of precipitates of P either in acidic or alkaline soils, which leads to increased P availability to plants [65,66]. However, as in both this and several other studies, no increase in P availability was observed after the application of biochar [39,41,61].
The application of biochar increased the CEC in relation to the control treatment, with Ca being the exchange base with the greatest contribution to the result. The biochar had a high pH and Ca content (Table 3), which may explain the result. On the other hand, biochar contains amorphous aromatic compounds with heteroatoms in the aromatic rings, which play a great role in making the surface of biochar heterogeneous and reactive [35], often leading to an increase in the CEC after applying biochar to soil [34,35,40,61]. The application of guano also caused a slight increase in the CEC, perhaps because crop residues led to an increase in easily oxidizable C and, as is known, organic matter has a very high CEC [31,32].

4.4. Potted Cabbage Showed a Low Residual Effect for Guano and Nil for Biochar

Cabbage grown in pots and used as a soil residual fertility index following the harvesting of okra resulted in a higher DMY in 2019, contrary to what was recorded with okra height and fruit yield, whose average values were higher in 2018. The environmental variables that limited okra crop growth in 2019 led to better soil residual fertility, allowing for an increase in the cabbage DMY. In 2019, significant differences were found between treatments in the tissue N concentration, with the higher values being associated with treatments that received higher rates of guano. The result tended to be repeated for P and B, but not for K, for which no significant differences were recorded between the treatments. In previous studies, the use of plants as a biological index of nutrient availability in the soil showed good reliability [67,68,69]. In this case, it contributed to showing a reduced residual effect of the guano application, which must have been largely mineralized during the okra growing season, as observed by Dimande et al. [33] in a previous study with maize in similar agro-ecological conditions. The pot experiment also showed that the application of biochar did not significantly influence any of the measured variables related to nutrient uptake and plant growth compared with the control treatment.

5. Conclusions

The application of guano increased plant growth and yield. Its effect was due to the release of important nutrients, such as N and P, but probably also to a certain “manuring effect”. The application of guano enhanced the plant growth and yield and led to an increased uptake of some important nutrients in relation to the amount of the nutrient contained in itself. The tissue nutrient concentration, apparent nutrient recovery, some soil properties and the residual effect of fertilization suggested that guano underwent intense mineralization, probably due to its low C/N ratio, the high temperatures of the region and the well-aerated loamy-sand soils where the study took place. Early application of guano did not provide more benefits than applications close to sowing. The use of biochar did not significantly affect the okra growth and yield or the tissue nutrient concentration. However, the use of biochar increased the total organic C in the soil and the CEC, which are aspects that can benefit long-term cultivation processes. Thus, the results of this study indicate that farmers can obtain an immediate benefit from the use of bat guano due to its fertilizing value, whereas a potential benefit of using biochar should only occur in the long term, as its use alone did not improve the crop performance.

Author Contributions

P.D.: conceptualization, methodology, investigation, data curation and writing—original draft preparation. M.A.: funding acquisition, methodology, supervision, and writing—review and editing. M.Â.R.: conceptualization, data curation, funding acquisition, project administration, and writing—review and editing. All authors have read and agreed to the published version of the manuscript.

Funding

The authors are grateful to the Foundation for Science and Technology (FCT, Portugal) for their financial support from national funds FCT/MCTES to CIMO (UIDB/AGR/00690/2020) and for Paulo Dimande’s doctoral scholarship (PRT/BD/152095/2021).

Data Availability Statement

The data presented in this study are available on request from the corresponding author.

Conflicts of Interest

The authors declare no conflict of interest.

References

  1. Food and Agriculture Organization of the United Nations (FAO). FAOSTAT: Crops and Livestock Products. Available online: https://www.fao.org/faostat/en/#data/QCL (accessed on 1 May 2023).
  2. Kshash, B.H. Okra grower’s knowledge of cultivation practices: A case study. Int. J. Veg. Sci. 2017, 23, 80–86. [Google Scholar] [CrossRef]
  3. Al-Shawi, A.A.A.; Hameed, M.F.; Hussein, K.A.; Thawini, H.K. Review on the “biological applications of okra polysaccharides and prospective research”. Future J. Pharm. Sci. 2021, 7, 102. [Google Scholar] [CrossRef]
  4. Chaemsawang, W.; Prasongchean, W.; Papadopoulos, K.I.; Ritthidej, G.; Sukrong, S.; Wattanaarsakit, P. The effect of okra [Abelmoschus esculentus (L.) Moench] seed extract on human cancer cell lines delivered in its native form and loaded in polymeric micelles. Int. J. Biomater. 2019, 2019, 9404383. [Google Scholar] [CrossRef] [PubMed] [Green Version]
  5. Zhu, X.; Xu, R.; Wang, H.; Chen, J.; Tu, Z. Structural properties, bioactivities, and applications of polysaccharides from okra [Abelmoschus esculentus (L.) Moench]: A review. J. Agric. Food Chem. 2020, 68, 14091–14103. [Google Scholar] [CrossRef] [PubMed]
  6. Sing, R.; Saurav, S.; Kumar, G.; Kumar, A.; Kumar, D.; Diwakar, D.K.; Kumar, S.; Raj, R.; Kumar, K.; Kumar, A.; et al. A review on anti-diabetic properties of lady’s finger (Abelmoschus esculentus L.) plant. Int. J. Pharm. Life Sci. 2021, 12, 13–16. [Google Scholar]
  7. Moosavi, S.A.; Aghaalikhani, M.; Ghobadian, B.; Fayyazi, E. Okra: A potential future bioenergy crop in Iran. Renew. Sustain. Energy Rev. 2018, 93, 517–524. [Google Scholar] [CrossRef]
  8. Aboyeji, C.M.; Dahunsi, S.O.; Olaniyan, D.O.; Dunsin, O.; Adekiya, A.O.; Olayanju, A. Performance and quality attributes of okra [Abelmoschus esculentus (L.) Moench] fruits grown under soil applied Zn-fertilizer, green biomass and poultry manure. Sci. Rep. 2021, 11, 8291. [Google Scholar] [CrossRef]
  9. Hoffmann, M.P.; Swanepoel, C.M.; Nelson, W.C.D.; Beukes, D.J.; van der Laan, M.; Hargreaves, J.N.G.; Rötter, R.P. Simulating medium-term effects of cropping system diversification on soil fertility and crop productivity in southern Africa. Eur. J. Agron. 2020, 119, 126089. [Google Scholar] [CrossRef]
  10. Bese, D.; Zwane, E.; Cheteni, P. The use of sustainable agricultural methods amongst smallholder farmers in the Eastern Cape province, South Africa. Afr. J. Sci. Technol. Innov. Dev. 2021, 13, 261–271. [Google Scholar] [CrossRef]
  11. Krause, A.; Rotter, V.S. Recycling improves soil fertility management in smallholdings in Tanzania. Agriculture 2018, 8, 31. [Google Scholar] [CrossRef] [Green Version]
  12. Gowing, J.W.; Golicha, D.D.; Sanderson, R.A. Integrated crop-livestock farming offers a solution to soil fertility mining in semi-arid Kenya: Evidence from Marsabit County. Int. J. Agric. Sustain. 2020, 18, 492–504. [Google Scholar] [CrossRef]
  13. Karagöz, K.; Hanay, A. Effects of bat guano on some yield parameters of wheat. Acad. J. Environ. Sci. 2017, 5, 7. [Google Scholar] [CrossRef]
  14. Ünal, M.; Can, O.; Can, B.A.; Poyraz, K. The effect of bat guano applied to the soil in different forms and doses on some plant nutrient contents. Commun. Soil Sci. Plant Anal. 2018, 49, 708–716. [Google Scholar] [CrossRef]
  15. Ojobor, S.A.; Omovie-Stephen, O.F. Influence of formulated palm mill effluent and bat guano mixture on maize performance and soil chemical properties in Delta State, Nigeria. Indian J. Agric. Res. 2022, 56, 28–32. [Google Scholar] [CrossRef]
  16. Oladele, S.; Adeyemo, A.; Awodun, M.; Ajayi, A.; Fasina, A. Effects of biochar and nitrogen fertilizer on soil physicochemical properties, nitrogen use efficiency and upland rice (oryza sativa) yield grown on an Alfisol in Southwestern Nigeria. Int. J. Recycl. Org. 2019, 8, 295–308. [Google Scholar] [CrossRef] [Green Version]
  17. Jabborova, D.; Annapurna, K.; Al-Sadi, A.M.; Alharbi, S.A.; Datta, R.; Zuan, A.T.K. Biochar and Arbuscular mycorrhizal fungi mediated enhanced drought tolerance in Okra (Abelmoschus esculentus) plant growth, root morphological traits and physiological properties. Saudi J. Biol. Sci. 2021, 28, 5490–5499. [Google Scholar] [CrossRef]
  18. Karthikeyan, B.; Saliha, B.B.; Kannan, P.; Vellaikumar, S. Effect of biochar composite and organic sources on soil properties and yield of bhendi (Abelmoschus esculentus L.). J. Appl. Nat. Sci. 2021, 13, 1198–1205. [Google Scholar] [CrossRef]
  19. Ibrahim, I.I. Efficacy of biochar and npk fertilizer on soil properties and yield of okra (Abelmeschus esculentus L.) in Guinea Savanna region of Nigeria. J. Environ. Bioremed. Toxicol. 2022, 5, 6–10. [Google Scholar] [CrossRef]
  20. Beck, H.E.; Zimmermann, N.E.; McVicar, T.R.; Vergopolan, N.; Berg, A.; Wood, E.F. Present and future Köppen-Geiger climate classification maps at 1-km resolution. Sci Data 2018, 5, 180214. [Google Scholar] [CrossRef] [PubMed] [Green Version]
  21. MAE. Perfil do Distrito de Vilankulo Província de Inhambane; Ministério da Administração Estatal: Vilankulo, Mozanbique, 2014. [Google Scholar]
  22. CLIMATE DATA. Dados Climáticos para Vilanculos (1991–2021). Available online: https://pt.climate-data.org/africa/mocambique/inhambane/vilanculos-52395/ (accessed on 15 May 2023).
  23. WRB. World Reference Base for Soil Resources 2014, Update 2015. In International Soil Classification System for Naming Soils and Creating Legends for Soil Maps; World Soil Resources Reports No. 106; FAO: Rome, Italy, 2015. [Google Scholar]
  24. Wijnhoud, G.D. Os Solos dos Locais dos Ensaios “on Farm” (Mapira, Mexoeira e Feijão Jugo) nos Distritos de Mabote e Vilanculos; INIA: Maputo, Mozambique, 1998. [Google Scholar]
  25. Chun, Y.; Lee, S.K.; Yoo, H.Y.; Kim, S.W. Recent advancements in biochar production according to feedstock classification, pyrolysis conditions, and applications: A review. BioResources 2021, 16, 6512–6547. [Google Scholar] [CrossRef]
  26. Meier, U. Growth Stages of Mono and Dicotyledonous Plants; Julius Kühn-Institut: Quedlinburg, Germany, 2018. [Google Scholar] [CrossRef]
  27. Van Reeuwijk, L.P. Procedures for Soil Analysis, 6th ed.; Technical Paper 9; ISRIC; FAO: Rome, Italy, 2002. [Google Scholar]
  28. Jones, J.J. Laboratory Guide for Conducting Soil Tests and Plant Analysis; CRC Press: Boca Raton, FL, USA, 2001. [Google Scholar]
  29. FAO. Standard Operating Procedure for Soil Available Micronutrients (Cu, Fe, Mn, Zn) and Heavy Metals (Ni, Pb, Cd), DTPA Extraction Method; FAO: Rome, Italy, 2022; Available online: https://www.fao.org/3/cc0048en/cc0048en.pdf (accessed on 9 May 2023).
  30. Temminghoff, E.E.; Houba, V.J. Plant Analysis Procedures, 2nd ed.; Temminghoff, E.E., Houba, V.J., Eds.; Kluwer Academic Publishers: London, UK, 2004. [Google Scholar] [CrossRef]
  31. Havlin, J.L.; Beaton, J.D.; Tisdale, S.L.; Nelson, W.L. Soil Fertility and Fertilizers: In an Introduction to Nutrient Management, 8th ed.; Pearson, Inc.: Chennai, India, 2017. [Google Scholar]
  32. Weil, R.R.; Brady, N.C. The Nature and Properties of Soils, 15th ed.; Global Edition: London, UK, 2017. [Google Scholar]
  33. Dimande, P.; Arrobas, M.; Rodrigues, M.Â. Under a tropical climate and in sandy soils, bat guano mineralises very quickly, behaving more like a mineral fertiliser than a conventional farmyard manure. Agronomy 2023, 13, 1367. [Google Scholar] [CrossRef]
  34. Kavitha, B.; Reddy, P.V.L.; Kim, B.; Lee, S.S.; Pandey, S.K.; Kim, K.-H. Benefits and limitations of biochar amendment in agricultural soils: A review. J. Environ. Manag. 2018, 227, 146–154. [Google Scholar] [CrossRef] [PubMed]
  35. Shaaban, M.; Zwieten, L.V.; Bashir, S.; Younas, A.; Núñez-Delgado, A.; Chhajro, M.A.; Kubar, K.A.; Ali, U.; Rana, M.S.; Mehmood, M.A.; et al. A concise review of biochar application to agricultural soils to improve soil conditions and fight pollution. J. Environ. Manag. 2018, 228, 429–440. [Google Scholar] [CrossRef] [PubMed]
  36. Schmidt, H.; Kammann, C.; Hagemann, N.; Leifeld, J.; Bucheli, T.D.; Sánchez Monedero, M.A.; Cayuela, M.L. Biochar in agriculture—A systematic review of 26 global meta-analyses. GCB Bioenergy 2021, 13, 1708–1730. [Google Scholar] [CrossRef]
  37. Joseph, S.; Cowie, A.L.; Van Zwieten, L.; Bolan, N.; Budai, A.; Buss, W.; Cayuela, M.L.; Graber, E.R.; Ippolito, J.A.; Kuzyakov, Y.; et al. How biochar works, and when it doesn’t: A review of mechanisms controlling soil and plant responses to biochar. GCB Bioenergy 2021, 13, 1731–1764. [Google Scholar] [CrossRef]
  38. Meena, R.S.; Kumar, S.; Sheoran, S.; Jhariya, M.K.; Bhatt, R.; Yadav, G.S.; Rao, C.S. Soil organic carbon restoration in India programs, policies and thrust Areas. In Soil Organic Matter and Feeding the Future; Lal, R., Ed.; CRC Press: Boca Raton, FL, USA, 2022. [Google Scholar]
  39. Rodrigues, M.A.; Garmus, T.; Arrobas, M.; Gonçalves, A.; Silva, E.; Rocha, L.; Pinto, L.; Brito, C.; Martins, S.; Vargas, T.; et al. Combined biochar and organic waste have little effect on chemical soil properties and plant growth. Span. J. Soil Sci. 2019, 9, 199–211. [Google Scholar] [CrossRef]
  40. Rodrigues, M.Â.; Torres, L.N.D.; Damo, L.; Raimundo, S.; Sartor, L.; Cassol, L.C.; Arrobas, M. Nitrogen use efficiency and crop yield in four successive crops following application of biochar and zeolites. J. Soil Sci. Plant Nutr. 2021, 21, 1053–1065. [Google Scholar] [CrossRef]
  41. Arrobas, M.; Decker, J.V.; Feix, B.L.; Godoy, W.I.; Casali, C.A.; Correia, C.M.; Rodrigues, M.A. Biochar and zeolites did not improve phosphorus uptake or crop productivity in a field trial performed in an irrigated intensive farming system. Soil Use Manag. 2021, 38, 564–575. [Google Scholar] [CrossRef]
  42. MacKinnon, D.; Pavlovič, V.; Čeh, B.; Naglič, B.; Pavlovič, M. The impact of weather conditions on alpha-acid content in hop (Humulus lupulus L.) cv. Aurora. Plant Soil Environ. 2020, 66, 519–525. [Google Scholar] [CrossRef]
  43. Afonso, S.; Dias, M.I.; Ferreira, I.C.F.R.; Arrobas, M.; Cunha, M.; Barros, L.; Rodrigues, M.Â. The phenolic composition of hops (Humulus lupulus L.) was highly influenced by cultivar and year and little by soil liming or foliar spray rich in nutrients or algae. Horticulturae 2022, 8, 385. [Google Scholar] [CrossRef]
  44. Jarrell, W.M.; Beverly, R.B. The dilution effect in plant nutrition studies. Adv. Agron. 1981, 34, 197–224. [Google Scholar]
  45. Bryson, G.; Mills, H.A.; Sasseville, D.N.; Jones, J.B., Jr.; Barker, A.V. Plant Analysis Handbook III. A Guide to Sampling, Preparation, Analysis and Interpretation for Agronomic and Horticultural Crops; Micro-Macro Publishing Inc.: Athens, GA, USA, 2014. [Google Scholar]
  46. Bouchet, A.-S.; Laperch, A.; Bissuel-Belaygue, C.; Snowdon, R.; Nesi, N.; Stahl, A. Nitrogen use efficiency in rapeseed. A Review. Agron. Sustain. Dev. 2016, 36, 38. [Google Scholar] [CrossRef]
  47. Ferreira, I.Q.; Arrobas, M.; Moutinho-Pereira, J.M.; Correia, C.M.; Rodrigues, M.A. The effect of nitrogen applications on the growth of young olive trees and nitrogen use efficiency. Turk. J. Agric. For. 2020, 44, 278–289. [Google Scholar] [CrossRef]
  48. Jenkinson, D.S.; Fox, R.H.; Rayner, J.H. Interactions between fertilizer nitrogen and soil nitrogen—The so-called “priming effect”. J. Soil Sci. 1985, 36, 425–444. [Google Scholar] [CrossRef]
  49. Schnier, H.F. Nitrogen-15 recovery fraction in flooded tropical rice as affected by added nitrogen interaction. Eur. J. Agron. 1994, 3, 161–167. [Google Scholar] [CrossRef]
  50. Jalpa, L.; Mylavarapu, R.S.; Hochmuth, G.J.; Wright, A.L.; van Santen, E. Apparent recovery and efficiency of nitrogen fertilization in tomato grown on sandy soils. Horttechnology 2020, 30, 204–211. [Google Scholar] [CrossRef] [Green Version]
  51. Singh, B.P.; Noack, S.R.; Fang, Y.; Mehra, P.; Page, K.; Dang, Y.P. Crop residue management for improving soil carbon storage, nutrient availability and use efficiency. In Soil and Fertilizers: Managing the Environmental Footprint; Lal, R., Ed.; CRC Press: Denver, CO, USA, 2020; pp. 29–66. [Google Scholar]
  52. Lopes, J.I.; Gonçalves, A.; Brito, C.; Martins, S.; Pinto, L.; Moutinho-Pereira, J.; Raimundo, S.; Arrobas, M.; Rodrigues, M.A.; Correia, C.M. inorganic fertilization at high n rate increased olive yield of a rainfed orchard but reduced soil organic matter in comparison to three organic amendments. Agronomy 2021, 11, 2172. [Google Scholar] [CrossRef]
  53. Misra, P.; Gautam, N.; Elangovan, V. Bat guano: A rich source of macro and microelements essential for plant growth. Ann. Plant Soil Res. 2019, 21, 82–86. [Google Scholar]
  54. Audra, P.; Heresanu, V.; Barriquand, L.; Boutchich, E.K.M.; Jaillet, S.; Pons-Branchu, E.; Bosák, P.; Cheng, H.; Edwards, R.L.; Renda, M. Bat guano minerals and mineralization processes in Chameau Cave, Eastern Morocco. Int. J. Speleol. 2021, 50, 91–109. [Google Scholar] [CrossRef]
  55. Chaney, K. Phosphate fertilizers (Cap 6). In Ullmann’s Agrochemicals 1; Wiley-VCH, Velag GmbH & Co. KGaA: Weinheim, Germany, 2007. [Google Scholar]
  56. Majumdar, K.; Sanyal, S.K.; Dutta, S.K.; Satyanarayana, T.; Singh, V.K. Nutrient mining: Addressing the challenges to soil resources and food security. In Biofortification of Food Crops; Singh, U., Praharaj, C., Singh, S., Singh, N., Eds.; Springer: New Delhi, India, 2016. [Google Scholar] [CrossRef]
  57. Henao, J.; Baanante, C. Agricultural Production and Soil Nutrient Mining in Africa: Implications for Resource Conservation and Policy Development; IFDC—An International Center for Soil Fertility and Agricultural Development: Muscle Shoals, AL, USA, 2006. [Google Scholar]
  58. Zavale, H.; Matchaya, G.; Vilissa, D.; Nhemachena, C.; Nhlengethwa, S.; Wilson, D. Dynamics of the fertilizer value chain in Mozambique. Sustainability 2020, 12, 4691. [Google Scholar] [CrossRef]
  59. Nalivata, P.; Kibunja, C.; Mutegi, J.; Tetteh, F.; Tarfa, B.; Dicko, M.K.; Ouattara, K.; Cyamweshi, R.A.; Nouri, M.K.; Bayu, W.; et al. Integrated soil fertility management in sub-Saharan Africa. In Fertilizer Use Optimization in Sub-Saharan Africa; Wortmann, C.S., Sones, K., Eds.; CABI: Wallingford, UK, 2017; pp. 25–39. [Google Scholar] [CrossRef] [Green Version]
  60. Gupta, U.C. Boron. In Handbook of Plant Nutrition; Barker, A.V., Pilbeam, D.J., Eds.; CRC: Boca Raton, FL, USA, 2007; pp. 241–277. [Google Scholar]
  61. Lopes, J.I.; Arrobas, M.; Raimundo, S.; Gonçalves, A.; Brito, C.; Martins, S.; Pinto, L.; Moutinho-Pereira, J.; Correia, C.M.; Rodrigues, M.A. Photosynthesis, yield, nutrient availability and soil properties after biochar, zeolites or mycorrhizal inoculum application to a mature rainfed olive orchard. Agriculture 2022, 12, 171. [Google Scholar] [CrossRef]
  62. Godbold, D.L.; Hoosbeek, M.R.; Lukac, M.; Cotrufo, M.F.; Janssens, I.A.; Ceulemans, R.; Polle, A.; Velthorst, E.J.; Scarascia-Mugnozza, G.; De Angelis, P.; et al. Mycorrhizal hyphal turnover as a dominant process for carbon input into soil organic matter. Plant Soil 2006, 281, 15–24. [Google Scholar] [CrossRef] [Green Version]
  63. Silva, E.; Arrobas, M.; Gonçalves, A.; Martins, S.; Raimundo, S.; Pinto, L.; Brito, C.; Moutinho-Pereira, J.; Correia, C.M.; Rodrigues, M.A. A controlled-release fertilizer improved soil fertility but not olive tree performance. Nutr. Cycl. Agroecosyst. 2021, 120, 1–15. [Google Scholar] [CrossRef]
  64. Gul, S.; Whalen, J.K. Biochemical cycling of nitrogen and phosphorus in biochar amended soils. Soil Biol. Biochem. 2016, 103, 1–15. [Google Scholar] [CrossRef]
  65. Cui, H.J.; Wang, M.K.; Fu, M.L.; Ci, E. Enhancing phosphorus availability in phosphorus-fertilized zones by reducing phosphate adsorbed to ferrihydrite using rice straw-derived biochar. J. Soils Sediments 2011, 11, 1135–1141. [Google Scholar] [CrossRef]
  66. Zhang, H.Z.; Chen, C.R.; Gray, E.M.; Boyd, S.E.; Hong, Y.; Zhang, D.K. Roles of biochar in improving phosphorus availability in soils; a phosphate adsorbent and a source of available phosphorus. Geoderma 2016, 276, 1–6. [Google Scholar] [CrossRef]
  67. Eichler-Löbermann, B.; Gaj, R.; Schnug, E. Improvement of soil phosphorus availability by green fertilization with catch crops. Commun. Soil Sci. Plant Anal. 2009, 40, 70–81. [Google Scholar] [CrossRef]
  68. Arrobas, M.; Rodrigues, M.A. Agronomic evaluation of a fertiliser with D-CODER technology, a new mechanism for the slow release of nutrients. J. Agric. Sci. Technol. 2013, 15, 409–419. [Google Scholar]
  69. Rodrigues, M.Â.; Dimande, P.; Pereira, E.L.; Ferreira, I.Q.; Freitas, S.; Correia, C.M.; Moutinho-Pereira, J.; Arrobas, M. Early-maturing annual legumes: An option for cover cropping in rainfed olive orchards. Nutr. Cycl. Agroecosyst. 2015, 103, 153–166. [Google Scholar] [CrossRef]
Figure 1. Effect of year and guano and biochar on okra fruit yield (G, guano; B, biochar; C, control; 5, 10, 1, 4, 2, 8, t ha−1; (-1), applied 1 month before sowing). Separately for year and treatments, the same letter in a given bar means that there were no significant differences according to Tukey’s HSD test (α = 0.05). Line segments at the tops of the bars indicate the standard errors (n = 3).
Horticulturae 09 00728 g001
Figure 2. Effect of year and guano and biochar on okra plant height (G, guano; B, biochar; C, control; 5, 10, 1, 4, 2, 8, t ha−1; (-1), applied 1 month before sowing). Separately for year and treatments, the same letter in a given bar means that there were no significant differences according to Tukey’s HSD test (α = 0.05). Line segments at the tops of the bars indicate the standard errors (n = 3).
Horticulturae 09 00728 g002
Figure 3. Effect of year and guano and biochar on dry matter yield (DMY) of cabbage in the pot experiment (G, guano; B, biochar; C, control; 5, 10, 1, 4, 2, 8, t ha−1; (-1), applied 1 month before sowing). Separately by year and treatments, the same letter in a given bar means that there were no significant differences according to Tukey’s HSD test (α = 0.05). Line segments at the tops of the bars indicate the standard errors (n = 3).
Horticulturae 09 00728 g003
Table 1. Minimum, average and maximum monthly temperature and precipitation (1991–2021) in VilanKulo [22].
Temperature (°C)
MonthMinimumAverageMaximumPrecipitation (mm)
January24.326.930.0142
February24.326.930.0151
March23.726.329.585
April21.624.628.140
May19.322.726.620
June17.721.325.314
July17.120.624.613
August18.021.625.78
September19.723.127.211
October21.024.328.323
November22.625.629.267
December23.926.629.8102
Table 2. Soil properties (average ± standard deviation, n = 3) determined from composite 0–0.20 m depth samples taken shortly before the study started.
Soil Properties20182019
Organic carbon (g kg−1)4.2 ± 0.2411.1 ± 1.64
pH (H2O)6.6 ± 0.156.8 ± 0.18
Extract. P (mg P2O5 kg−1)41.8 ± 8.5675.1 ± 17.94
Extract. K (mg K2O kg−1)87.2 ± 10.0790.4 ± 17.57
Exchang. Ca (cmolc kg−1)3.1 ± 0.195.4 ± 0.56
Exchang. Mg (cmolc kg−1)1.0 ± 0.151.4 ± 0.13
Exchang. K (cmolc kg−1)0.3 ± 0.030.2 ± 0.04
Exchang. Na (cmolc kg−1)0.6 ± 0.130.7 ± 0.11
Exchang. acidity (cmolc kg−1)0.1 ± 0.060.2 ± 0.06
CEC (cmolc kg−1)5.1 ± 0.337.9 ± 0.53
Sand89.5 ± 0.8784.6 ± 1.03
Silt2.2 ± 0.516.3 ± 0.91
Clay8.2 ± 0.769.2 ± 0.86
TextureLoamy-sandLoamy-sand
Table 3. Guano and biochar properties (average ± standard deviation, n = 3) in 2018 and 2019.
PropertiesGuanoBiochar
2018201920182019
Moisture (%)9.1 ± 1.508.0 ± 1.7335.5 ± 3.7033.9 ± 2.71
Organic carbon (g kg−1)59.8 ± 2.4757.5 ± 2.87534.5 ± 14.12538.2 ± 16.53
pH (H2O)7.5 ± 0.177.3 ± 0.209.2 ± 0.249.3 ± 0.20
Nitrogen (g kg−1)3.3 ± 0.404.2 ± 0.473.3 ± 0.285.0 ± 0.35
Phosphorus (g kg−1)10.1 ± 1.658.4 ± 1.010.8 ± 0.100.9 ± 0.09
Boron (mg kg−1)13.7 ± 2.5515.5 ± 3.5928.5 ± 2.7034.6 ± 3.92
Potassium (g kg−1)2.9 ± 0.203.9 ± 0.673.6 ± 0.524.0 ± 0.59
Calcium (g kg−1)0.7 ± 0.080.5 ± 0.064.3 ± 0.684.8 ± 0.34
Magnesium (g kg−1)0.9 ± 0.061.1 ± 0.151.6 ± 0.171.9 ± 0.24
Iron (mg kg−1)28,188.0 ± 2720.9745,606.2 ± 4732.903637.3 ± 539.375679.6 ± 316.57
Manganese (mg kg−1)168.2 ± 17.59286.3 ± 71.07364.1 ± 34.16388.5 ± 43.65
Zinc (mg kg−1)109.7 ± 33.04112.6 ± 19.1927.2 ± 5.0642.1 ± 8.39
Copper (mg kg−1)72.8 ± 14.29113.3 ± 13.0772.2 ± 27.8123.6 ± 4.60
Table 4. Effect of year and guano and biochar on leaf nitrogen (N), phosphorus (P), potassium (K) and boron (B) concentration (G, guano; B, biochar; C, control; 5, 10, 1, 4, 2, 8, t ha−1; (-1), applied 1 month before sowing).
Leaf NLeaf PLeaf KLeaf B
g kg−1g kg−1g kg−1mg kg−1
Year
  201820.8 b4.1 a15.9 b56.9 b
  201930.3 a3.3 b20.0 a65.2 a
Treatment
  G526.1 a3.5 bcd16.9 a62.5 abc
  G1026.4 a4.2 ab19.2 a67.5 ab
  B524.1 a3.4 bcd16.8 a55.0 bc
  B1025.4 a3.0 d16.1 a54.1 bc
  G5(-1)25.6 a4.1 abc18.0 a63.7 abc
  G10(-1)26.4 a4.6 a17.6 a70.7 a
  B1G425.3 a3.4 cd20.5 a59.2 abc
  B2G826.0 a3.8 abcd17.8 a65.0 abc
  C24.6 a3.1 d18.4 a52.2 c
1 LLSR2531720
2 HLSR4563050
p (interaction)0.99980.00540.93190.0742
p (year)<0.0001<0.00010.00060.0001
p (treatment)0.4831<0.00010.72950.0005
SE (year)0.3820.0870.7751.375
SE (treatment)0.8100.1841.6452.917
1 LLRS, lower limit of sufficiency range; 2 HLRS, higher limit of sufficiency range; within year and treatment, the same letter in a given column means that there were no significant differences according to Tukey’s HSD test (α = 0.05).
Table 5. Effect of year and guano and biochar on nitrogen (N), phosphorus (P), potassium (K) and boron (B) recoveries (G, guano; B, biochar; C, control; 5, 10, 1, 4, 2, 8, t ha−1; (-1), applied 1 month before sowing).
N RecoveryP RecoveryK RecoveryB Recovery
kg ha−1kg ha−1kg ha−1g ha−1
Year
  2018138.0 b34.1 a164.5 b304.8 a
  2019144.1 a20.7 b184.2 a216.9 b
Treatment
  G5139.3 b23.8 b164.1 c242.5 bcd
  G10160.3 a35.1 a208.6 a320.7 ab
  B5135.0 b24.4 b171.4 bc237.6 cd
  B10129.3 b22.9 b146.9 c229.3 d
  G5(-1)130.2 b26.0 b153.1 c258.2 abcd
  G10(-1)158.8 a37.6 a216.2 a329.3 a
  B1G4133.7 b23.0 b165.4 c231.6 d
  B2G8158.9 a36.5 a206.6 ab316.7 abc
  C124.0 b17.3 b137.0 c181.6 d
p (interaction)0.28400.01050.13420.2171
p (year)0.0228<0.00010.0007<0.0001
p (treatment)<0.0001<0.0001<0.0001<0.0001
SE (year)1.8320.9033.7398.064
SE (treatment)3.8861.9167.93217.107
Within year and treatment, the same letter in a given column means that there were no significant differences according to Tukey’s HSD test (α = 0.05).
Table 6. Effect of year and guano and biochar on apparent nitrogen, phosphorus, potassium and boron recoveries (ANR, APR, AKR and ABR, respectively) (G, guano; B, biochar; 5, 10, 1, 4, 2, 8, t ha−1; (-1), applied 1 month before sowing).
ANR (%)APR (%)AKR (%)ABR (%)
20182019201820192018201920182019
G5146.845.219.910.2298.483.1136.251.7
G10112.2101.018.623.9294.4182.7127.184.0
B5------------------------
B10------------------------
G5(-1)42.032.128.711.1216.121.2195.044.5
G10(-1)88.4111.924.823.1347.5185.9159.268.1
B1G4107.042.820.013.6445.169.1153.940.9
B2G8127.3127.040.214.3459.3147.9190.970.2
C------------------------
Apparent nutrient recovery (%) = 100 × [(Nutrient recovered in the amended treatments − Nutrient recovered in the control treatment)/Nutrient applied as an organic amendment].
Table 7. Effect of year and guano and biochar on total organic carbon (TOC, incineration), easily oxidizable carbon (EOC, Walkley–Black), pH(H2O) and extractable phosphorus (P) (G, guano; B, biochar; C, control; 5, 10, 1, 4, 2, 8, t ha−1; (-1), applied 1 month before sowing).
TOCEOC P (P2O5)
g kg−1g kg−1pH(H2O)mg kg−1
Year
  20189.2 b3.9 b6.8 a34.7 b
  201913.2 a10.5 a6.9 a64.5 a
Treatment
  G510.5 bc6.5 bc6.9 a46.0 bcd
  G1011.6 ab8.2 a6.9 a63.4 ab
  B512.1 ab6.3 c6.9 a44.3 bcd
  B1013.6 a7.7 a6.9 a46.6 bcd
  G5(-1)10.2 bc7.5 ab6.8 a55.9 abc
  G10(-1)10.7 bc8.0 a6.8 a66.7 a
  B1G410.4 bc6.4 bc6.9 a38.3 cd
  B2G813.0 a8.0 a6.9 a53.3 abc
  C8.7 c6.4 c6.7 a31.9 d
p (interaction)0.0005<0.00010.86360.0036
p (year)<0.0001<0.00010.0893<0.0001
p (treatment)<0.0001<0.00010.8875<0.0001
SE (year)0.2100.1120.0411.999
SE (treatment)0.4460.2370.0884.241
Within year and treatment, the same letter in a given column means that there were no significant differences according to Tukey’s HSD test (α = 0.05).
Table 8. Effect of year and guano and biochar on exchangeable calcium (Ca2+), magnesium (Mg2+), potassium (K+) and cation exchange capacity (CEC) (G, guano; B, biochar; C, control; 5, 10, 1, 4, 2, 8, t ha−1; (-1), applied 1 month before sowing).
Ca2+Mg2+K+CEC
cmolc kg−1cmolc kg−1cmolc kg−1cmolc kg−1
Year
  20183.27 b0.85 b0.31 a5.01 b
  20195.07 a1.04 a0.29 a6.94 a
Treatment
  G53.52 d0.91 a0.30 a5.25 cd
  G104.15 bcd0.99 a0.32 a6.12 bc
  B54.53 b0.87 a0.28 a6.19 bc
  B105.36 a0.99 a0.32 a7.27 a
  G5(-1)3.65 cd0.91 a0.29 a5.36 cd
  G10(-1)4.03 bcd1.04 a0.27 a5.92 bcd
  B1G44.34 bc0.94 a0.29 a6.13 bc
  B2G84.53 b1.00 a0.29 a6.40 ab
  C3.43 d0.86 a0.32 a5.12 d
p (interaction)<0.00010.36300.48430.0013
p (year)<0.0001<0.00010.3764<0.0001
p (treatment)<0.00010.16090.9579<0.0001
SE (year)0.0790.0230.0150.097
SE (treatment)0.1680.0500.0320.206
Within year and treatment, the same letter in a given column means that there were no significant differences according to Tukey’s HSD test (α = 0.05).
Table 9. Effect of year and guano and biochar on nitrogen (N), phosphorus (P), potassium (K) and boron (B) concentrations in cabbage tissues (G, guano; B, biochar; C, control; 5, 10, 1, 4, 2, 8, t ha−1; (-1), applied 1 month before sowing).
Tissue NTissue PTissue KTissue B
g kg−1g kg−1g kg−1mg kg−1
Year
  201815.6 a3.3 a28.1 a32.4 b
  201911.0 b2.2 b18.4 b35.0 a
Treatment
  G514.7 a3.2 ab25.6 a34.6 ab
  G1015.8 a3.5 a26.0 a37.7 a
  B513.6 a2.8 ab24.8 a28.7 b
  B1014.9 a2.9 ab27.7 a31.0 ab
  G5(-1)15.0 a3.2 ab24.8 a35.0 ab
  G10(-1)13.8 a3.2 ab24.2 a35.2 ab
  B1G414.9 a2.9 ab28.7 a30.9 ab
  B2G814.6 a3.3 a26.5 a33.7 ab
  C14.8 a2.7 b27.2 a28.5 b
p (interaction)0.88940.29590.79140.5688
p (year)<0.0001<0.0001<0.00010.0302
p (treatment)0.88410.00170.82760.0038
SE (year)0.3660.0580.9941.184
SE (treatment)1.2010.1941.6672.004
Within year and treatment, the same letter in a given column means that there were no significant differences according to Tukey’s HSD test (α = 0.05).
Disclaimer/Publisher’s Note: The statements, opinions and data contained in all publications are solely those of the individual author(s) and contributor(s) and not of MDPI and/or the editor(s). MDPI and/or the editor(s) disclaim responsibility for any injury to people or property resulting from any ideas, methods, instructions or products referred to in the content.

