

CFD Modeling of the Microclimate in a Greenhouse Using a Rock Bed Thermal Storage Heating System

 , , , ,
Abstract
:1. Introduction
2. Materials and Methods
2.1. Greenhouse Geometry and Description of the Heating System
2.2. Experimental Measurements
2.3. CFD Governing Equations
2.4. Radiation Modeling
2.5. Crop Porous Medium
2.6. CFD Numerical Model
CFD Model Settings
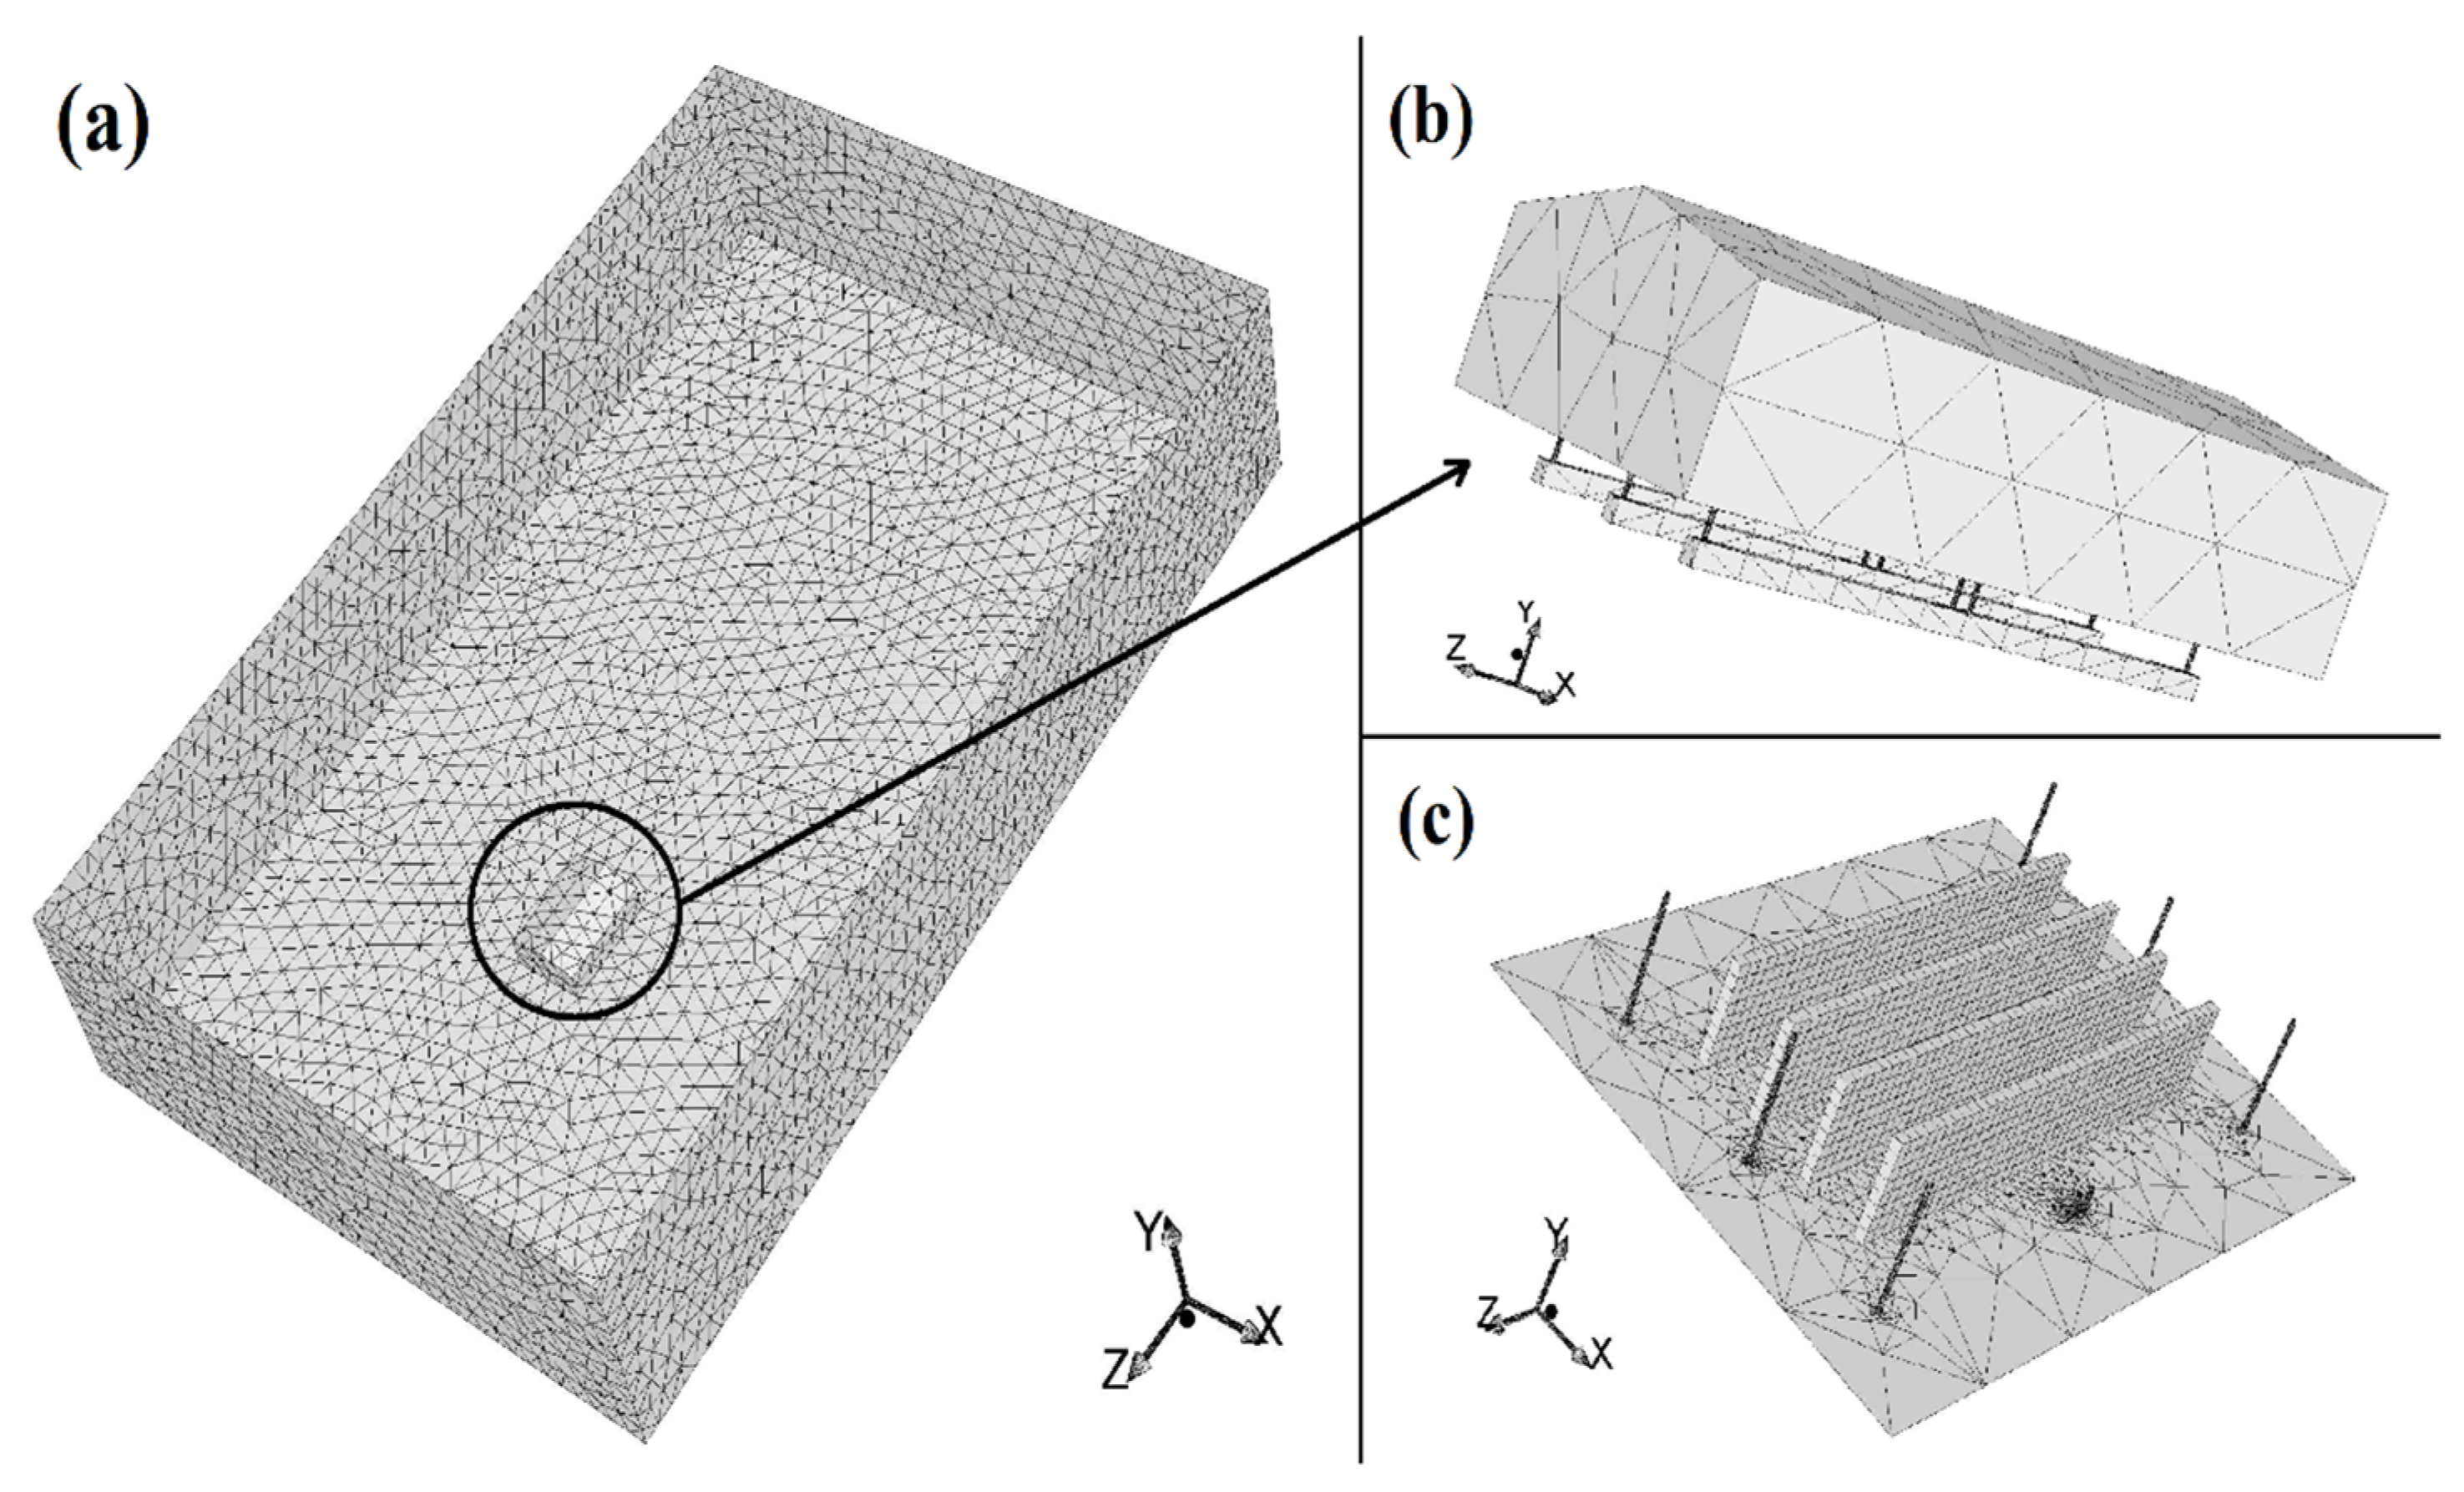
2.7. Mesh Details
2.8. Boundary Conditions
3. Results and Discussion
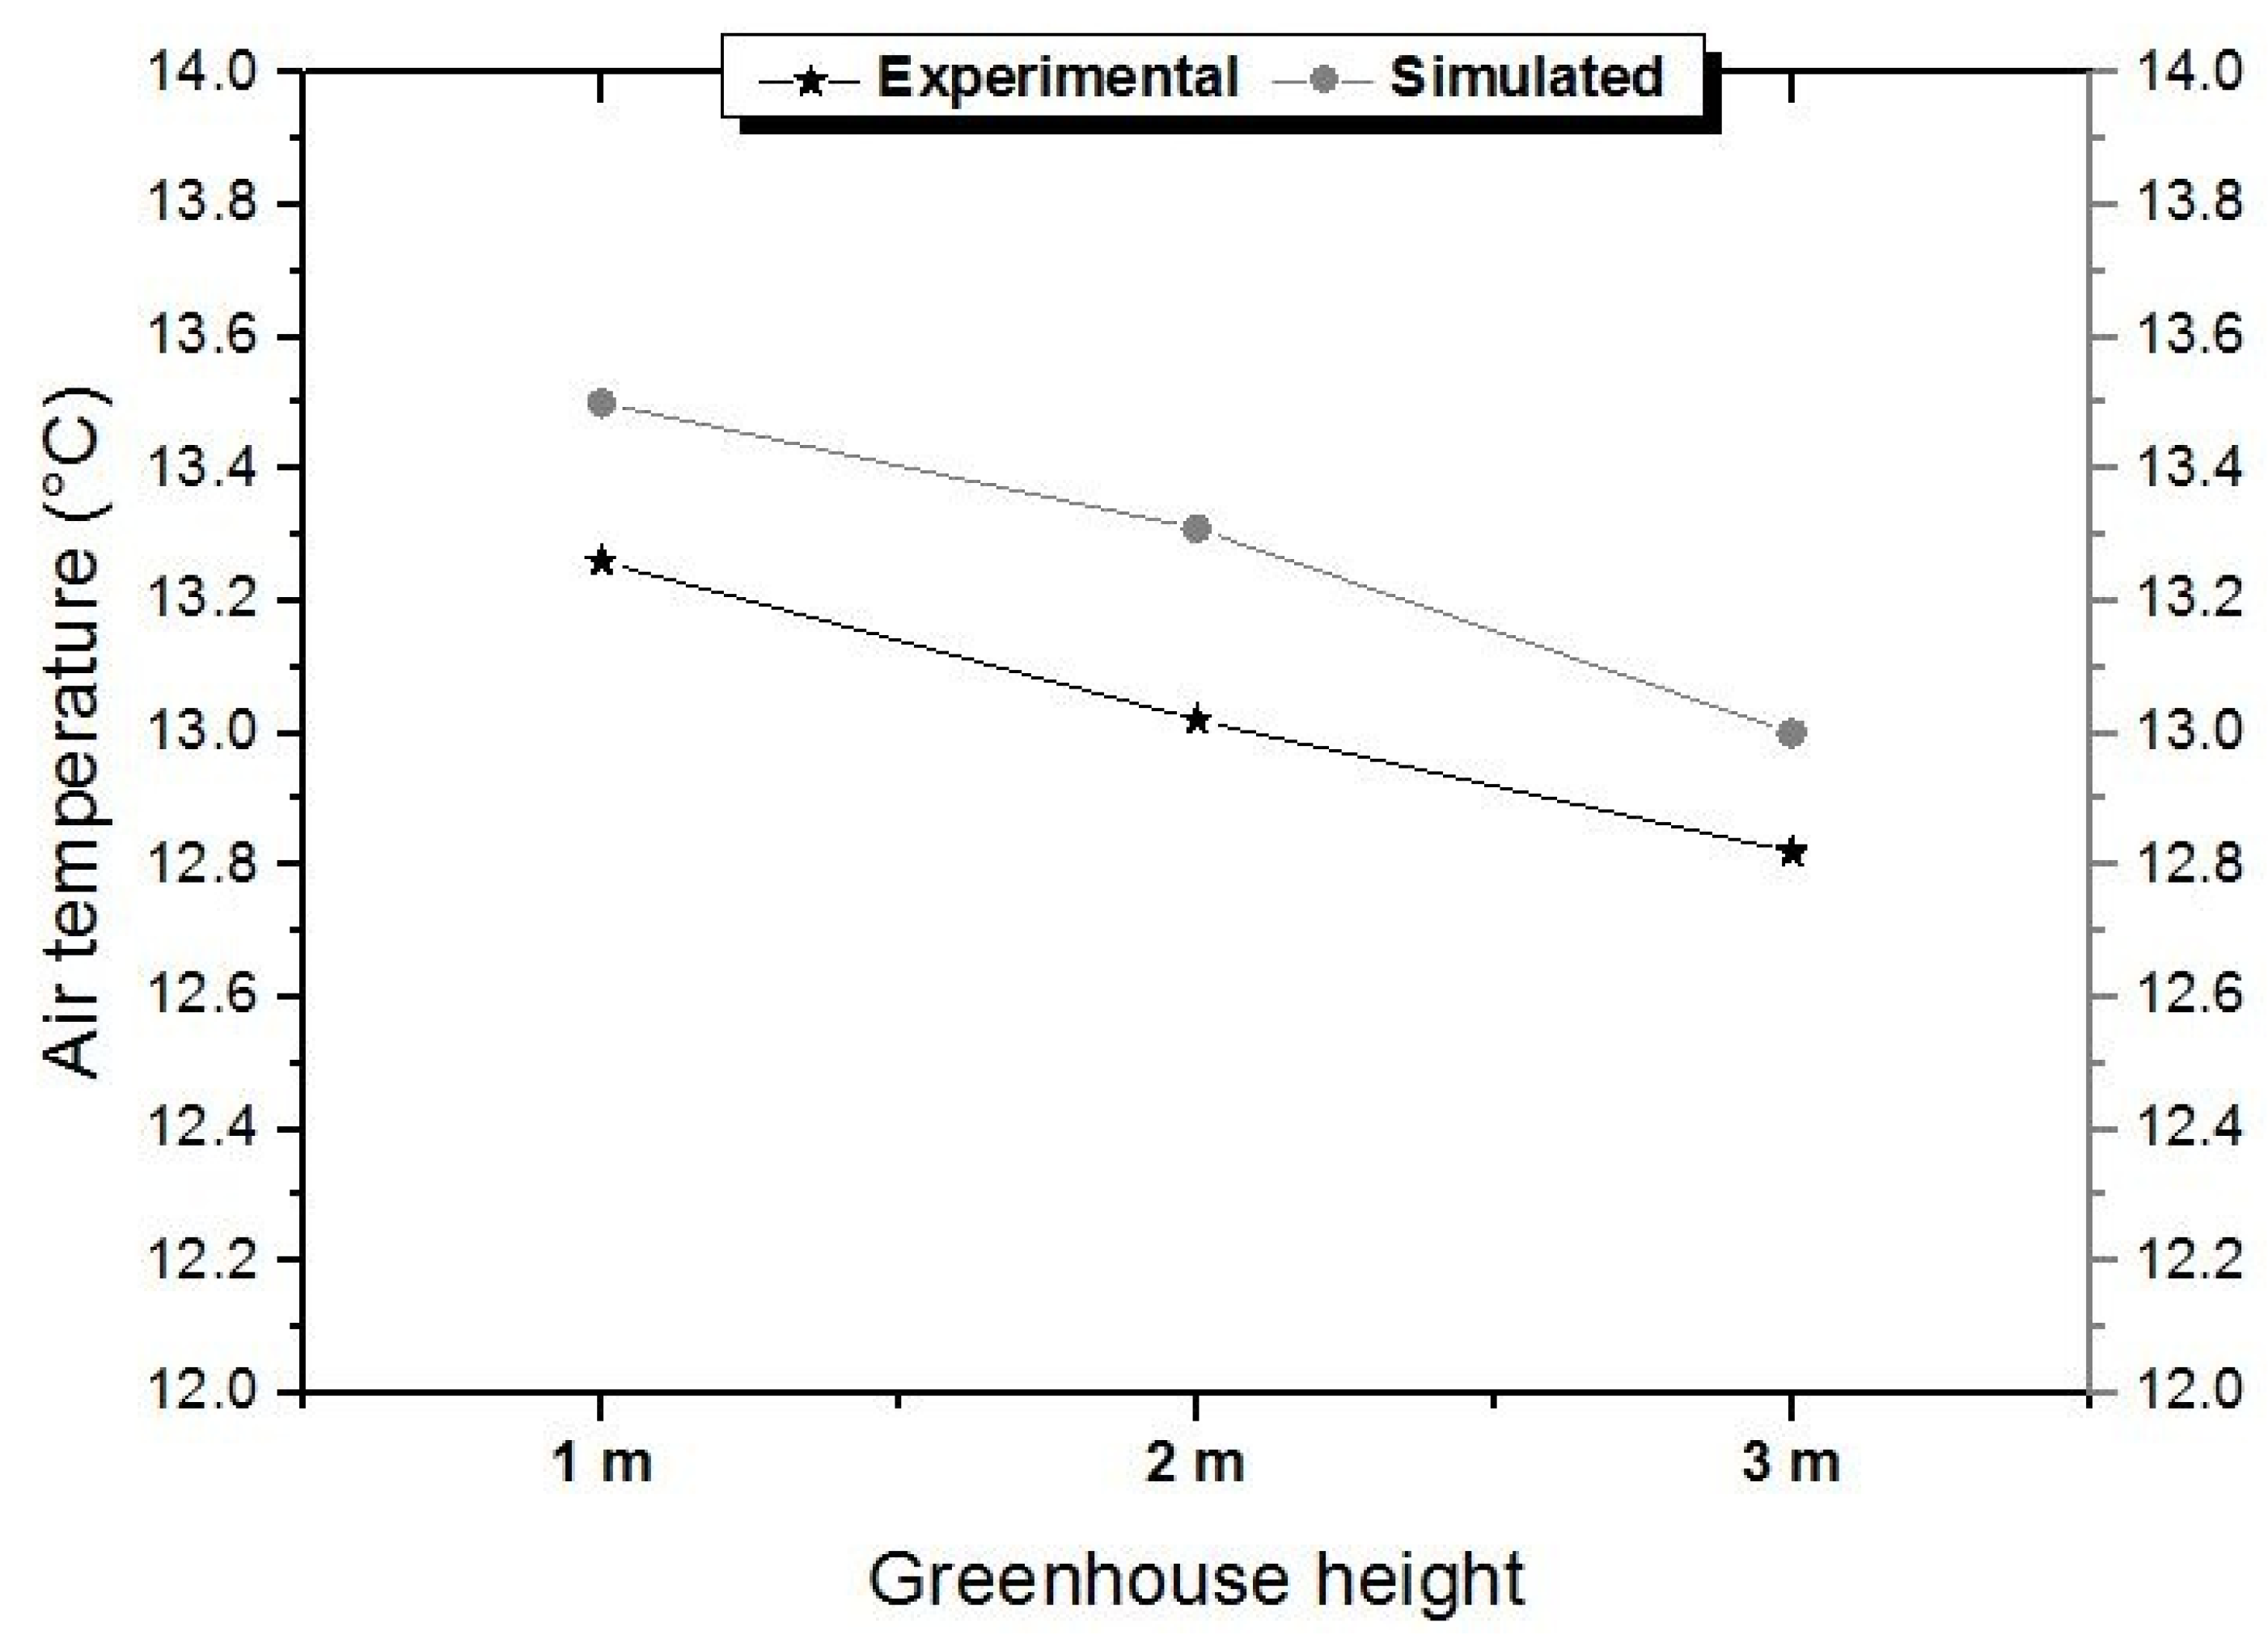
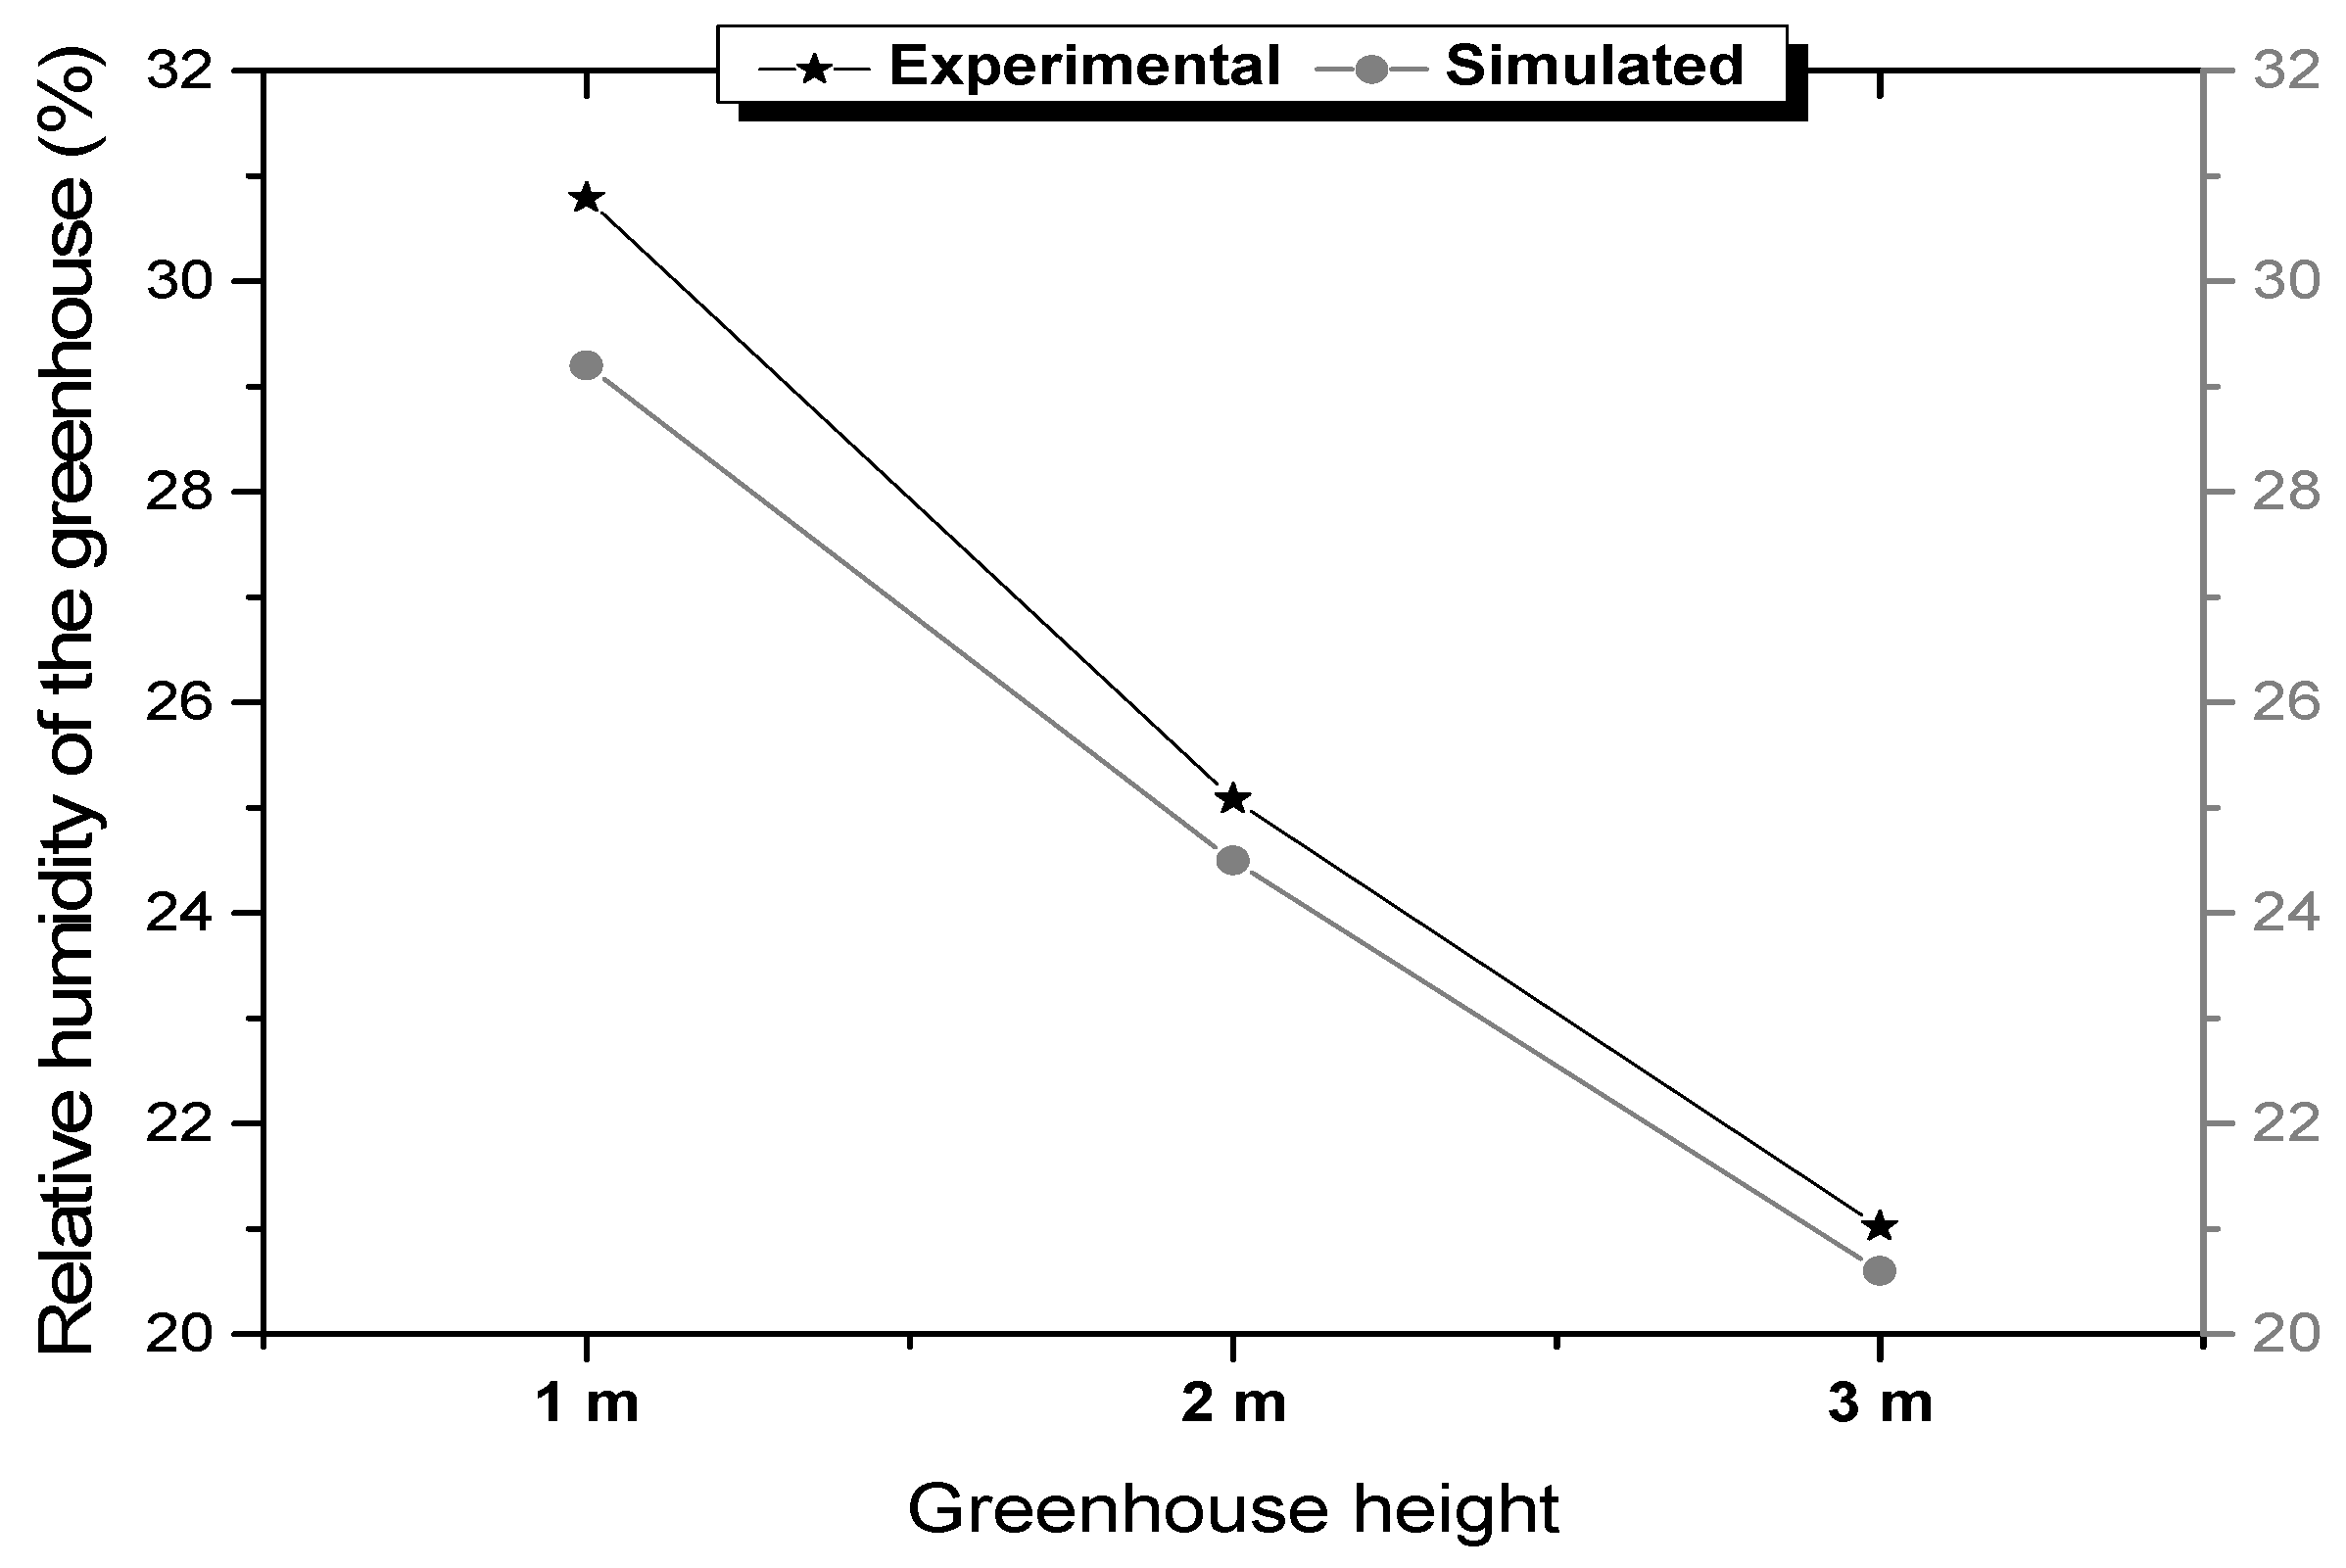
3.1. Model Validation
3.2. Solar Radiation
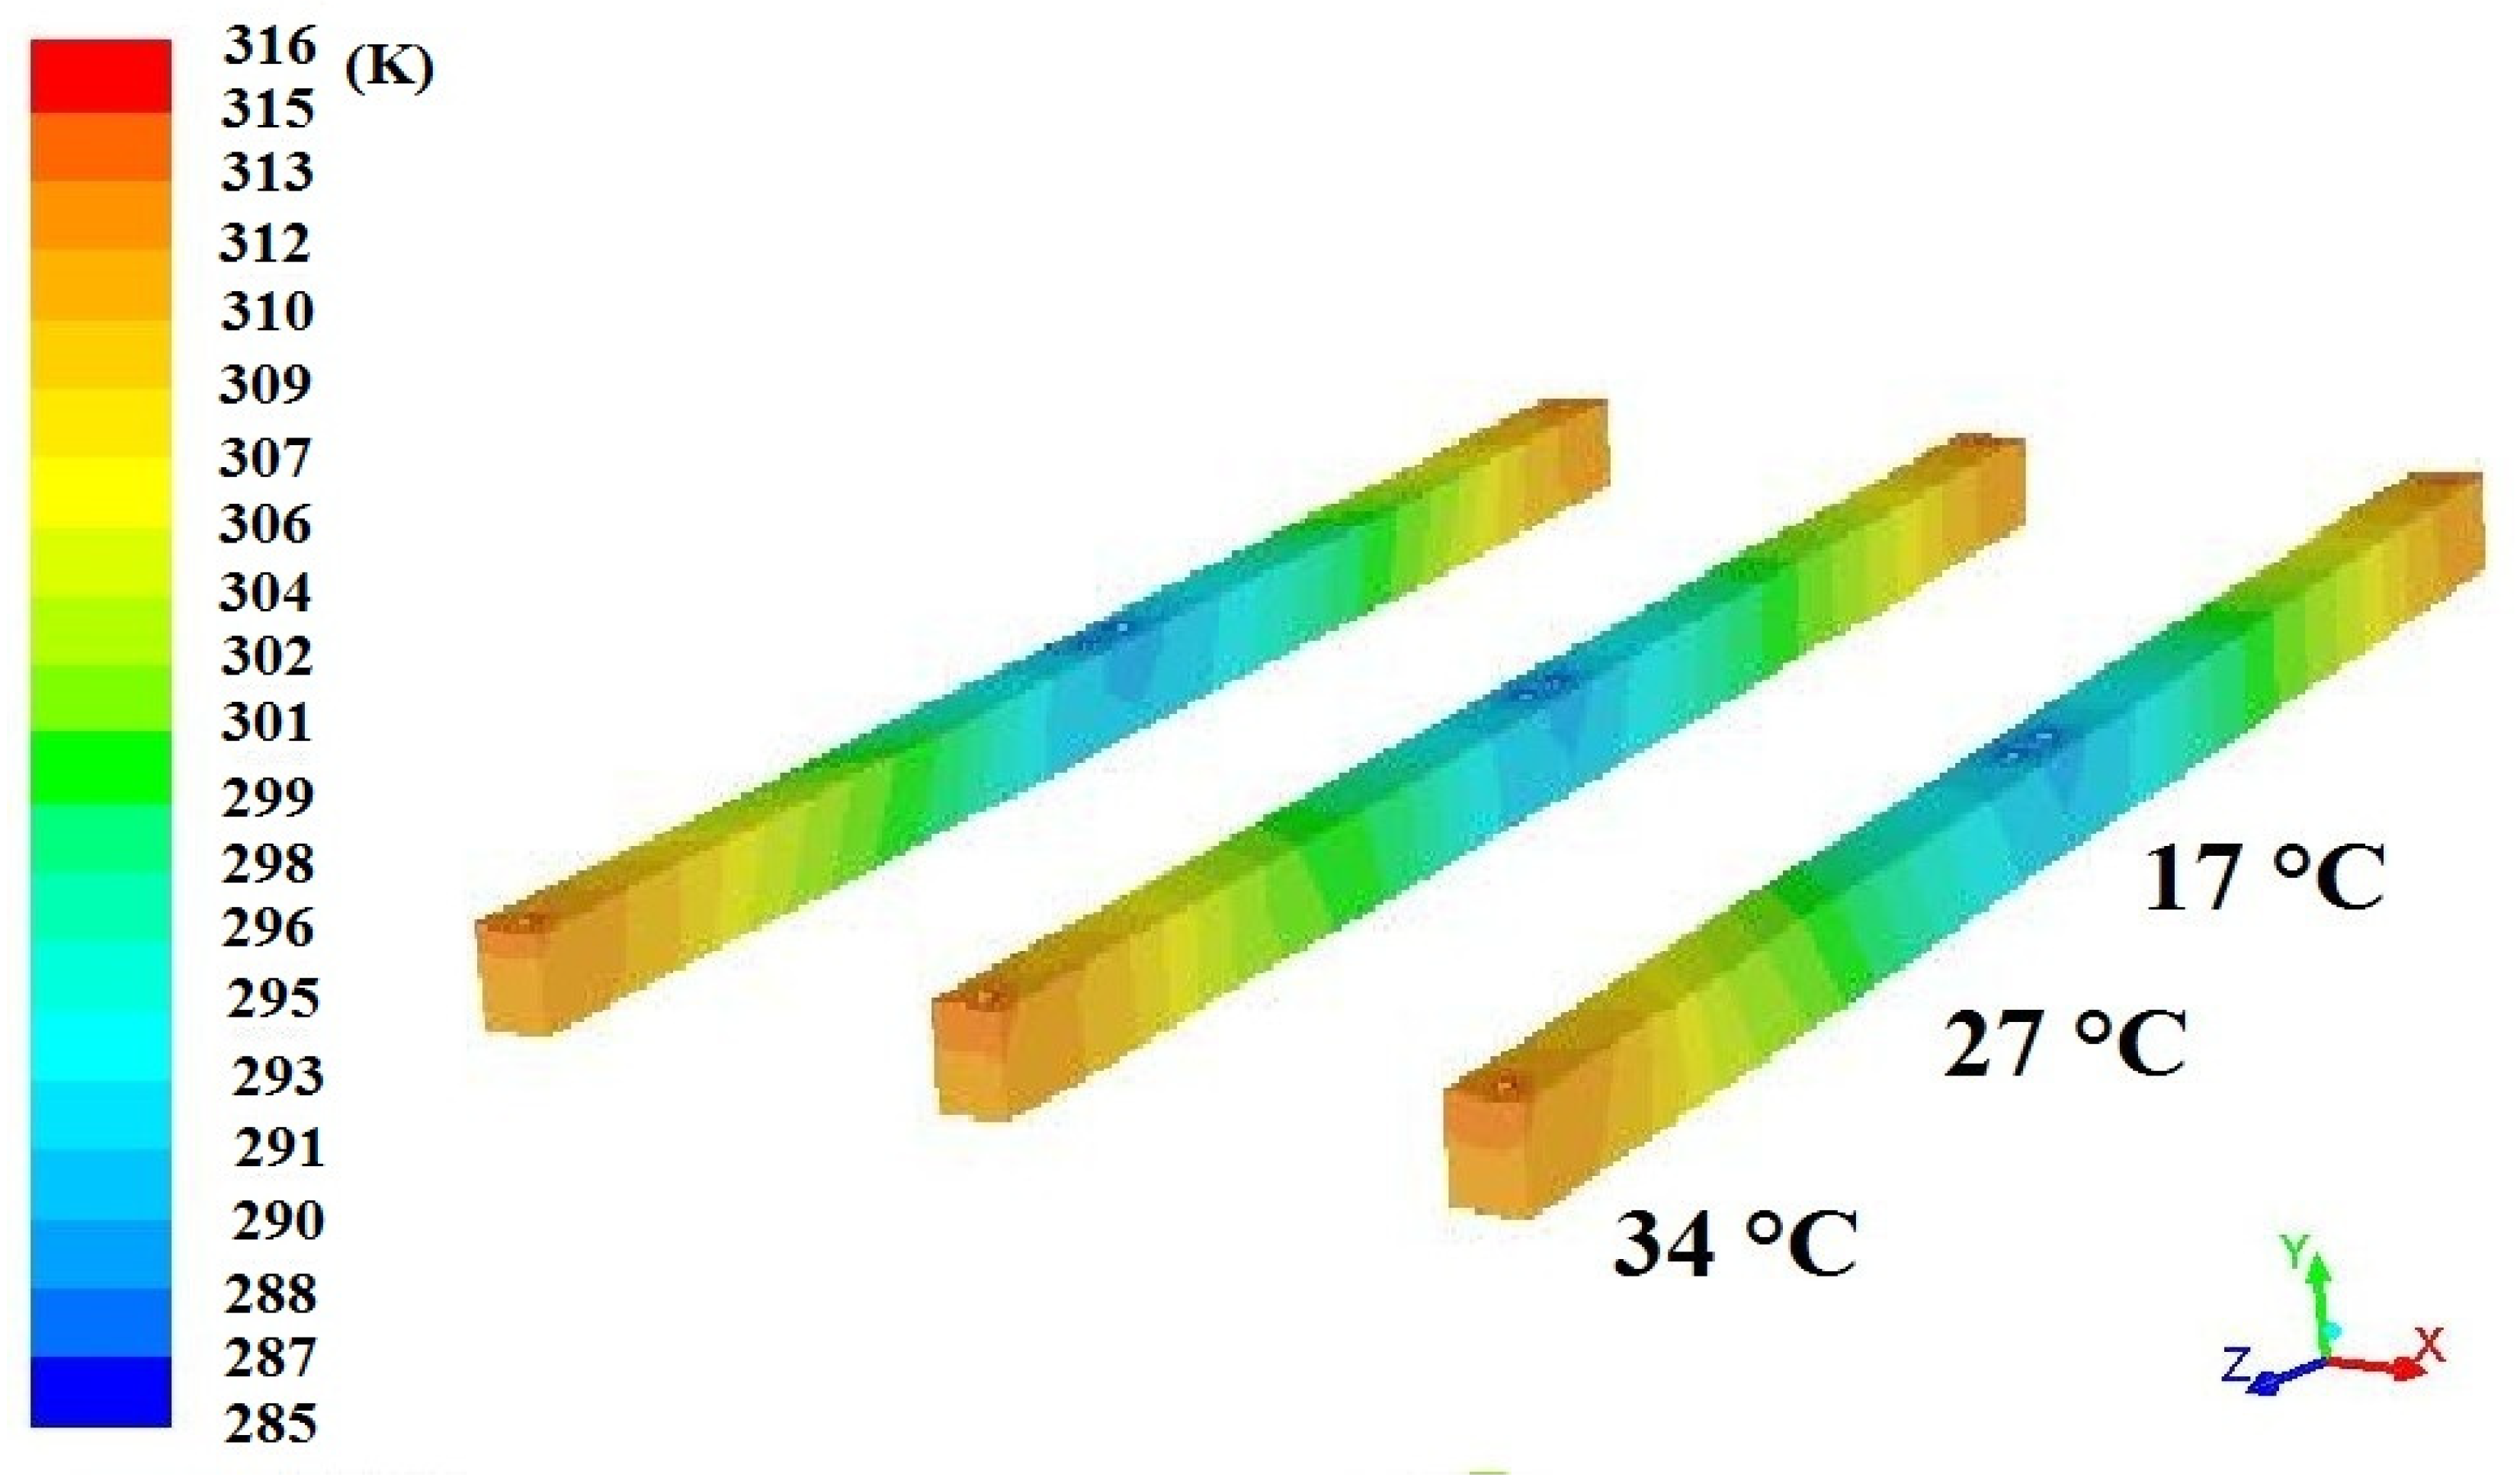
3.3. Air Temperature Profile
3.4. Relative Air Humidity Profile
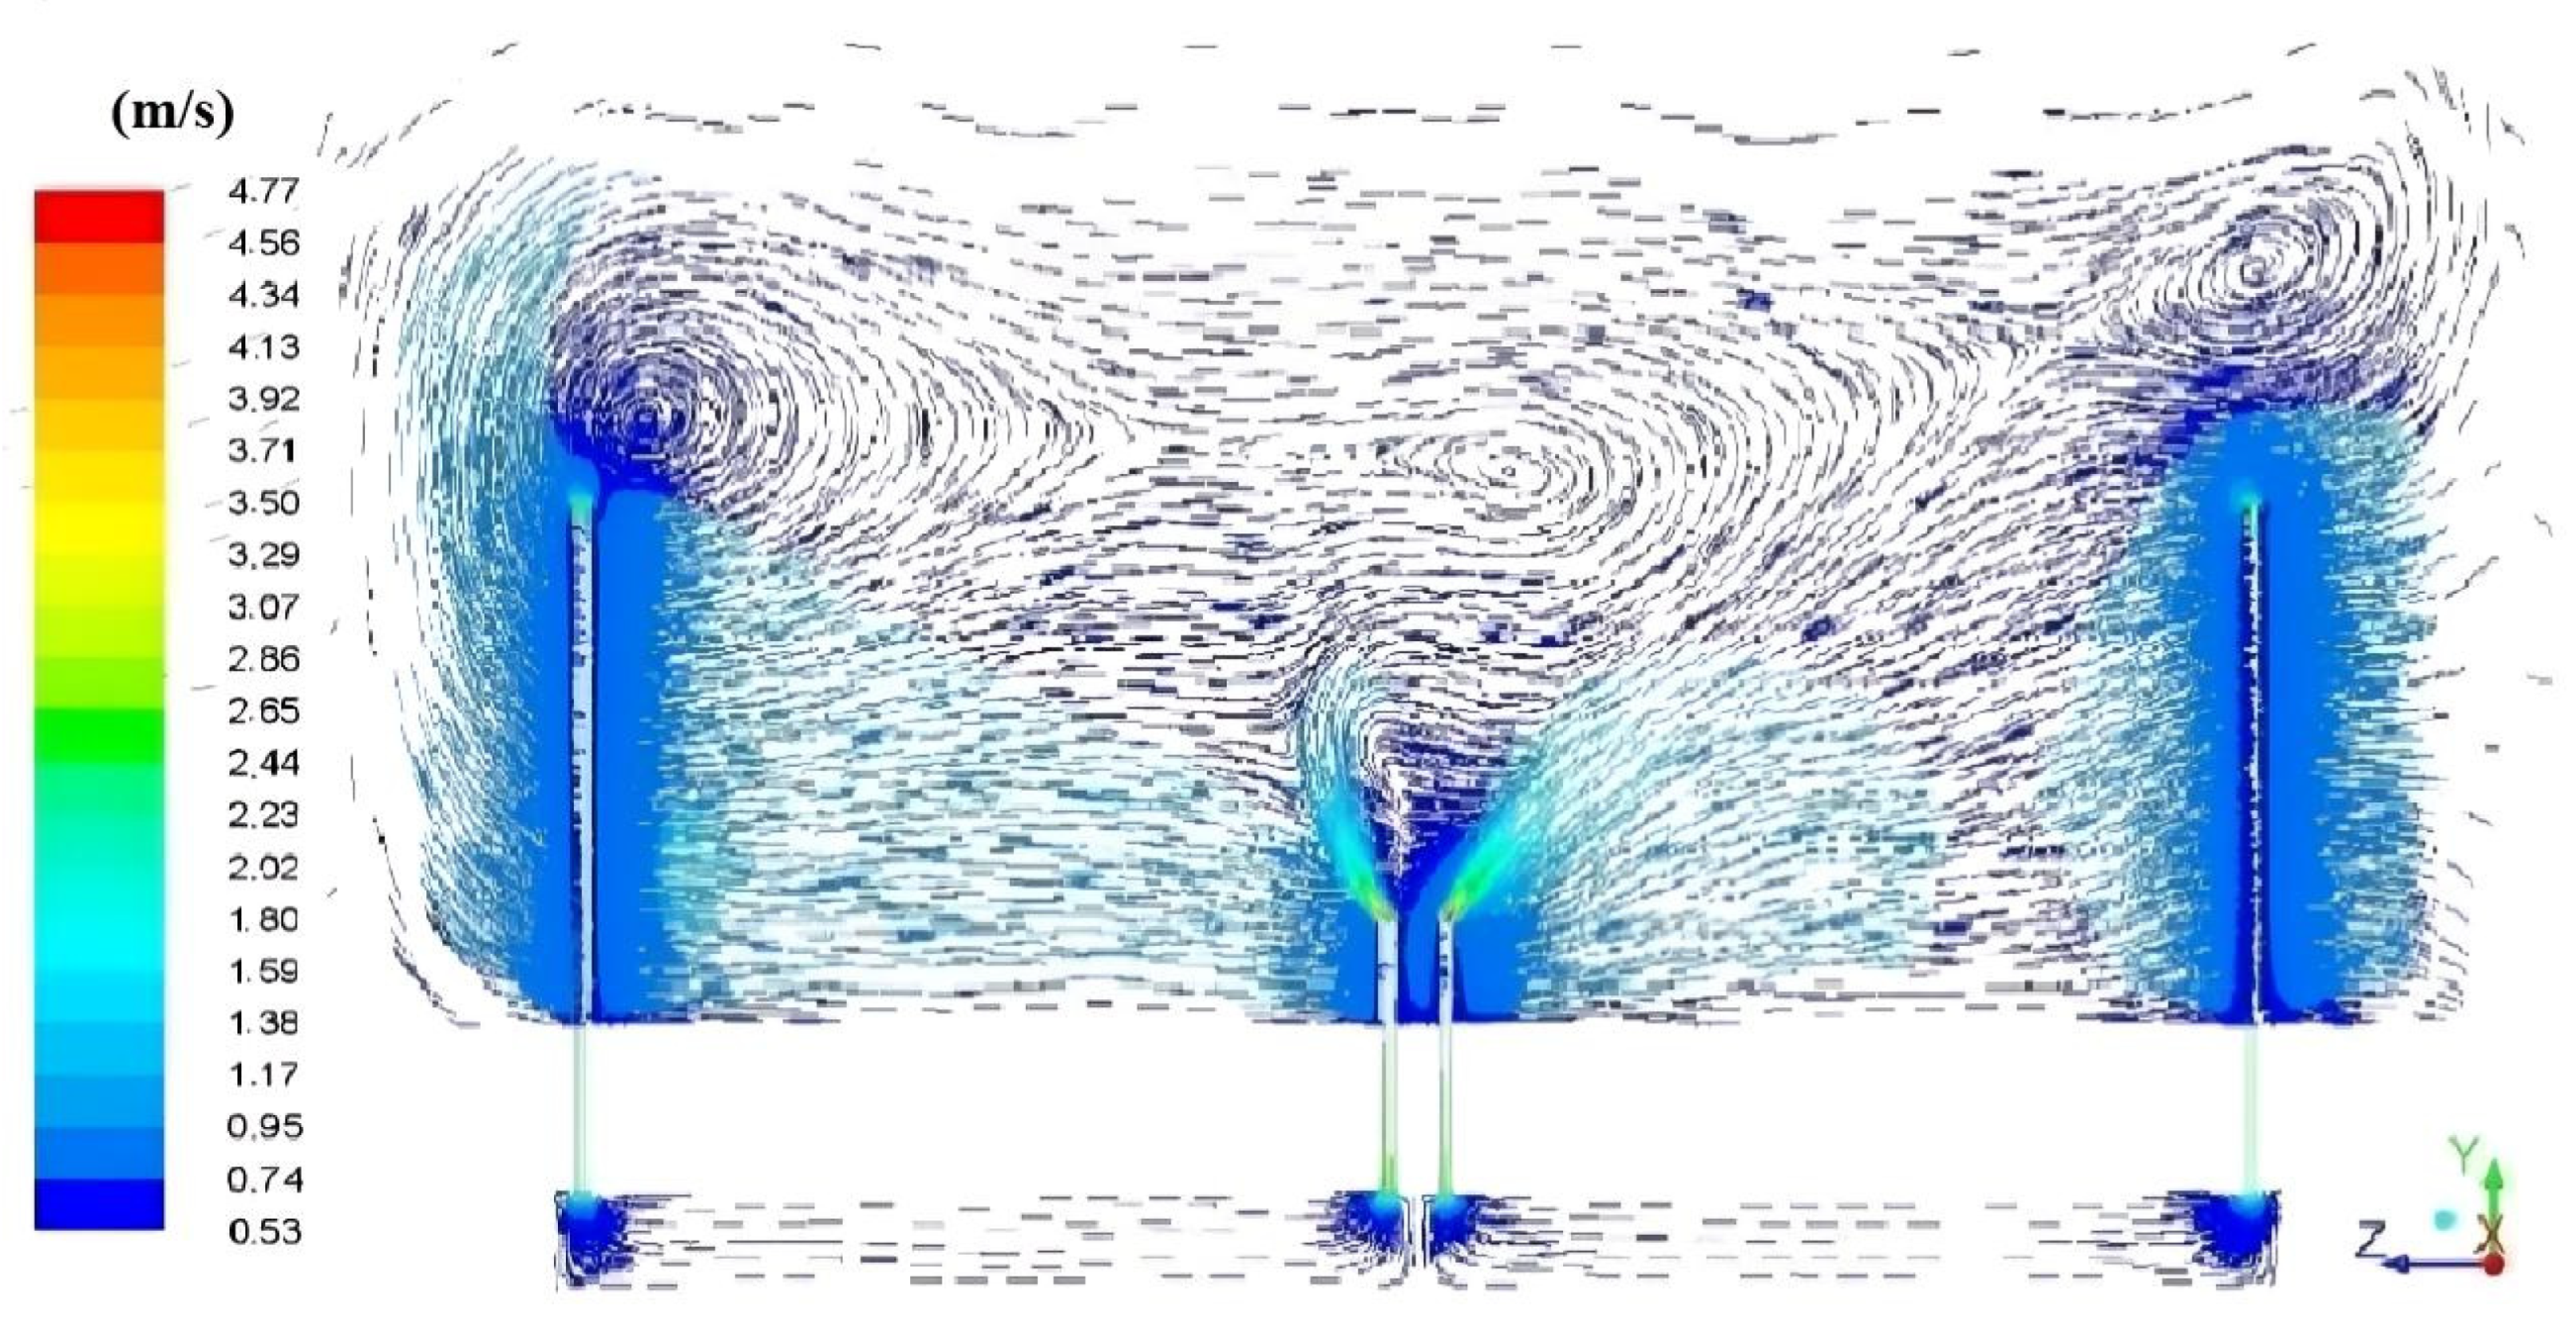
3.5. Air Velocity Profile Inside the Greenhouse
4. Conclusions
Author Contributions
Funding
Data Availability Statement
Acknowledgments
Conflicts of Interest
References
- Sethi, V.P.; Sharma, S.K. Survey and evaluation of heating technologies for worldwide agricultural greenhouse applications. Sol. Energy 2008, 82, 832–859. [Google Scholar] [CrossRef]
- Chau, J.; Sowlati, T.; Sokhansanj, S.; Preto, F.; Melin, S.; Bi, X. Economic sensitivity of wood biomass utilization for greenhouse heating application. Appl. Energy 2009, 86, 616–621. [Google Scholar] [CrossRef]
- Attar, I.; Farhat, A. Efficiency evaluation of a solar water heating system applied to the greenhouse climate. Sol. Energy 2015, 119, 212–224. [Google Scholar] [CrossRef]
- Sethi, V.P.; Sumathy, K.; Lee, C.; Pal, D.S. Thermal modeling aspects of solar greenhouse microclimate control: A review on heating technologies. Sol. Energy 2013, 96, 56–82. [Google Scholar] [CrossRef]
- Lazaar, M.; Bouadila, S.; Kooli, S.; Farhat, A. Comparative study of conventional and solar heating systems under tunnel Tunisian greenhouses: Thermal performance and economic analysis. Sol. Energy 2015, 120, 620–635. [Google Scholar] [CrossRef]
- Li, C.Y.; Sari, F.N.I.; Ting, J.M. Reactive magnetron sputter-deposited TiNxOy multilayered solar selective coatings. Sol. Energy 2019, 181, 178–186. [Google Scholar] [CrossRef]
- Kooli, S.; Bouadila, S.; Lazaar, M.; Farhat, A. The effect of nocturnal shutter on insulated greenhouse using a solar air heater with latent storage energy. Sol. Energy 2015, 115, 217–228. [Google Scholar] [CrossRef]
- Bazgaou, A.; Fatnassi, H.; Bouhroud, R.; Gourdo, L.; Ezzaeri, K.; Tiskatine, R.; Demrati, H.; Wifaya, A.; Bekkaoui, A.; Aharoune, A.; et al. An experimental study on the effect of a rock-bed heating system on the microclimate and the crop development under canarian greenhouse. Sol. Energy 2018, 176, 42–50. [Google Scholar] [CrossRef]
- Berroug, F.; Lakhala, E.K.; El Omaria, M.; Faraji, M.; El Qarniac, H. Thermal performance of a greenhouse with a phase change material north wall. Energy. Build 2011, 43, 3027–3035. [Google Scholar] [CrossRef]
- Guan, Y.; Meng, Q.; Ji, T.; Hu, W.; Li, W.; Liu, T. Experimental study of the thermal characteristics of a heat storage wall with micro-heat pipe array (MHPA) and PCM in solar greenhouse. Energy 2023, 264, 126183. [Google Scholar] [CrossRef]
- Ntinas, G.K.; Fragos, V.P.; Nikita-Martzopoulou, C. Thermal analysis of a hybrid solar energy saving system inside a greenhouse. Energy Convers. Manag. 2014, 81, 428–439. [Google Scholar] [CrossRef]
- Mobtaker, H.G.; Ajabshirchi, Y.; Ranjbar, S.F.; Matloobi, M. Simulation of thermal performance of solar greenhouse in north-west of Iran: An experimental validation. Renew. Energy 2019, 135, 88–97. [Google Scholar] [CrossRef]
- Lee, I.-B.; Bitog, J.P.P.; Hong, S.-W.; Seo, I.-H.; Kwon, K.-S.; Bartzanas, T.; Kacira, M. The past, present and future of CFD for agro-environmental applications. Comput. Electron. Agric. 2013, 93, 168–183. [Google Scholar] [CrossRef]
- Norton, T.; Sun, D.W.; Grant, J.; Fallon, R.; Dodd, V. Applications of computational fluid dynamics (CFD) in the modelling and design of ventilation systems in the agricultural industry: A review. Bioresour. Technol. 2007, 98, 2386–2414. [Google Scholar] [CrossRef] [PubMed]
- Rouboa, A.; Monteiro, E. Computational fluid dynamics analysis of greenhouse microclimates by heated underground tubes. J. Mech. Sci. Technol. 2007, 21, 2196–2204. [Google Scholar] [CrossRef]
- Chen, J.; Xu, F.; Yang, J.; Ai, Q. Optimized design of hot air pipe in greenhouse based on CFD technique. In Proceedings of the ICAE 2011 International Conference on New Technology of Agricultural, Zibo, China, 27–29 May 2011. [Google Scholar] [CrossRef]
- Mezrhab, A.; Elfarh, L.; Naji, H.; Lemonnier, D. Computation of surface radiation and natural convection in a heated horticultural greenhouse. Appl. Energy 2010, 87, 894–900. [Google Scholar] [CrossRef]
- Grigoriu, R.O.; Voda, A.; Arghira, N.; Calofir, V.; Iliescu, S.S. Temperature control of a greenhouse heated by renewable energy sources. In Proceedings of the Joint International Conference 2015 Intl Aegean Conference on Electrical Machines & Power Electronics (ACEMP), 2015 Intl Conference on Optimization of Electrical & Electronic Equipment (OPTIM) & 2015 Intl Symposium on Advanced Electromechanical Motion Systems (ELECTROMOTION), Side, Turkey, 2–4 September 2015; pp. 494–499. [Google Scholar] [CrossRef]
- Couto, N.; Rouboa, A.; Monteiro, E.; Viera, J. Computational Fluid Dynamics Analysis of Greenhouses with Artificial Heat Tube. World J. Mech. 2012, 2, 181–187. [Google Scholar] [CrossRef]
- Constantinos, K.; Tadj, N.; Nahal, M.A.; Draoui, B. CFD simulation of heating greenhouse using a perforated polyethylene ducts. Int. J. Eng. Syst. Model. Simul. 2017, 9, 3. [Google Scholar] [CrossRef]
- Morille, B.; Genez, R.; Migeon, C.; Bournet, P.E.; Ali, H.B. Night Time CFD simulations of the distributed climate inside a glasshouse. Acta Hortic. 2013, 1008, 201–206. [Google Scholar] [CrossRef]
- Campen, J.B.; Bot, G.P.A. Determination of greenhouse-specific aspects of ventilation using three-dimensional computational fluid dynamics. Biosyst. Eng. 2003, 84, 69–77. [Google Scholar] [CrossRef]
- Gholamalizadeh, E.; Kim, M.H. Three-dimensional CFD analysis for simulating the greenhouse effect in solar chimney power plants using a two-band radiation model. Renew. Energy 2014, 63, 498–506. [Google Scholar] [CrossRef]
- Lam, C.K.G.; Bremhorst, K. A modified form of the k-ε model for predicting wall turbulence. J. Fluids Eng. Trans. ASME 1981, 103, 456–460. [Google Scholar] [CrossRef]
- Misra, R.; Bansal, V.; Das Agrawal, G.; Mathur, J.; Aseri, T.K. CFD analysis based parametric study of derating factor for Earth Air Tunnel Heat Exchanger. Appl. Energy 2013, 103, 266–277. [Google Scholar] [CrossRef]
- Hoff, S.J.; Janni, K.A.; Jacobson, L.D. Three-dimensional buoyant turbulent flows in a scaled model, slot-ventilated, livestock confinement facility. Trans. Am. Soc. Agric. Eng. 1992, 35, 671–686. [Google Scholar] [CrossRef]
- Fluent INC. FLUENT 6.3 User’s Guide. 2006. Available online: https://romeo.univ-reims.fr/documents/fluent/fluentUserGuide.pdf (accessed on 11 January 2023).
- Boulard, T.; Wang, S. Experimental and numerical studies on the heterogeneity of crop transpiration in a plastic tunnel. Comput. Electron. Agric. 2002, 34, 173–190. [Google Scholar] [CrossRef]
- Boulard, T.; Wang, S. Greenhouse crop transpiration simulation from external climate conditions. Agric. For. Meteorol. 2000, 100, 25–34. [Google Scholar] [CrossRef]
- Kichah, A.; Bournet, P.E.; Migeon, C.; Boulard, T. Measurement and CFD simulation of microclimate characteristics and transpiration of an Impatiens pot plant crop in a greenhouse. Biosyst. Eng. 2012, 112, 22–34. [Google Scholar] [CrossRef]
- Impron, I.; Hemming, S.; Bot, G.P.A. Simple greenhouse climate model as a design tool for greenhouses in tropical lowland. Biosyst. Eng. 2007, 98, 79–89. [Google Scholar] [CrossRef]
- Haxaire, C. D’une rationalité à l’autre: Ce que masque parfois la prescription de psychotropes. Sci. Soc. Sante 1999, 17, 53–57. [Google Scholar] [CrossRef]
- Saberian, A.; Sajadiye, S.M. The effect of dynamic solar heat load on the greenhouse microclimate using CFD simulation. Renew. Energy 2019, 138, 722–737. [Google Scholar] [CrossRef]
- Kim, R.-W.; Kim, J.-G.; Lee, I.-B.; Yeo, U.-H.; Lee, S.-Y.; Decano-Valentin, C. Development of three-dimensional visualisation technology of the aerodynamic environment in a greenhouse using CFD and VR technology, part 1: Development of VR a database using CFD. Biosyst. Eng. 2021, 207, 33–58. [Google Scholar] [CrossRef]


| Materials | Density (kg/m3) | Specific Heat Capacity (J/kg·K) | Thermal Conductivity (W/m·K) |
|---|---|---|---|
| Air | Incompressible ideal gas | 1006.43 | 0.0242 |
| Water vapor | 0.5542 | Piecewise polynomial | 0.0261 |
| Soil | 1500 | 1350 | 0.75 |
| PVC | 1380 | 1046 | 0.2 |
| Canopy | 700 | 2310 | 0.173 |
| Average Weather Conditions in Two Hours | ||
|---|---|---|
| At Solar Noon | At Midnight | |
| Outside temperature (°C) | 26.94 | 10.24 |
| Relative humidity (%) | 39.22 | 91.65 |
| Outside wind velocity (m/s) | 1.27 | 0.64 |
| Global radiation (W/m2) | 812.72 | 0 |
| Wall temperature (°C) | 28.43 | 12.52 |
| Soil temperature (°C) | 21.33 | 17.21 |
Disclaimer/Publisher’s Note: The statements, opinions and data contained in all publications are solely those of the individual author(s) and contributor(s) and not of MDPI and/or the editor(s). MDPI and/or the editor(s) disclaim responsibility for any injury to people or property resulting from any ideas, methods, instructions or products referred to in the content. |
© 2023 by the authors. Licensee MDPI, Basel, Switzerland. This article is an open access article distributed under the terms and conditions of the Creative Commons Attribution (CC BY) license (https://creativecommons.org/licenses/by/4.0/).
Share and Cite
Bazgaou, A.; Fatnassi, H.; Bouharroud, R.; Tiskatine, R.; Wifaya, A.; Demrati, H.; Bammou, L.; Aharoune, A.; Bouirden, L. CFD Modeling of the Microclimate in a Greenhouse Using a Rock Bed Thermal Storage Heating System. Horticulturae 2023, 9, 183. https://doi.org/10.3390/horticulturae9020183
Bazgaou A, Fatnassi H, Bouharroud R, Tiskatine R, Wifaya A, Demrati H, Bammou L, Aharoune A, Bouirden L. CFD Modeling of the Microclimate in a Greenhouse Using a Rock Bed Thermal Storage Heating System. Horticulturae. 2023; 9(2):183. https://doi.org/10.3390/horticulturae9020183
Chicago/Turabian StyleBazgaou, Abderrahim, Hicham Fatnassi, Rachid Bouharroud, Rachid Tiskatine, Ahmed Wifaya, Hassan Demrati, Lahcen Bammou, Ahmed Aharoune, and Lahcen Bouirden. 2023. "CFD Modeling of the Microclimate in a Greenhouse Using a Rock Bed Thermal Storage Heating System" Horticulturae 9, no. 2: 183. https://doi.org/10.3390/horticulturae9020183
APA StyleBazgaou, A., Fatnassi, H., Bouharroud, R., Tiskatine, R., Wifaya, A., Demrati, H., Bammou, L., Aharoune, A., & Bouirden, L. (2023). CFD Modeling of the Microclimate in a Greenhouse Using a Rock Bed Thermal Storage Heating System. Horticulturae, 9(2), 183. https://doi.org/10.3390/horticulturae9020183