Abstract
To identify herbaceous peony cultivars with strong photosynthetic productivity, we compared the photosynthetic characteristics of 20 herbaceous peony cultivars based on four photosynthetic characteristics parameters and established light–response curves under a light intensity gradient, using CIRAS-3 portable photosynthetic dynamic monitoring. The net photosynthetic rate (Pn) showed a “unimodal” diurnal variation pattern, with a peak around 12:00. The diurnal pattern of the transpiration rate was the same as that of Pn. Stomatal conductance values (Gs) showed similar patterns among the cultivars, with only small differences. The daily variation in intracellular CO2 concentration (Ci) showed an opposite trend to that of Pn. When the photosynthetically active radiation was 0–400 μmol·m−2s−1, Pn increased linearly and gradually with increasing light intensity. ‘Xueyuanhonghua’, ‘Qingwen’, ‘Taohuafeixue’, ‘Chifen’, and ‘Qihualushuang’ showed high photosynthetic productivity. ‘Xueyuanhonghua’, ‘Fushi’, ‘Qingwen’, ‘Tianshanhongxing’, ‘Qingtianlan’, ‘Dafugui’, and ‘Hongfushi’ had high light saturation points and the highest light resistance. ‘Xueyuanhonghua’, ‘Qingwen’, ‘Taohuafeixue’, ‘Tianshanhongxing’, ‘Qingtianlan’, ‘Guifeichacui’, ‘Chifen’, and ‘Hongxiuqiu’ had low light compensation points. Thus, two cultivars with strong photosynthetic productivity, ‘Xueyuanhonghua’ and ‘Qingwen’, can be cross-bred to obtain both light- and shade-tolerant plants. This study provides a theoretical basis for breeding new cultivars with high photosynthetic productivity.
1. Introduction
The herbaceous peony (Paeonia lactiflora Pall.) is a perennial herb belonging to the Paeoniaceae family that is widely cultivated worldwide. Currently, cultivated herbaceous peony cultivars are divided into three groups: lactiflora, hybrid, and Itoh. Herbaceous peony is a typical temperate long-day plant that prefers warmth; however, it is resistant to cold [1]. Numerous herbaceous peony cultivars, with various attractive colors and patterns, exist and are widely used, for example, in landscaping and as fresh-cut flowers and potted plants. Herbaceous peony not only has high ornamental value, but also medicinal, edible, and health-care values. Its roots contain pharmacologically active ingredients, such as paeoniflorin, and its petals contain various nutrients, active ingredients, and minerals [2]. Organ growth and development in herbaceous peony is affected by climatic conditions. Flower bud differentiation, a critical step in the flowering process, occurs during the autumn–winter (short-day season), and flower bud development and flowering occur during the long days of summer. In conditions of insufficient light or during short days, mixed bud germination occurs and may result in plants having long leaves without flowers or with abnormal flowers [3], seriously affecting the ornamental and medicinal value of herbaceous peony.
Plant photosynthetic characteristics play a decisive role in plant productivity [4,5]. Studies have shown that improved photosynthetic capacity increases the quantity and quality of herbaceous peony flowers, extends their flower life, and enhances their ornamental value [6]. The photosynthetic process is sensitive to the environment [7,8]. Environmental factors such as light and humidity play important roles in regulating carbohydrate exchange in plant leaves. Stomatal opening and closing are regulated by the activation of photosensitive ion channels. When light intensity is high, the ion channels are activated, resulting in stomatal opening. In contrast, when light is weak or absent, these channels are not activated and the stomata remain closed [9]. The state of stomatal opening directly affects the transpiration rate of plant leaves. When the humidity around the leaves or in the surrounding environment is too high during the day, the plant controls the transpiration rate by adjusting stomatal closure [10]. When plants adapt to changes in the external environment, photosynthetic characteristics change correspondingly, leading to certain differences in the photosynthetic performance of different germplasm of the same plant.
When cultivated for medicinal purposes, herbaceous peony is generally propagated from seeds sown into a field, and plants can be harvested after 3–5 years of vegetative growth. When cultivated for ornamental purposes, they are generally propagated using division propagation, and daughter plants require 3–4 years of vegetative growth before they can be divided again. Furthermore, the low reproduction coefficient limits the development of high-value cultivars [11]. The more suitable the seasonal light conditions with more energy available, the more vigorous the vegetative growth and the higher the organic matter accumulation [12]. The suitability of the light intensity for herbaceous peony plants is related to the growth of the vegetative organs, photosynthetic production, storage of nutrients in the root system, development of scale buds in the winter, and consumption of accumulated resources for flowering in the spring of the following year [13].
The slow propagation and cultivation of new cultivars restrict the development of the herbaceous peony industry, which requires modernization and industrialization to improve the quantity and quality of herbaceous peony cultivars. A previous study showed clear and stable genetic differences in the photosynthetic rate among peony cultivars and among individuals of the same cultivar, indicating the possibility of breeding crop cultivars with high photosynthetic rates [14]. Hence, high-light-efficiency breeding has become a hot topic in plant genetic breeding. In this study, we aimed to generate a theoretical basis for the breeding of new varieties with high light efficiency. Toward this aim, we dynamically monitored the typical photosynthetic metrics—net photosynthetic rate (Pn), intercellular carbon dioxide concentration (Ci), transpiration rate (Tr), and stomatal conductance (Gs)—of different herbaceous peony cultivars, and light–response curves under various light intensities were dynamically monitored. We compared the photosynthetic characteristics of the different cultivars according to the light saturation and compensation points. Our findings provide technical support for the cultivation and further industrialization of herbaceous peony.
2. Materials and Methods
2.1. Test Site and Materials
The experiment was completed in early May 2022 at the Herbaceous Peony Resource Nursery and Horticultural Experiment Center of Shandong Agricultural University, located in the south of Tai’an City (35°38′ N 116°02′ E), China. The center is located in a temperate semi-humid continental monsoon climate zone with four distinct seasons: summer, winter, autumn, and spring. Summers and winters are long, whereas spring and autumn seasons are short. Rainfall is concentrated during the summer. The mean annual temperature ranges between 11 and 14 °C, with occasionally extremely low temperatures around −20 °C and extremely high temperatures around 41 °C. The region has a frost-free period of approximately 187 days, and annual precipitation of 600–700 mm. The mean annual relative humidity is 65%. The 20 experimental herbaceous peony cultivars analyzed in this study were ‘Xuanyuanhonghua’, ‘Fushi’, ‘Yangfeichuyu’, ‘Huguangshanse’, ‘Fenchijinyu’, ‘Gaoganhong’, ‘Bingshan’, ‘Xuefeng’, ‘Qingwen’, ‘Taohuafeixue’, ‘Tianshanhongxing’, ‘Qingtianlan’, ‘Guifeichacui’, ‘Dafugui’, ‘Hongfeng’, ‘Chifen’, ‘Hongxiuqiu’, ‘Qihualushuang’, ‘Dongjingnvlang’, and ‘Hongfushi’ (Figure 1). All cultivars were planted, cultivated, and managed under the same natural conditions. The planting density was 80 cm × 80 cm. The plants were planted in loam soil, pH 7.6, with an organic matter content of 23.32 g kg−1, ammonium nitrogen content of 25.72 g kg−1, nitrate nitrogen content of 1.70 g kg−1, available phosphorus content of 47.63 g kg−1, and available potassium content of 79.00 g kg−1.
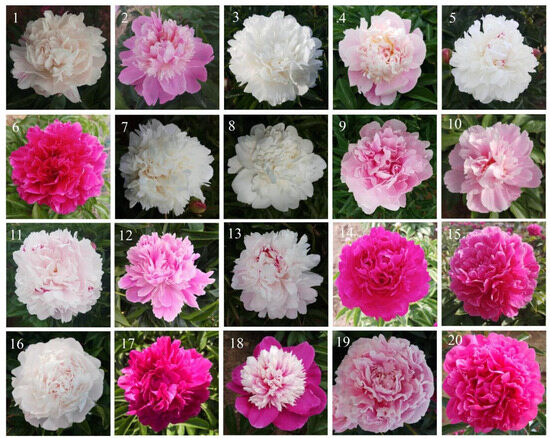
Figure 1.
Herbaceous peony cultivars tested in this study. Note: 1, ‘Xueyuanhonghua’; 2, ‘Fushi’; 3, ‘Yangfeichuyu’; 4, ‘Huguangshanse’; 5, ‘Fenchijinyu’; 6, ‘Gaoganhong’; 7, ‘Bingshan’; 8, ‘Xuefeng’; 9, ‘Qingwen’; 10, ‘Taohuafeixue’; 11, ‘Tianshanhongxing’; 12, ‘Qingtianlan’; 13, ‘Guifeichacui’; 14, ‘Dafugui’; 15, ‘Hongfeng’; 16, ‘Chifen’; 17, ‘Hongxiuqiu’; 18, ‘Qihualushuang’; 19, ‘Dongjingnvlang’; and 20, ‘Hongfushi’.
2.2. Measurement of Daily Variation in Net Photosynthesis
According to the method of Du [15], net Pn, Ci, Tr, and Gs were measured on a sunny day with full sunshine and few clouds, using a CIRAS-3 portable photosynthesis analyzer (PP Systems; Boston, MA, USA). Measurements were obtained from healthy, functional leaves with robust, consistent growth and at the same plant position. Three herbaceous peony plants were selected for each cultivar, three functional leaves were measured for each plant, and the measurements were repeated thrice for each leaf. The leaf chamber conditions were consistent with the natural environment during the measurement. Daily photosynthesis metrics were measured at 08:00, 10:00, 12:00, 14:00, 16:00, and 18:00.
2.3. Establishment of Photosynthetic Light-Response Curves
According to Du [15], data for photosynthetic light-response curves were collected using the CIRAS-3 instrument. The measurement conditions were set as follows: CO2 concentration, 360 mg L−1; relative humidity, 60%; and light intensity 2000, 1600, 1200, 800, 400, 200, 100 and 0 μmol·m−2s−1. Light–response curves were obtained on sunny days from 10:00 to 11:30.
2.4. Data Analysis
Microsoft Excel software (Office 2016, Microsoft, Redmond, WA, USA) was used to analyze the data and create graphs. SPSS Statistics V22.0 (IBM Corp., Armonk, NY, USA) was used to analyze the errors, significance of differences, and principal components. The least significant difference and Duncan’s new multiple-range tests were used to compare the differences among samples. The Kaiser–Meyer–Olkin test and Bartlett sphere test were used to test the applicability of factor analysis to the original data.
3. Results
3.1. Diurnal Variation in Photosynthetic Parameters in 20 Herbaceous Peony Cultivars
3.1.1. Diurnal Variation in Pn
The Pn of the 20 herbaceous peony cultivars showed a “unimodal” trend (Figure 2). In the morning, with increasing light intensity and temperature, Pn continued to increase, and it peaked around 12:00 for all cultivars. In the afternoon, with the weakening of light intensity, the Pn values of the cultivars continually declined until 18:00, when the lowest values were reached. In the afternoon, ‘Dongjingnvlang’ exhibited the largest decline in Pn of approximately 10 μmol·m−2s−1, whereas ‘Guifeichacui’ and ‘Dafugui’ exhibited the smallest Pn reductions of approximately 4 μmol·m−2s−1.
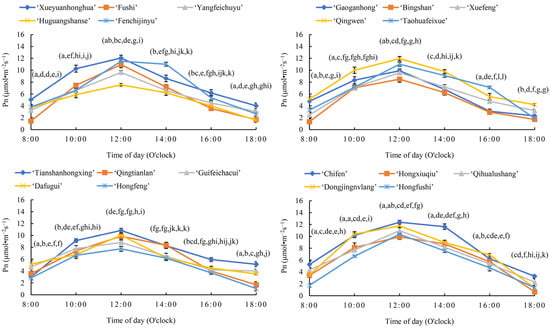
Figure 2.
Diurnal changes in the net photosynthesis rate (Pn) of the 20 herbaceous peony cultivars. Different lowercase letters indicate differences among the 20 herbaceous peony cultivars at the same time at p < 0.05; error lines indicate standard errors.
Seven cultivars had a Pn peak value between 11 and 13 μmol·m−2s−1: ‘Xuanyuanhonghua’, ‘Fenchijinyu’, ‘Qingwen’, ‘Taohuafeixue’, ‘Chifen’, ‘Qihualushuang’, and ‘Dongjingnvlang’. For 13 cultivars, the Pn peak was between 6 and 11 μmol·m−2s−1: ‘Fushi’, ‘Yangfeichuyu’, ‘Huguangshanse’, ‘Gaoganhong’, ‘Bingshan’, ‘Xuefeng’, ‘Qingwen’, ‘Tianshanhongxing’, ‘Guifeichacui’, ‘Dafugui’, ‘Hongfeng’, ‘Hongxiuqiu’, and ‘Hongfushi’.
3.1.2. Diurnal Variation in Gs
The Gs showed similar patterns, with only small differences noted among different cultivars (Figure 3). The Gs of each cultivar exhibited a variation trend similar to that of Pn. From 08:00 onwards, Gs showed an upward trend and peaked around 12:00 for all cultivars. In the afternoon, the Gs continually declined until 18:00, when the lowest values were observed.
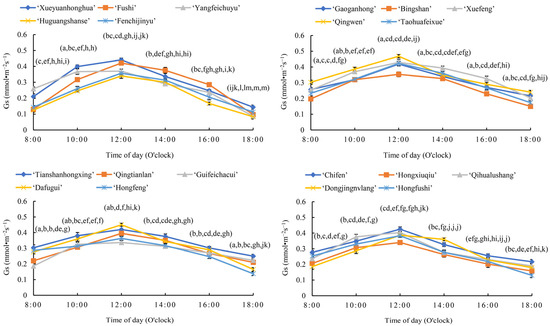
Figure 3.
Diurnal changes in the stomatal conductance (Gs) of the 20 herbaceous peony cultivars. Different lowercase letters indicate differences among the 20 herbaceous peony cultivars at the same time at p < 0.05; error lines indicate standard errors.
Ten cultivars, ‘Yangfeichuyu’, ‘Huguangshanse’, Fenchijinyu’, ‘Bingshan’, ‘Qingtianlan’, ‘Guifeichacui’, ‘Hongfeng’, ‘Hongxiuqiu’, ‘Dongjingnvlang’, and ‘Hongfushi’ had a Gs peak of 0.3–0.4 mmol·m−2s−1, whereas the other 10 cultivars, ‘Xuanyuanhonghua’, ‘Fushi’, ‘Gaoganhong’, ‘Xuefeng’, ‘Qingwen’, ‘Taohuafeixue’, ‘Tianshanhongxing’, ‘Dafugui’, ‘Chifen’, and ‘Qihualushuang’ had a Gs peak of 0.4–0.5 mmol·m−2s−1.
3.1.3. Diurnal Variation in Ci
The average daily Ci showed similar trends among the tested cultivars. The highest values were observed in the morning, after which they decreased by 12:00, and increased again in the evening. This “high–low–high” trend of Ci contrasted with that of the daily variation in Pn (Figure 4).
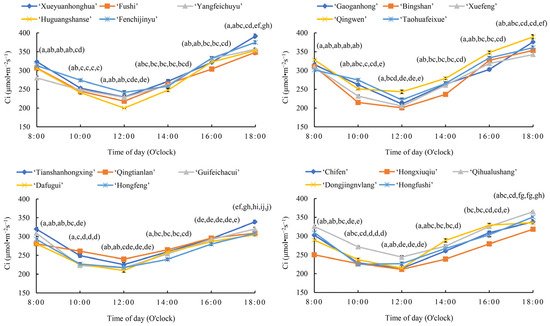
Figure 4.
Diurnal changes in the intracellular CO2 concentration (Ci) of the 20 herbaceous peony cultivars. Different lowercase letters indicate differences among the 20 herbaceous peony cultivars at the same time at p < 0.05; error lines indicate standard errors.
From 08:00 to 12:00, the Ci values of all cultivars decreased; the Ci values of ‘Yangfeichuyu’, ‘Qingtianlan’, and ‘Hongxiuqiu’ decreased the least, by approximately 40–50 μmol·m−2s−1. However, the Ci values of ‘Huguangshanse’, ‘Gaoganhong’, ‘Xuefeng’, and ‘Qingwen’ exhibited the largest decrease of approximately 100 μmol·m−2s−1. The decrease in Ci of the remaining 13 cultivars varied from 70 to 100 μmol·m−2s−1.
From 12:00 to 18:00, the Ci values of all tested cultivars rebounded, and those of ‘Xueyuanhonghua’, ‘Huguangshanse’, ‘Gaoganhong’, and ‘Bingshan’ increased the most, by 150–160 μmol·m−2s−1. The Ci value of ‘Qingtianlan’ increased the least, by approximately 70 μmol·m−2s−1. The Ci value of the remaining 15 cultivars increased by 90–140 μmol·m−2s−1.
3.1.4. Diurnal Variation in Tr
The daily variation trend of the Tr of the tested cultivars was similar to that of Pn, both of which were unimodal, and the peak values were observed around 12:00 (Figure 5). From 08:00 to 12:00, the Tr increased the most in ‘Yangfeichuyu’, by approximately 9 mmol·m−2s−1, followed by ‘Tianshanhongxing’, ‘Guifeichacui’, ‘Dafugui’, and ‘Qihualushuang’, for which the Tr increased by approximately 8 mmol·m−2s−1. The rate of increase in Tr for ‘Fenchijinyu’ and ‘Bingshan’ was approximately 5 mmol·m−2s−1. The Tr of the remaining 13 cultivars increased by 6–7 mmol·m−2s−1.
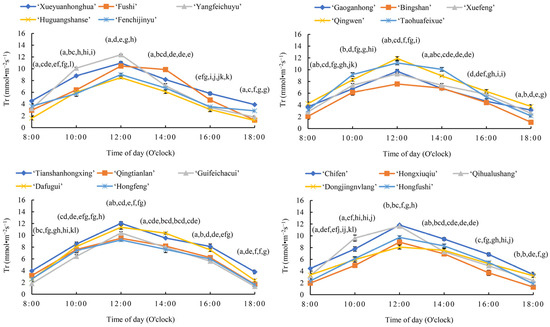
Figure 5.
Diurnal changes in the transpiration rate (Tr) of the 20 herbaceous peony cultivars. Different lowercase letters indicate differences among the 20 herbaceous peony cultivars at the same time at p < 0.05; error lines indicate standard errors.
From 12:00 to 18:00, the Tr values decreased. The largest decrease of 10.2 mmol·m−2s−1 was observed for ‘Guifeichacui’, followed by ‘Fenchijinyu’, ‘Tianshanhongxing’, and ‘Hongxiuqiu’, for which the Tr decreased by approximately 9.3 mmol·m−2s−1. The smallest decrease in Tr was observed for ‘Dongjingnvlang’ (5.8 mmol·m−2s−1), followed by ‘Huguangshanse’, ‘Xueyuanhonghua’, ‘Fushi’, and ‘Bingshan’. The Tr value of the remaining 11 cultivars decreased by 7–8 mmol·m−2s−1.
Ten cultivars, ‘Xuanyuanhonghua’, ‘Fushi’, ‘Yangfeichuyu’, ‘Qingwen’, ‘Taohuafeixue’, ‘Tianshanhongxing’, ‘Guifeichacui’, ‘Dafugui’, ‘Chifen’, and ‘Qihualushuang’, had a Tr peak of 10–13 mmol·m−2s−1, whereas the other 10 cultivars, ‘Huguangshanse’, ‘Fenchijinyu’, ‘Gaoganhong’, ‘Bingshan’, ‘Xuefeng’, ‘Qingtianlan’, ‘Hongfeng’, ‘Hongxiuqiu’, ‘Dongjingnvlang’, and ‘Hongfushi’, had a Tr peak of 7–10 mmol·m−2s−1.
3.2. Light–Response Curves for the 20 Herbaceous Peony Cultivars
When the light intensity was less than 400 μmol·m−2s−1, the Pn showed a linear trend and increased rapidly with the increase in photosynthetically active radiation (PAR). When PAR exceeded 400 μmol·m−2s−1, the increase in Pn gradually decreased (Figure 6). When PAR was greater than 1200 μmol·m−2s−1, the Pn value tended to become stable; thus, the maximum Pn (Pnmax) was reached. When PAR ranged between 1200 and 2000 μmol·m−2s−1 with an increase in light intensity, the Pnmax remained stable: it reached the light saturation point (LSP), and the photosynthetic rate at this time reflected the maximum photosynthetic capacity of plant leaves. The Pnmax values corresponding to the LSPs of all cultivars were concentrated in the range of 8–13 μmol·m−2s−1. Eight cultivars, ‘Huguangshanse’, ‘Bingshan’, ‘Xuefeng’, ‘Guifeichacui’, ‘Hongfeng’, ‘Chifen’ ‘Qihualushuang’, and ‘Dongjingnvlang’ had a Pnmax value between 8 and 10 μmol·m−2s−1. Five cultivars, ‘Yangfeichuyu’, ‘Fenchijinyu’, ‘Gaoganhong’, ‘Taohuafeixue’, and ‘Hongxiuqiu’ had a Pnmax between 10 and 11 μmol·m−2s−1. Seven cultivars, ‘Xuanyuanhonghua’, ‘Fushi’, ‘Qingwen’, ‘Tianshanhongxing’, ‘Qingtianlan’, ‘Dafugui’, and ‘Hongfushi’ had a Pnmax between 11 and 13 μmol·m−2s−1.
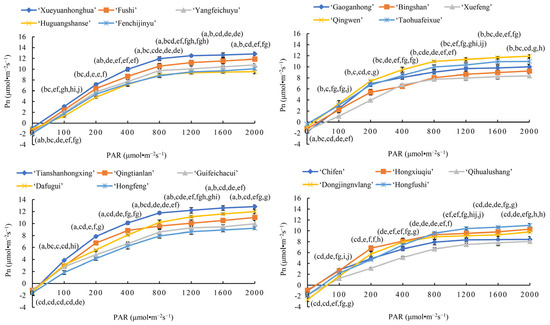
Figure 6.
Light–response curves for the 20 herbaceous peony cultivars. Different lowercase letters indicate differences among the 20 herbaceous peony cultivars at the same light intensity at p < 0.05; error lines indicate standard errors.
When Pn is zero, the nutrients produced by the leaves and the nutrients consumed during respiration reach a dynamic equilibrium, and the corresponding light intensity is termed the light compensation point (LCP). The LCPs of the 20 cultivars varied in the range of 10–70 μmol·m−2s−1. Eight cultivars, ‘Xuanyuanhonghua’, ‘Qingwen’, ‘Taohuafeixue’, ‘Tianshanhongxing’, ‘Qingtianlan’, ‘Guifeichacui’, ‘Chifen’, and ‘Hongxiuqiu’ had an LCP between 10 and 30 μmol·m−2s−1. Seven cultivars, ‘Fushi’, ‘Yangfeichuyu’, ‘Huguangshanse’, ‘Gaoganhong’, ‘Bingshan’, ‘Dafugui’, and ‘Hongfeng’ had an LCP between 10 and 30 μmol·m−2s−1. Five cultivars, ‘Fenchijinyu’, ‘Xuefeng’, ‘Qihualushuang’, ‘Dongjingnvlang’, and ‘Hongfushi’ had an LCP between 10 and 30 μmol·m−2s−1.
3.3. Comprehensive Evaluation of the Photosynthetic Characteristics of the 20 Herbaceous Peony Cultivars
Principal component analysis of the various indices measured at various times in the 20 cultivars tested revealed that the variance contribution rate of the first six principal components was 39.428%, 16.775%, 11.586%, 6.849%, 6.354%, and 4.667%, respectively, and the cumulative variance contribution rate was 85.659%. All eigenvalues were greater than one, indicating that the principal components well represented the information contained in the photosynthetic characteristics of herbaceous peony. Therefore, these six principal components can be used as comprehensive indicators for evaluating the photosynthetic characteristics of herbaceous peony (Table 1).

Table 1.
Factor analysis of photosynthetic parameters for the 20 herbaceous peony cultivars.
The functional expression of the six principal components was obtained based on the eigenvalues and load values of the principal components. By substituting standardized data into the principal component function expression, F1, F2, F3, F4, F5, and F6 scores were obtained. A comprehensive score function for each cultivar was obtained by summing the product of the score value of each principal component and the variance contribution rate of the corresponding characteristic value: F = 0.394 × F1 + 0.168 × F2 + 0.116 × F3 + 0.685 × F4 + 0.635 × F5 + 0.467 × F6. The composite scores of the different cultivars were calculated and sorted; the results are shown in Table 2.

Table 2.
Factor scores and ranking of photosynthetic parameters for the 20 herbaceous peony cultivars.
3.4. Cluster Analysis of Photosynthetic Metrics among the 20 Herbaceous Peony Cultivars
A systematic cluster dendrogram of photosynthetic metrics directly reflects the similarity of photosynthetic productivity of different cultivars; the earlier they are aggregated, the more similar their photosynthetic characteristics. The average distance clustering method was used to cluster 20 herbaceous peony cultivars with six factors score as variables. (Figure 7). Based on the similarity of their photosynthetic characteristics, the cultivars were divided into three major groups: Group I, whose Pn, Gs, and Tr values were low indicating weak photosynthetic productivity, comprised five cultivars, ‘Qingtianlan’, ‘Guifeichacui’, ‘Dafugui’, ‘Hongfeng’, and ‘Hongxiuqiu’. Group II, with medium photosynthetic productivity, comprised 12 cultivars, ‘Fushi’, ‘Tianshanhongxing’, ‘Chifen’, ‘Hongfushi’, ‘Yangfeichuyu’, ‘Taohuafeixue’, ‘Huguangshanse’, ‘Fenchijinyu’, ‘Gaoganhong’, ‘Xuefeng’, ‘Bingshan’, and ‘Dongjingnvlang’. And Group III, whose Pn, Gs, and Tr values were high indicating high photosynthetic productivity, comprised three cultivars, ‘Xuanyuanhonghua’, ‘Qingwen’, and ‘Qihualushuang’. According to the cluster analysis, the cultivars ‘Qingwen’, ‘Xuanyuanhonghua’, and ‘Qihualushuang’ had the best photosynthetic characteristics, and they also ranked high (first, second, and eighth, respectively) in terms of the comprehensive score in the principal component analysis. Thus, the results of the cluster and principal component analyses were highly consistent, suggesting that this approach can be used to effectively screen high-value germplasm resources.
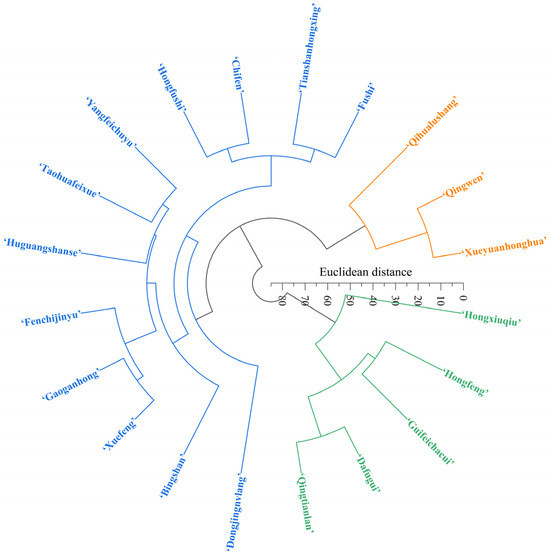
Figure 7.
Clustering tree of 20 herbaceous peony cultivars.
4. Discussion
Photosynthesis accounts for 90–95% of dry matter production in plants. As such, photosynthesis is closely related to plant growth and an important parameter in cultivar selection and breeding [16,17]. Li et al. [18] studied the photosynthetic characteristics of four wild oil peony species from 11 sources in different provinces of China and identified cultivars with strong photosynthetic capacity as excellent sources. Chen et al. [13] compared the photosynthetic characteristics of 10 types of Cypripedium plants introduced from Changbai Mountain, providing a theoretical basis for the artificial introduction and cultivation of wild resources. The photosynthetic capacity differs among plant species and cultivars, and ecological factors, such as light, temperature, water, and air, affect plant photosynthesis [19]. Differences in the photosynthetic characteristics of different herbaceous peony cultivars have been attributed to a combination of parental differences and long-term adaptation to environmental conditions [20]. Photosynthetic products play an important role in maintaining the high ornamental value of herbaceous peony, and high-light-efficiency breeding is an important method for improving the overall photosynthetic capacity of herbaceous peony cultivars [21].
The photosynthetic characteristics of herbaceous peony leaves change in correspondence with diurnal changes in light intensity, temperature, and humidity. The Pn, which is mainly influenced by Ci, Gs, and Tr, determines the photosynthetic capacity of plants [22,23,24]. In herbaceous peony, the diurnal variation in Pn reportedly is “bimodal” under strong summer light, with a “photosynthetic siesta phenomenon,” and “unimodal” under light shade [15]. In our study, the diurnal variation in Pn measured in early May followed a unimodal pattern in all herbaceous peony cultivars tested, and the peak values were observed around 12:00. Stomatal conductance is readily affected by the environment, with high Gs being conducive to gas exchange, allowing the entry of additional CO2 from the air [9]. The differences in diurnal Gs values among the cultivars were small, and the curves showed similar trends: the highest Gs occurred around 12:00, and the lowest values were observed in the morning and evening. There was a negative feedback adjustment between Gs and Ci [25]. In our study, the diurnal variation in Ci was the highest in the morning for all cultivars. By 12:00, it had decreased, and in the evening, it increased again. Tr daily variation showed a similar “low–high–low” trend as Pn daily variation, both of which followed single-peak curves, with the peaks occurring around 12:00. Principal component analysis is a relatively mature comprehensive evaluation method widely used in germplasm resource evaluation and screening [26]. According to the comprehensive score ranking, ‘Xueyuanhonghua’, ‘Qingwen’, ‘Taohuafeixue’, ‘Chifen’, and ‘Qihualushuang’ had relatively high photosynthetic productivity. Cluster analysis results corroborated that these cultivars had strong photosynthetic capacity, and screening by principal component analysis and cluster analysis validated mutual verification.
Herbaceous peony is a light-loving plant that requires sufficient light during growth; however, some cultivars can grow and develop normally under light shade [12]. Light–response curves reflect plant adaptability to and utilization ability of different light intensities [27]. Studies have reported that moderate shade during the flowering period of herbaceous peony in the summer, which increases the environmental humidity and decreases the temperature, can extend the flowering period and prevent sunburn [28,29]. In this study, when the PAR was 0–400 μmol·m−2s−1, the Pn of the herbaceous peony cultivars increased linearly, and with subsequent increases in light intensity, the Pn gradually reached a saturation level. The LCP and LSP represent the light demand characteristics of plants [30,31]. The LCP represents the ability of plants to adapt to low light [32]. The eight cultivars with the lowest LCPs, ‘Xueyuanhonghua’, ‘Qingwen’, ‘Taohuafeixue’, ‘Tianshanhongxing’, ‘Qingtianlan’, ‘Guifeichacui’, ‘Chifen’, and ‘Hongxiuqiu’, were more shade tolerant than the other cultivars and, therefore, can be planted in low-light environments, such as forests and shaded slopes in garden landscapes. The seven cultivars with the highest LSPs, ‘Xueyuanhonghua’, ‘Fushi’, ‘Qingwen’, ‘Tianshanhongxing’, ‘Qingtianlan’, ‘Dafugui’, and ‘Hongfushi’ were more resistant to bright light [33]. According to the light demand characteristics of different herbaceous peony cultivars, plant allocation can be a reasonable approach to achieving the purposes of obtaining high yields and creating rich landscapes.
5. Conclusions
In this study, the photosynthetic characteristics and light responses of 20 herbaceous peony cultivars were dynamically monitored. Four cultivars with strong shade tolerance and high photosynthetic productivity were ‘Xueyuanhonghua’, ‘Qingwen’, ‘Taohuafeixue’, and ‘Chifen’, which can be cross-bred to create new cultivars of shade-tolerant flowers. For breeding new cultivars with strong light resistance and high photosynthetic productivity, two cultivars ‘Xueyuanhonghua’ and ‘Qingwen’ were identified as potential parents. Two cultivars, ‘Xueyuanhonghua’, and ‘Qingwen’, were both light and shade resistant and had strong photosynthetic productivity and can be cross-bred to obtain both light- and shade-resistant flower cultivars. This study provides a theoretical basis for breeding of highly efficient new varieties.
Author Contributions
A.X. designed and largely conducted the study, analyzed the data, and wrote the paper. J.W., Y.S., F.L., L.D. and D.Z. participated in the tests and data analysis. L.S. and X.S. co-designed the study and revised manuscript drafts. All authors contributed to the writing of the manuscript. All authors have read and agreed to the published version of the manuscript.
Funding
This work was funded by the Shandong Province Improved Seed Project (No. 2021S230304-02583).
Data Availability Statement
The datasets used and/or analyzed during this study are available from the corresponding author upon reasonable request.
Conflicts of Interest
The authors declare no conflict of interest.
References
- Zhang, D.L.; Xie, A.Q.; Yang, X.; Yang, L.J.; Shi, Y.J.; Dong, L.L.; Lei, F.L.; Sun, L.M.; Bao, M.Y.; Sun, X. Analysis of physiological and biochemical factors affecting flower color of herbaceous peony in different flowering periods. Horticulturae 2023, 9, 502. [Google Scholar] [CrossRef]
- Wang, X.X.; Xiong, H.R.; Wang, S.L.; Zhang, Y.L.; Song, Z.H.; Zhang, X.X. Physicochemical analysis, sensorial evaluation, astringent component identification and aroma-active compounds of herbaceous peony (Paeonia lactiflora Pall) black tea. Ind. Crop Prod. 2023, 193, 116159. [Google Scholar] [CrossRef]
- Sun, X. Chinese Herbaceous Peony Varieties Appreciation; China Forestry Publishing House: Beijing, China, 2019; pp. 10–11. (In Chinese) [Google Scholar]
- Ma, Y.; Ding, Y.; Lu, J. Photosynthetic physiological characteristics of four medicinal plants. Appl. Ecol. Environ. Res. 2019, 17, 12807–12826. [Google Scholar] [CrossRef]
- Noor, H.; Wang, Q.; Islam, M.A.; Sun, M.; Lin, W.; Ren, A.X.; Feng, Y.; Yu, S.B.; Fida, N.; Dong, S.F.; et al. Effects of sowing methods and nitrogen rates on photosynthetic characteristics, yield, and quality of winter wheat. Photosynthetica 2021, 59, 277–285. [Google Scholar] [CrossRef]
- Xia, X.; Tang, Y.; Wei, M.G.; Zhao, D.Q. Effect of paclobutrazol application on plant photosynthetic performance and leaf greenness of herbaceous peony. Horticulturae 2018, 4, 5. [Google Scholar] [CrossRef]
- Liu, J.L.; Liu, L.; Fu, Q.; Zhang, L.L.; Li, J.W.; Yu, K.; Xu, Q. Effects of straw mulching and tillage measures on the photosynthetic characteristics of maize leaves. Transact. ASABE 2019, 62, 851–858. [Google Scholar] [CrossRef]
- Li, Z.K.; Gong, X.W.; Wang, J.L.; Cheng, Y.D.; Liu, F.Y.; Li, H.P.; Lü, G.H. Foliar water uptake improves branch water potential and photosynthetic capacity in Calligonum mongolicum. Ecol. Indic. 2023, 146, 109825. [Google Scholar] [CrossRef]
- Han, T.; Feng, Q.; Yu, T.F.; Yang, X.M.; Zhang, X.F.; Li, K. Characteristic of stomatal conductance and optimal stomatal behaviour in an arid oasis of northwestern China. Sustainability 2022, 14, 968. [Google Scholar] [CrossRef]
- Cao, Y.B. Study on Leaf Morphological Structure and Photosynthetic Characteristics of Wild European Plum; Xinjiang Agricultural University: Wulumuqi, China, 2022. (In Chinese) [Google Scholar]
- Xie, A.Q.; Sun, L.M.; Zhang, D.L.; Li, Y.; Liu, Z.M.; Li, X.; Sun, X. Changes in the root system of the herbaceous peony and soil properties under different years of continuous planting and replanting. Hortic. Plant J. 2023, 9, 801–810. [Google Scholar] [CrossRef]
- Yang, Y.L.; Chen, M.Z.; Tian, J.S.; Xiao, F.; Xu, S.Z.; Zuo, W.Q.; Zhang, W.F. Improved photosynthetic capacity during the mid- and late reproductive stages contributed to increased cotton yield across four breeding eras in Xinjiang, China. Field Crops Res. 2019, 240, 177–184. [Google Scholar] [CrossRef]
- Du, J.; Xu, J.G.; Lv, M.W.; Gao, C.R.; Lu, J.; Zhang, Q.X.; Wang, T.L.; Sun, X. Study on photosynthetic mechanism of summer shading slowing aging of herbaceous peony (Paeonia lactiflora) leaves. Plant Physiol. J. 2018, 54, 773–782. (In Chinese) [Google Scholar]
- Chen, L.F.; Li, S.; Li, Y.; Zhang, Y.Q.; Bai, Y.; Cong, H.; Liu, W.; Zhou, Y.W. Comparative study of Cypripedium plant photosynthetic characteristics from Changbai Mountain. Horticulturae 2023, 9, 358. [Google Scholar] [CrossRef]
- Du, J. Effects of Summer Strong Light and Slight Shading on Ultrastructure and Physiological Characteristics in the Herbaceous Peony (Paeonia lactiflora Pall.) Leaf; Shandong Agricultural University: Taian, China, 2016. (In Chinese) [Google Scholar]
- Bai, Y.C.; Zhang, J.P.; Wu, Y.; Huang, R.M.; Chang, Y.Y.; Lei, X.S.; Song, X.B.; Pei, D. Possibility of increasing the growth and photosynthetic properties of precocious walnut by grafting. Sustainability 2020, 12, 5178. [Google Scholar] [CrossRef]
- Kim, D.H.; Son, S.; Jung, J.Y.; Lee, J.C.; Kim, P.G. Photosynthetic characteristics and chlorophyll content of Cypripedium japonicum in its natural habitat. For. Sci. Technol. 2022, 18, 160–171. [Google Scholar] [CrossRef]
- Li, M.; Li, W.Y.; Zhang, Y.L.; Zhang, H.; Ji, W.L.; Du, M.Y.; Zhao, X. Comparative photosynthetic characteristics and chlorophyll content of four oil peony species from 11 provenances in China. Pak. J. Bot. 2018, 50, 143–150. [Google Scholar]
- Zhang, J.Y.; Liao, M.; Cheng, Y.H.; Feng, Y.; Ju, W.B.; Deng, H.N.; Li, X.; Plenković-Moraj, A.; Xu, B. Comparative chloroplast genomics of seven endangered Cypripedium species and phylogenetic relationships of Orchidaceae. Front. Plant Sci. 2022, 13, 911702. [Google Scholar] [CrossRef]
- Li, L.L. Photosynthetic Physiology of Peony under Different Light Conditions. Master’s Thesis, Shandong Agricultural University, Tai’an, China, 2016. (In Chinese). [Google Scholar]
- Zhao, D.Q.; Hao, Z.J.; Tao, J. Effects of shade on plant growth and flower quality in the herbaceous peony (Paeonia lactiflora Pall.). Plant Physiol. Biochem. 2012, 61, 187–196. [Google Scholar] [CrossRef]
- Schwinghamer, T.; Souleimanov, A.; Dutilleul, P.; Smith, D. The plant growth regulator lipo-chitooligosaccharide (LCO) enhances the germination of canola (Brassica napus [L.]). J. Plant Growth Regul. 2015, 34, 183–195. [Google Scholar] [CrossRef]
- Fang, X.M.; Li, Y.S.; Nie, J.; Wang, C.; Huang, K.H.; Zhang, Y.K.; Zhang, Y.L.; She, H.Z.; Liu, X.B.; Ruan, R.W.; et al. Effects of nitrogen fertilizer and planting density on the leaf photosynthetic characteristics, agronomic traits and grain yield in common buckwheat (Fagopyrum esculentum M.). Field Crops Res. 2018, 219, 160–168. [Google Scholar] [CrossRef]
- Fang, Z.W.; Wang, X.X.; Zhang, X.Y.; Zhao, D.Q.; Tao, J. Effects of fulvic acid on the photosynthetic and physiological characteristics of Paeonia ostii under drought stress. Plant Signal. Behav. 2020, 15, 1774714. [Google Scholar] [CrossRef]
- Favaretto, V.F.; Martinez, C.A.; Soriani, H.H.; Furriel, R.P.M. Differential responses of antioxidant enzymes in pioneer and late-successional tropical tree species grown under sun and shade conditions. Environ. Exp. Bot. 2011, 70, 20–28. [Google Scholar] [CrossRef]
- Wei, C.B.; Li, M.M.; Ma, Z.L.; Qiao, J.; Sun, G.M. Vitamin diversity in pineapple varieties based on cluster and principal component analysis. Bangl. J. Bot. 2018, 47, 799–803. [Google Scholar]
- Li, C.F.; Dong, S.T.; Liu, R.X.; Ren, H.; Ding, Z.S.; Zhao, M. Diurnal variation of gas exchange, chlorophyll fluorescence, and photosynthetic response of six parental lines of maize released in three eras. J. Integr. Agric. 2019, 18, 2732–2741. [Google Scholar] [CrossRef]
- Wang, X.X.; Fang, Z.W.; Zhao, D.Q.; Tao, J. Effects of high-temperature stress on photosynthetic characteristics and antioxidant enzyme system of Paeonia ostii. Phyton 2022, 91, 599–615. [Google Scholar] [CrossRef]
- Tang, Y.H.; Shi, W.B.; Xia, X.; Zhao, D.Q.; Wu, Y.Q.; Tao, J. Morphological, microstructural and lignin-related responses of herbaceous peony stem to shading. Sci. Hortic. 2022, 293, 110734. [Google Scholar] [CrossRef]
- Wang, J.Y.; Shen, J.S.; Gu, M.; Wang, J.; Cheng, T.; Pan, H.; Zhang, Q. Leaf coloration and photosynthetic characteristics of hybrids between Forsythia ‘Courtaneur’ and Forsythia koreana ‘Suwon gold’. HortScience 2017, 52, 1661–1667. [Google Scholar] [CrossRef]
- Wei, S.Y.; Lei, Q.H.; Ji, W.L.J.R.; Fan, R.; Yang, D.Y.; Zhang, Y.L. Differences in light response characteristics of oil peonies from eight provenances in China. Photosynthetica 2019, 57, 788–795. [Google Scholar] [CrossRef]
- Song, H.Z. Study on Photosynthetic Characteristics and Carbohydrate of Peony; Beijing Forestry University: Beijing, China, 2012. (In Chinese) [Google Scholar]
- Kong, F. Studies on Photosynthetic Characteristics of Herbaceous Peony; Yangzhou University: Yangzhou, China, 2010. (In Chinese) [Google Scholar]
Disclaimer/Publisher’s Note: The statements, opinions and data contained in all publications are solely those of the individual author(s) and contributor(s) and not of MDPI and/or the editor(s). MDPI and/or the editor(s) disclaim responsibility for any injury to people or property resulting from any ideas, methods, instructions or products referred to in the content. |
© 2023 by the authors. Licensee MDPI, Basel, Switzerland. This article is an open access article distributed under the terms and conditions of the Creative Commons Attribution (CC BY) license (https://creativecommons.org/licenses/by/4.0/).