Article

A 15N-Tracing Study to Explore the Coupling Effects of Biochar and Nitrogen Fertilizer on Tomato Growth, Yield, Nitrogen Uptake and Utilization, and the Rhizosphere Soil Environment under Root-Divide Alternative Irrigation

1
College of Energy and Power Engineering, Lanzhou University of Technology, Lanzhou 730050, China
2
Key Laboratory of the System of Biomass Energy and Solar Energy Complementary Energy Supply System, Lanzhou 730050, China
3
Northwest Low Carbon Urban Support Technology Collaborative Innovation Center, Lanzhou 730050, China
*
Author to whom correspondence should be addressed.
Horticulturae 2023, 9(12), 1320; https://doi.org/10.3390/horticulturae9121320
Submission received: 5 November 2023 / Revised: 28 November 2023 / Accepted: 29 November 2023 / Published: 8 December 2023

Abstract

:
To investigate the coupling effects of biochar and nitrogen fertilizer on tomato growth, nitrogen uptake and utilization (NUU), and the soil environment, a pot experiment was conducted using 15N-tracing technology from March to July 2021 and from September 2021 to January 2022. Three biochar application rates (B0, B1, and B2; 0, 3, and 6 t/hm2, respectively) and three nitrogen levels (N1, N2, and N3; 150, 300, and 450 kg/hm2, respectively) were set up. The results show that the growth, yield, rate of 15N uptake, nitrogen derived from soil (Ndfs), total nitrogen (TN), 15N utilization, and recovery rate of tomatoes were improved under biochar application, but nitrogen derived from fertilizer (Ndff) gradually decreased. A Pearson correlation analysis showed that the 15N uptake, Ndfs, TN, rhizosphere soil organic matter, soil organic carbon, and TN were significantly positively correlated with the yield and lycopene content of tomatoes. The comprehensive benefit to the tomatoes was evaluated based on combination weighting with the help of the technique for order preference by similarity to ideal solution (TOPSIS). This indicates that the best planting mode was the B2N2 treatment, with a biochar rate of 6 t/hm2 and nitrogen levels of 300 kg/hm2, under the alternative partial root-zone irrigation.

Graphical Abstract

1. Introduction

There are many important variables that affect crop yield and quality, such as fertilizers, irrigation methods, and soil. Nitrogen fertilizer could be lost through various ways, such as runoff [1], volatilization [2], nitrification, and denitrification [3], and improper application may cause economic losses and environmental pollution. Nitrogen fertilizer consumption accounted for over 35% of fertilizer consumption across the world [4], while the utilization rate is only around 30% in China [5]. So, calculating the nitrogen fertilizer utilization rate (NUR), clarifying the sources and destinations of nitrogen fertilizers, and optimizing nitrogen management levels are of great significance. Alternative partial root-zone irrigation is an efficient water-saving irrigation method. By artificially maintaining partial soil dryness, a portion of the root system is kept in a relatively dry soil environment, thus controlling the stomatal aperture of the leaves, reducing water transpiration losses, enhancing the root’s ability to absorb moisture, and improving the crop irrigation water-use efficiency (IWUE). Previous research conducted on apples [6], tomatoes [7], and oranges [8] has shown that alternative partial root-zone irrigation improved IWUE and nutrient utilization efficiency compared to traditional deficit irrigation [9,10]. However, some studies have also indicated that it reduced crop yield and quality to some extent [11]. Hence, it is crucial to find soil amendments that can simultaneously enhance the yield, quality, IWUE, and nutrient utilization efficiency of crops.
Biochar is currently widely used as a soil amendment and is produced by the high-temperature pyrolysis of plant waste under anoxic conditions [12], which not only contains certain nutrients (C, N, K, Ca, etc.), but also has the characteristics of a large specific surface area, high porosity, and strong adsorption [13]. Li et al. [14] indicated that biochar changed the soil composition, affecting soil water and heat dynamics and contributing to crop growth. Research has also demonstrated that biochar improved the quality indicators of tomatoes, such as vitamins (CVC) and soluble solids, and enhanced the water status within tomato plants, as well as their leaf gas exchange rate, plant biomass, and growth. Therefore, biochar serves as an excellent soil amendment [15,16]. Akhtar et al. [17] showed that biochar application was a new method to improve IWUE and tomato yield under alternative partial root-zone irrigation; however, there is still no consistent conclusion on the source and destination of nitrogen during tomato growth. Therefore, it is crucial to find a suitable method to elucidate the source and destination of nitrogen during tomato growth.
The 15N-tracing method is a reliable isotope-tracing technique that can accurately distinguish the source and destination of nitrogen fertilizers [18]. Li et al. [19] studied the nitrogen transfer pathway of maize in three different soils by using 15N-isotope tracing technology in a two-year field experiment and concluded that loam soil had the highest maize yield and nitrogen accumulation, followed by clay soil; sand soil had the lowest. Guo et al. [20] proposed that plastic-film mulching improved the yield and nitrogen recovery rate of maize and reduced nitrogen fertilizer loss. When the nitrogen level was 300 kg/hm2, the maize yield and nitrogen utilization efficiency were the highest. However, under alternate partial root-zone irrigation, the coupling impact of biochar and nitrogen on the nitrogen source and utilization of plants is still unclear.
The aim of this study was to determine the optimal biochar and nitrogen fertilizer coupling mode that can provide a theoretical basis for improving the water and nitrogen fertilizer utilization efficiency, fruit yield, and quality, and for achieving sustainable soil utilization under alternate partial root-zone irrigation.
The main objectives of this study were as follows: (1) to explore the coupling effects of different biochar and nitrogen fertilizer application modes on tomato growth, quality, and soil environment under alternative partial root-zone irrigation; (2) to reveal the effects of biochar and nitrogen fertilizer coupling on nitrogen utilization and the nitrogen transfer pathway using the 15N-isotope-tracing method; (3) to explore the relationship between the root zone soil environment and the yield and quality of tomatoes using Pearson correlation analysis; and (4) to comprehensively evaluate tomato growth and nitrogen fertilizer utilization benefits.

2. Materials and Methods

2.1. Experimental Site

A two-season pot experiment was conducted in a greenhouse (104°23′46′′ E, 36°5′19′′ N, altitude 1869.4 m) in Weiling Township, Guya Mountain, Qilihe District Lanzhou City, Gansu province, China, from March to July 2021 (2021S) and from September 2021 to January 2022 (2021A). The greenhouse is in the east–west direction, with natural light and a wall thickness of about 70 cm, covered with polyethylene film on the top. The climate of the experimental region is a typical temperate continental climate, with cold winters and hot summers, and an average annual rainfall of 367 mm, average annual evaporation of 1180 mm, average annual temperature of 11.2 °C, and a frost-free period of 160 days.

2.2. Experimental Materials

The investigated soil was classified as yellow cultivated loessial soil, and the specific soil physical and chemical properties are shown in Table 1. The tomato variety used in the experiment was “Zhongyan 958F1”. The diameter and height of the pots were 30 cm and 34 cm. Each pot was filled with 22 kg of dry soil, passed through a 2 mm sieve, and 6 holes were set in the bottom of the pot. The plastic film was covered in the middle of the pot to prevent the water from interpenetrating the sides. A V-shaped gap was cut out in the middle of the film to plant tomatoes.
During the experiment, we first placed the V-shaped gap and sieved dry soil into the pots, and then tomato plants with four leaves were transplanted into the pot. One tomato seedling was transplanted into each pot after 7 days, and 2000 mL water was irrigated during the rejuvenation period. The 15N fertilizer used in the experiment was 15N-labeled urea with 10.10% abundance and 40% nitrogen mass fraction provided by the Shanghai Research Institute of Chemical Industry. The biochar used in the experiment was provided by the Shandong Composite Fertilizer Production Company, and the raw material was wheat straw, which cracked under the conditions of high temperature and hypoxia at 6°C. The specific physical and chemical properties of biochar are shown in Table 2.

2.3. Experimental Design

The experiment was conducted under alternate partial root-zone irrigation. Three biochar rates (0, 3, 6 t/hm2, recorded as B0, B1, and B2, respectively) and three nitrogen fertilizer levels (150, 300, 450 kg/hm2, denoted as N1, N2, and N3, respectively, equivalent to 1.06 g/pot, 2.21 g/pot, and 3.18 g/pot, respectively) were set for a total of nine treatments. Each treatment had 18 replicates, for a total of 162 pots. The levels of biochar and nitrogen fertilizer applied are shown in Table 3. The irrigation frequency was once every 2 days, alternating with partial root-zone irrigation. A Φ-20 evaporating dish was used for calculating the irrigation volume, using the following formula:
I = Kp·S·Ep
where I is the irrigation amount, mm; Kp is the crop-evaporation dish coefficient, 0.7; S is the pot area, 700 cm2; and Ep is the evaporation amount of a 20 cm standard evaporating dish between two irrigation intervals, mm.
The growth period of the tomatoes was divided into the seedling period, flowering period, and maturity period. 15N fertilizer was applied at a mass ratio of 1:2:2 in the seedling period, flowering period, and maturity stage, respectively. In the seedling period, 15N fertilizer was applied along with the base fertilizers. 15N fertilizer was applied along with irrigation water 10 days before sampling in the flowering period and maturity period. The basal fertilizer under all treatments was applied according to the levels of local farmers (94.5 kg/hm2 phosphorus fertilizer and 97.5 kg/hm2 potassium fertilizer).

2.4. Indices and Measurement Methods

2.4.1. Plant Growth Indicators

The plant height and stem diameter were measured every 2 days during tomato growth, which was related to the irrigation frequency. At the beginning of the experiment, three irrigation frequencies were selected, namely 1 day, 2 days, and 4 days. We found that the experimental effect of 4 days was the worst, compared to 1 day and 2 days. However, 1-day irrigation increased the investment time and manpower. Therefore, we selected 2 days for the irrigation frequency and measured the plant height and stem diameter every 2 days. The plant height was measured from the bottom of the stem with a meter ruler. The stem diameter was measured with an electronic caliper (0.01 mm) at the tomato stem base using the cross method [21].
At the end of the experiment, three representative tomato plants and soil samples were selected for each treatment. Tomato plants were divided into roots, stems, leaves, and fruits. Plant samples were rinsed and put into self-sealing bags, then brought back to the laboratory together with soil samples. Plant samples were weighed and put into an oven at 105 °C for 30 min to inactivate enzyme activity and inhibit enzymatic reactions. Finally, they were dried in a 75° oven to a constant value, and the dry mass of each tomato organ was weighed.

2.4.2. Fruits’ Yield and Quality

Three tomato plants were randomly selected from each treatment and fruits picked at maturity. They were weighed and recorded using an electronic scale (0.01 g). The average value calculated for each treatment is the yield per plant.
Using the second ear of mature tomatoes to determine the quality, five fresh fruits of uniform maturity were selected for each treatment. The soluble sugars were determined using the Anthrone method. The titratable acid was determined by the 0.1 mol/L NaOH titration method. The soluble solids were measured using a refractometer. The vitamin C was measured using the 2,6-dichlorophenol indophenol titration method. The soluble proteins were measured by Coomassie Brilliant Blue G-250 staining. The lycopene was determined with an EV300PC ultraviolet visible spectrophotometer (Thermo Fisher, Waltham, MA, USA) [22].
The WUE was calculated according to the following equation [23]:
WUE = Y/ET
where the WUE is the water-use efficiency, kg/m3; Y is the yield, kg/plant; and ET is the irrigation amount, m3.

2.4.3. Nitrogen Content

The total nitrogen content (TN) of the tomato plants was measured using a Kjeldahl nitrogen analyzer. The abundance of 15N in plants was measured using a Finnigan DELTA V Advantage isotope ratio mass spectrometer (Thermo Fisher, Waltham, MA, USA).

2.4.4. Nitrogen Utilization Indicators

The calculation formulas for nitrogen utilization indicators are as follows:
Ndff = (15N115N0)/ (15N215N0) × 100%
(Ndfs) = 1 − Ndff
15NUO = K × Ndff
15NU = 15NUR + 15NUS + 15NUL + 15NUF
Ndfso = K × Ndfs
Ndfsa = NdfsaR + NdfsaS + NdfsaL + NdfsaF
15NUr = (15NUR/TN) × 100%
15NRR = (15NSR + 15NUO)/TN × 100%
The explanation of formula symbols are shown in Table 4.

2.4.5. Soil Nutrient Content

The soil samples were air-dried and protected from natural light for measurement.
The soil pH was measured using a pH meter (Lei Magnet Company in Shanghai, China, model: PHS-3C). The soil organic matter was determined by the potassium dichromate volumetric method. The soil organic carbon was measured by phosphoric acid bath heating and the potassium dichromate oxidation method. The TN of soil was determined using the Kjeldahl method [24].

2.4.6. Date Analysis

The data processing, calculation, and chart making were completed using Excel 2019 and Origin 9.0. Significant difference analyses among the different treatments and comprehensive benefit analysis based on the technique for order preference by similarity to the ideal solution (TOPSIS) were carried out using SPSS 24.0.

3. Results

3.1. Coupling Effect of Biochar and Nitrogen Fertilizer Application on Tomato Growth and Yield

The plant height, stem diameter, dry matter mass, and fruit yield increased with the increasing biochar rates under the same N application level in both seasons (Table 5). Under the biochar application, the plant heights increased by 6.50~11.72% (2021S) and 7.13~11.25% (2021A), and the stem diameters increased by 0.69~15.14% (2021S) and 1.90~13.58% (2021A) compared to B0. With the increase in nitrogen fertilizer, the dry matter mass of the tomatoes increased first and then decreased under the same biochar rate. B2N2 obtained the maximum root, stem, leaf, and fruit dry matter masses of 3.83 g, 36.10 g, 41.86 g, and 63.17 g in 2021S, as well as 3.69 g, 35.59 g, 40.88 g, and 59.79 g in 2021A, respectively. The maximum yield was obtained under the B2N2 treatment, and was 2.61 kg/plant in 2021S and 2.29 kg/plant in 2021A. The lowest yield was obtained under B0N1, and was 1.95 kg/plant in 2021S and 1.69 kg/plant in 2021A.

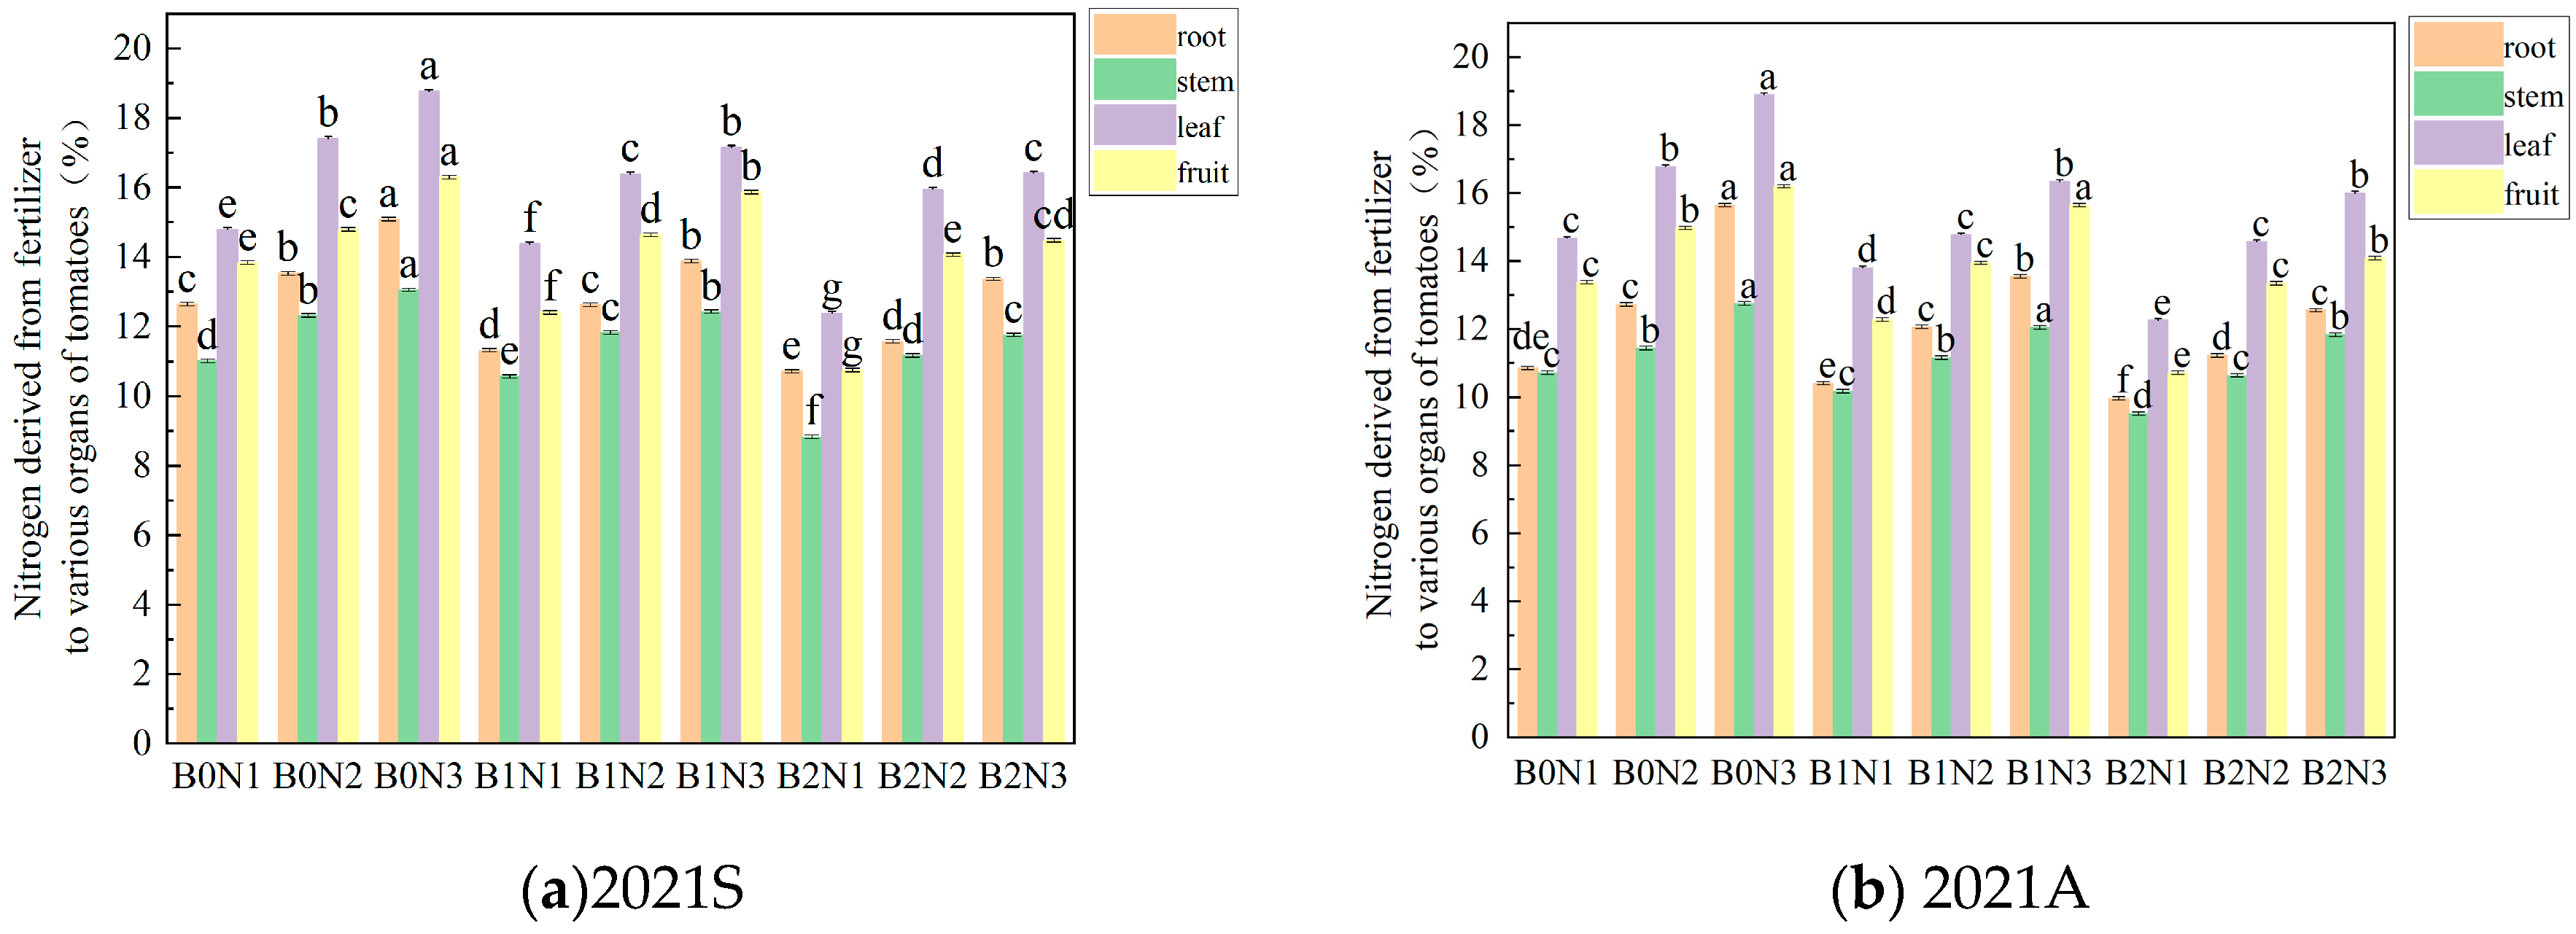
3.2. Coupling Effect of Biochar and Nitrogen Fertilizer on Nitrogen Derived from Fertilizer Applied to Various Organs of Tomatoes

Both biochar and nitrogen fertilizer affected the fertilizer contribution rate in each organ of tomatoes (Figure 1). Under the same biochar rate, the fertilizer contribution rate in each organ of the tomato increased with the increase in nitrogen fertilizer rates. Nitrogen derived from the fertilizer decreased with biochar rates. The highest amount of nitrogen derived from fertilizer was obtained under B0N3, in which the root, stem, leaf, and fruit levels of nitrogen derived from fertilizer were 15.09%, 13.06%, 18.77%, and 16.30% in 2021S, and 15.65%, 12.75%, 18.89%, and 16.20% in 2021A, respectively. The lowest nitrogen levels derived from fertilizer were obtained under B2N1, in which the roots, stems, leaves, and fruit levels of nitrogen were 10.72%, 8.83%, 12.39%, and 10.75% in 2021S, and 9.96%, 9.52%, 12.26%, and 10.72% in 2021A, respectively. The differences in the roots, stems, leaves, and fruits between B0N3 and B2N1 were significant (p < 0.05), and were 4.37%, 4.23%, 6.38%, and 5.55% in 2021S, and 5.69%, 3.23%, 6.63%, and 5.48% in 2021A, respectively. The fertilizer contribution rate under all treatments was leaf > fruit > root > stem, indicating that the growth of fruits and leaves was more vigorous at maturity.

3.3. Coupling Effect of Biochar and Nitrogen Fertilizer on the Nitrogen Accumulation of Tomatoes

Biochar application increased the nitrogen fertilizer uptake of tomatoes, soil nitrogen, TN, the proportion of fertilizer nitrogen uptake, 15N utilization, and 15N recovery under the same nitrogen fertilizer levels in the pot experiment (Table 6). Herein, the 15N uptake of tomatoes was the largest under B2N3 and the smallest under B0N1. Under the N3 nitrogen fertilizer level, the B2 increased 15N uptake by 30.85% and 13.76% in 2021S, and by 33.47% and 14.78% in 2021A, compared to the B0 and B1 treatments, respectively. B2N3 absorbed the highest amount of nitrogen derived from soil and obtained the highest TN uptake: 4.028 g/plant and 4.727 g/plant in 2021S, and 4.033 g/plant and 4.695 g/plant in 2021A, respectively. The lowest nitrogen level derived from soil and TN uptake were obtained under B0N1: 1.918 g/plant and 2.216 g/plant in 2021S, and 1.888 g/plant and 2.175 g/plant in 2022A, respectively. There were significant differences between B2N3 and B0N1 in both the nitrogen derived from the soil and TN uptake (p < 0.05). In addition, the plant uptake of the 15N fertilizer increased with both the nitrogen fertilizer levels and biochar rates, and reached the maximum value under B2 and N3. The proportion of 15N uptake to the total N uptake gradually decreased with the increased biochar rates. Both the 15N utilization and 15N recovery rates decreased with the increased nitrogen fertilizer levels. The B2N1 treatment had the highest 15N recovery rates of 75.53% in 2021S and 72.66% in 2021A. The B0N3 treatment had the lowest 15N recovery rates of 49.74% in 2021 and 42.42% in 2022 under the same nitrogen fertilizer level. The B1 and B2 treatments increased 15N utilization by 2.53~9.82% in 2021S and by 2.57~9.93% in 2021A, compared to B0.

3.4. Coupling Effect of Biochar and Nitrogen Fertilizer on the Quality of Tomatoes

The soluble sugars, sugar/acid ratio, vitamin C, and soluble proteins of tomato fruits were positively correlated with the biochar rates (Table 7) and show a trend of increasing first and then decreasing with the nitrogen fertilizer levels, while the maximum values were found under the B2N2 treatment. The titratable acidity first increased and then decreased with the biochar rates, and was positively correlated with the nitrogen fertilizer levels, while B1N3 obtained the highest titratable acidity of the fruits. B1N2 obtained the highest soluble solids and lycopene contents. The soluble sugar content of the fruits under the B2N2 treatment reached the maximum levels, which were 4.162% in 2021S and 3.926% in 2021A. When the nitrogen level was 300 kg/hm2, compared to the B0 treatment, B1 and B2 increased the soluble sugar content of the fruits by 4.41% and 12.67% in 2021S, and by 7.15% and 8.78% in 2021A, respectively. The sugar/acid ratio of the B2N2 treatment increased by 22.27% in 2021S and by 17.34% in 2021A, compared to that of the B1N3 treatment. The vitamin C content under the B2N2 treatment increased by 9.22% in 2021S and 11.97% in 2021A compared to the B0N3 treatment, respectively. When the nitrogen fertilizer level was 450 kg/hm2, compared to that of the B0 treatment, the titratable acid contents of B1 and B2 increased by 5.25% and 12.15% in 2021S and by 8.71% and 12.14% in 2021A, respectively. Compared to B0N3, the soluble solid content under the B1N2 treatment increased by 15.49% in 2021S and by 15.59% in 2021A. Compared to the B0N1 treatment, the lycopene content under the B1N2 treatment increased by 32.78% in 2021S and by 23.59% in 2021A.

3.5. Coupling Effect of Biochar and Nitrogen Fertilizer on the Rhizosphere Soil Environment of Tomatoes

The soil pH value, organic matter content, organic carbon content, and TN were positively correlated with the biochar rates (Table 8). With the increase in the nitrogen fertilizer levels, the soil pH value gradually decreased, while the soil organic matter content, organic carbon content, and TN content gradually increased. Under the same nitrogen fertilizer level, compared to B0, B1 and B2 increased the soil organic matter by 2.56~6.25% in 2021S and by 2.68~5.07% in 2021A, the organic carbon content by 1.94~6.00% in 2021S and by 2.51~5.37% in 2021A, the TN by 2.38~11.39% in 2021S and by 2.14~10.60% in 2021A, and the pH value by 0.26~0.78% in 2021S and by 0.52~1.56% in 2021A. The coupling effects of biochar and nitrogen fertilizer improved the soil acidity, and the pH varied within 0.3 units compared to the original soil, maintaining a relatively stable value.

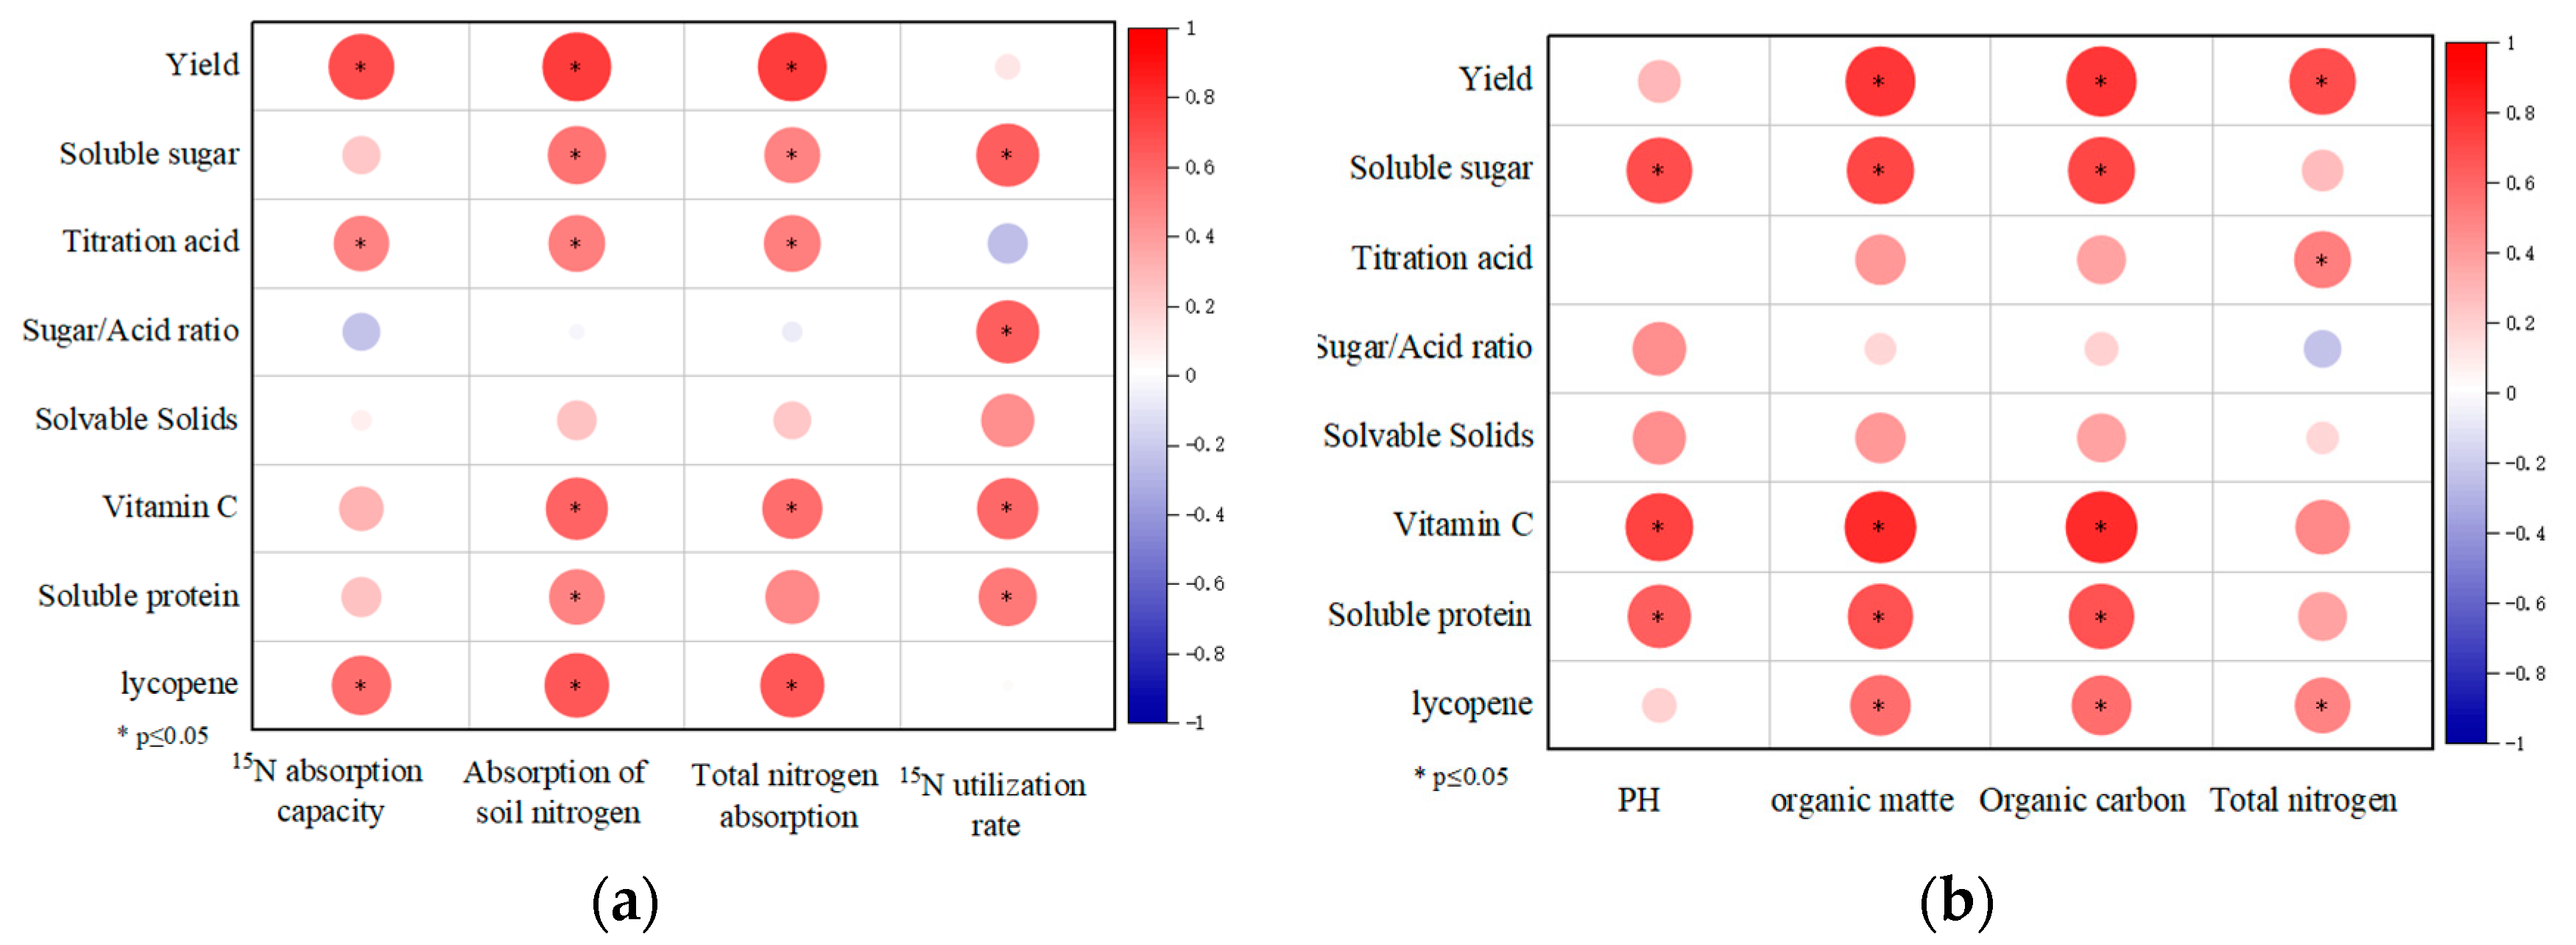
3.6. Effect of Nitrogen Uptake and Soil Environment on Yield and Quality of Tomatoes

Under alternate partial root-zone irrigation, the 15N uptake, the uptake of nitrogen derived from soil, and the TN uptake were significantly positively correlated with the tomato yield, titratable acid, and lycopene of the fruits (Figure 2a). Among these, the maximum correlation coefficient of the nitrogen derived from soil uptake between the TN uptake and the tomato yield was 0.75, followed by 0.69 between the 15N uptake and yield, indicating that the nitrogen content of the tomatoes had a larger correlation with the yield. Under the alternate partial root-zone irrigation, the contents of soil organic matter, organic carbon, and TN in the root zone were significantly correlated with the yield and lycopene of the fruits (Figure 1b). There were significant correlations among the pH, organic matter, and organic carbon contents with the soluble sugars, vitamin C, and soluble proteins of the tomato fruits (Figure 2b).

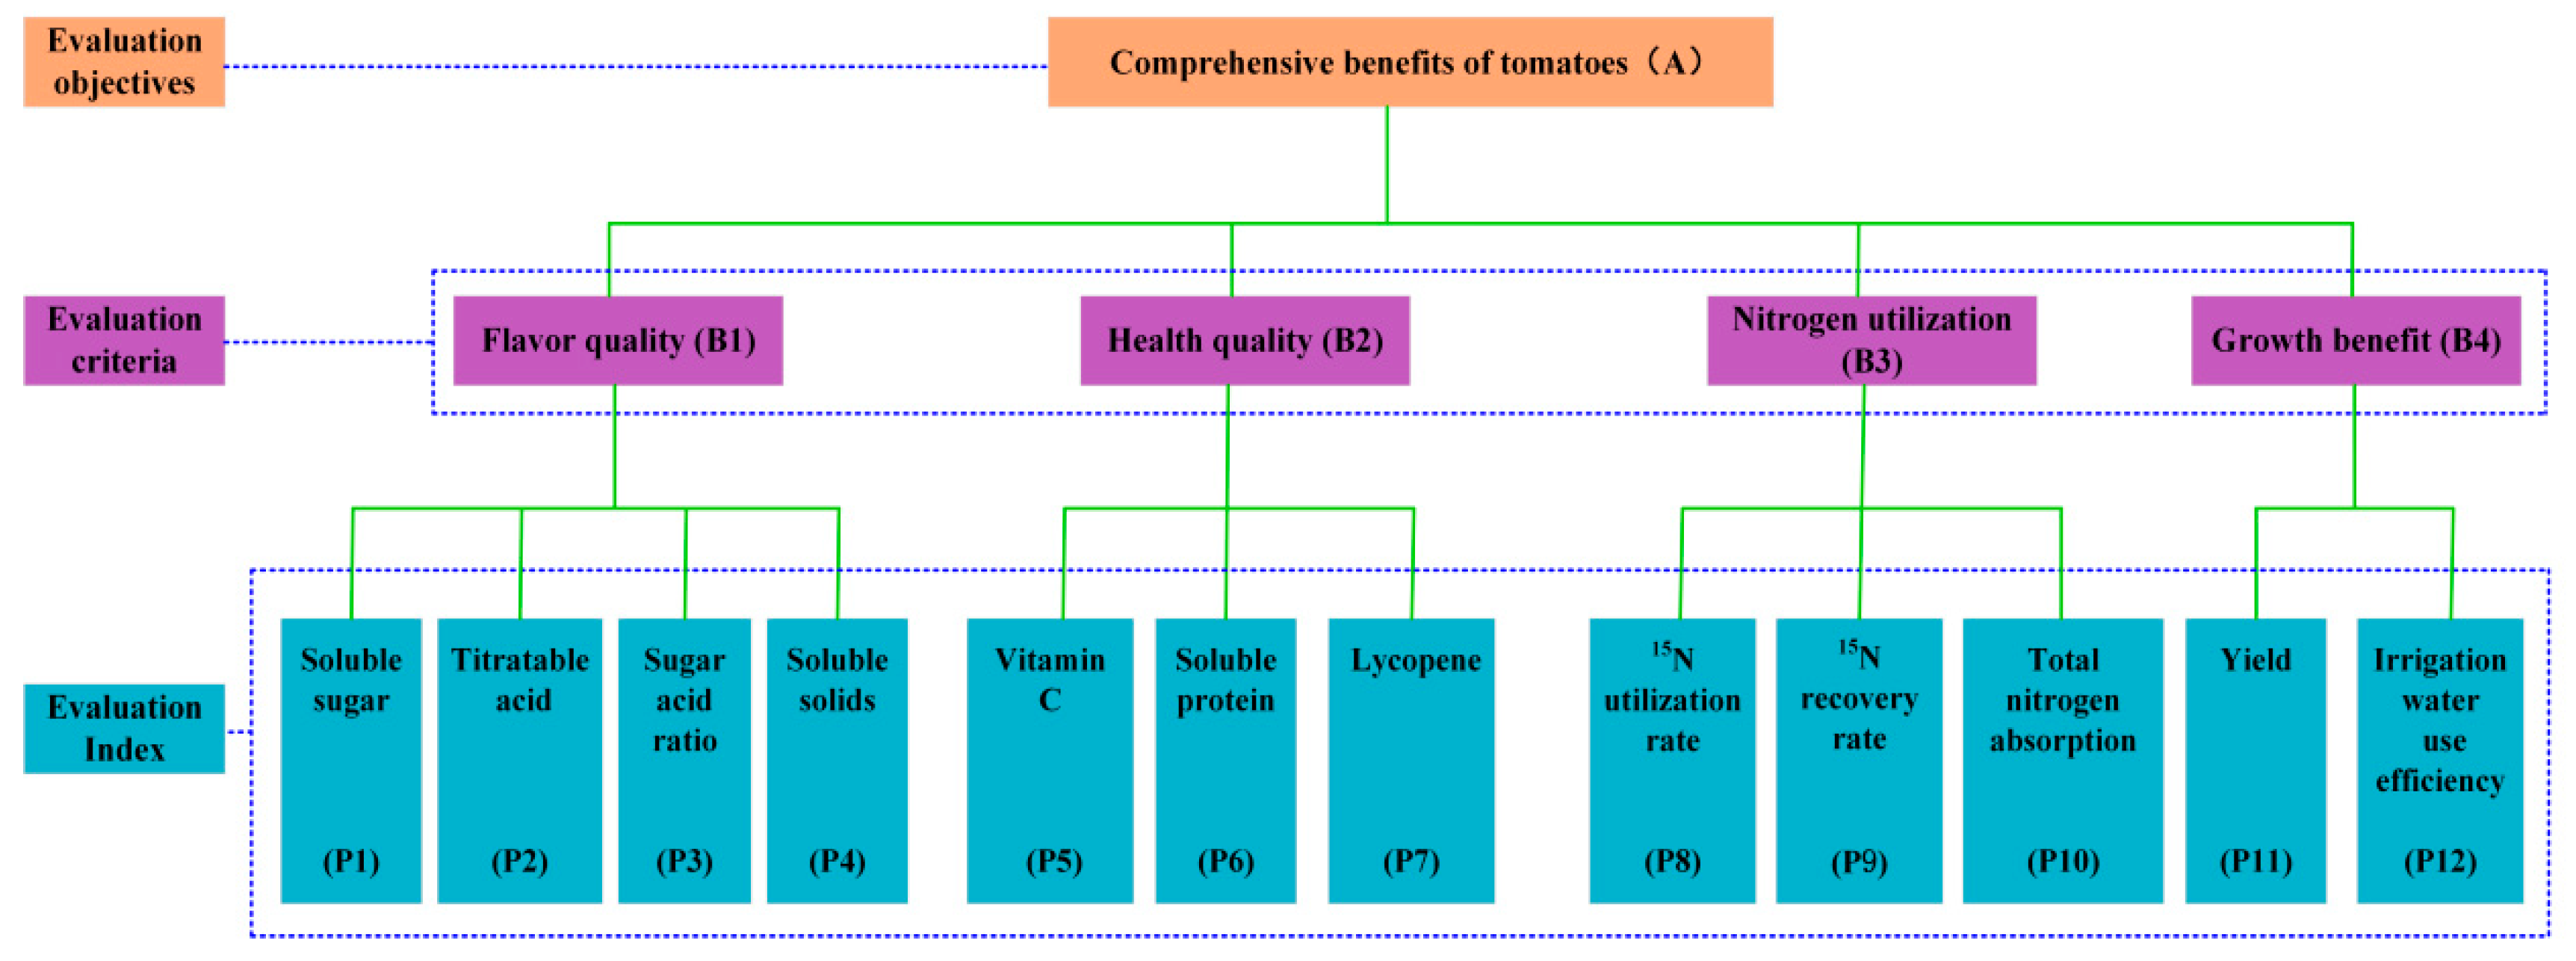
3.7. Evaluating the Comprehensive Benefits of Tomatoes Using the TOPSIS Method

The comprehensive benefits of tomato cultivation needed to be evaluated through multiple indicators, as each indicator had a different impact on the fruit quality and each indicator also interacted with the others. Thus, it is important to evaluate the comprehensive benefits of tomatoes for tomato production. The entropy weight method is commonly used in multi-attribute decision-making, which can objectively determine the importance of a certain indicator. The analytic hierarchy process (AHP) can subjectively determine the importance of each indicator. In this study, the tomato comprehensive benefit evaluation and analysis model was used (Figure 3). Evaluation target layer A was the comprehensive benefit of tomatoes, and layer B included flavor quality (B1), health quality (B2), nitrogen utilization (B3), and growth benefit (B4). Evaluation target layer P included soluble sugar (P1), titratable acid (P2), sugar/acid ratio (P3), soluble solids (P4), Vc (P5), soluble protein (P6), lycopene (P7), 15N utilization rate (P8), 15N recovery rate (P9), TN uptake (P10), fruits yield (P11), and WUE (P12). The entropy weight method and the AHP were used to comprehensively determine the combined weights of various indicators for calculating the comprehensive benefits of tomatoes. Finally, the comprehensive benefits of tomatoes were evaluated with the help of the technique for order preference by similarity to ideal solution (TOPSIS).
In Table 9, the judgment matrix was constructed by comparing two factors pairwise, and the local and final weights between each indicator were calculated. The consistency test coefficients were CR < 0.1, indicating that the consistency met the requirements. In Table 10, the objective weights of each evaluation indicator were calculated using the entropy weight method (EWM) based on the tomato quality indicators, nitrogen utilization, and growth benefits, while the indicator matrix was constructed [25]. Simultaneously, to achieve more scientific and reasonable weights, the combined weights were calculated using AHP and EWM. Finally, the combined weight and TOPSIS method were used for obtaining the comprehensive benefit evaluation results of tomatoes. The combination weight calculation method was as follows, and the results are shown in Table 11.
W i = ( θ i × μ i ) / ( i = 1 n θ i × μ i )   ( n = 1 , 2 , 12 )
Here, Wi is the index combination weight; θi is the analytic hierarchy process for calculating the weights; and μ is the weight calculated by the i-entropy weight method.
From the data of the experiments, the B1 and B2 were closer than B0 (Table 12). The highest value was obtained under the B2N2 treatment, followed by B2N1. The B0N3 treatment had the lowest score. In addition, biochar rates of 6 t/hm2 and a nitrogen fertilizer level of 300 kg/hm2 were beneficial for the growth and quality of tomatoes, concurrently reducing the fertilizer loss, achieving the highest comprehensive benefit of tomatoes, and obtaining a higher 15N utilization efficiency, yield, and WUE.

4. Discussion

Alternative partial root-zone irrigation improved the crop yield, WUE, and root growth [26,27] compared to traditional irrigation. In this study, the dry matter mass of tomatoes increased with the biochar and nitrogen fertilizer application rates. Under the same nitrogen fertilizer level, the plant height, stem diameter, and dry matter mass of the tomatoes improved with the biochar rates, which is similar to the previous research results obtained by Guo et al. [28]. Biochar application under the same irrigation and fertilization conditions was more beneficial for promoting crop growth and dry matter. Under the same biochar rate, the dry matter mass of tomatoes was not positively correlated with the nitrogen fertilizer levels, reaching the maximum dry matter mass of tomatoes under a nitrogen level of 300 kg/hm2. It can be concluded that excessive nitrogen input inhibited tomato growth under alternative partial root-zone irrigation, while the appropriate biochar–nitrogen fertilizer coupling mode could promote the growth and dry matter accumulation of tomatoes. As for tomato fruit yield, the treatments applying biochar showed a trend of increasing first and then decreasing with increasing nitrogen fertilizer levels. Sha et al. [29] proposed that tomato fruit yield also increased with the nitrogen fertilizer level, which was below 600 kg/hm2. This result may be explained by the fact that biochar applied with N fertilizer fixed more nutrients near the root zone of the crops, forming a great rhizosphere soil environment to promote crop growth and development and improving 15N utilization, thus maintaining high yield under the reduced N application.
Nitrogen fertilizer is one of the most important factors affecting crop growth and the development of crops, and the nitrogen accumulation and distribution were of great significance to the increase in the yield and quality of crops. In this study, the nitrogen derived from the fertilizer in tomato organs (root, stem, leaf, fruit) decreased gradually with the biochar application rates, indicating that biochar reduced the 15N abundance of each tomato organ. Biochar application increased the 15N uptake of tomato organs, which may indicate that biochar application increased the soil porosity, improved the soil structure, provided a better breeding environment for the survival of soil microorganisms, and improved soil fertility, thus promoting the absorption of more nutrients from the soil. The results from this study show that biochar application promoted the uptake of fertilizer nitrogen by tomatoes under the alternate partial root-zone irrigation procedure. Biochar increased the residue of fertilizer nitrogen in the soil and reduced the loss of fertilizer nitrogen. It seems possible that these results are due to the large specific surface area of biochar and the increased adsorption and fixation capacity of the soil to fertilizer, which increased the fertilizer retention in the soil. However, the loss of fertilizer nitrogen gradually increased with the increase in nitrogen application [30]. Meanwhile, this study also found that under alternate partial root-zone irrigation, high 15N recovery and utilization rates were obtained under nitrogen levels of 150 kg/hm2 and 300 kg/hm2. Excessive nitrogen was not helpful for improving nitrogen fertilizer utilization and recovery rates, which is similar to the research results of Liu et al. [31].
Proper biochar and nitrogen fertilizer application could improve tomato fruit quality. On the one hand, biochar with a high specific surface area, pore structure, certain mechanical strength, and small bulk density led to better aeration and water retention, reduced the leaching loss of water and nutrients, improved the activity of soil microorganisms, enhanced enzyme catalysis, provided a great soil environment for roots, and improved the efficiency of water and fertilizer utilization, which was conducive to the high fruit quality and yield of tomatoes [32]. On the other hand, alternate partial root-zone irrigation reduced the stomatal conductance and transpiration rate and improved the WUE and photosynthesis. Therefore, biochar did not significantly reduce the yield under water-saving conditions, but significantly increased fruit quality [33]. In addition, crop growth was closely related to the soil environment in the root zone. The continuous use of nitrogen fertilizer caused the soil pH value to drop by more than 1 unit [34], which might lead to soil acidification. In this study, compared to the soil pH value before the experiment, the changing range of the soil pH value under the biochar–nitrogen coupling application mode was within 0.3 units. The biochar–nitrogen coupling application mode kept the soil at a relatively stable pH value, indicating that the biochar–nitrogen coupling application mode did not significantly reduce the soil pH value and effectively prevented soil acidification caused by fertilization. Meanwhile, the biochar and nitrogen fertilizer coupling application effectively increased the contents of the soil’s organic matter, organic carbon, and TN under alternate partial root-zone irrigation. It may be that the soil benefitted from the biochar with a good pore structure and a large specific surface area. After being added to the soil, the biochar improved the microbial abundance and soil enzyme activity, which was rich in certain nutrients, further improving soil fertility in the root zone [35]. In addition, the inorganic nitrogen in the soil mainly originated from fertilizer nitrogen, so the content of the soil inorganic nitrogen increased with the nitrogen fertilizer levels, thereby increasing the TN content in the rhizosphere soil [36].
The agricultural production evaluation models played a positive guiding role in agricultural production, and effectively improved the economic benefits of agricultural production. The analytic hierarchy process, entropy weight method, and TOPSIS method are widely applied in agricultural production evaluation [37]. Yu et al. [38] used the TOPSIS method based on the entropy weight method to evaluate the experimental effect of nitrogen fertilizer levels under different irrigation upper limits in protected areas of Northeast China. Wang et al. [39] used the analytic hierarchy process and TOPSIS method to establish a comprehensive quality index and analyzed the rationality of the comprehensive quality index. In this study, the comprehensive benefit evaluation results of growth, nitrogen utilization, yield, and quality indicators using the TOPSIS method, based on combination weighting, showed that the yield and quality of tomato and nitrogen utilization improved under the biochar application rates of 6 t/hm2, and the highest yield and quality of tomato and nitrogen utilization were obtained under nitrogen levels of 300 kg/hm2. Reasonable nitrogen levels and biochar rates were conducive to promoting the growth of tomatoes, NUU, yield, and quality, and to obtaining the maximum benefits.

5. Conclusions

(1)
Biochar application promoted the growth and dry matter mass accumulation of tomatoes and increased the yield and WUE of tomatoes.
(2)
Under the biochar and nitrogen fertilizer coupling application mode, the nitrogen derived from the fertilizer was concentrated in the leaves and fruits of the tomatoes. Biochar application rates increased the uptake of 15N, the nitrogen derived from soil, the TN, and the proportion of fertilizer nitrogen, and increased the utilization rate and recovery rate of nitrogen fertilizer, while decreasing the nitrogen derived from fertilizer.
(3)
Biochar application increased the contents of the soil organic matter, organic carbon, and TN.
(4)
The uptake of nitrogen derived from soil and the TN, organic matter, organic carbon, and total nitrogen of the soil had a direct effect on the tomato yield, with significant correlations. B2N2 treatment with biochar rates of 6 t/hm2 and a N level of 300 kg/hm2 under split-root alternate irrigation are recommended.
The results from this study provide a theoretical basis for improving the water and nitrogen fertilizer utilization efficiency and fruit yield and quality, and for achieving sustainable soil utilization under alternate partial root-zone irrigation.

Author Contributions

Conceptualization, methodology, resources, project administration, and validation, J.Z.; formal analysis, investigation, and writing—original draft preparation, K.Z.; writing—review and editing, visualization, supervision, Y.W. (Yan Wang), C.S., and Y.W. (You Wu). All authors have read and agreed to the published version of the manuscript.

Funding

This study was funded by the National Natural Science Foundation of China (51969012), the Red Willow First-Class Discipline Project of Lanzhou University of Technology (0807J1), the Industry Supporting and Guiding Project of Gansu Higher Education Institutions (2021CYZC-27, 2021CYZC-33), the Water Science and Technology Project of Jinan City (JNSWKJ202206), and the University Teacher Innovation Fund Project (2023B-431), which are duly acknowledged here with thanks.

Institutional Review Board Statement

Not applicable.

Informed Consent Statement

Not applicable.

Data Availability Statement

Data are contained within the article.

Conflicts of Interest

The authors declare no conflict of interest.

References

  1. Lutes, K.; Oelbermann, M.; Thevathasan, N.V.; Gordon, A.M. Effect of nitrogen fertilizer on greenhouse gas emissions in two willow clones (Salix miyabeana and S. dasyclados) in southern Ontario, Canada. Agrofor. Syst. 2016, 90, 785–796. [Google Scholar] [CrossRef]
  2. Kahrl, F.; Li, Y.; Su, Y.; Tennigkeit, T.; Wilkes, A.; Xu, J. Greenhouse gas emissions from nitrogen fertilizer use in China. Environ. Sci. Policy 2010, 13, 688–694. [Google Scholar] [CrossRef]
  3. Bradbury, N.J.; Whitmore, A.P.; Hart, P.B.S.; Jenkinson, D.S. Modelling the fate of nitrogen in crop and soil in the years following application of 15N-labelled fertilizer to winter wheat. J. Agric. Sci. 1993, 121, 363–379. [Google Scholar] [CrossRef]
  4. Tian, X.; Li, Z.; Wang, L.; Wang, Y.; Li, B.; Duan, M.; Liu, B. Effects of biochar combined with nitrogen fertilizer reduction on rapeseed yield and soil aggregate stability in upland of purple soils. Int. J. Environ. Res. Public Health 2020, 17, 279. [Google Scholar] [CrossRef] [PubMed]
  5. Liu, J.; You, L.; Amini, M.; Obersteiner, M.; Herrero, M.; Zehnder, A.J.; Yang, H. A high-resolution assessment on global nitrogen flows in cropland. Proc. Natl. Acad. Sci. USA 2010, 107, 8035–8040. [Google Scholar] [CrossRef] [PubMed]
  6. Du, S.; Kang, S.; Li, F.; Du, T. Water use efficiency is improved by alternate partial root-zone irrigation of apple in arid northwest China. Agric. Water Manag. 2017, 179, 184–192. [Google Scholar] [CrossRef]
  7. Shu, L.Z.; Liu, R.; Min, W.; Wang, Y.S.; Yu, H.-M.; Zhu, P.F.; Zhu, J.R. Regulation of soil water threshold on tomato plant growth and fruit quality under alternate partial root-zone drip irrigation. Agric. Water Manag. 2020, 238, 1–8. [Google Scholar] [CrossRef]
  8. Mossad, A.; Farina, V.; Lo Bianco, R. Fruit Yield and Quality of ‘Valencia’ Orange Trees under Long-Term Partial Rootzone Drying. Agronomy 2020, 10, 164. [Google Scholar] [CrossRef]
  9. Liu, F.; Shahnazari, A.; Andersen, M.N.; Jacobsen, S.E.; Jensen, C.R. Physiological responses of potato (Solanum tuberosum L.) to partial root-zone drying: ABA signalling, leaf gas exchange, and water use efficiency. J. Exp. Bot. 2006, 57, 3727–3735. [Google Scholar] [CrossRef]
  10. Wei, Z.; Du, T.; Li, X.; Fang, L.; Liu, F. Interactive effects of CO2 concentration elevation and nitrogen fertilization on water and nitrogen use efficiency of tomato grown under reduced irrigation regimes. Agric. Water Manag. 2018, 202, 174–182. [Google Scholar] [CrossRef]
  11. Shao, G.-C.; Liu, N.; Zhang, Z.-Y.; Yu, S.-E.; Chen, C.-R. Growth, yield and water use efficiency response of greenhouse-grown hot pepper under Time-Space deficit irrigation. Sci. Hortic. 2010, 126, 172–179. [Google Scholar]
  12. Joseph, S.D.; Camps-Arbestain, M.; Lin, Y.; Munroe, P.; Chia, C.H.; Hook, J.; Van Zwieten, L.; Kimber, S.; Cowie, A.; Singh, B.P.; et al. An investigation into the reactions of biochar in soil. Soil Res. 2010, 48, 501–515. [Google Scholar] [CrossRef]
  13. Lin, M.; Li, F.; Li, X.; Rong, X.; Oh, K. Biochar-clay, biochar-microorganism and biochar-enzyme composites for environmental remediation: A review. Environ. Chem. Lett. 2023, 21, 1837–1862. [Google Scholar] [CrossRef]
  14. Li, Q.; Li, H.; Fu, Q.; Li, T.; Liu, D.; Hou, R.; Cui, S.; Ji, Y.; Cai, Y. Effects of different biochar application methods on soybean growth indicator variability in a seasonally frozen soil area. Catena 2020, 185, 104307. [Google Scholar] [CrossRef]
  15. Du, B.; Cao, H.; Pan, X.; Zhang, Z. Effects of biochar on the tomato yield and quality in heavy loam soil in greenhouse under deficit irrigationin. Agric. Res. Arid. Areas 2020, 38, 136–142. [Google Scholar]
  16. Guo, L.; Bornø, M.L.; Niu, W.; Liu, F. Biochar amendment improves shoot biomass of tomato seedlings and sustains water relations and leaf gas exchange rates under different irrigation and nitrogen regimes. Agric. Water Manag. 2021, 245, 106580. [Google Scholar] [CrossRef]
  17. Akhtar, S.S.; Li, G.; Andersen, M.N.; Liu, F. Biochar enhances yield and quality of tomato under reduced irrigation. Agric. Water Manag. 2014, 138, 37–44. [Google Scholar] [CrossRef]
  18. Han, J.; Feng, T.; Zhu, Z.; Li, P.; Zhang, A.; Tong, Y.; Wang, X. Evaluating the effects of fertilization treatments on the nitrogen use efficiency of apple trees using allometric model and 15N tracer. Trans. Chin. Soc. Agric. Eng. 2021, 37, 96–104. [Google Scholar]
  19. Li, X.; Wang, Y.; Feng, G.; Xu, Z.; Meng, F.; Gao, Q. Differential fertilizer nitrogen fates in maize cropping system among three soil textures based on 15N. Field Crop. Res. 2023, 291, 108780. [Google Scholar] [CrossRef]
  20. Guo, R.; Miao, W.; Fan, C.; Li, X.; Shi, X.; Li, F.; Qin, W. Exploring optimal nitrogen management for high yielding maize in arid areas via 15N-labeled technique. Geoderma 2021, 382, 114711. [Google Scholar] [CrossRef]
  21. Zheng, J.; Qi, X.Y.; Yang, S.H.; Shi, C.; Feng, Z.J. Effects and evaluation of biogas slurry/water integrated irrigation technology on the growth, yield and quality of tomatoes. Int. J. Agric. Biol. Eng. 2022, 15, 123–131. [Google Scholar] [CrossRef]
  22. Zheng, J.; Li, X.; Zhang, Y.; Zhang, P.; Wang, J. Effects of Digestate Application on Tomato Growth, Yield, Quality, and Soil Nitrogen Content via Integrated Hole Irrigation. J. Biobased Mater. Bioenergy 2019, 13, 620–634. [Google Scholar] [CrossRef]
  23. Pier, J.W.; Doerge, T.A. Concurrent evaluation of agronomic, economic, and environmental aspects of trickleirrigated watermelon production. J. Environ. Qual. 1995, 24, 79–86. [Google Scholar] [CrossRef]
  24. Shi, X.; Song, X.; Yang, J.; Zhao, Y.; Yuan, Z.; Zhao, G.; Abbott, L.K.; Zhang, F.; Li, F.M. Yield benefits from joint application of manure and inorganic fertilizer in a long-term field pea, wheat and potato crop rotation. Field Crop. Res. 2023, 294, 108873. [Google Scholar] [CrossRef]
  25. Zheng, J.; Zhang, P.; Cui, N.; Wang, Y.; Wang, J.; Qi, X. Experimental Study on the Optimal Threshold of Water and Nitrogen Quantities for Tomato Growth under the Irrigation with Biogas Slurry in Greenhouse. Appl. Eng. Agric. 2021, 37, 333–342. [Google Scholar] [CrossRef]
  26. Jovanovic, Z.; Stikic, R. Partial root-zone drying technique: From water saving to the improvement of a fruit quality. Front. Sustain. Food Syst. 2018, 1, 3. [Google Scholar] [CrossRef]
  27. Puértolas, J.; Dodd, I.C. Evaluating soil evaporation and transpiration responses to alternate partial rootzone drying to minimise water losses. Plant Soil 2022, 480, 473–489. [Google Scholar] [CrossRef]
  28. Guo, L.; Yu, H.; Kharbach, M.; Zhang, W.; Wang, J.; Niu, W. Biochar improves soil-tomato plant, tomato production, and economic benefits under reduced nitrogen application in northwestern China. Plants 2021, 10, 759. [Google Scholar] [CrossRef]
  29. Sha, H.; Sun, Q.; Li, J.; Guo, X.; Chen, R. Effect of N Fertilizer on Growth, Yield, Quality of Tomato and Optimum Application Rate of N in Greenhouse. Acta Agric. Boreali-Occident. Sin. 2010, 19, 104–108. [Google Scholar]
  30. Zhang, M.; Hou, R.; Li, T.; Fu, Q.; Zhang, S.; Su, A.; Xue, P.; Yang, X. Study of soil nitrogen cycling processes based on the 15N isotope tracking technique in the black soil areas. J. Clean. Prod. 2022, 375, 134173. [Google Scholar] [CrossRef]
  31. Liu, R.; Yang, Y.; Wang, Y.S.; Wang, X.C.; Rengel, Z.; Zhang, W.J.; Shu, L.Z. Alternate partial root-zone drip irrigation with nitrogen fertigation promoted tomato growth, water and fertilizer-nitrogen use efficiency. Agric. Water Manag. 2020, 233, 106049. [Google Scholar] [CrossRef]
  32. Shang, X.; Hung, C.Y.; Husk, B.; Orsat, V.; Whalen, J.K. Wood-based biochar for small fruit production in southern Quebec, Canada. Can. J. Soil Sci. 2021, 102, 89–96. [Google Scholar] [CrossRef]
  33. Ghafari, H.; Hassanpour, H.; Jafari, M.; Besharat, S. Effect of partial root zone irrigation on physiology, water use efficiency, fruit yield, phenolic compounds and antioxidant capacity of apple. Arch. Agron. Soil Sci. 2021, 67, 1521–1538. [Google Scholar] [CrossRef]
  34. Fu, G.; Shen, Z.-X. Response of alpine soils to nitrogen addition on the Tibetan Plateau: A meta-analysis. Appl. Soil Ecol. 2017, 114, 99–104. [Google Scholar] [CrossRef]
  35. Zhang, Y.N.; Zhao, J.X.; Huang, X.L. Effects of graphene-modified biochar on soil enzyme activity and microbial biomass carbon nitrogen phosphorus. Fresenius Environ. Bull. 2022, 31, 9109–9117. [Google Scholar]
  36. Zhou, H.; Wang, Y.; Wang, J.; Liu, H.; Li, H.; Guo, J. Effects of Long-Term Organic–Inorganic Nitrogen Application on Maize Yield and Nitrogen-Containing Gas Emission. Agronomy 2023, 13, 848. [Google Scholar] [CrossRef]
  37. Liang, C.; Yu, S.; Zhang, H.; Wang, Z.; Li, F. Economic Evaluation of Drought Resistance Measures for Maize Seed Production Based on TOPSIS Model and Combination Weighting Optimization. Water 2022, 14, 3262. [Google Scholar] [CrossRef]
  38. Yu, N.; Wu, C.; Zhang, Y.; Zou, H.; Fan, Q.; Zhang, Y. Application of TOPSIS model method based on entropy weight coupling effect of irrigation and fertilization of greenhouse to evaluate Tomato. J. Shenyang Agric. Univ. 2012, 43, 456–460. [Google Scholar]
  39. Wang, F.; Kang, S.; Du, T.; Li, F.; Qiu, R. Determination of comprehensive quality index for tomato and its response to different irrigation treatments. Agric. Water Manag. 2011, 98, 1228–1238. [Google Scholar] [CrossRef]
Figure 1. Coupling effect of biochar and nitrogen fertilizer on nitrogen derived from fertilizer to various organs of tomatoes. Note: (a, b, c, d, e, f and g) significant differences among the same indexes of different treatments at the p = 0.05 level.
Horticulturae 09 01320 g001
Figure 2. Pearson correlation heat map. (a) Correlation of nitrogen absorption, and utilization with tomato yield and quality. (b) Correlation of soil environment with tomato yield and quality.
Horticulturae 09 01320 g002
Figure 3. Evaluation system of comprehensive benefits of tomatoes.
Horticulturae 09 01320 g003
Table 1. Soil physical and chemical properties before the experiment.
SeasonpHTotal
Nitrogen (g/kg)
Organic Matter
(g/kg)
Organic Carbon
(g/kg)
Bulk Density (g/cm3)Water-Holding Capacity of Soil
(%)
2021S7.841.06116.129.5031.3525.3
2021A7.991.03416.039.4111.3624.8
Table 2. Basic physical and chemical properties of biochar.
PHBulk Density
(g/cm3)
Specific Surface Area
(m2/g)
Total Porosity
(%)
Cation Exchange Capacity
(mol/kg)
Total
Nitrogen (g/kg)
Fixed Carbon
(g/kg)
10.230.19967.0360.813.17400
Table 3. Experimental design.
TreatmentsBiochar Application Rates (t/hm2)Nitrogen Application Rates (kg/hm2)
B0N10150
B0N20300
B0N30450
B1N13150
B1N23300
B1N33450
B2N16150
B2N26300
B2N36450
Table 4. Explanation of formula symbols.
SymbolRepresentative MeaningUnit
15N0Abundance of 15N in natural%
15N1Abundance of 15N in sample%
15N2Abundance of 15N in labeled urea%
NdffNitrogen derived from fertilizer%
Ndfs Nitrogen derived from soil%
15NUO15N uptake capacity of each organg/plant
KMass ratio of TN in each organ/
15NU15N uptake capacityg/plant
15NUR, 15NUS, 15NUL, 15NUF15N uptake capacity by roots, stems, leaves, fruitsg/plant
NdfsoAbsorbed capacity of nitrogen derived from soil by tomato organsg/plant
NdfsaCapacity of nitrogen derived from soil absorbedg/plant
NdfsaR, NdfsaS, NdfsaL, NdfsaFCapacity of nitrogen derived from soil absorbed by roots, stems, leaves, fruitsg/plant
15NUr15N utilization rate of tomato%
15NUR15N uptake rate%
TNTotal nitrogen contentg/plant
15NRR15N recovery rate of tomato%
15NSRResidue of soil 15Ng/plant
Table 5. Coupling effects of biochar and nitrogen fertilizer on tomato plant height, stem diameter, dry matter mass, and yield in two growing seasons.
Treatment2021 S2021 A
Plant
Height
(cm)
Stem Diameter
(mm)
Dry Matter Mass
(g/plant)
Yield
(kg)
Irrigation Water-Use Efficiency
(kg/m3)
Plant
Height
(cm)
Stem Diameter
(mm)
Dry Matter Mass
(g/plant)
Yield
(kg)
Irrigation Water-Use Efficiency
(kg/m3)
B0 N176.8 f8.32 g114.52 g1.95 g63.37 g70.2 f7.95 g111.54 f1.69 f63.68 g
B0 N277.6 e8.54 fg122.42 e2.20 de71.49 d71.6 e8.12 f120.56 de1.94 d73.10 c
B0 N380.6 d8.75 de116.75 fg2.06 f66.94 f72.9 d8.41 e116.15 e1.79 ef67.45 f
B1 N178.8 f8.81 ef118.73 f2.14 e69.54 e73.6 d8.57 d117.93 e1.83 e68.95 e
B1 N283.5 b9.13 bc133.26 b2.43 c78.32 c74.4 d8.62 d131.72 c2.11 bc79.50 bc
B1 N383.9 b9.19 bc128.25 c2.37 c77.02 c75.9 bc8.79 b125.93 d2.06 c77.62 bc
B2 N182.4 c8.92 cd123.35 d2.23 de72.47 d75.2 c8.71 c123.67 d1.92 d72.34 d
B2 N284.9 a9.36 ab144.96 a2.61 a84.82 a76.6 b8.85 b139.95 a2.29 a86.28 a
B2 N385.8 a9.58 a136.01 b2.49 b80.92 b78.1 a9.03 a135.16 b2.15 b81.01 b
Note: (a, b, c, d, e, f, and g) significant differences among the same indexes of different treatments at the p = 0.05 level. The same applies below.
Table 6. Coupling effect of biochar and nitrogen fertilizer on nitrogen accumulation.
SeasonTreatment15 N Uptake Capacity
(g/plant)
Uptake of Nitrogen Derived
from Soil
(g/plant)
TN Uptake
(g/plant)
15 N TN Uptake
(%)
15 N Utilization Rate
(%)
15 N Recovery Rate
(%)
2021 SB0 N1298.2 g1.918 h2.216 h13.45 e28.13 b60.37 f
B0 N2442.3 e2.511 f2.953 f14.97 cb20.86 d52.17 g
B0 N3534.3 d2.739 e3.273 e16.32 a16.80 f49.74 h
B1 N1325.6 f2.268 g2.594 g12.57 f30.71 a68.45 c
B1 N2530.6 d3.134 c3.665 c14.49 dc25.03 c63.76 d
B1 N3614.6 c3.375 b3.992 b15.41 b19.33 e61.73 e
B2 N1337.5 f2.924 d3.270 d10.58 g31.84 a75.53 a
B2 N2650.4 b3.986 a4.636 a14.02 d30.68 a72.71 b
B2 N3699.2 a4.028 a4.727 a14.79 c21.99 d69.46 c
2021 AB0 N1286.5 h1.888 h2.175 h13.18 d27.03 c56.87 d
B0 N2403.7 e2.352 f2.755 f14.65 b19.04 f45.99 g
B0 N3495.1 d2.547 e3.042 e16.28 a15.57 h42.42 h
B1 N1320.0 g2.286 g2.606 g12.28 e30.19 a64.38 b
B1 N2473.7 d3.021 c3.495 c13.56 c22.35 d54.31 e
B1 N3576.9 c3.271 b3.848 b14.99 b18.14 g52.08 f
B2 N1348.5 f2.859 d3.208 d10.87 f30.88 a72.66 a
B2 N2614.1 b4.079 a4.693 a13.09 cd28.97 b64.39 b
B2 N3662.2 a4.033 a4.695 a14.10 bc20.82 e57.61 c
Note: (a, b, c, d, e, f, g and h) significant differences among the same indexes of different treatments at the p = 0.05 level.
Table 7. Coupling effect of biochar and nitrogen fertilizer on tomato fruit quality.
SeasonTreatmentFlavor QualityNutritional Quality
Soluble
Sugar
(%)
Titration
Acid
(%)
Sugar/Acid RatioSolvable Solids
(%)
Vitamin C
(mg·100/g)
Soluble Protein
(mg/g)
Lycopene (mg/kg)
B0 N13.611 f0.356 g10.143 d5.47 f35.256 h0.936 g28.34 h
B0 N23.694 e0.359 fg10.290 c5.68 d35.797 g1.043 e29.15 g
B0 N33.602 f0.362 f9.950 f5.36 g35.133 i0.885 h28.73 g
B1 N13.759 d0.373 d10.078 e5.92 b37.082 e1.052 de31.52 e
2021 SB1 N23.857 c0.399 b9.667 h6.19 a37.158 d1.107 c37.63 a
B1 N33.715 de0.406 a9.150 i5.76 c36.141 f0.984 f35.87 c
B2 N13.943 b0.368 e10.715 b5.71 cd38.065 b1.124 b30.55 f
B2 N24.162 a0.372 de11.188 a5.86 b38.373 a1.165 a36.94 b
B2 N33.721 de0.381 c9.766 g5.59 e37.734 c1.061 d33.26 d
B0 N13.583 de0.361 f9.925 b5.38 e34.796 e0.794 e30.35 h
B0 N23.609 d0.372 e9.702 c5.46 e34.929 e0.805 de32.66 f
B0 N33.499 e0.379 e9.232 f5.26 f33.865 f0.771 f31.43 g
B1 N13.716 c0.395 cd9.408 e5.88 b35.176 d0.887 c34.74 d
2021 AB1 N23.867 b0.403 c9.596 d6.08 a36.124 c1.016 b37.51 a
B1 N33.665 cd0.425 a8.624 h5.57 d35.063 d0.813 d36.97 b
B2 N13.851 b0.383 d10.055 b5.64 c36.635 b0.964 c33.27 e
B2 N23.926 a0.388 d10.119 a5.81 b37.918 a1.085 a36.59 b
B2 N33.684 c0.412 b8.942 g5.51 d35.883 c0.921 c35.76 c
Note: (a, b, c, d, e, f, g, h and i) significant differences among the same indexes of different treatments at the p = 0.05 level.
Table 8. Coupling effects of biochar and nitrogen fertilizer on the rhizosphere soil environment of tomatoes.
Treatment2021 S2021 A
Organic Matter
(g/kg)
Organic Carbon
(g/kg)
TN
(g/kg)
pHOrganic Matter
(g/kg)
Organic Carbon
(g/kg)
TN
(g/kg)
pH
B0 N118.46 e10.688 f1.305 f7.76 bc18.31 f10.616 f1.311 f7.75 d
B0 N218.59 d10.775 e1.431 ef7.71 cd18.51 e10.684 ef1.422 d7.69 ef
B0 N318.61 d10.794 e1.440 e7.72 c18.57 e10.691 e1.431 b7.67 f
B1 N118.91 c10.895 d1.434 d7.78 cd18.86 d10.882 d1.339 e7.79 bc
B1 N219.04 c10.994 c1.465 c7.76 de18.98 c10.974 c1.464 c7.76 cd
B1 N319.09 c11.025 c1.533 b7.74 ef19.05 c11.015 b1.485 b7.71 e
B2 N119.45 b11.203 b1.447 d7.82 a19.04 cd11.027 b1.450 c7.85 a
B2 N219.67 a11.394 a1.472 c7.79 ab19.38 b11.258 a1.469 bc7.81 b
B2 N319.71 a11.442 a1.604 a7.78 b19.46 a11.264 a1.545 a7.78 c
Note: (a, b, c, d, e and f) significant differences among the same indexes of different treatments at the p = 0.05 level.
Table 9. Weights of comprehensive benefit indicators of tomatoes based on the analytical hierarchy process.
LayerJudgment MatrixPartial WeightFinal WeightParametric Test
B-PIndexB1B2B3B4γiμi

CR = 0.004
λmax = 4.014
B11.0001.3010.8021.0210.2530.253
B20.7691.0000.8301.1090.2290.229
B31.2471.2051.0001.2240.2890.289
B40.9790.9020.8171.0000.2290.229
B-PIndexP1P2P3P4γiμi

CR = 0.014
λmax = 4.049
P11.0001.5141.4961.2890.3200.081
P20.6611.0001.5021.2230.2580.065
P30.6680.6661.0001.3510.2110.053
P40.7760.8180.7401.0000.0240.052
B-PIndexP5P6P7γiμi
CR = 0.000
λmax = 3.000
P51.0001.0420.9950.3370.077
P60.9601.0000.9470.3230.074
P71.0051.0561.0000.3400.078
B-PIndexP8P9P10γiμi
CR = 0.000
λmax = 3.000
P81.0001.0211.1350.3500.101
P90.9791.0001.1040.3420.099
P100.8810.9061.0000.3090.089
B-PIndexP11P12γiμi
CR = 0.000
λmax = 2.000
P111.0001.0450.5110.117
P120.9571.0000.4890.112
Note: CR is the consistency parameter in the judgment matrix. If CR < 0.1, the consistency met the requirements. λ Max is the maximum eigenvalue. B, and P represent the hierarchical structure of growth efficiency indicators of tomatoes.
Table 10. Weights of comprehensive benefit indicators of tomatoes based on the entropy weight method.
IndexSoluble
Sugar
Titration
Acid
Sugar/Acid RatioSoluble SolidsVitamin CSoluble Protein
2021S0.01190.01160.01870.01020.00590.0419
2021A0.00670.01180.01300.00960.00500.0664
IndexLycopene15N Utilization Rate15N
Recovery Rate
TN UptakeYieldIWUE
2021S0.08910.27350.10590.33550.04790.0480
2021A0.02500.28880.12530.30120.07370.0738
Table 11. Weights of comprehensive benefit indicators of tomatoes based on combination weighting.
IndexSoluble
Sugar
Titration
Acid
Sugar/Acid RatioSoluble SolidsVitamin CSoluble Protein
2021S0.00970.00740.01010.00530.00460.0312
2021A0.00540.00770.00690.00490.00380.0489
IndexLycopene15N Utilization Rate15N Recovery RateTN UptakeYieldIWUE
2021S0.06970.27850.10530.04310.05650.3785
2021A0.01940.29130.12340.06560.08600.3366
Table 12. Evaluation results and ranking based on TOPSIS method under each treatment.
TimeTreatmentD+D-SiRank
2021SB0N10.03180.02390.42907
B0N20.03720.01270.25488
B0N30.04240.01390.24619
B1N10.02460.03530.58984
B1N20.02020.03030.60033
B1N30.03320.02720.45086
B2N10.02190.03970.64462
B2N20.00430.04550.91371
B2N30.02420.03140.56425
2021AB0N10.05390.03050.36137
B0N20.05860.01840.23868
B0N30.05610.01440.20459
B1N10.04260.04080.48914
B1N20.03730.03450.48075
B1N30.04360.03480.44376
B2N10.03010.05250.63542
B2N20.01150.06300.84551
B2N30.03240.05260.61883
Disclaimer/Publisher’s Note: The statements, opinions and data contained in all publications are solely those of the individual author(s) and contributor(s) and not of MDPI and/or the editor(s). MDPI and/or the editor(s) disclaim responsibility for any injury to people or property resulting from any ideas, methods, instructions or products referred to in the content.

