Article

Monitoring of Seasonal Under-Vine CO2 Effluxes in a Vineyard under Different Fertilization Practices

by
Pasquale Cirigliano
1,*,
Andrea Cresti
1,
Andrea Rengo
2,
Mauro Eugenio Maria D’Arcangelo
1 and
Elena Brunori
2
1
CREA—Council for Agricultural Research and Agricultural Economics Analysis, Research Centre in Viticulture and Oenology, Research Unit for Viticulture (Arezzo), 52100 Arezzo, Italy
2
Department of Innovation in Biological, Agro-Food and Forestry Systems (DIBAF), University of Tuscia, 01100 Viterbo, Italy
*
Author to whom correspondence should be addressed.
Horticulturae 2023, 9(10), 1107; https://doi.org/10.3390/horticulturae9101107
Submission received: 13 July 2023 / Revised: 10 August 2023 / Accepted: 15 August 2023 / Published: 6 October 2023

Abstract

:
Soil CO2 efflux is a pivotal component of agro-ecosystem C budgets. It is considered a proxy indicator of biological activity and a descriptor of soil quality that is strongly linked to agricultural soil management. We investigated the effects of soil fertilization practices (organo-mineral (OMN) versus chemical (C)) on soil under-vine CO2 efflux (TSR) in an Italian rainfed vineyard (cv Chardonnay). The TSR was measured using the chamber technique as follows: a close multi-chamber system (prototype) was placed under a vine. Data (CO2, temperature, and moisture) were acquired hourly during two consecutive years (2021 and 2022) from flowering to berry ripening. Physical–hydrological soil parameters were determined, and the seasonal trends of the TSR, soil temperature, and soil moisture were assessed. The TSR measurements fluctuated for the 2021 season, ranging from 1.03 to 1.97 µmol CO2∙m−2∙s−1 for the C treatment, while for the OMN treatment, the TSR measurements ranged from 1.24 to 1.71 µmol CO2∙m−2∙s−1. Extreme weather conditions (2022) highlighted the differences between the two agronomical practices, and a decoupling was found between the TSR and the soil water content, with the TSR being controlled primarily by the soil temperature. At the daily scale, the findings showed that the TSR reached its minimum in the early morning hours (5:00–8:00). The results promote organic–mineral nutrition as an improved practice for soil carbon storage (restoration of the organic fraction) by reducing the TSR, permitting the preservation of soil quality and stabilizing the hydrological traits by preserving the biotic activities.

1. Introduction

Agricultural systems are key sectors for the achievement of EU environmental priorities, such as achieving climate neutrality by 2050. The transition to carbon-neutral agriculture means achieving a net-zero balance of the emissions and sinks of all greenhouse gases on farms in terms of CO2 equivalents. Agriculture directly accounts for 18.4% of greenhouse gas emissions, and it is the second-largest sector in the world in terms of altering greenhouse gas production [1,2]. In order to mitigate agricultural impacts and guide farmers towards sustainable agricultural and food systems, agricultural systems require integrated ecological approaches that are able to improve soil health and quality, store carbon, and reduce CO2 emissions [3]. Total soil respiration (TSR) is the major component of the CO2 global flux of agro-ecosystems, and it is defined as a process driven by soil microorganisms and crop roots that consume O2 and emit CO2 [4]. Studies on TSR and factors that regulate CO2 fluxes in soil–atmosphere interfaces have mainly been focused on forest and grassland ecosystems [5,6,7], while fewer studies have been concerned about TSR in the agricultural sector in semi-arid regions such as those in the Mediterranean [4,5,6,7,8,9]. Vineyards, which are among the most widespread cropping systems in the world, are usually grown in soils characterized by low soil organic carbon, and increases in TSR can contribute to soil quality decline [8,10]. It is recognized that TSR is controlled by physical–chemical factors, such as total organic carbon content (TOC) or soil porosity (sandy soil), which promotes microbial biomasses and root turnover [11], thereby increasing soil respiration. However, TSR is also affected by abiotic factors such as soil temperature and moisture [10,12,13]. Seasonal variations in TSR vary with plant species, plant phenology, soil fertility [14,15], and soil water content—a pivotal variable in controlling soil respiration [16]. Low and high soil water contents reduce soil respiration by limiting substrate availability and avoiding CO2 transport, respectively [17,18]. TSR also depends on the soil management techniques adopted in a vineyard. Among agricultural practices, compost addition and mineral fertilization, soil tillage, and irrigation regimes can profoundly affect soil carbon (C) emissions, influencing soil organic carbon (SOC) storage [19,20,21,22]. Soil fertilization and organic amendments to Mediterranean soils can increase TSR and, for example, enzyme activities [23].
In particular, the increasing risk of water-deficit stress due to global warming will necessitate increases in vine irrigation for arid and semi-arid regions [20,21,22,23]. There is a need for viticultural systems to adapt to tougher water-saving policies [24] by adopting strategic cultural practices that are able to promote water savings, thereby preserving soil chemical and biochemical fertility and reducing CO2 emissions from vineyard soils. Nevertheless, information regarding the effects of cultural practices such as fertilizer and irrigation management on the components of soil respiration and the underlying microbial community characteristics in vineyard ecosystems remains limited [25]. In particular, long-term continuous measurements of CO2 emissions from vineyard soils are essential for increasing knowledge about the multiple roles played by soil and environmental abiotic factors, as well as those played by the soil microbiome on TSR [26]. Soil CO2 fluxes can be measured by a variety of techniques, and while no single method has been established as a standard [27], chamber techniques have been used to estimate soil respiration for more than eight decades and remain the most commonly used approach [28]. TSR is usually determined over a relatively small area (<1 m2) using a surface chamber [29].
The study aim was to estimate soil respiration as well as its diurnal and seasonal fluctuations and its variability in a rainfed vineyard under two different under-vine soil management schemes: organo-mineral fertilizer versus chemical fertilizer. Knowledge of the seasonal and spatial variability of TSR will allow for a better interpretation and clarification of soil carbon dynamics in vineyards under different fertilization practices, and it is a critical component of global greenhouse gas flux measurements in perennial cropping systems.

2. Materials and Methods

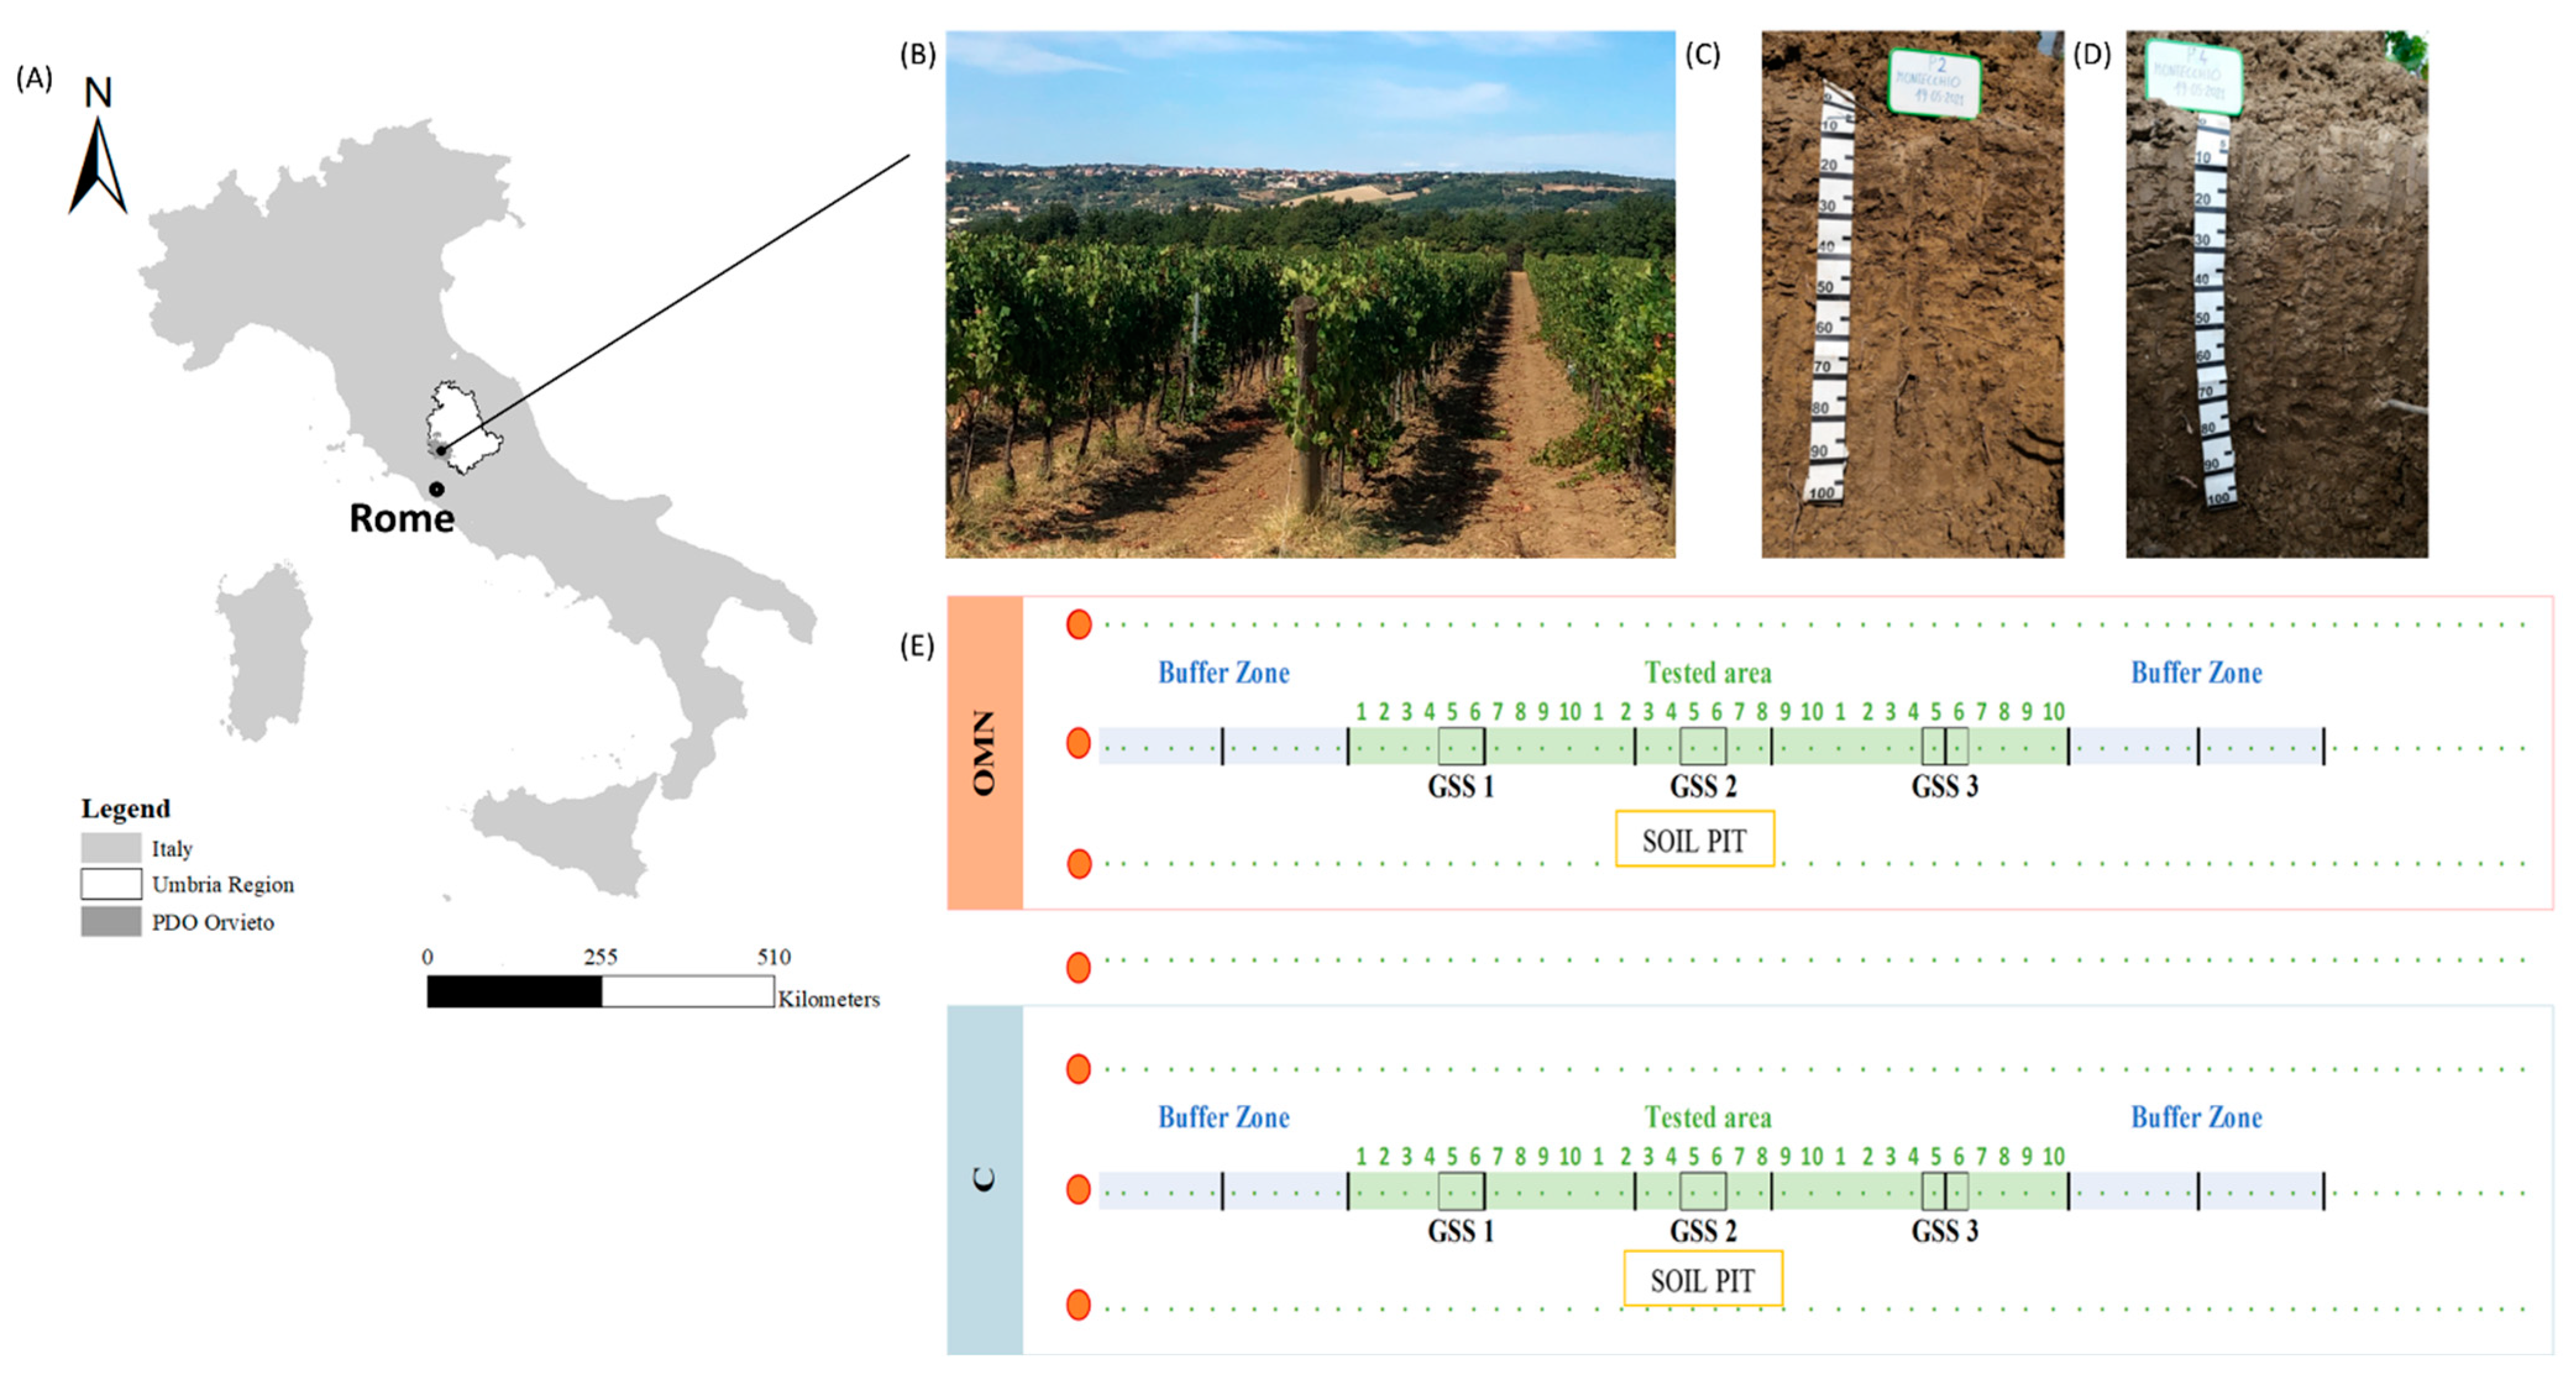
2.1. Study Area Characterization

The study was conducted over two consecutive seasons, namely, 2021 and 2022, in a tested vineyard located in the PDO Orvieto, sub-area Classico (Figure 1A,B). This territory is a historical and classic wine-grape-growing area, where the Tiber River splits the area into two homogeneous sub-areas (the western and eastern sides of the Tiber River) with variable physiographic characteristics and soil types that range from sedimentary to volcanic to alluvial. In particular, the southern sectors (the Montecchio municipality, Umbria Region, Central Italy) where the vineyard is located are mainly characterized by sedimentary soil [29]. This study area is also sensitive to climate alteration [30]; in particular, a progressive warming has been demonstrated, with alterations in precipitation patterns toward more intense precipitation.
The tested vineyard was planted in 2000 with Chardonnay grafted on V. Berlandieri × V. Rupestris rootstock (1103 P) and trained in a cordon vine-training system at a distance of 0.8 m × 3 m off the ground (Figure 1B,C). The soil management practices employed were those that are standard in conventional viticulture, in particular, the control of the grasses based on reduced soil tillage (combined harrows) from flowering until harvesting.

2.2. Experimental Design

The experiment had two treatments: organo-mineral nutrition (OMN) and chemical fertilizer (C, control monitoring and a common soil fertilization used by the winegrower) (Figure 1E). Each treatment was applied on three consecutive rows of 70 vines (cv Chardonnay).
The chemical fertilizer (treatment C) used Nitrophoska (12% nitrogen) spread at 125 kg·ha−1, and the application was fractionated in two operations from post-harvest to full flowering. The organo-mineral fertilizer was applied in the spring using 90 g of AGROFERT (10-5-15) per vine and again in autumn using 90 g of BELFRUTTO fertilizer (5-10-15) per vine (Figures S4 and S5). The treatments were applied to all three rows in order to obtain homogenic vegetative, microclimate, and soil conditions, but only the middle row was used for the soil surveying. In order to avoid the edge border, two buffer areas of 20 vines were considered in the middle row surrounding a core area of 30 vines where the ground soil sensors (GSS), including the soil respiration chambers, were placed for analyzing the total soil respiration (TSR) and where the soil pits (Figure 1C,D) were located. The treatments were implemented for two consecutive seasons (2021 and 2022) in order to analyze their impacts on the total soil respiration (TSR) at the seasonal and daily scales as indicators of soil microbial activity and as critical links in carbon cycling and the formation of soil organic matter [31,32].

2.3. Soil Surveying

Soil surveying was conducted using two soil pits (P1 for the OMN treatment and P2 for the C treatment) with dimensions of 0.50 × 1.50 × 2 m in size, and they were located in the middle rows near a core area of 30 vines for both treatments and used for the soil microscale traits assessment (Figure 1C,D). The profiles were described, photographed, and classified according to the international soil classification system [33,34]. Soil samples of each of the soil horizons were subjected to analysis to determine their physical, chemical, and hydrological properties [35], such as soil texture, according to the standard methodology proposed by the Soil Survey Staff (1998) [36]; soil pH, determined in deionized water with a glass electrode [37]; organic nitrogen reserves (total nitrogen—TN g/kg), measured using Kjeldahl’s procedure; apparent electrical conductivity (ECa—dS/m); soil available phosphorous (P—mg/kg); and soil organic matter (g/100 g) according to the FAO standard operating procedures. In addition, the following data were determined: the effective cation exchange capacity (CEC) according to the ISO 11260:2018 standard procedure [38]; the four most abundant exchangeable cations in the soil, namely, calcium (Ca—meq/100 g), magnesium (Mg—meq/100 g), potassium (K—meq/100 g), and sodium (Na—meq/100 g), according to Pleysier and Juo (1980) [39]; and the ratio C/N, which was computed considering that the soil organic matter (SOM) is composed by the stoichiometric percentage of 58% carbon (C = SOM (%) × 1.72) [40]. Undisturbed samples were used for determining the pF curves over the full range of Pf 0–4.2 because of the major influences of both pore size distribution and soil structure on moisture retention (hydrological constants) by a pressure membrane apparatus [41]. In the range of pF 3.0 to 4.2 (equivalent to pressures of 1.0 to 15.5 bar), soil water is primarily retained in very small pores, and so soil water retention is dominantly influenced by soil texture. The pF curves were plotted using the soil moisture water contents (volume %) of the filled pores at a certain matric potential (Kpa). Table 1 shows the matrix potential points at which the water contents were determined.
The points expressed in pF from 0 to 100 were determined in a Stackman’s tank from 2.5 to 4.2 in a Richards’ pressure apparatus [39]. Next, the sample was dried in an oven at 105 °C for determination of the bulk density. The point pF 4.2 corresponded to the soil moisture at the point of wilting.
The gravimetric moisture percentages were determined to be 33 kPa for the establishment of the field capacity (FC) and 1500 kPa for the permanent wilting point (PWP). The available water capacity (AWC) [39] was calculated according to the following equation:
AWC = FC − PWP.

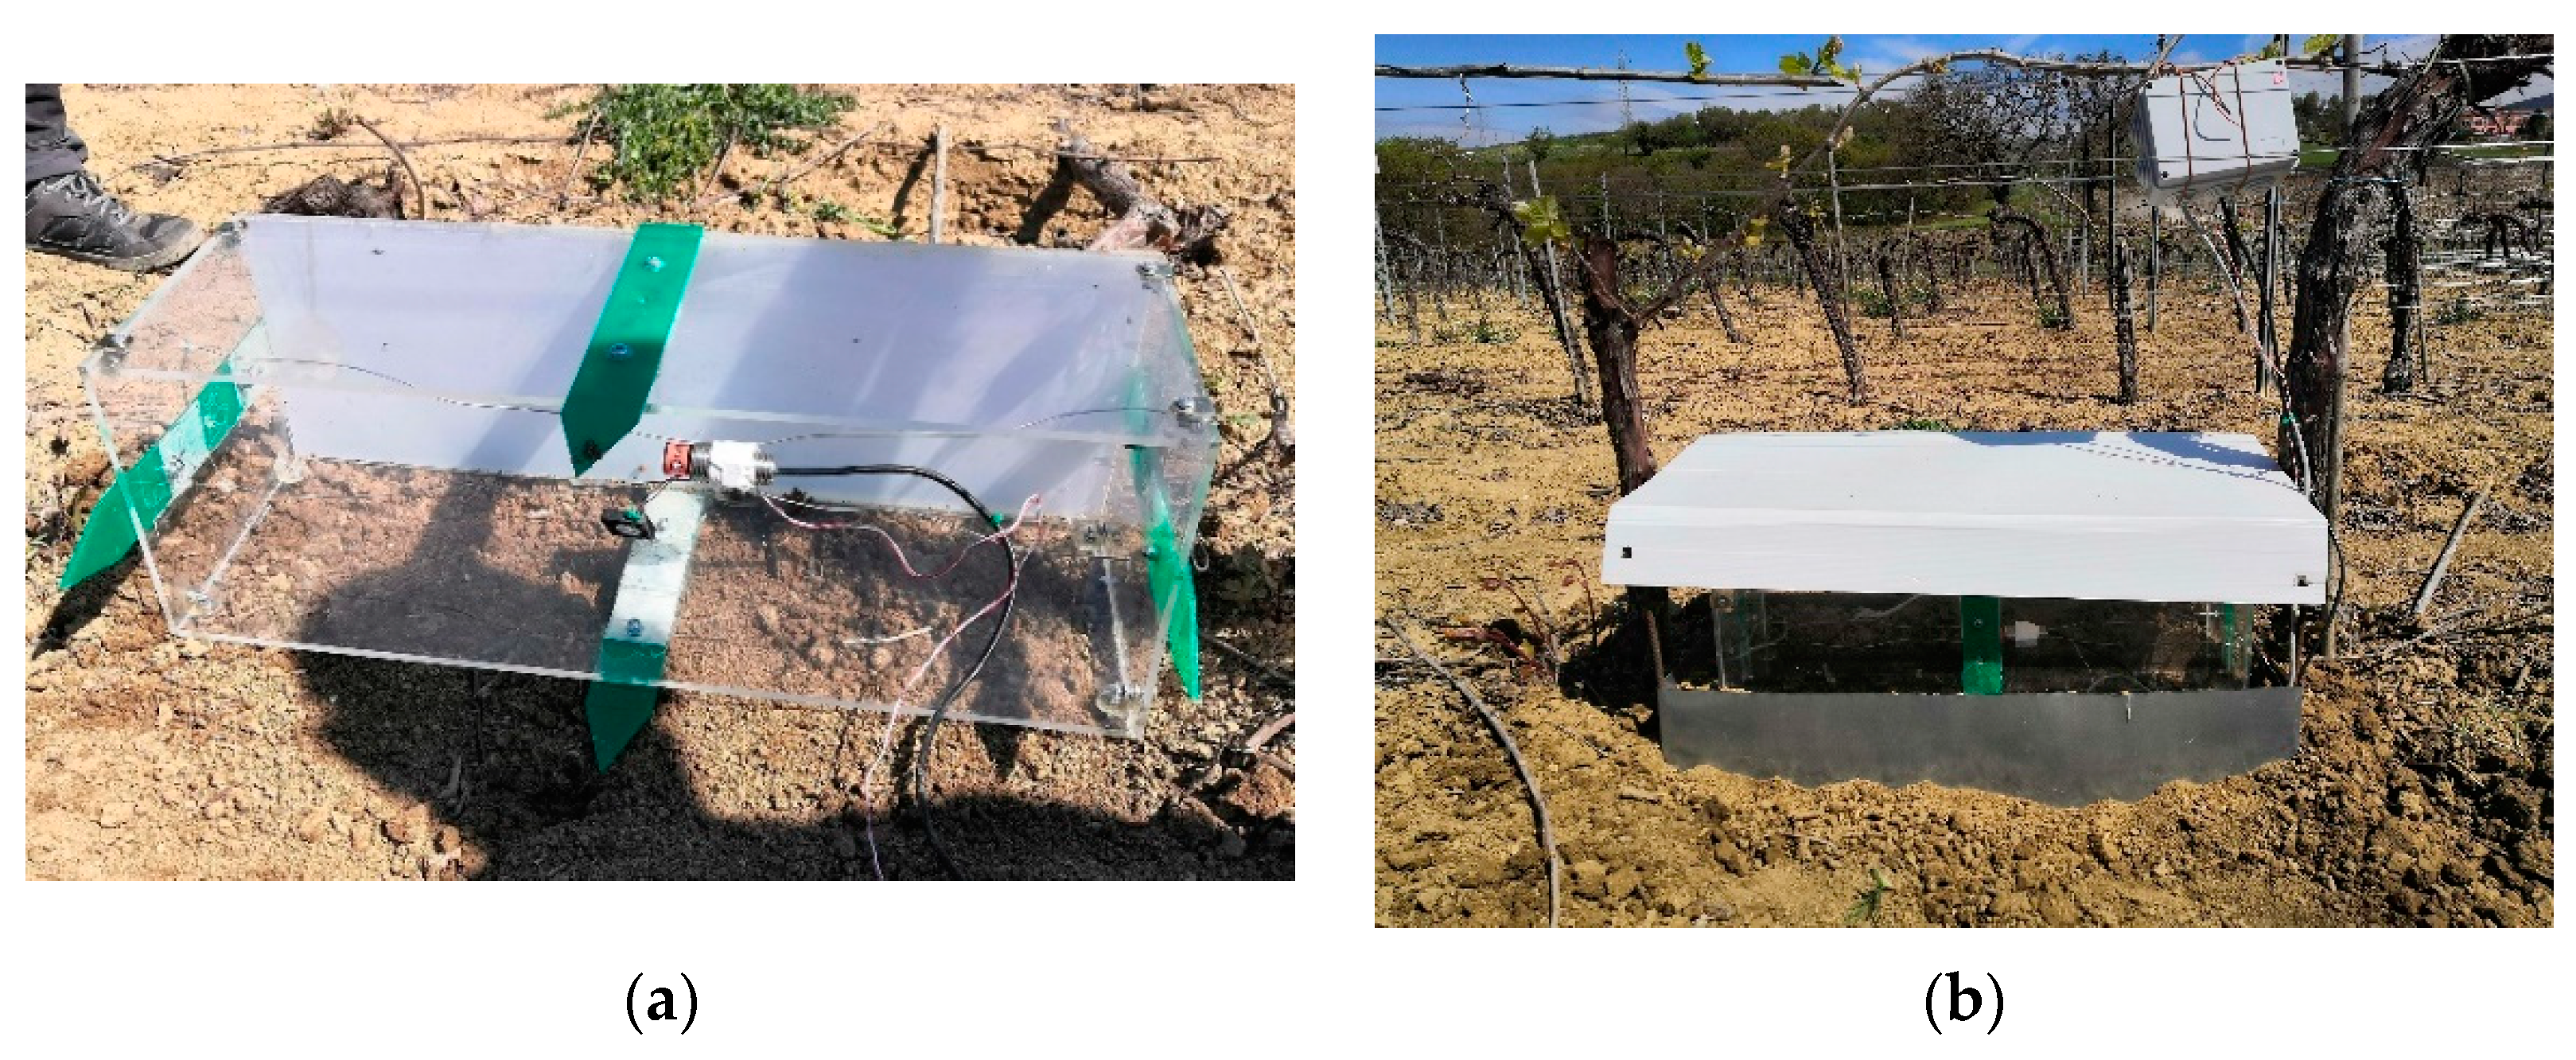
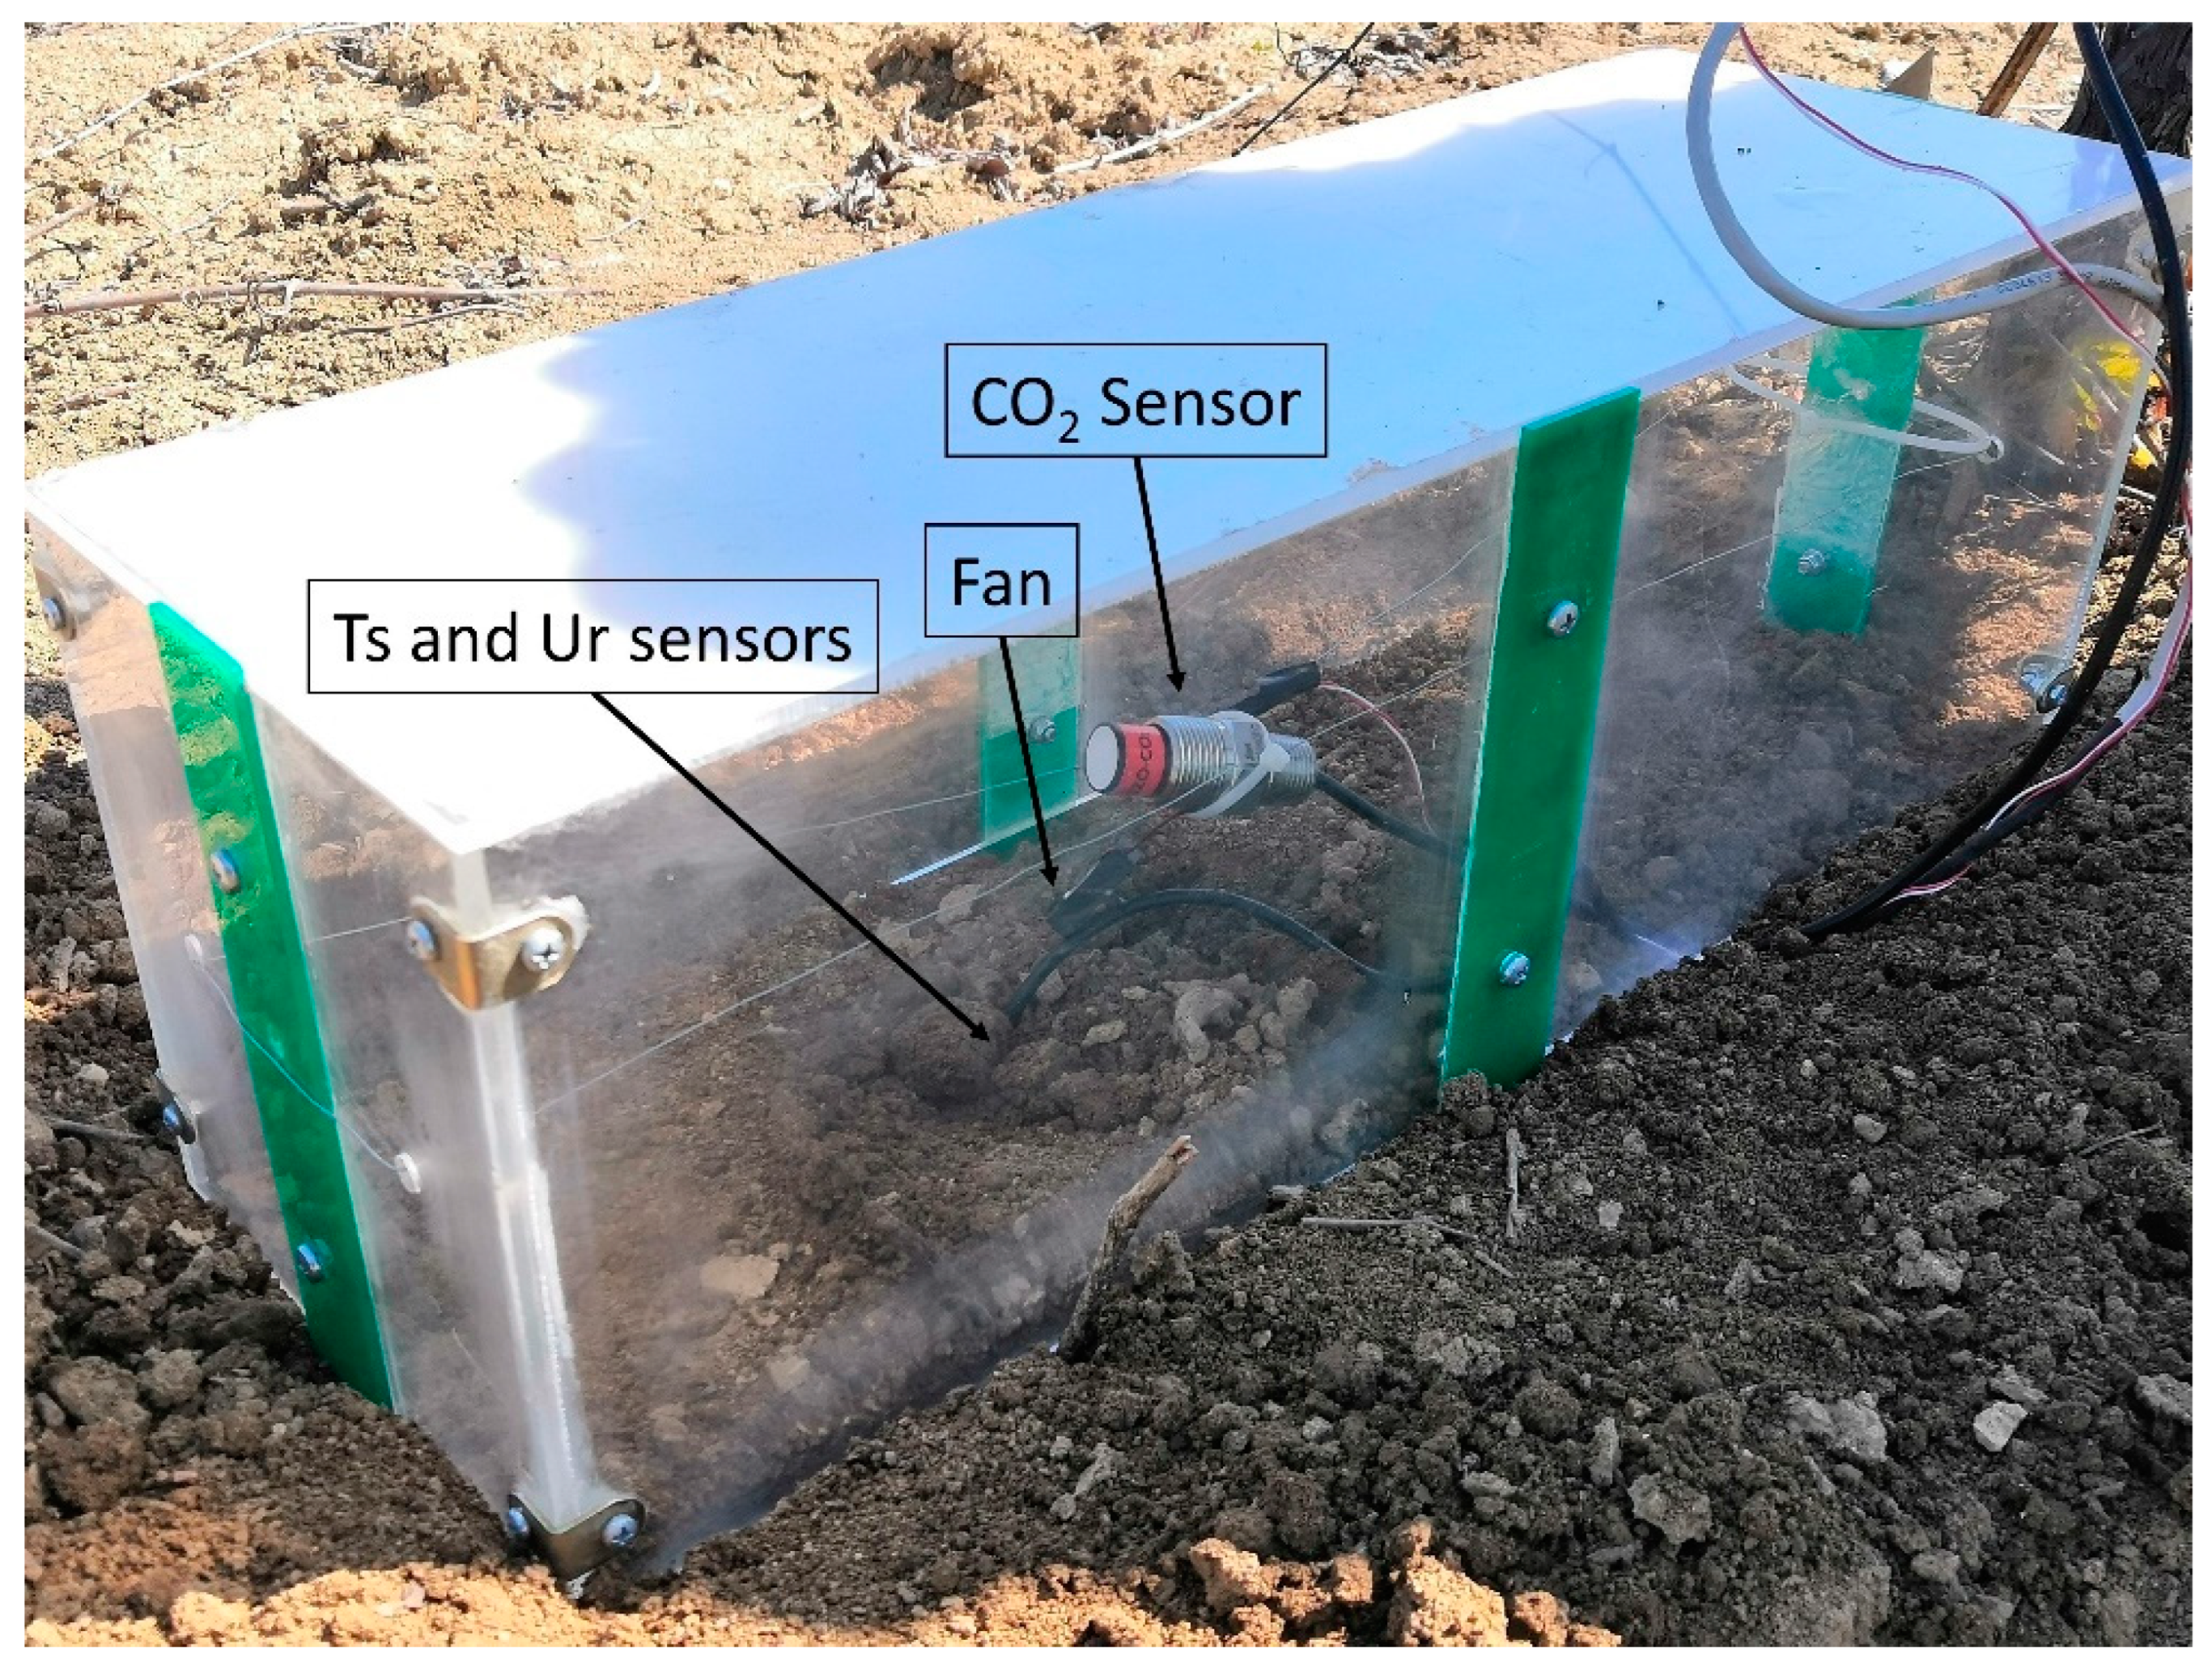
2.4. Soil Respiration Determination by Chamber Prototype

2.4.1. Prototypes for Continuous TSR Assessment

The under-vine soil respiration chamber prototypes (SRCps) (n.6) were placed in plexiglass and had dimensions of 0.60 × 0.20 × 0.20 m (Figure 2a) [41,42], and each had an area of 0.12 m2 and a volume of 0.024 m3. The bottoms of the chambers were pushed into the soil in the under-vine area. Each side of the box had a system (Figure 2a) that entered 0.10 m into the ground in order to hold the box in place and prevent CO2 from leaking out. Each SRCp had two holes in the narrower side walls that allowed CO2 to be dispersed after each measurement with the help of a small, automatically activated fan. During the season, in order to protect the sensors inside each SRCps from direct sunlight, each SRCp was covered with a protective structure (Figure 2b) to protect the sensors from direct sunlight, as well as metal side bulkheads designed to protect the chambers from inter-row machine impacts. In particular, the interspaces between each SRCps and the bulkheads were filled with soil (Figure 2b) in order to create layer buffers to prevent possible effects of inter-row soil management practices that could influence the CO2 determination and cause displacement and consequently compromise the data accuracy (such as possible CO2 leakage).

2.4.2. Sensoristics

Each SRCp was equipped with sensors for detecting the integrated temperature (Ts) and relative humidity (Ur) of the soil at depths of 0 and 10 m (Adafruit SHT10) [43], as well as an integrated sensor for detecting CO2 (EZO-CO2tm) [44] (Figures S2 and S3) that was located at 10 cm from the soil surface, together with a fan (Figure 3) that was used to homogenize the air before the CO2 measurement and allow air renewal after each measurement. In addition, each SRCp was equipped with a solar panel used to charge the rechargeable 12 v Li-ion battery pack that was included in the prototypes. This arrangement allowed for maintaining the batteries at optimum charge levels throughout the experimentation period and for collecting data at nighttime.
Finally, a communication module allowed for data connection to the mobile communication network and for transferring the data to the cloud platform for data processing.
During the two seasons (2021 and 2022), from the flowering to the berry ripening growing phenological stages, the soil moisture and temperature parameters were monitored outside the chamber prototypes (using the same sensor types) for the total soil respiration (TSR, µmol CO2∙m−2∙s−1) and used according to Rochette and Hutchinson (2005) [27] for correcting the pressure effects induced by the chamber’s air temperature.

2.4.3. Installation of SRCps, Data Acquisition, and Processing

At the beginning of the flowering stage (BBCH 060, which, in central Italy, corresponds to May), the six SRCps were placed under-vine. Three were located in the vines under common fertilization (C, the farming fertilization protocols) and three were under-vine under OMN management. Then, at pre-harvest, the six boxes were removed to facilitate the passage of the mechanical harvester during harvest, and they were relocated soon after during post-harvest and finally removed at the end of each of the studied seasons (October 2021 and 2022).
The data were collected and transmitted hourly during the seasons. The data processing was concerned with the following: (i) the conversion of CO2 measurements (ppm) to µmol/(m2s) and (ii) the relative humidity values expressed in percentages and data-normalized according Rochette and Hutchinson (2005) [27] using the following formula:
(Xn − Xmin)/(Xmax − Xmin).
Data from the three prototype chambers of each of the two agronomic management treatments were processed into seasonal averages, and the most significant daily intervals were determined. The daily interval selected was the time slot corresponding to sunrise (05:00–06:00). The data were plotted according to the following BBCH phenological stages: BBCH 65–71: full flowering—fruit set; BBCH 71–79: fruit set—advanced grape cluster development; and BBCH 81–89: veraison—fully ripe fruit and berries ready for harvest.

2.4.4. Statistical Analysis

The raw time series data from the soil respiration chambers were available at a temporal resolution of one hour for all variables considered in this study. The data were pre-processed for various analyses in our study. Grubbs’ test was used to detect a single outlier in a one-hour temporal resolution dataset. Then, the dataset was used to calculate the mean daily values for all studied variables. The daily time series were standardized to detect extreme events and to remove possible outliers. To analyze how the CO2 effluxes varied with time (the 2021 and 2022 seasons) and treatment (C and OMN), we used generalized linear mixed-effects models (GLMMs).
Linear regression analyses were also performed to identify the effects of the environmental variables—soil temperature and moisture—on the TSR. Correlations among these factors were calculated with Pearson correlation coefficients. A Pearson correlation analysis among soil parameters was performed, and principal component analysis (PCA) was carried out based on the correlation matrix. This method is commonly used to investigate variability in geochemical datasets, and it was applied in order to identify correlations among the parameters and to understand the role of each variable in each soil profile.
All statistical analyses were performed using XLSTAT software (trial version—accessed in 12 December 2022).

3. Results

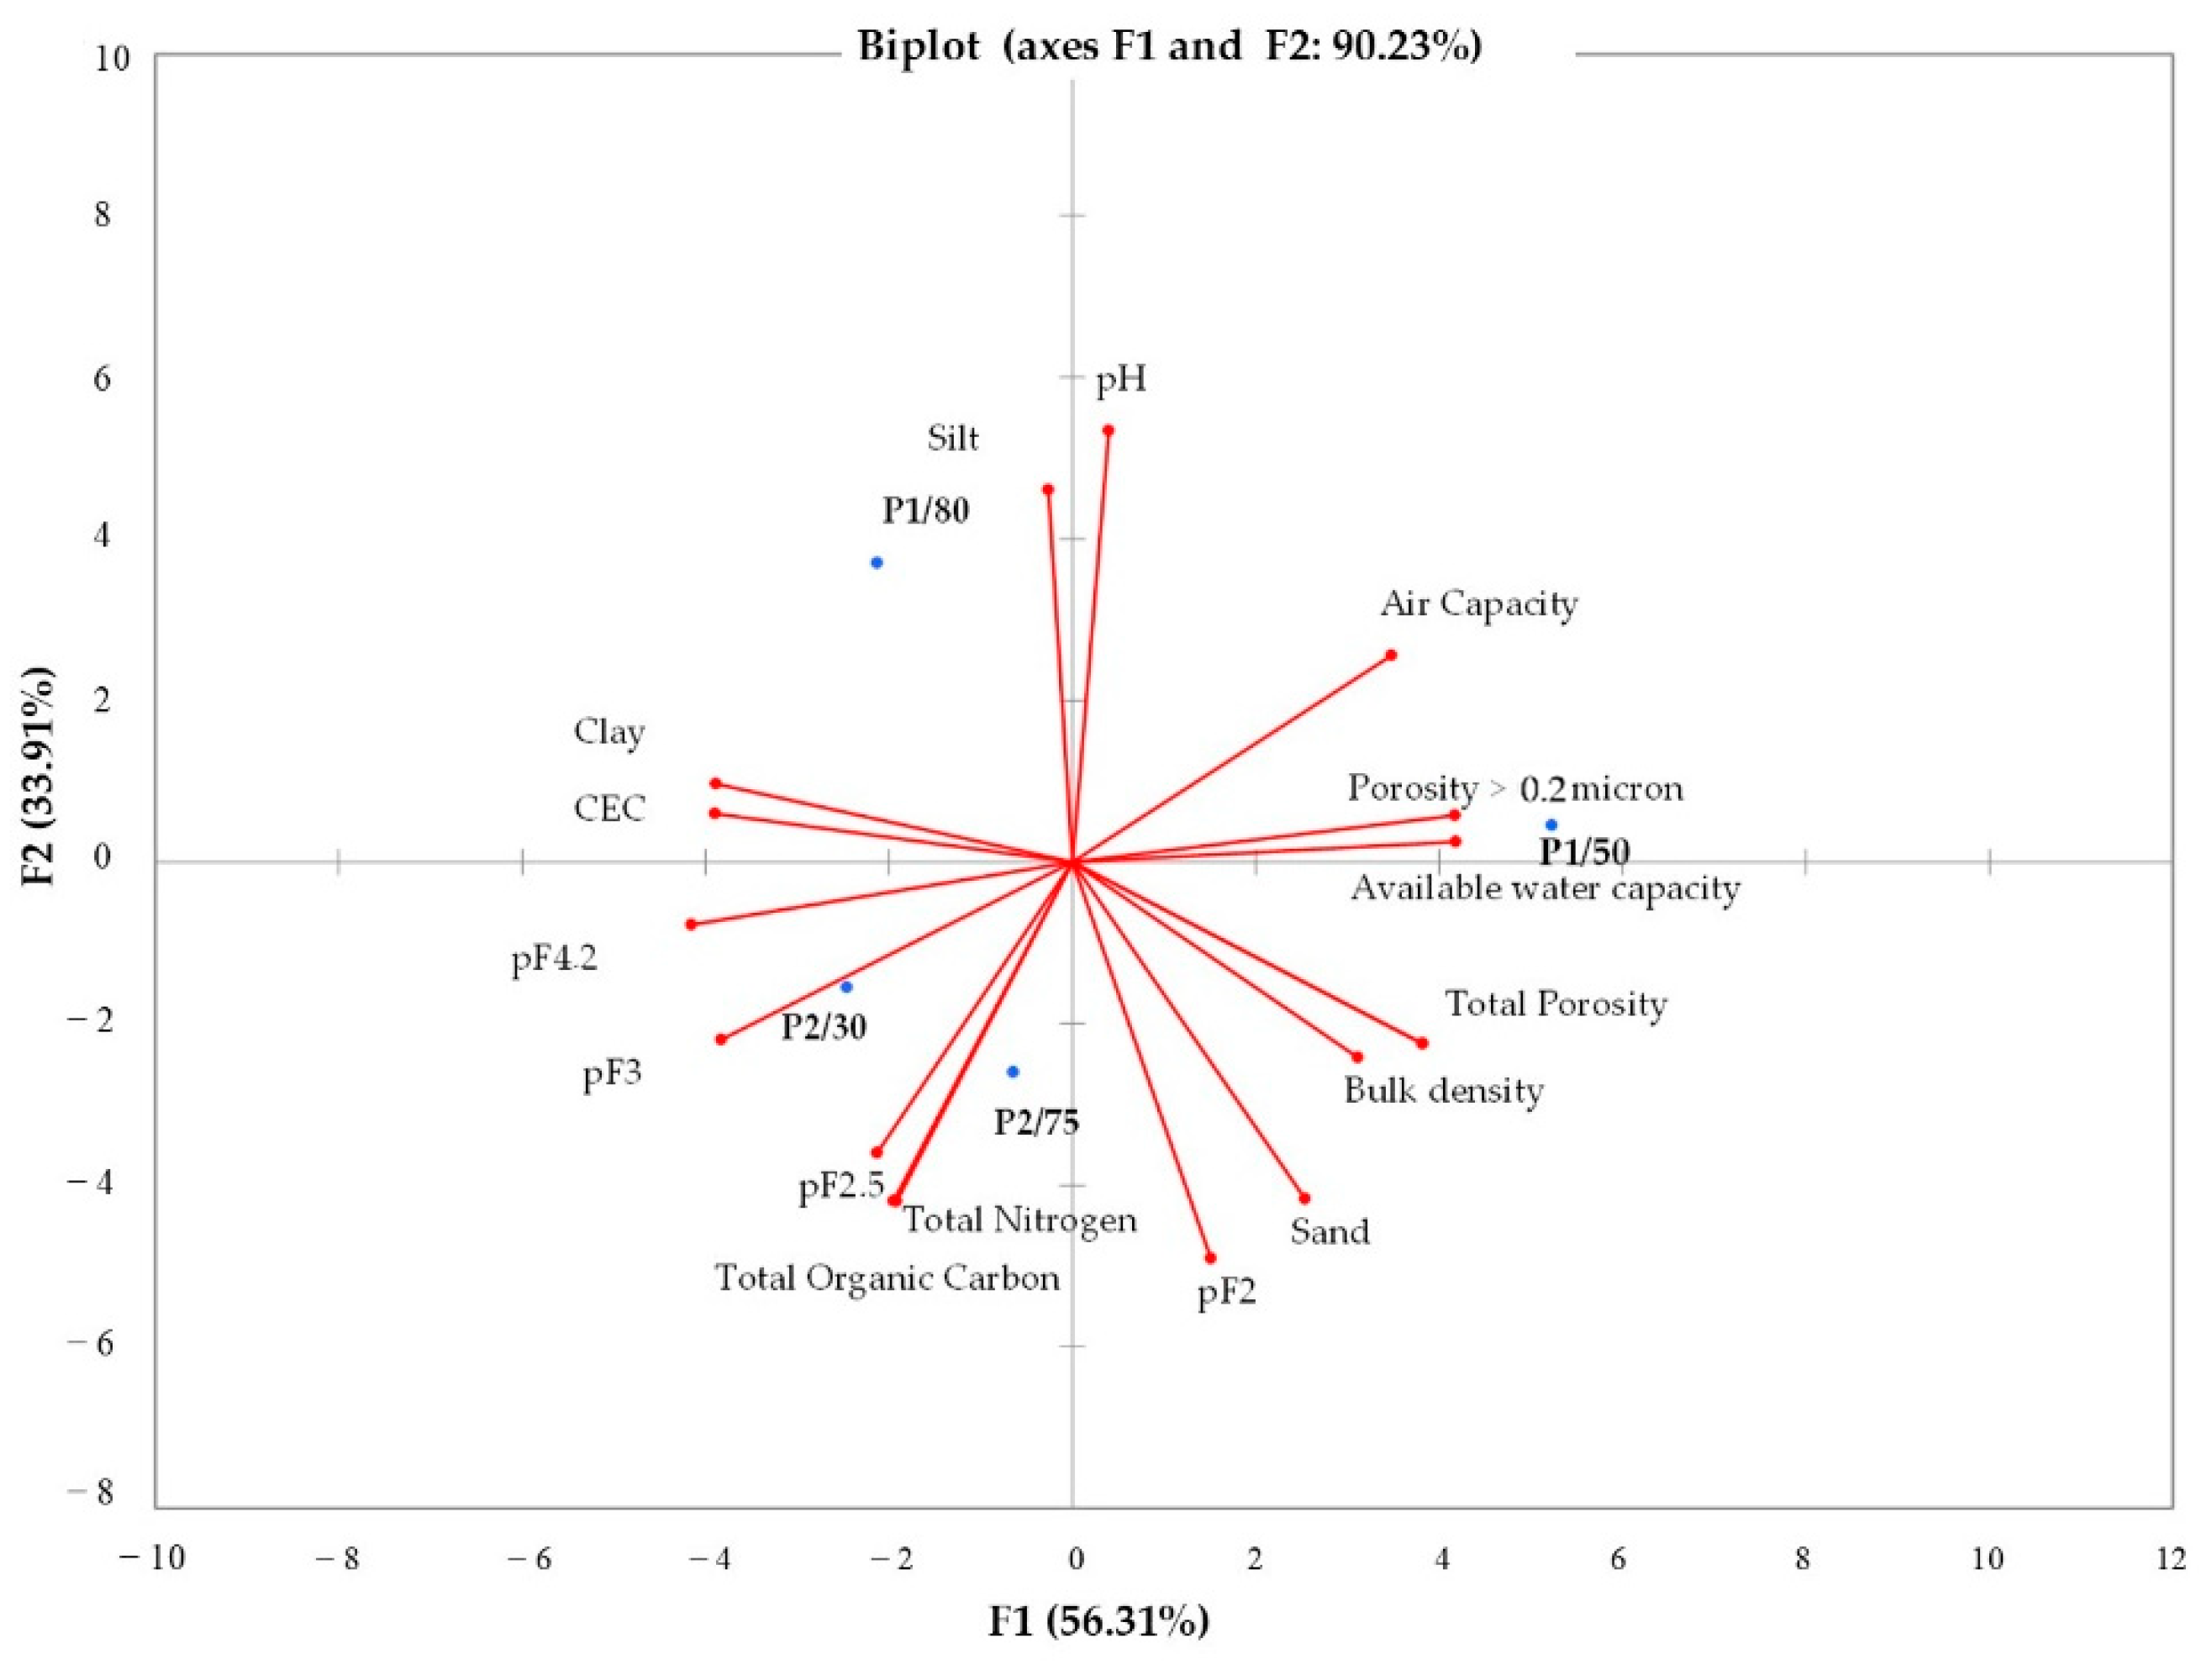
3.1. Soil Characterization

The soil profiles (P1 and P2) were classified as type Ap-Bw-BC (Ap, plowed A horizon; Bw, weathered B horizon; and BC, B horizon, with only sesquioxides and a dense C horizon) or deep and moderately evolved, and both of them were classifiable as inceptisols and calcaric cambisols. The soil texture for both profiles (Table 2) was medium clay-loam, with CEC values that ranged from 20.35 to 29.98 meq/100 g and SOC contents (Table 3) that were lower in the top soil of the P1 profile (0.66%) than they were in the P2 profile (1.25%).
Regarding the soil hydrological traits, both profiles showed a mean total porosity of 45%.
At pF 2 (equivalent to the mm head of water per dm of soil thickness), the values corresponded to the storage capacity of the groundwater and/or the perched water soil humidity among the soil profiles, and these values were similar. At pF 2.5, which conventionally represents the field capacity or the amount of water that the soil can hold against gravity, P1 showed lower values at all considered depths compared with P2. The moisture regimes of the soil profiles decreased, with the permanent wilting point reached at pF 4.2 for the value of the water content (vol %), which was 20% for the top soil of P1 (a 0.50 m depth) and 24.5% for the top soil of P2 (a 0.30 m depth) (Table 4). The AWC values and porosity at 0.2 microns were greater in the P1 topsoil than in the other samples.
Statistically significant correlations (Pearson’s coefficients) were found between the porosity (>0.2 microns) and pF 3, and at pF 4.2 and AWC (Table 5), significant correlations were found between the clay and the CeC, as well as between the SOC and the TN. Additionally, a multivariate statistical analysis was carried out using principal component analysis (PCA) methods that estimated the independent and linear combinations of the original variables. The first component (F1) accounted for 56.3% of the variance in the data, and the subsequent PC (F2) accounted for 33.9%; taken together, these represented 90.2% of the cumulative variance. In particular, among the loading factors, the F1 axis had a strong positive loading for saturation (0.827), pF 3 (0.831), and pF4.2 (0.977), as well as available water capacity (AWC) (0.991), air capacity (0.685), total porosity (tp) (0.827), porosity greater than 0.2 microns (0.987), bulk density (BD) (0.549), and CEC (0.859). The correlation biplot (Figure 4) showed the loading factors and score distributions according to F1 and F2. The P1 profiles were split between the upper layer and the bottom one (P1/50 and P1/80, respectively), while the P2 profiles were clustered in the same quadrant (quadrant III, shown in Figure 4). P1/50, the topsoil of the P1 profile, showed a greater correlation with the AWC, and its porosity was greater than 0.2 microns.

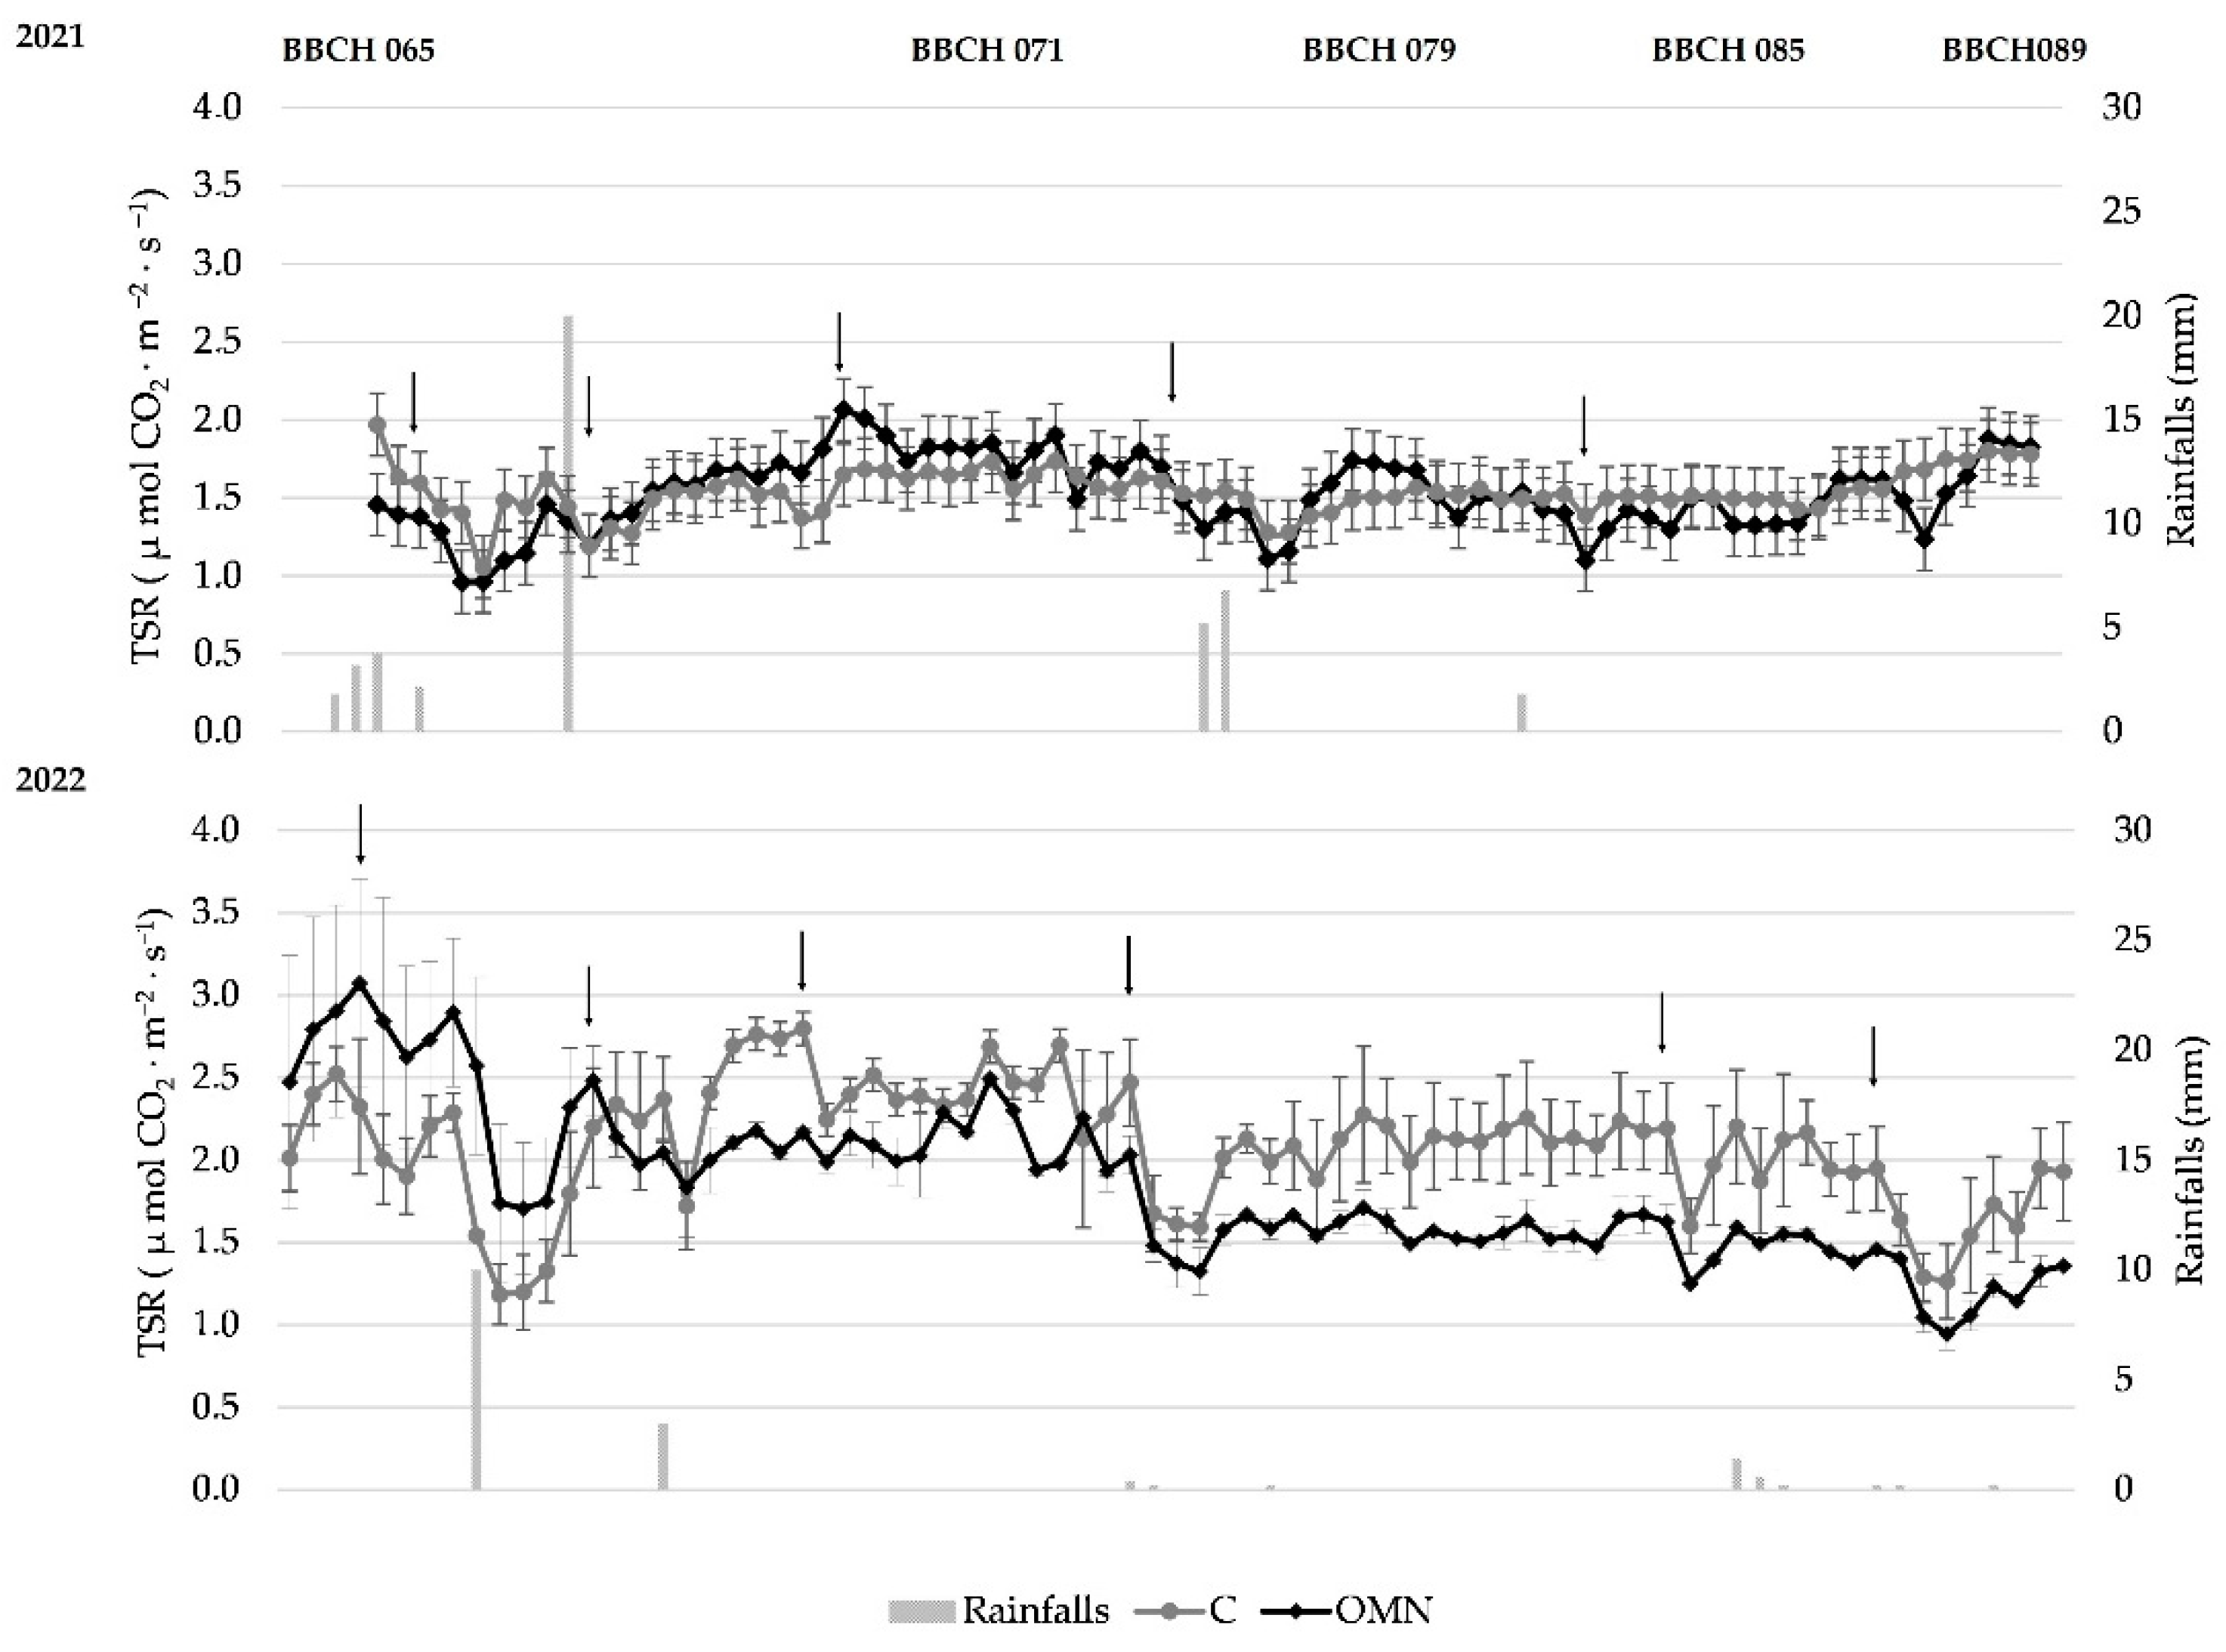
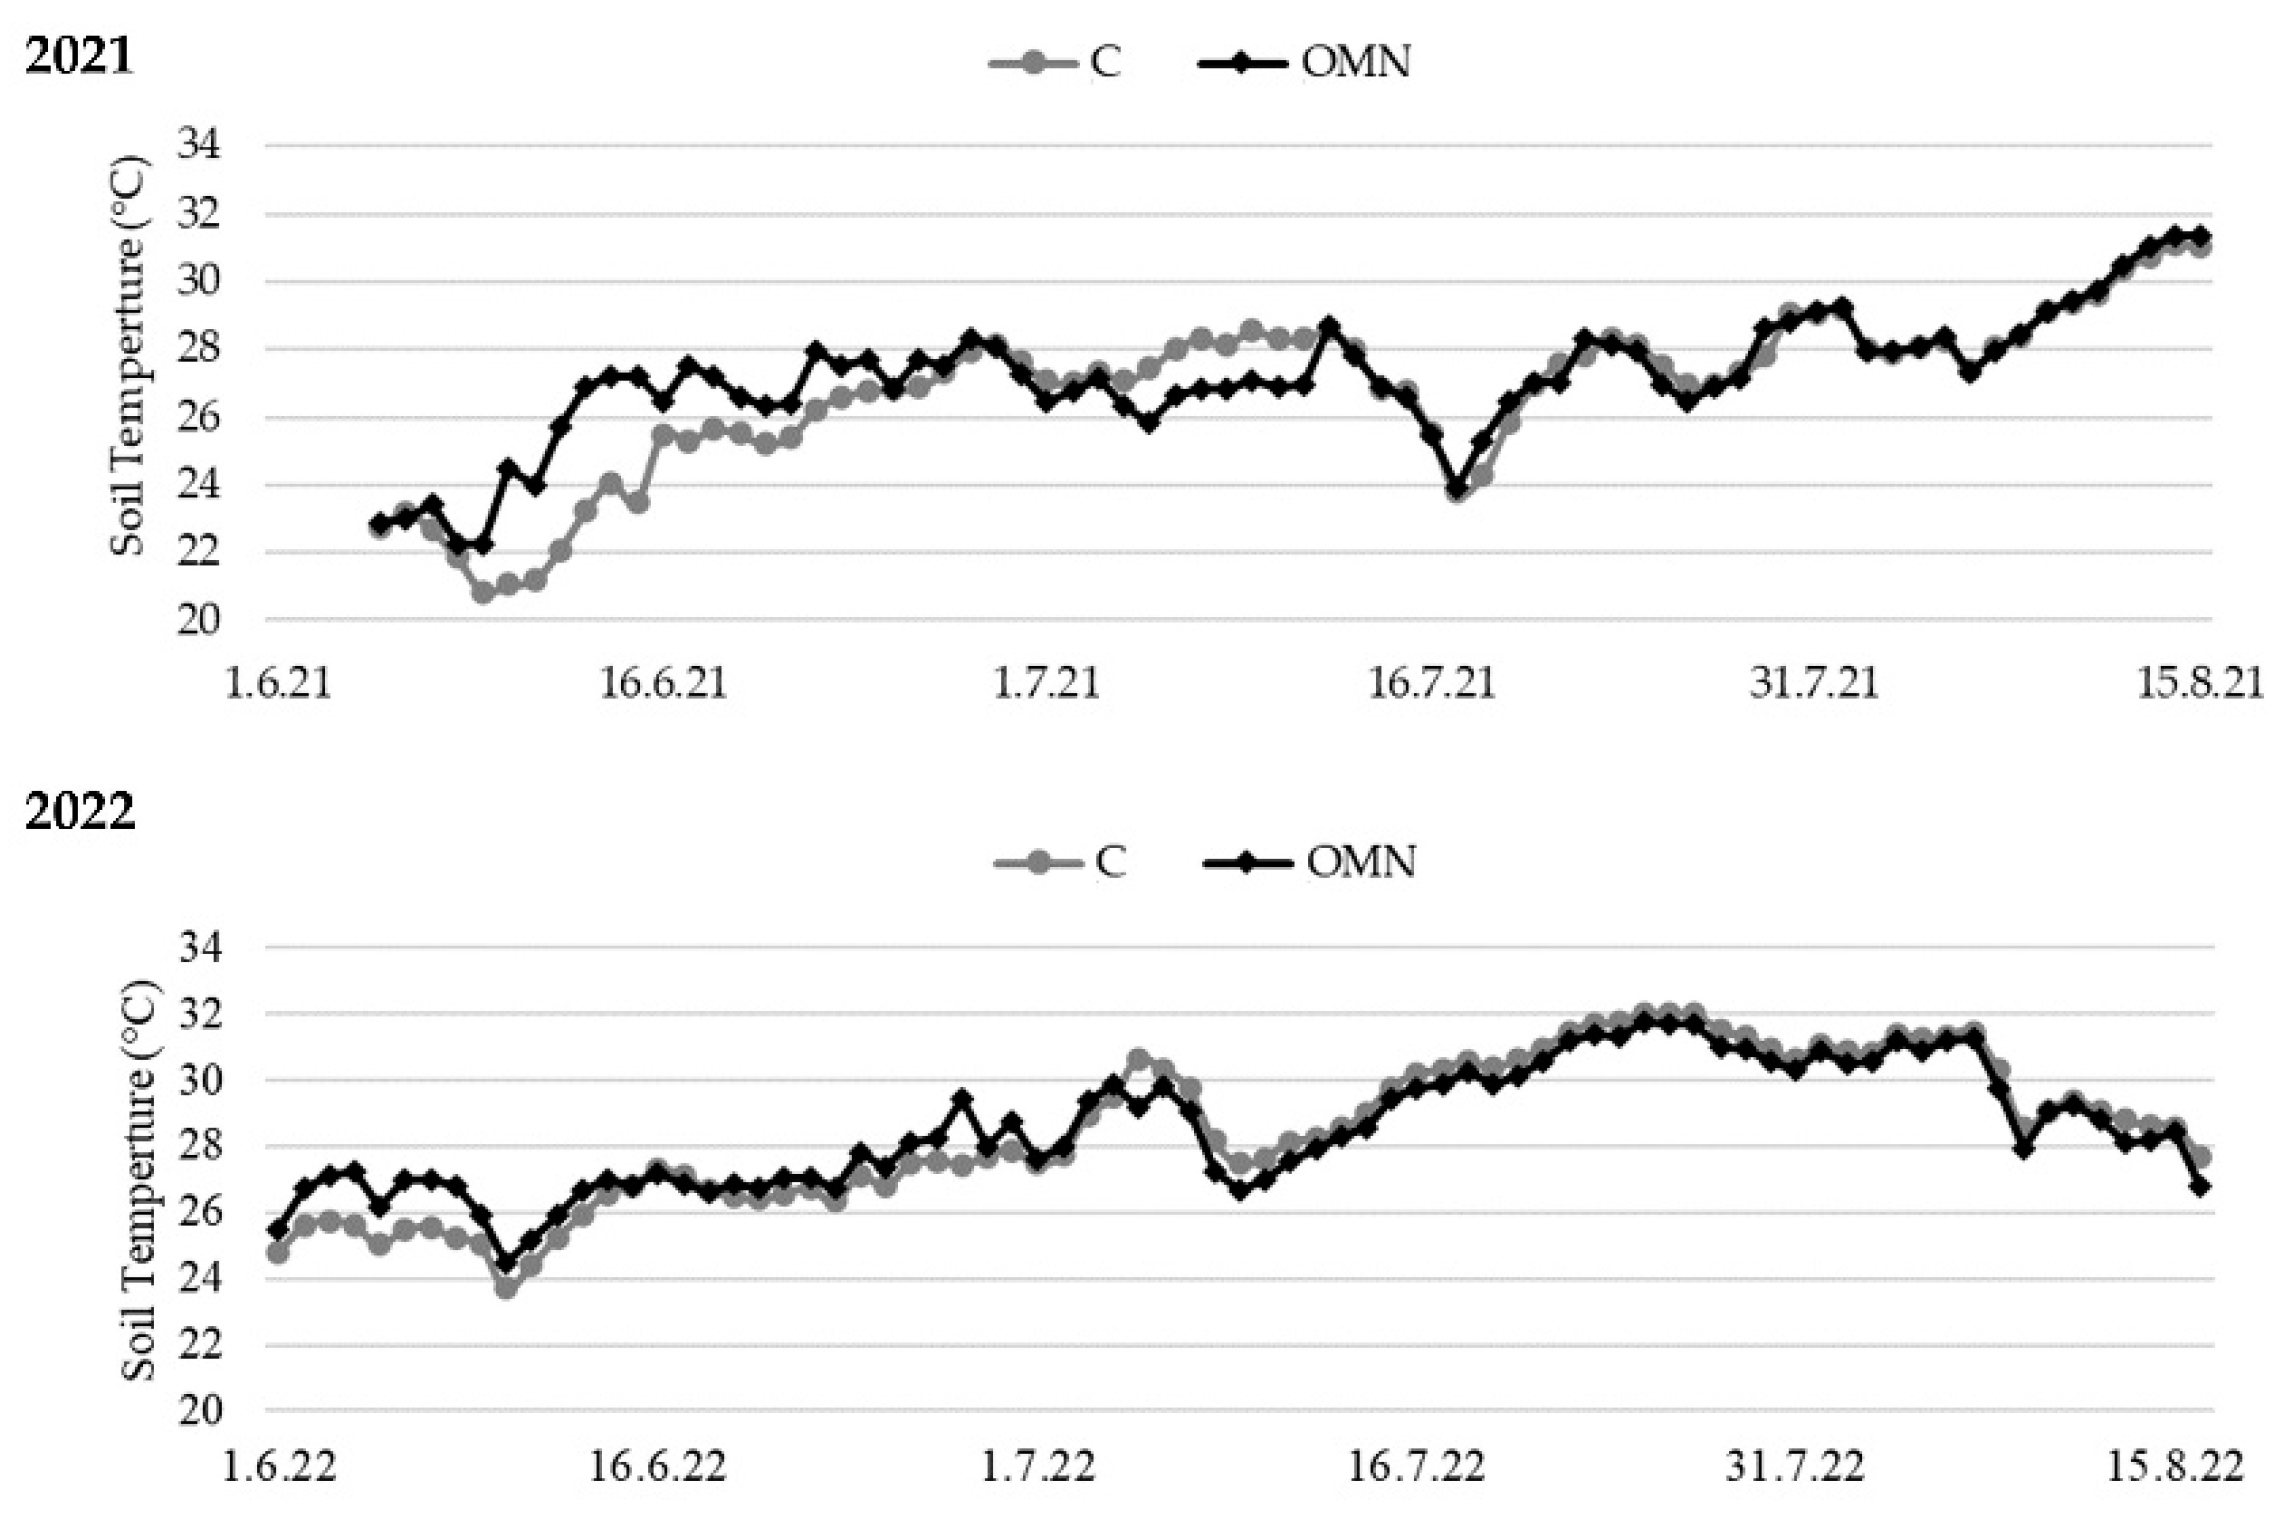
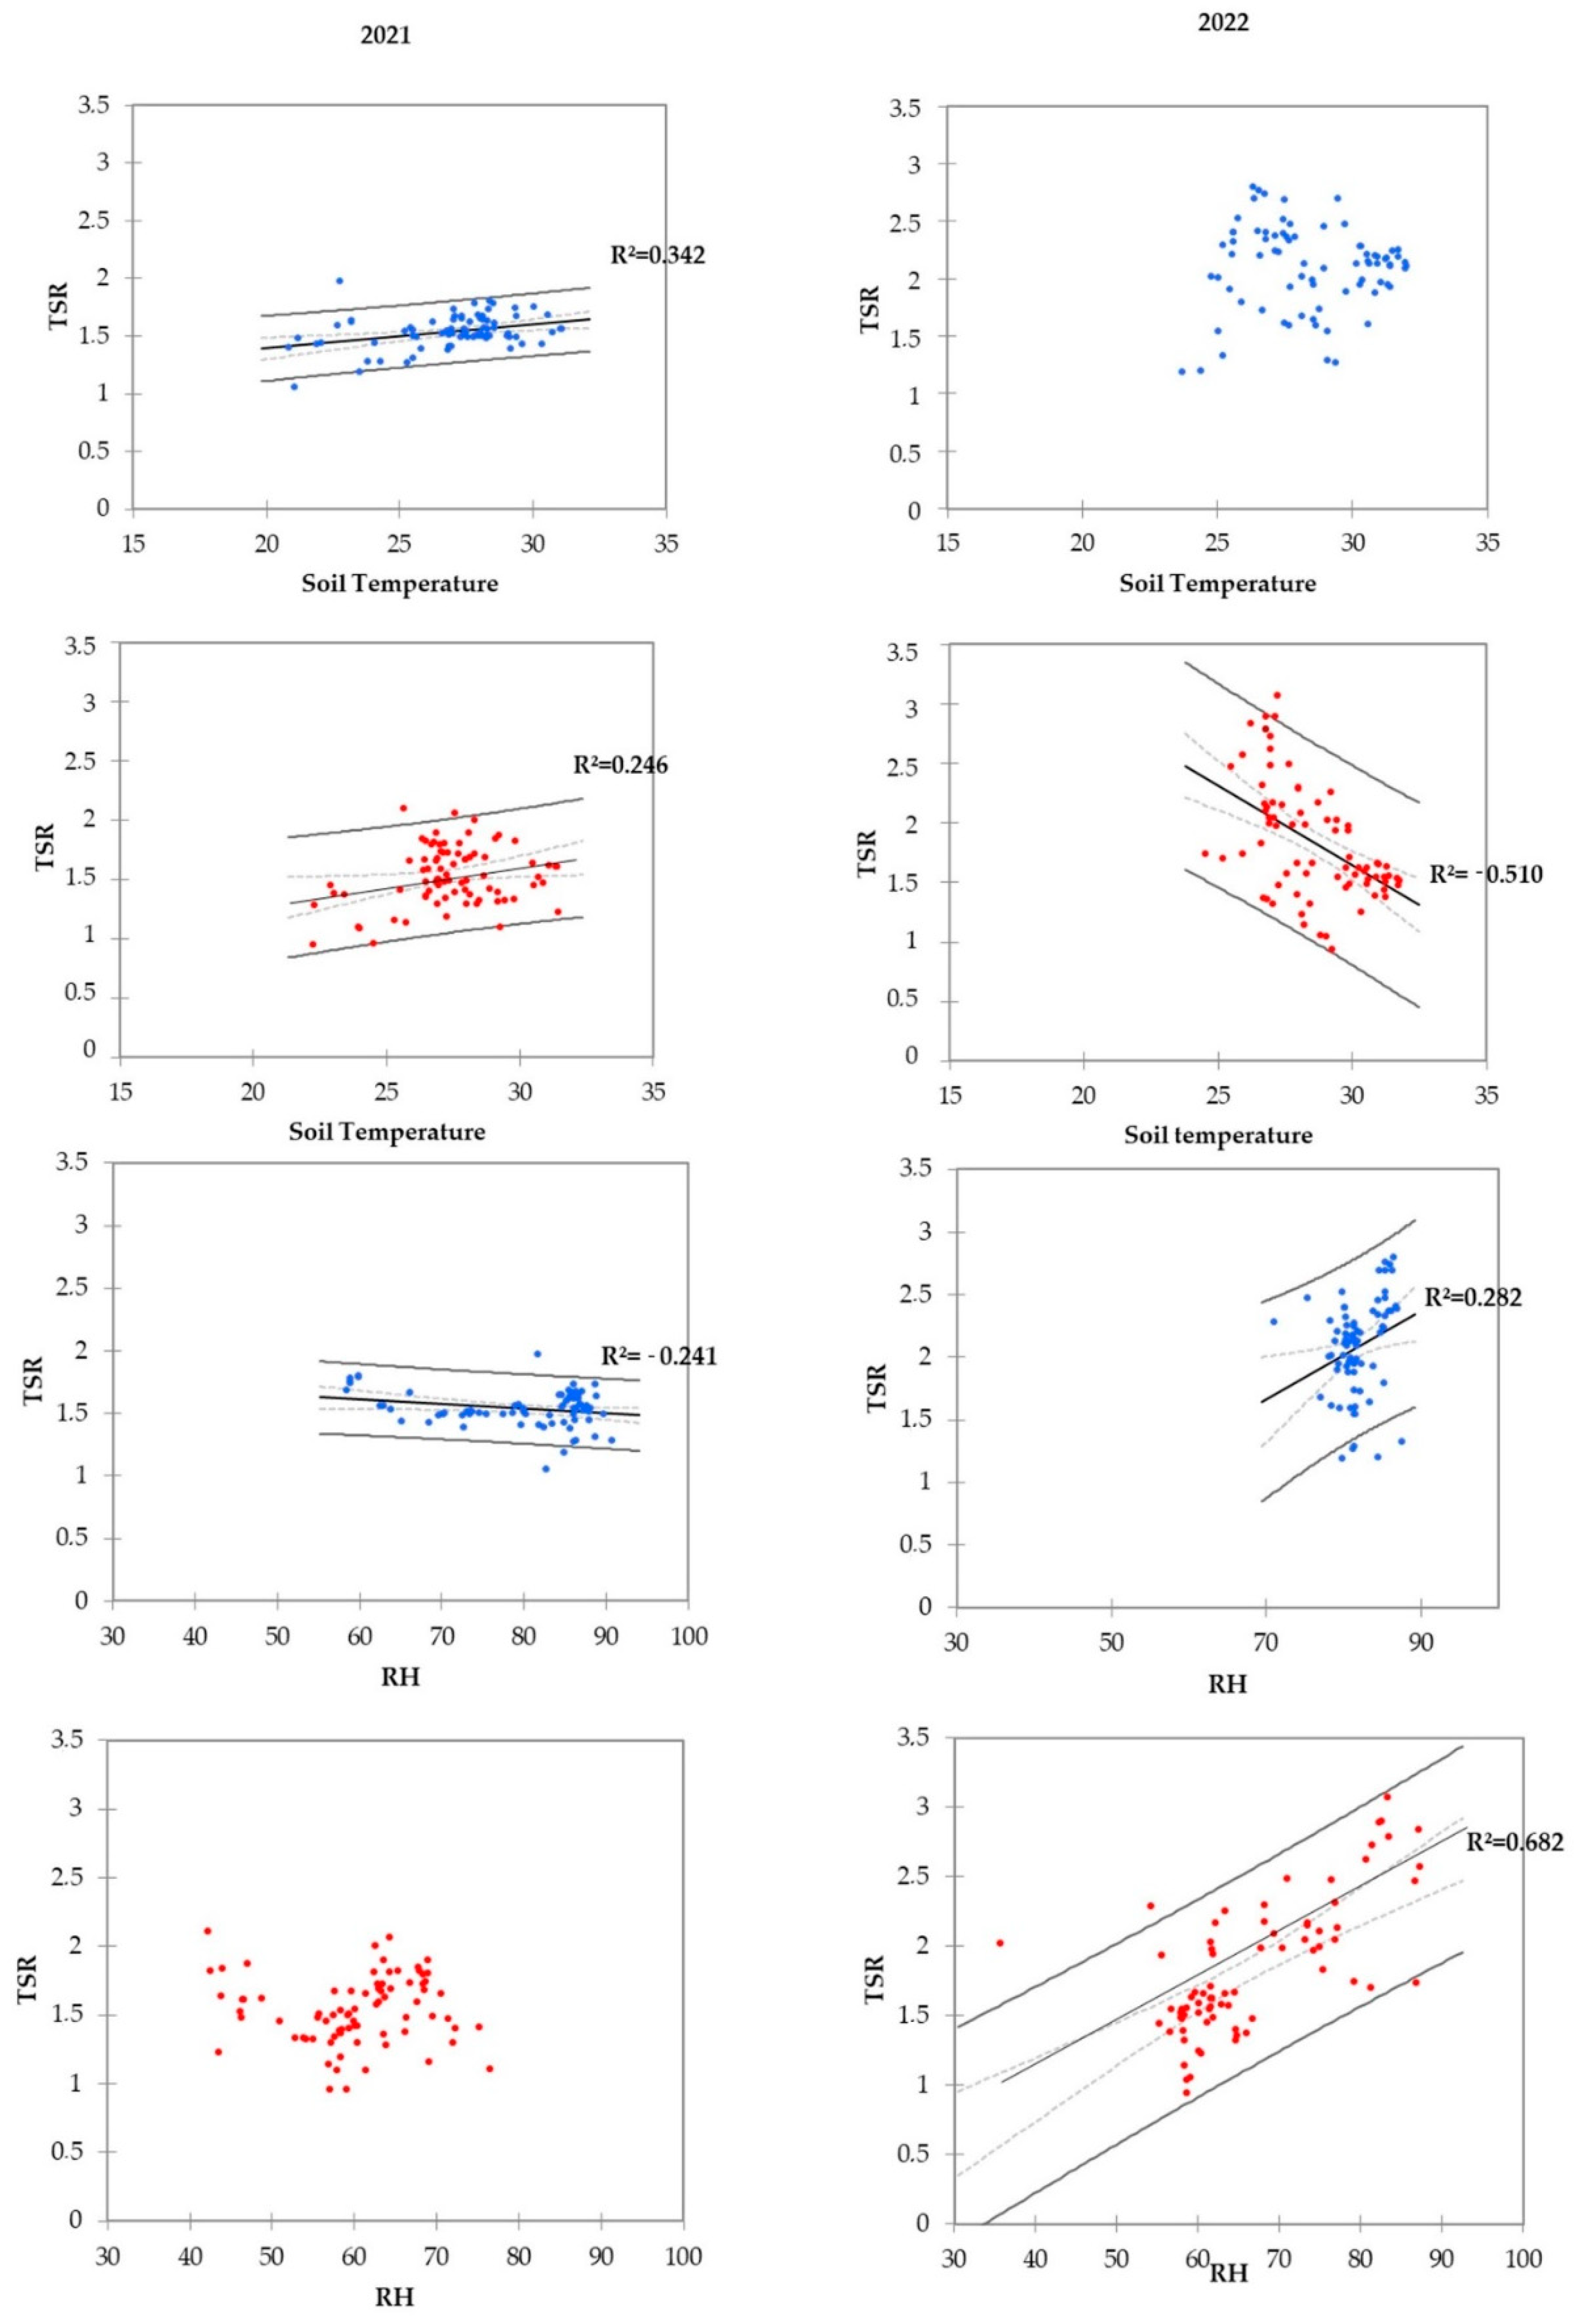
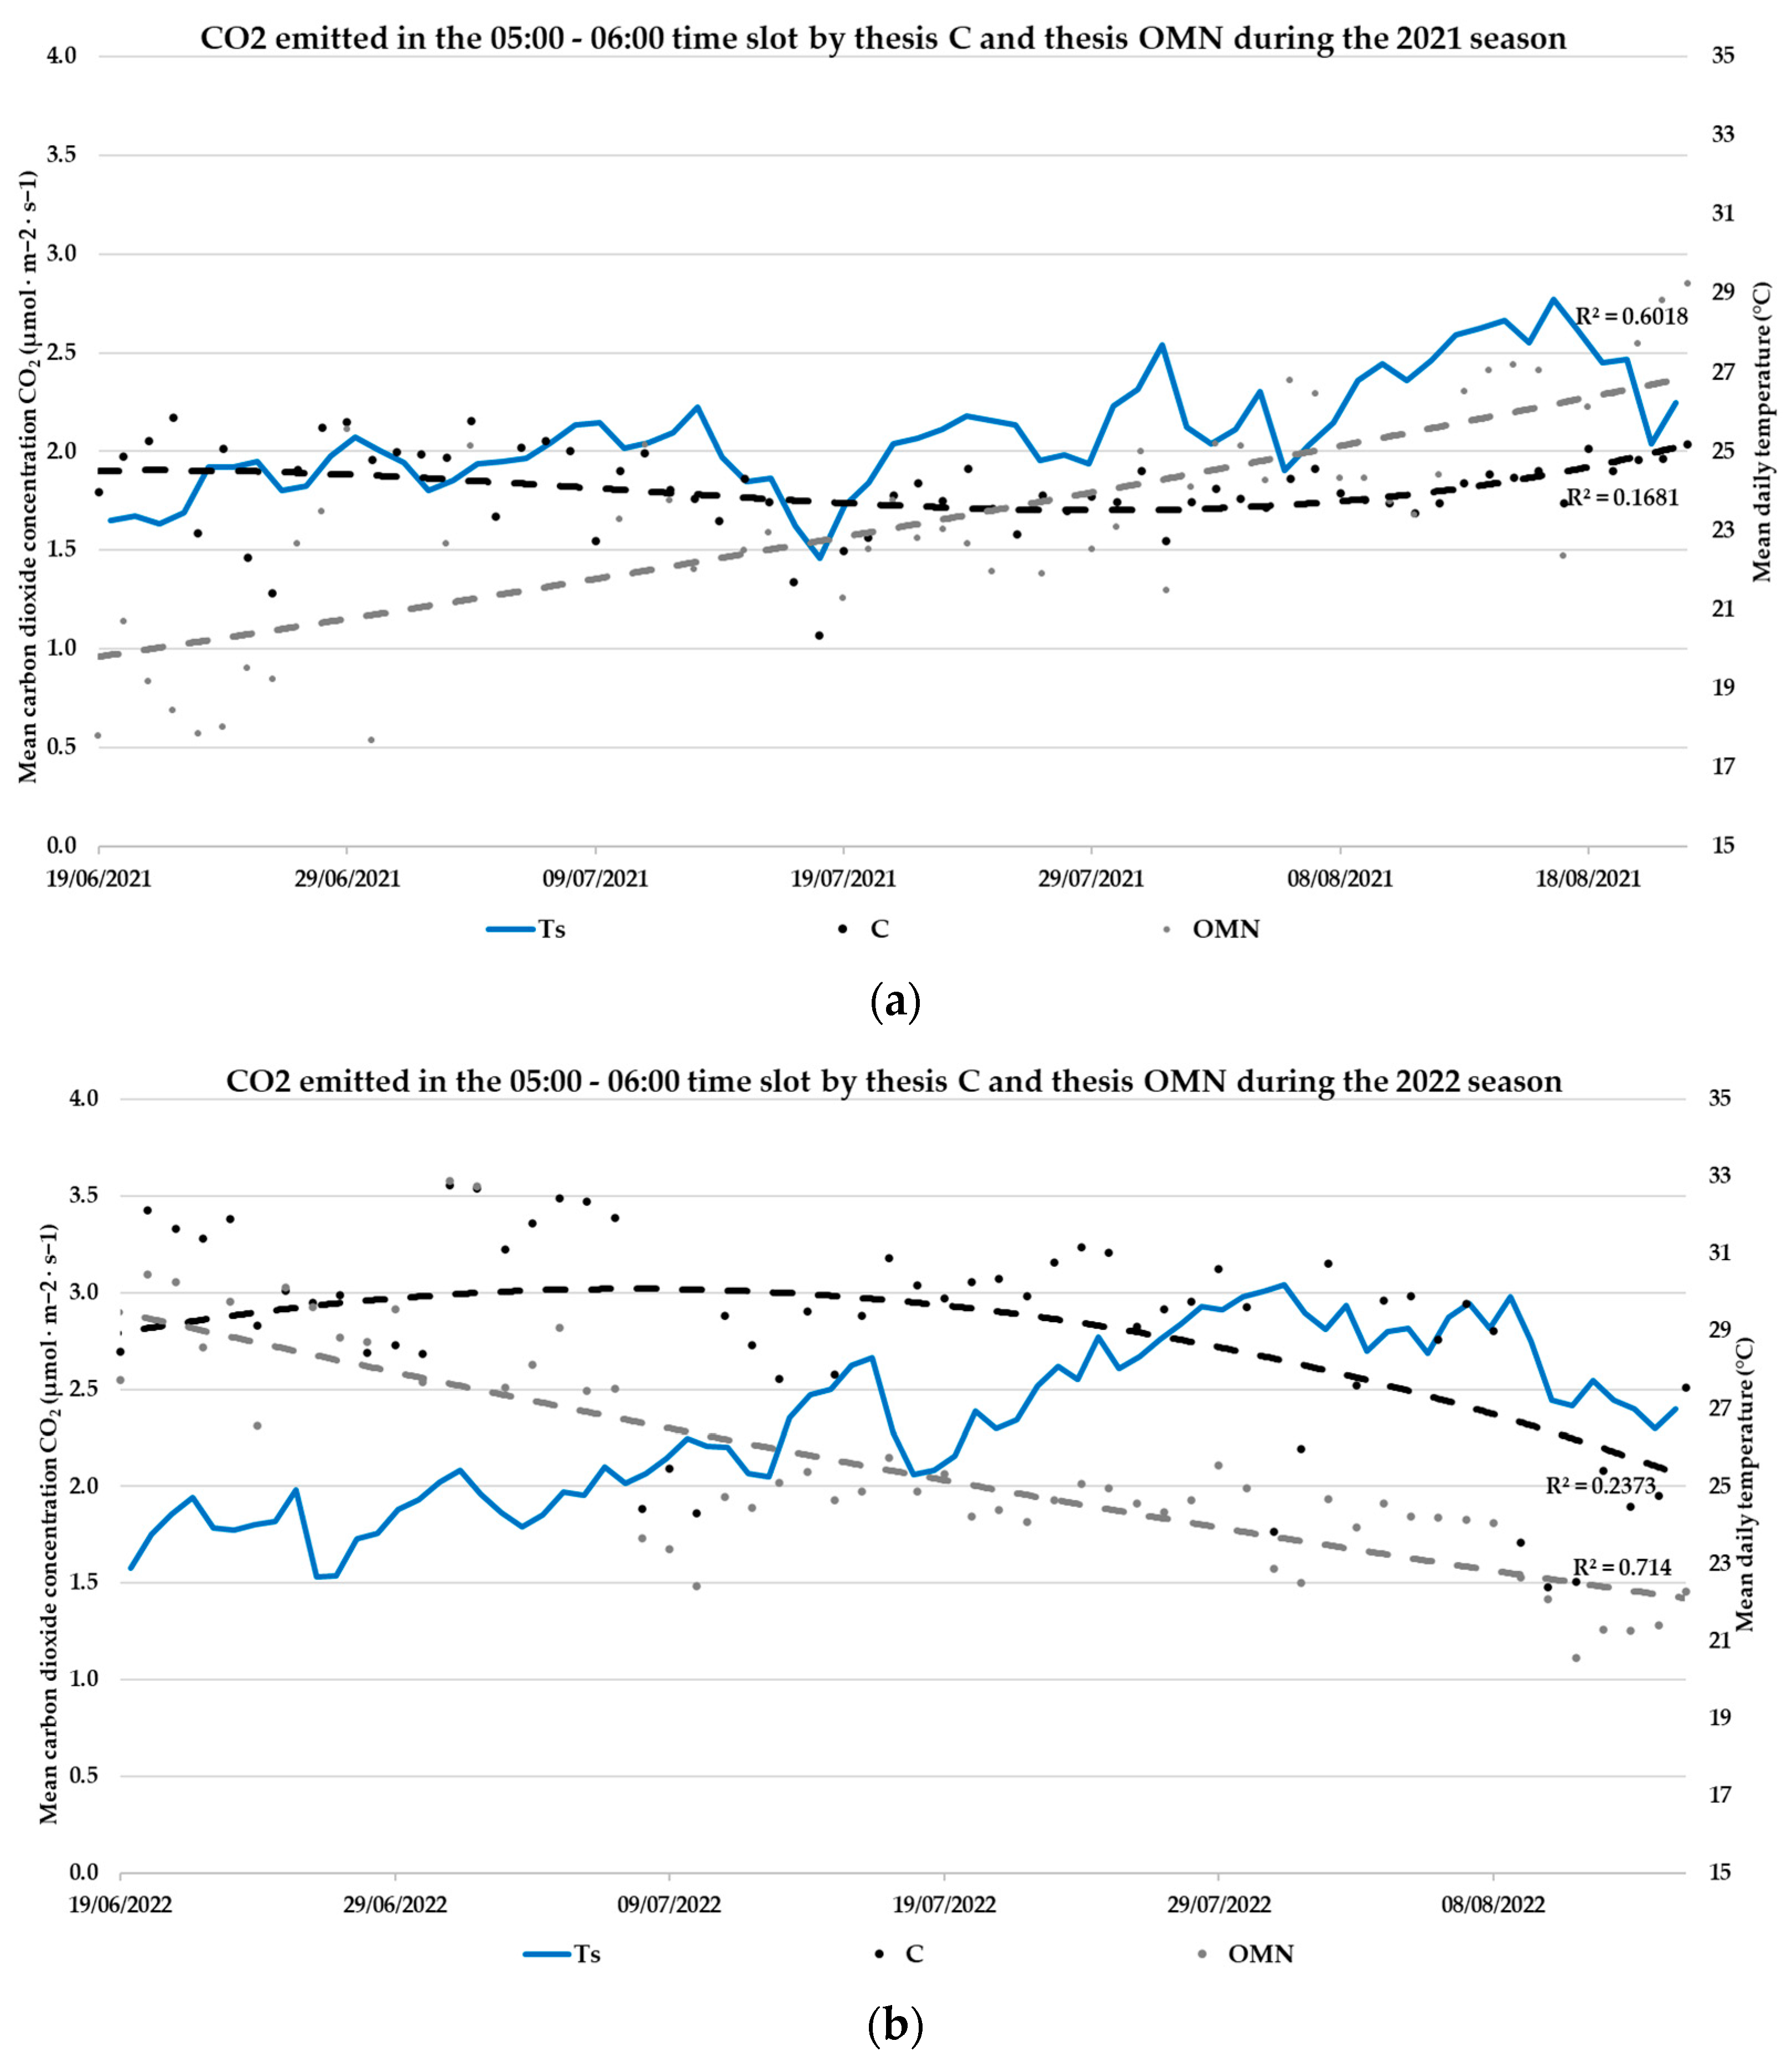
3.2. CO2, Ts, and Ur Measurements of the 2021 and 2022 Seasons

The seasonal trends of the TSR, soil temperature, and under-vine soil moisture in relation to the phenological phases observed in the vineyard during the two seasons in 2021 and 2022 and the inter-row tillage (black arrows) are plotted and shown in Figure 5, Figure 6 and Figure 7. The CO2 emissions, soil temperatures, and soil moisture levels differed significantly among the treatments (Table S1) in the 2022 season. The surface tillage of the inter-row resulted in a reduction in the soil moisture in the surface layer, as it reduced the capillary rise and influenced CO2 fluxes.
The total soil respiration (TSR) (Figure 5) fluctuated in the 2021 season between a maximum of 1.97 µmol CO2∙m−2∙s−1 and a minimum of 1.03 µmol CO2∙m−2∙s−1 for the C treatment, while for the OMN treatment, the TSR ranged from 1.24 to 1.71 µmol CO2∙m−2∙s−1. The TSR was influenced by rainfall and showed an increasing tendency in the presence of rainfall, which reduced the soil temperature and increased the soil moisture.
During the 2022 season, the TSR values for both the C- and OMN-treated vines ranged from 1.18–2.80 µmol CO2∙m−2∙s−1 to 0.94–3.07 µmol CO2∙m−2∙s−1, respectively. The soil respiration was lower in the vines managed with the OMN treatment during the 2022 season, and it was nearly comparable during the 2021 season. The TSR for the 2021 season showed a constant linear trend during the summertime while the TSR for the 2022 season showed a declining trend from late spring to the end of summer. In the early summer of each season, the TSR values reached the highest effluxes.
The soil temperature (Figure 6) showed similar seasonal trends for the tested treatments (OMN and C), while the soil moisture levels (Figure 7) of the vines under the C fertilizer were always higher in both seasons than those recorded for the vines under the OMN fertilizer.
The linear regression analysis (Figure 8) showed how environmental factors such as temperature and soil moisture influenced the flux of CO2 into the soil. In particular, in the 2021 linear regression, these factors were related to the treatment applied (chemical versus organo-mineral fertilization). The respiration–temperature relationships over the seasonal cycles for both treatments (i.e., the OMN and C) showed increasing linear trends for 2021, while for 2022, the OMN treatment exhibited a decreasing linear trend. The respiration–relative humidity and the respiration–temperature relationships exhibited increasing linear trends for 2022.

3.3. Daily CO2 Fluxes

The hourly CO2 flux levels were analyzed after conducting a statistical analysis of outliers, and the time slot corresponding to sunrise (05:00–06:00) was selected. The CO2 fluxes and the Ts trends for the two tested soil nutrition (OMN and C) programs for the two seasons (2021 and 2022) are plotted and shown in Figure 9a,b.

4. Discussion

The warming trend and the decreasing rainfall in the Mediterranean region make it necessary to integrate innovative and sustainable solutions to deal with the impacts of climate change, safeguarding the production capacity (both quantitative and qualitative) of European wine-growing systems and preserving soil function. Among the adaptation and mitigation strategies, soil management and/or supplemental irrigation can be essential tools for the short term to cope with hot climates and water deficits while taking into account water savings, as well as carbon emissions, and seeking to maximize benefits [45,46].
This study focused on the effects of two fertilizer programs—organo-mineral and chemical—on under-vine TSR in a vineyard because it has been recognized that TSR values in under-rows are higher than those in inter-rows in a vineyard [26]. In addition, TSR is an indicator of overall biological activity and a descriptor of soil quality that is strongly linked to agricultural soil management practices, such as tillage and irrigation, but also to abiotic factors (e.g., temperature and moisture) and chemical and physical soil traits [26,47,48]. The soil of the tested vineyard could be classified as clay-loam soil and poor in terms of SOC, and in fact, all the soil profiles could be characterized by very low SOM values (optimal values are between 2 and 3%) [49,50,51], which underlined low fertility conditions.
In the tested vineyard, all soil horizons showed medium-low water retention capacity—which is not ideal for a vineyard in a semi-arid climate [30]—but good porosity. The air capacity (%) ranged between 6 and 7 percent in all horizons. In addition, the bulk density values were similar among the horizons. This soil was extremely dry during the summer season.
Our findings showed that the CO2 effluxes measured by the multi-chamber automatic system prototypes were comparable with those of other studies [26,27,52,53]. The variability in the TSR trends of the two seasons was affected by the abiotic conditions which influenced two of the crucial components of total soil respiration: autotrophic (from roots and root-associated organisms) and heterotrophic (from matter decomposition) processes [26,54,55,56]. The greater CO2 emissions for the under-vine soils in both treatments (i.e., the OMN and C treatments) during the very hot seasons in 2022 could have been related to greater SOM decomposition and microbial activity.
The extreme weather conditions of the 2022 season highlighted the differences between the two agronomical practices. In particular, for the OMN treatment during the 2022 season, the TSR values were significantly and negatively related to soil temperature but positively related to VWC. This represented negative feedback related to the climate warming, as happens in semi-arid ecosystems [57]. Basically, a decoupling between the TSR and the soil water content occurs during dry seasons, and the seasonal variations in TSR values are controlled primarily by soil temperature and secondarily by soil water content.
Under very dry and hot conditions (Supplementary Materials), the OMN treatment maintained low TSR levels and preserved soil fertility by decreasing the annual CO2 released from the soil [52,58]. In fact, the OMN treatment worked as a sponge-like structure due to its composition (>humified SOM). It increased the plants’ available water capacity, retaining water in the soil (i.e., the sponge effect), and it influenced what this implied for water management [50,59]. OMN treatments gradually reduce the water that is useful for microbiota, which decreases their activity and limits the amount of CO2 released [60,61]. Thus, OMN treatments help to restore the SOM contents of degraded/depleted soils such as vineyard soils (SOC < 2%) [62], and it can make them, as well as agroecosystems, climate-resilient. However, when soil temperatures exceed 25 °C [56,63,64], the peculiar effects of OMN are reduced, and actions to preserve them can be decisive. It becomes important to take actions to maintain optimal abiotic soil conditions for microbial activity, control water stress, and, depending on the hydrological characteristics of the soil, apply better scheduling of deficit irrigation in a vineyard for sustainable water use [35,65,66]. TSR hourly data can be useful for understanding how and when microbial activity can preserve and/or improve conditions, and it can guide the decision-making processes of farmers (e.g., scheduling irrigation) to support soil function and preserve the soil’s microbiome. The data showed that the values of the hourly CO2 effluxes decreased, reaching the lowest values in the time slot between 06:00–08:00 and the highest values between 13:00 and 14:00. In order to limit multiple abiotic stressors (e.g., thermal and water stress) to the microbial biomass in topsoil, micro-irrigation scheduling could help to restore the optimum conditions for soil microbial activity and for containing vine stress.

5. Conclusions

In this study, we analyzed the effects of two fertilization practices in viticulture—organo-mineral fertilization and chemical fertilization—on under-vine soil respiration at seasonal (2021–2022) and daily scales. Soil respiration is considered an indicator of soil health, and it provides an overview of soil functionality. The results showed that, especially under extreme climatic conditions, organo-mineral fertilizers improve soil resilience by preserving soil fertility, decreasing the annual release of CO2 from the soil and promoting optimal abiotic conditions for microbial activity in a degraded vineyard (with very low chemical fertility). Furthermore, chamber-based measurements of soil respiration (using our prototype) could be a useful, accurate, and inexpensive tool for providing a continuous picture of seasonal CO2 effluxes (emissions), a parameter that is difficult to measure in agriculture but crucial for estimating the carbon balance of an agro-ecosystem, detecting stress conditions in the microbiome, and, thus, taking timely ameliorative measures (e.g., scheduling irrigation).

Supplementary Materials

The following supporting information can be downloaded at: https://www.mdpi.com/article/10.3390/horticulturae9101107/s1. Figure S1. Relative humidity (%) and rainfall (mm) during the two consecutive seasons (2021 and 2022) in an Italian rainfed tested vineyard. The data were obtained by a in situ weather station. Figure S2. Technical sheet of the sensor used for the detection of CO2. Figure S3. Technical sheet for the sensor used for the detection of the temperature and moisture level of the soil. Figure S4. Technical sheet for the fertilizer used for treatments in the spring. Figure S5. Technical sheet for the fertilizer used for the treatments in autumn. Table S1. Generalized linear mixed-effect models of the changes in the CO2 fluxes, soil temperatures (Ts), and soil moisture (Rh, relative humidity (%)) levels over time (i.e., the 2021 and 2022 seasons).

Author Contributions

Conceptualization, P.C. and E.B.; methodology, P.C., E.B., and M.E.M.D.; formal analysis, P.C., E.B., A.C., and A.R.; investigation, P.C., E.B., M.E.M.D., A.C., and A.R.; data curation, A.C., E.B., and A.R.; writing—original draft preparation, P.C., A.C., and E.B.; visualization, P.C., A.C., and E.B.; supervision, P.C. and E.B.; project administration, P.C.; Writing-review and editing, P.C., E.B and A.C. All authors have read and agreed to the published version of the manuscript.

Funding

This research was funded by Life 2019 Environment and Resource Efficiency, Life WINEgROVER—LIFE19 ENV/IT/000339, “Precision Agriculture System to limit the impact on the environment, on health and on air quality of grape production”, Reg. UE n. 1293/2013, row n. 183/1987 (Decreto n. 11/2021) (21A05971) (GU Serie Generale n. 244 del 12-10-2021).

Data Availability Statement

Data available on request due to restrictions, e.g., privacy or ethical. The data presented in this study are available on request from the corresponding author.

Conflicts of Interest

The authors declare no conflict of interest.

References

  1. EIP-AGRI Workshop ‘Towards Carbon Neutral Agriculture’: Final Report Workshop Report 24–25 March 2021; European Commission: Brussels, Belgium, 2021.
  2. Hannah, R.; Max, R.; Pablo, R. CO2 and Greenhouse Gas Emissions; Our World in Data: Oxford, UK, 2020. [Google Scholar]
  3. Vermunt, D.A.; Negro, S.O.; Van Laerhoven, F.S.J.; Verweij, P.A.; Hekkert, M.P. Sustainability transitions in the agri-food sector: How ecology affects transition dynamics. Environ. Innov. Soc. Transit. 2020, 36, 236–249. [Google Scholar] [CrossRef]
  4. Munjonji, L.; Ayisi, K.K.; Mafeo, T.P.; Maphanga, T.; Mabitsela, K.E. Seasonal variation in soil CO2 emission and leaf gas exchange of well-managed commercial Citrus sinensis (L.) orchards. Plant Soil 2021, 465, 65–81. [Google Scholar] [CrossRef]
  5. Montanaro, G.; Doupis, G.; Kourgialas, N.; Markakis, E.; Kavroulakis, N.; Psarras, G.; Koubouris, G.; Dichio, B.; Nuzzo, V. Management options influence seasonal CO2 soil emissions in Mediterranean olive ecosystems. Eur. J. Agron. 2023, 146, 126815. [Google Scholar] [CrossRef]
  6. Yan, Z.; Miles, D.; Huan-jie, C.; Li-bing, S.; Hui, C. The effects of aerated irrigation on soil respiration, oxygen, and porosity. J. Integr. Agric. 2019, 18, 2854–2868. [Google Scholar]
  7. Buchmann, N. Biotic and abiotic factors controlling soil respiration rates in Picea abies stands. Soil Biol. Biochem. 2000, 32, 1625–1635. [Google Scholar] [CrossRef]
  8. Liu, W.; Zhang, Z.; Wan, S. Predominant role of water in regulating soil and microbial respiration and their responses to climate change in a semiarid grassland. Glob. Chang. Biol. 2009, 15, 184–195. [Google Scholar] [CrossRef]
  9. Chen, W.; Jia, X.; Zha, T.; Wu, B.; Zhang, Y.; Li, C.; Chen, G. Soil respiration in a mixed urban forest in China in relation to soil temperature and water content. Eur. J. Soil Biol. 2013, 54, 63–68. [Google Scholar] [CrossRef]
  10. Brunori, E.; Farina, R.; Biasi, R. Sustainable viticulture: The carbon-sink function of the vineyard agro-ecosystem. Agric. Ecosyst. Environ. 2016, 223, 10–21. [Google Scholar] [CrossRef]
  11. Carlisle, E.; Smart, D.; Williams, L.E.; Summers, M. California Vineyard Greenhouse Gas Emissions: Assessment of the Available Literature and Determination of Research Needs; California Sustainable Winegrowing Alliance: San Francisco, CA, USA, 2010. [Google Scholar]
  12. Comas, L.H.; Bauerle, T.L.; Eissenstat, D.M. Biological and environmental factors controlling root dynamics and function: Effects of root ageing and soil moisture. Aust. J. Grape Wine Res. 2010, 16, 131–137. [Google Scholar] [CrossRef]
  13. Freibauer, A.; Rounsevell, M.D.A.; Smith, P.; Verhagen, J. Carbon sequestration in the agricultural soils of Europe. Geoderma 2004, 122, 1–23. [Google Scholar] [CrossRef]
  14. Ma, T.; Zhu, G.; Ma, J.; Kun, Z.; Wang, S.; Tuo, H.; Shasha, S. Soil respiration in an irrigated oasis agroecosystem: Linking environmental controls with plant activities on hourly, daily and monthly timescales. Plant Soil 2020, 447, 347–364. [Google Scholar] [CrossRef]
  15. Tedesco, S.; Fevereiro, P.; Kragler, F.; Pina, A. Plant grafting and graft incompatibility: A review from the grapevine perspective. Sci. Hortic. 2022, 299, 111019. [Google Scholar] [CrossRef]
  16. Moyano, F.E.; Manzoni, S.; Chenu, C. Responses of soil heterotrophic respiration to moisture availability: An exploration of processes and models. Soil Biol. Biochem. 2013, 59, 72–85. [Google Scholar] [CrossRef]
  17. Phillips, S.C.; Varner, R.K.; Frolking, S.; Munger, J.W.; Bubier, J.L.; Wofsy, S.C.; Crill, P.M. Interannual, seasonal, and diel variation in soil respiration relative to ecosystem respiration at a wetland to upland slope at Harvard Forest. J. Geophys. Res. Biogeosci. 2010, 115, G02019. [Google Scholar] [CrossRef]
  18. De Dato, G.; Lagomarsino, A.; Lellei-Kovacs, E.; Liberati, D.; Abou Jaoudé, R.; Marabottini, R.; Stazi, S.R.; Guidolotti, G.; Kovacs-Land, E.; Kroel-Dulay, G.; et al. The response of soil CO2 efflux to water limitation is not merely a climatic issue: The role of substrate availability. Forests 2017, 8, 241. [Google Scholar] [CrossRef]
  19. Payen, F.T.; Sykes, A.; Aitkenhead, M.; Alexander, P.; Moran, D.; MacLeod, M. Soil organic carbon sequestration rates in vineyard agroecosystems under different soil management practices: A meta-analysis. J. Clean. Prod. 2021, 290, 125736. [Google Scholar] [CrossRef]
  20. Pou, A.; Balda, P.; Cifre, J.; Ochogavia, J.M.; Ayestaran, B.; Guadalupe, Z.; Llompart, M.; Bota, J.; Martínez, L. Influence of non-irrigation and seasonality on wine colour, phenolic composition and sensory quality of a grapevine (Vitis vinifera cv. Callet) in a Mediterranean climate. OENO One 2023, 57, 217–233. [Google Scholar] [CrossRef]
  21. Iovieno, P.; Morra, L.; Leone, A.; Pagano, L.; Alfani, A. Effect of organic and mineral fertilizers on soil respiration and enzyme activities of two Mediterranean horticultural soils. Biol. Fertil. Soils 2009, 45, 555–561. [Google Scholar] [CrossRef]
  22. Sun, Q.; Granco, G.; Groves, L.; Voong, J.; Van Zyl, S. Viticultural Manipulation and New Technologies to Address Environmental Challenges Caused by Climate Change. Climate 2023, 11, 83. [Google Scholar] [CrossRef]
  23. Bastida, F.; Kandeler, E.; Moreno, J.L.; Ros, M.; García, C.; Hernández, T. Application of fresh and composted organic wastes modifies structure, size and activity of soil microbial community under semiarid climate. Appl. Soil Ecol. 2008, 40, 318–329. [Google Scholar] [CrossRef]
  24. Jie, Z.; Yanzhi, J.; Yanjie, G.; Xing, Y.; Yannan, L.; Jian, H.; Yang, L.; Chen, W.; Wenzan, W.; Yusha, L.; et al. Responses of soil respiration and microbial community structure to fertilizer and irrigation regimes over 2 years in temperate vineyards in North China. Sci. Total Environ. 2022, 840, 156469. [Google Scholar]
  25. Delle Vedove, G.; Alberti, G.; Zuliani, M.; Peressotti, A. Automated monitoring of soil respiration: An improved automatic chamber system. Ital. J. Agron. 2007, 2, 377–382. [Google Scholar] [CrossRef]
  26. Egidio, L.; Maria, A.; Vitale, N.; Cristos, X.; Giuseppe, C. Variability of total soil respiration in a Mediterranean vineyard. Soil Res. 2015, 53, 531–541. [Google Scholar]
  27. Philippe, R.; Gordon, L.H. Measurement of Soil Respiration in situ: Chamber Techniques. Micrometeorol. Agric. Syst. 2005, 47, 247–286. [Google Scholar]
  28. Phillips, C.L.; Nickerson, N. Soil Respiration. In Reference Module in Earth Systems and Environmental Sciences; Elias, S., Ed.; Elsevier: Amsterdam, The Netherlands, 2015. [Google Scholar]
  29. Masnaghetti, A. I Cru di Enogea, Orvieto: Vigneti e Zone; Alessandro Masnaghetti Editore: Monza, Italy, 2015. [Google Scholar]
  30. Biasi, R.; Brunori, E.; Ferrara, C.; Salvati, L. Assessing impacts of climate change on phenology and quality traits of Vitis vinifera L.: The contribution of local knowledge. Plants 2019, 8, 121. [Google Scholar] [CrossRef]
  31. Horwath, W. Carbon cycling and formation of soil organic matter. In Soil Microbiology, Ecology and Biochemistry, 3rd ed.; Eldor, A.P., Ed.; Academic Press: Cambridge, MA, USA, 2007; pp. 303–339. [Google Scholar]
  32. Goupil, K.; Nkongolo, K. Assessing soil respiration as an indicator of soil microbial activity in reclaimed metal contaminated lands. Am. J. Environ. Sci. 2014, 10, 403–411. [Google Scholar] [CrossRef]
  33. Soil Survey Laboratory Staff. Soil Survey Laboratory Manual, Soil Survey Investigation Report No. 42; Government Printing Office: Washington, DC, USA, 1996. [Google Scholar]
  34. Rubio, C.M. A Laboratory Procedure to Determine the Thermal Properties of Silt Loam Soils Based on ASTM D 5334. Appl. Ecol. Environ. Sci. 2013, 1, 45–48. [Google Scholar]
  35. Soil Survey Staff. Keys to Soil Taxonomy, 8th ed.; Government Printing Office: Washington, DC, USA, 1998; p. 541. [Google Scholar]
  36. ISO 11260:2018; Soil Quality—Determination of Effective Cation Exchange Capacity and Base Saturation Level Using Barium Chloride Solution. International Organization for Standardization: Geneva, Switzerland, 1994.
  37. Thomas, G.W. Soil pH and soil acidity. In Methods of Soil Analysis, Part—Chemical Methods; Soil Science Society of America: Madison, WI, USA, 1996; pp. 475–490. [Google Scholar]
  38. ISO 10694:1995(E); Soil Quality—Determination of Organic and Total Carbon after Dry Combustion (Elementary Analysis). International Organization for Standardization: Geneva, Switzerland, 1995.
  39. Pleysier, J.L.; Juo, A.S.R. A Single-Extraction Method Using Silver-Thiourea for Measuring Exchangeable Cations and Effective CEC in Soils with Variable Charges. Soil Sci. 1980, 129, 205–211. [Google Scholar] [CrossRef]
  40. Salter, P.J.; Berry, G.; Williams, J.B. The influence of texture on the moisture characteristics of soils: III, Quantitative relationships between particle size, composition, and available-water capacity. Eur. J. Soil Sci. 1966, 17, 93–98. [Google Scholar] [CrossRef]
  41. Hu, X.; Hirota, M.; Wuyunna; Kawada, K.; Li, H.; Meng, S.; Tamura, K.; Kamijo, T. Responses in gross primary production of Stipa krylovii and Allium polyrhizum to a temporal rainfall in a temperate grassland of Inner Mongolia, China. J. Arid Land 2019, 11, 824–836. [Google Scholar] [CrossRef]
  42. Davidson, E.A.; Savage, K.; Verchot, L.; Navarro, R. Minimizing artifacts and biases in chamber-based measurements of soil respiration. Agric. For. Meteorol. 2002, 113, 21–37. [Google Scholar] [CrossRef]
  43. Adafruit-SHT-10 Mesh-Protected Weather-Proof Temperature/Humidity Sensor. Available online: https://www.adafruit.com/product/1298 (accessed on 7 December 2020).
  44. AtlasScientific—EZO-CO2™ Embedded Carbon Dioxide Sensor Title of Site. Available online: https://atlas-scientific.com/probes/co2-sensor/ (accessed on 7 December 2020).
  45. Santos, J.A.; Yang, C.; Fraga, H.; Malheiro, A.C.; Moutinho-Pereira, J.; Dinis, L.T.; Correia, C.; Moriondo, M.; Bindi, M.; Leolini, L.; et al. Short-term adaptation of European viticulture to climate change: An overview from the H2020 Clim4Vitis action. IVES Tech. Rev. Vine Wine 2021. [Google Scholar] [CrossRef]
  46. Pingel, M.; Reineke, A.; Leyer, I. Disentangling the mixed effects of soil management on microbial diversity and soil functions: A case study in vineyards. Sci. Rep. 2023, 13, 3568. [Google Scholar] [CrossRef] [PubMed]
  47. Paz-Ferreiro, J.; Fu, S. Biological indices for soil quality evaluation: Perspectives and limitations. Land Degrad. Dev. 2016, 27, 14–25. [Google Scholar] [CrossRef]
  48. Costa, J.M.; Egipto, R.; Aguiar, F.C.; Marques, P.; Nogales, A.; Madeira, M. The role of soil temperature in mediterranean vineyards in a climate change context. Front. Plant Sci. 2023, 14, 1145137. [Google Scholar] [CrossRef]
  49. Doğan, B.; Gülser, C. Assessment of Soil Quality for Vineyard Fields: A Case Study in Menderes District of Izmir, Turkey. Eurasian J. Soil Sci. 2019, 8, 176–183. [Google Scholar] [CrossRef]
  50. Kurtural, S.K. Desired Soil Properties for Vineyard Site Preparation. Universtiy of Kentucky, College of Agriculture. Coop. Ext. Serv. 2011, 31. [Google Scholar]
  51. Lazcano, C.; Decock, C.; Wilson, S.G. Defining and Managing for Healthy Vineyard Soils, Intersections with the Concept of Terroir. Front. Environ. Sci. 2020, 8, 68. [Google Scholar] [CrossRef]
  52. Agota, H.; Eszter, T.; Györgyi, G.; Dencső, M.; Imre, P. Soil CO2 and N2O Emission Drivers in a Vineyard (Vitis vinifera) under Different Soil Management Systems and Amendments. Sustainability 2018, 10, 1811. [Google Scholar]
  53. Quan, Z.; Richard, P.P.; Stefano, M.; Russell, L.S.; Andrew, C.O.; Adrien, F.; Edoardo, D.; Rodrigo, V.; Kimberly, N. Changes in photosynthesis and soil moisture drive the seasonal soil respiration-temperature hysteresis relationship. Agric Meteorol. 2018, 259, 184–195. [Google Scholar]
  54. Annette, B.; Meriem, S.; Aurore, K.; Pierre, R. Soil microbial community responses to heat wave components: Drought and high temperature. Clim. Res. 2015, 66, 243–264. [Google Scholar]
  55. Jansson, J.K.; Hofmockel, K.S. Soil microbiomes and climate change. Nat. Rev. Microbiol. 2020, 18, 35–46. [Google Scholar] [CrossRef]
  56. Federica, G.; Patrick, M.; Nicola, B.; Lorenzo, L.; Flavio, F.; Diego, T. Influence of compost addition on soil properties, root growth and vine performances of Vitis vinifera cv Cabernet sauvignon. Sci. Hortic. 2017, 225, 88–95. [Google Scholar]
  57. Wang, B.; Zha, T.S.; Jia, X.; Wu, B.; Zhang, Y.Q.; Qin, S.G. Soil moisture modifies the response of soil respiration to temperature in a desert shrub ecosystem. Biogeosciences 2014, 11, 259–268. [Google Scholar] [CrossRef]
  58. Soil Quality Indicators. USDA Natural Resources Conservation Service. Soil Survey Staff, Natural Resources Conservation Service, United States Department of Agriculture. Official Soil Series Descriptions. Available online: https://www.nrcs.usda.gov/sites/default/files/2022-10/indicator_sheet_guide_sheet.pdf (accessed on 18 February 2023).
  59. Lal, R. Challenges and opportunities in soil organic matter research. Eur. J. Soil Sci. 2009, 60, 158–169. [Google Scholar] [CrossRef]
  60. Pete, S.; Changming, F.; Julián, J.M.; John, M. Impact of Global Warming on Soil Organic Carbon. Adv. Agron. 2008, 97, 1–43. [Google Scholar]
  61. Marion, N.; Mark, J.H. Warming increases soil respiration in a carbon-rich soil without changing microbial respiratory potential. Biogeosciences 2020, 17, 4405–4420. [Google Scholar]
  62. Ferreira, C.S.; Seifollahi-Aghmiuni, S.; Destouni, G.; Ghajarnia, N.; Kalantari, Z. Soil degradation in the European Mediterranean region: Processes, status and consequences. Sci. Total Environ. 2022, 805, 150106. [Google Scholar] [CrossRef]
  63. Miko, U.F.K. The temperature dependence of organic-matter decomposition-still a topic of debate. Soil. Biol. Biochem. 2006, 38, 2510–2518. [Google Scholar]
  64. Eric, D.; Ivan, J. Temperature Sensitivity of Soil Carbon Decomposition and Feedbacks to Climate Change. Nature 2006, 440, 165–173. [Google Scholar]
  65. Miguel, C.; Margarida, V.; José, E.; Ricardo, E.; Carlos, L.; Hipolito, M.; Manuela, C.M. Modern viticulture in southern Europe: Vulnerabilities and strategies for adaptation to water scarcity. Agric. Water Manag. 2015, 164, 5–18. [Google Scholar]
  66. Kerri, S.; Danielle, P.; Eli, C.; Robert, S.; David, S. A Vineyard Agroecosystem: Disturbance and Precipitation Affect Soil Respiration under Mediterranean Conditions. Soil Sci. Soc. Am. J. 2010, 74, 231–239. [Google Scholar]
Figure 1. (A) PDO ‘Orvieto’ wine-grape-growing area in Central Italy (Umbria Region) and (B) localization of the tested vineyards planted with the Chardonnay variety grafted with V. berlandieri × V. rupestris (rootstock 1103P). (C,D) The soil pits used for the soil microscale traits assessment (P1: vineyard soil under the C treatment and P2: vineyard soil under the OMN treatment). (E) the experimental designs adopted for the chemical and organo-mineral fertilizers (C and OMN, respectively) that were applied on three consecutive rows (orange cycle) on 70 vines (green points) to analyze the effects of soil nutrition management on total soil respiration (TSR). Two buffer areas were considered to surround the core areas (a tested area of 30 vines) where the GSS (ground soil sensors) were placed to analyze the TSR and where the soil pits (yellow square) were located.
Horticulturae 09 01107 g001
Figure 2. Structure of the soil respiration chamber prototypes (SRCps) (a) and the protective bulkheads (b).
Horticulturae 09 01107 g002
Figure 3. Soil respiration chamber prototype (SRCps) and its sensors.
Horticulturae 09 01107 g003
Figure 4. Principal component analysis (PCA) biplot of the soil profiles and variables (n = 17). The biplot shows the PCA scores of the variables as vectors (in red) and profiles (i.e., P1/50) (blue circles). Variables on the same side as a given soil profile should be interpreted as having a high contribution to it. The magnitudes of the vectors (lines) show the strengths of their contributions to each PC. Vectors pointing in similar directions indicate positively correlated variables, vectors pointing in opposite directions indicate negatively correlated variables, and vectors at approximate right angles indicate low or no correlations.
Horticulturae 09 01107 g004
Figure 5. Seasonal variations in the total soil respiration (TSR) during the annual grapevine growth cycle, from BBCH 065: flowering to BBCH 089: berry ripening, during two consecutive seasons (2021 and 2022) under two different vine nutrition programs (organo-mineral (OMN) and chemical nutrition (C)). The daily rainfall amounts and inter-row tillage are shown (black arrows).
Horticulturae 09 01107 g005
Figure 6. Seasonal variations in the soil temperature during the annual grapevine growth cycle, from BBCH 065: flowering to BBCH 089: berry ripening, during two consecutive seasons (2021 and 2022) under two different vine nutrition programs (organo-mineral (OMN) and chemical nutrition (C)).
Horticulturae 09 01107 g006
Figure 7. Seasonal variations in soil moisture during the annual grapevine growth cycle, from BBCH 065: flowering to BBCH 089: berry ripening, during two consecutive seasons (2021 and 2022) under two different vine nutrition programs (organo-mineral (OMN) and chemical nutrition (C)).
Horticulturae 09 01107 g007
Figure 8. Relationship of the under-vine total soil respiration (TSR (µmol CO2∙m−2∙s−1)) with the soil temperature (°C) and the soil moisture (relative humidity (RH) (%)) during the 2021 and 2022 seasons. The blue and red circles represent the vines under the chemical nutrition (C) treatment and those under the organo-mineral fertilizer, respectively.
Horticulturae 09 01107 g008
Figure 9. (a) Seasonal trends for 2021 and (b) 2022 of the under-vine CO2 fluxes in the 05:00–06:00 time slot for the two tested soil nutritional management programs (i.e., the chemical soil nutrition (C, farming ordinary soil nutrition management) and the organo-mineral nutrition (OMN) programs).
Horticulturae 09 01107 g009
Table 1. The matrix potential reference points expressed in various international units of measure: cm H20, Kpa, pF, and bar.
cm H2OKPapFbar
0000
1001020.1
33333.32.50.333
100010031
15,00015004.215
Table 2. Physical parameters of the two soil profiles (P1, vineyard soil under the C treatment and P2, vineyard soil under the OMN treatment), where CL denotes clay loam, and the denominations of the soil horizons were determined according to the International Society of Soil Science and reported following the “Keys to Soil Taxonomy” [35].
ProfileProfile P1Profile P2
Horizon denominationAp2BkBCAp1Bw1Bw2
Horizon depth10–35 cm35–55 cm55–100 cm0–25 cm25–60 cm60–80 cm
Sand (%)323724343138
Silt (%)353539283527
Clay (%)332837383435
Textural classCLCLCLCLCLCL
Table 3. Chemical parameters of the two soil profiles (P1, vineyard soil under the C treatment and P2, vineyard soil under the OMN treatment), where the denominations of the soil horizons were determined according to the International Society of Soil Science and reported following the “Keys to Soil Taxonomy” [35].
ProfileProfile P1Profile P2
Horizon denominationAp2BkBCAp1Bw1Bw2
Horizon depth10–35 cm35–55 cm55–100 cm0–25 cm25–60 cm60–80 cm
pH8.48.48.58.38.38.3
Organic matter (%)0.660.390.331.250.920.66
CSC (meq/100 g)24.1920.3528.4829.9826.0427.25
Total N (%)0.0460.030.0260.0790.0620.046
Table 4. Physical–hydrological results from the undisturbed soil samples (P1, vineyard soil under the C treatment and P2, vineyard soil under the OMN treatment).
Horizon/SampleSaturationMoisture Content by Volume % pFAvailable Water CapacityAir CapacityTotal Porosity %60%Porosity > 0.2 Microns %Apparent Density in gr/cm3
pF2pF2.5pF3pF4.2
P1/5045.538.535.5322018.56.945.527.325.41.6
P1/8044.836.336.333.723.914.26.744.826.9211.5
P2/304538.636.934.624.514.16.4452720.51.5
P2/7545.238.638.634.423.814.76.645.227.121.31.6
Table 5. Correlation matrix of the Pearson correlation coefficients.
Soil VariablesSaturationpF2pF2.5pF3pF4.2Available Water Capacity (AWC) (%)Air Capacity (AC) (%)Total Porosity (TP)
(%)
Porosity > 0.2 Microns (%)Bulk Density (BD) (gr/cm3)Sand (%)Silt (%)Clay (%)pHSoil Organic Content (SOC) (%)CEC (meq/100 g)Total Nitrogen (TN) (%)
Saturation1
pF20.6991
pF2.5−0.1720.2991
pF3−0.6590.0270.7641
pF4.2−0.839−0.2360.6210.9621
Available Water Capacity (AWC) (%)0.8840.334−0.582−0.931−0.9951
Air Capacity (AC) (%)0.563−0.198−0.566−0.928−0.8720.8201
Total Porosity (TP) (%)1.0000.699−0.172−0.659−0.8390.8840.5631
Porosity > 0.2 microns (%)0.8580.271−0.599−0.952−0.9990.9970.8580.8581
Bulk Density (BD) (gr/cm3)0.8700.5600.198−0.464−0.6460.6740.5550.8700.6651
Sand0.8730.8700.320−0.225−0.4770.5470.1980.8730.5080.8941
Silt−0.421−0.677−0.821−0.320−0.0840.0220.191−0.4210.053−0.688−0.8001
Clay−0.908−0.5690.5330.7900.904−0.941−0.579−0.908−0.915−0.596−0.6270.0341
pH−0.321−0.890−0.629−0.479−0.2290.1280.585−0.3210.193−0.302−0.6740.7610.1351
Soil Organic Content (SOC) (%)−0.1090.6310.5150.7120.550−0.461−0.880−0.109−0.523−0.2130.229−0.4060.146−0.8671
CEC (meq/100 g)−0.881−0.5120.5930.8220.917−0.948−0.606−0.881−0.926−0.556−0.570−0.0360.9970.0700.1911
Total Nitrogen (TN) (%)−0.1020.6360.5070.7050.542−0.453−0.876−0.102−0.515−0.2110.232−0.4030.136−0.8681.0000.1811
Values in bold are different from 0 at significance alpha level of 0.05.
Disclaimer/Publisher’s Note: The statements, opinions and data contained in all publications are solely those of the individual author(s) and contributor(s) and not of MDPI and/or the editor(s). MDPI and/or the editor(s) disclaim responsibility for any injury to people or property resulting from any ideas, methods, instructions or products referred to in the content.

