Article

Analysis of Antioxidant Capacity Variation among Thai Holy Basil Cultivars (Ocimum tenuiflorum L.) Using Density-Based Clustering Algorithm

by
Tanapon Saelao
1,
Panita Chutimanukul
2,
Apichat Suratanee
3 and
Kitiporn Plaimas
4,*
1
Program in Bioinformatics and Computational Biology, Graduate School, Chulalongkorn University, Bangkok 10330, Thailand
2
National Center for Genetic Engineering and Biotechnology (BIOTEC), National Science and Technology Development Agency, Klong Luang 12120, Thailand
3
Department of Mathematics, Faculty of Applied Science, King Mongkut’s University of Technology North Bangkok, Bangkok 10800, Thailand
4
Advance Virtual and Intelligent Computing (AVIC) Center, Department of Mathematics and Computer Science, Faculty of Science, Chulalongkorn University, Bangkok 10330, Thailand
*
Author to whom correspondence should be addressed.
Horticulturae 2023, 9(10), 1094; https://doi.org/10.3390/horticulturae9101094
Submission received: 28 August 2023 / Revised: 24 September 2023 / Accepted: 27 September 2023 / Published: 1 October 2023

Abstract

:
Holy basil (Ocimum tenuiflorum L.) is a widely renowned herb for its abundance of bioactive compounds and medicinal applications. Nevertheless, there exists a dearth of knowledge regarding the variability among holy basil cultivars capable of yielding substantial bioactive compounds. This study aims to address this gap by shedding light on the diversity of antioxidant capacities within different accessions of Thai holy basil by employing a density-based clustering algorithm to categorize the holy basil cultivars that demonstrate notable antioxidant potential. The study involves the analysis of the anthocyanin, flavonoid, phenolic, and terpenoid content, as well as DPPH antioxidant activity, in 26 Thai holy basil accessions collected from diverse locations in Thailand. Among the 26 tested Thai holy basil cultivars, terpenoids were found to be the dominant class of compounds, with average values of 707 mg/gDW, while the levels of flavonoids and phenolic compounds remained below 65 mg rutin/gDW and 46 mg GAE/gDW, respectively. The DPPH assay in holy basil cultivars demonstrated that the antioxidant activity ranged between 50% and 93%. After standardizing the data, the clustering results revealed four distinct groups of cultivars: the first group, with low antioxidant levels; the second group, with high terpenoid content; the third group, with high flavonoid, DPPH antioxidant activity, and phenolic content; and the fourth group, with elevated levels of anthocyanin, DPPH antioxidant activity, and phenolic content. A strong positive correlation was observed among DPPH antioxidant activity, flavonoids, and phenolics. Specific cultivars: The Red, OC108, and OC106 holy basil cultivars in cluster 4 exhibited high anthocyanin and phenolic production. In cluster 3, the accessions OC113, OC057, OC063, and OC059 showed high DPPH antioxidant activity, flavonoids, and phenolics, while, in cluster 2, only accessions from Udon Thani, Thailand—namely OC194 and OC195—displayed high terpenoid content. Ultimately, this study significantly contributes to the inherent diversity in the antioxidant capacities among various Thai holy basil cultivars. It lays the foundation for targeted breeding strategies and informed choices regarding consumption. The comprehensive insights from this analysis hold the potential to accurately identify holy basil cultivars with promising applications in medicine, functional foods, and the nutraceutical industry.

1. Introduction

Holy basil (Ocimum tenuiflorum L.), also known as Tulsi, is a highly regarded adaptogenic herb in traditional Ayurvedic medicine that originates from India [1]. It has been utilized for centuries due to its culinary benefits and medicinal properties, revered as the “Mother Medicine of Nature” [2]. Recent studies have highlighted several health benefits of holy basil; The herb exhibits anti-inflammatory properties [3,4], anti-microbial and anti-parasitic activities [5,6], potential anti-diabetic activities, anti-cancer properties [7], and positive effects on memory and cognitive functions [8,9]. Additionally, holy basil has been found to enhance the immune response, boosting the body’s defenses against infections [6].
Within its substantial therapeutic properties, holy basil possesses a variety of phytochemical components such as phenolics, flavonoids, phenylpropanoids, terpenoids, and essential oil [10]. Extracts from the holy basil leaves have shown high phenolic content, flavonoids, and DPPH (2,2-diphenyl-1-picrylhydrazyl) free radical scavenging activity, allowing it to neutralize free radicals that can cause cellular damage by reducing oxidative stress [11,12]. Regarding the holy basil essential oils produced and stored in glandular trichomes, the majority of the secondary metabolites present are phenylpropanoids and terpenoids, as indicated by [13]. GC-MS analysis of holy basil essential oil revealed the presence of phenylpropanoids, with the major chemical constituents including eugenol, methyl eugenol, β-caryophyllene, and β-element. These compounds contribute to the aromatic properties and therapeutic effects of holy basil essential oils [14].
There are a wide range of holy basil cultivars cultivated globally, each possessing distinct characteristics. For example, green or white holy basil is recognized by its green leaves and stems, while red holy basil exhibits dark green leaves with red-purple stems [15]. Green holy basil is predominantly cultivated and utilized as a culinary ingredient to enhance the flavor of various foods. On the other hand, red holy basil is esteemed for its medicinal properties and finds application in the pharmaceutical and cosmetic industries [16]. The red holy basil cultivar possesses significantly higher antioxidant capacities compared to the green holy basil cultivar [17]. A recent study revealed that the biomass and bioactive compounds varied among twelve Thai holy basil cultivars, with the OC064 accession showing the highest accumulation of total phenolic compounds, flavonoids, and DPPH antioxidant activity. Moreover, OC194 exhibited the highest terpenoid content [18].
In the case of the essential oils obtained from the leaves of five holy basil accessions, the accessions with a stronger aroma were found to be rich in eugenol and lacked methyl eugenol, and vice versa [19]. Among the yield variations observed in eleven holy basil accessions, the DOS-1 accession was indicated as being superior in terms of its leaf recovery, oil yield, and eugenol content, making it a promising selection for industrial applications [20]. The holy basil accessions DOS-1, DOS-19, and DOS-22, exhibiting green-color leaves, are characterized as field markers for high essential oil; however, the purple color intensity of the leaf showed a negative correlation with the essential oil content [21]. In an anti-diabetic study, sixteen Ocimum accessions representing six Ocimum species were analyzed to quantify their active compounds, including flavonoids, phenols, and terpenoids. Among these accessions, the extract of O. gratissimum with the AR-XLVI-01-13 accession demonstrated the highest efficacy in terms of its anti-diabetic properties [22]. While the phytochemical components of several plants across their varieties have been investigated, comprehensive studies focusing on the variation in the antioxidant capacities across holy basil accessions remain limited.
Clustering serves as a fundamental task in unsupervised learning, aiding in determining the inherent data distribution. Over the past few decades, various clustering analyses have emerged, including hierarchical clustering methods like agglomerative clustering [23], centroid-based approaches such as K-Means [24] and K-medoids clustering [25], distribution-based techniques like the Gaussian mixture model (GMM) [26], and density-based methods like density-based spatial clustering of applications with noise (DBSCAN) [27]. These methods have been proposed based on the quantity, quality, and type of features and samples [28]. While centroid-based and distribution-based clustering techniques are typically feasible only for convex or outwardly curved data, density-based clustering methods like DBSCAN can effectively cluster data with arbitrary shapes in high-dimensional space, which is relevant to real-world datasets [29].
However, a limitation of DBSCAN is its difficulty in handling clusters with varying densities. To address this, the ordering points to identify the clustering structure (OPTICS) algorithm was introduced as an extension of the DBSCAN algorithm [30]. OPTICS introduces two additional parameters, known as the core distance and reachability distance, to overcome different densities. It establishes a data point ordering that reflects the density-based clustering structure, presented in the reachability plot. Nevertheless, the nonexplicit outputs require further analysis procedures to enable practitioners to determine the cluster patterns [31]. OPTICS has been utilized to cluster the integration of omics data, such as disease features (e.g., genes, proteins, pathways, and variants) [32], larval instars [33], wheat genotypic data [34], and metabolic features [35].
This study aimed to provide valuable insights into the variation in the antioxidant capacities found within different types (or cultivars) and generations of holy basil. Additionally, this study aimed to employ the OPTICS clustering method to categorize the suitable types of holy basil that provide high antioxidant capacities. This comprehensive analysis has the potential to precisely identify the holy basil cultivars with potential applications in medicine, functional foods, and the nutraceutical industry.

2. Materials and Methods

2.1. Plant Material and Growth Condition

The association panel consisted of a diverse collection of 26 holy basil (Ocimum tenuiforum L.) accessions, including both standard commercially available green (Green) (BENJAMITR ENTERPRISE (1991) CO., LTD., Nonthaburi, Thailand) and red (Red) holy basil seeds (Chia Tai Co., Ltd., Bangkok, Thailand) (Table 1). The holy basil accessions in this study were kindly provided by the Tropical Vegetable Research Center (TVRC) of Kasetsart University Kamphaeng Saen Campus, Nakhon Pathom, Thailand. Seeds were germinated following the method described by [36] with minor modification. All seeds were sown on a germination sponge (ESPEC Corp., Osaka, Japan) under 150 µmol m−2 s−1 photosynthetic photon flux density (PPFD) of white LEDs for 16 hd−1 photoperiods. After 14 days, all seedlings with fully expanded leaves were transferred to a hydroponic system under a controlled environment in a plant factory using artificial lighting (PFAL) for 16 days, following the condition described by [18] before transplanting in a greenhouse. One-month-old plants—seedlings containing 2–3 true leaves (shoot height 6–10 cm),—were transplanted into commercial peat moss substrate (Hortimed SIA, Riga, Latvia) in plastic pots with a diameter of 20 cm. The plants in each pot were first supplied with 3 g of an inorganic 16-16-16 fertilizer (N P K; nitrogen, phosphorus from P2O5, potassium from K2O). The plants were grown in a greenhouse at the Plant Phenomics Center, National Center for Genetic Engineering and Biotechnology (BIOTEC), National Science and Technology Development Agency (NSTDA), Pathum Thani, Thailand. The environmental conditions in the greenhouse were 12 h d−1 photo-period with 250 µmol m−2 s−1, 28–32 °C temperature, 75–90 relative humidity (RH), and 400–800 µmol mol−1 under natural sunlight.
Holy basil plants were collected three times, as shown in Figure 1; when the plants reached full bloom each time, the first harvest was 42 days after transplant, the second harvest was 63 days after transplant, and the third harvest was 84 days after transplant. Plant samples were photographed using a hyperspectral camera (Photon Systems Instruments, spol.s r.o.; Drásov, Czech Republic). Then, the hyperspectral images were analyzed using the PlantScreenTM data analyzer software. After measuring the hyperspectral camera, plants canopy leaves were harvested and used for plant secondary metabolite analysis.

2.2. Measurements of Biochemical Compounds

2.2.1. Sample Extraction

Plants canopy leaves were dried at 40 °C for 72 h. Leaf tissue was ground to a fine powder using a pestle. Plant extractions were performed using a modified method [13,37]. Plant extraction was conducted on 10 mg of fine powder with 5 mL of absolute methanol solvent (Methanol, 99.9%, HPLC, FISHER) containing 1% HCl. The extracted solution was absolutely mixed using a vortex and incubated at 25 °C for 3 h. Then, the mixture was centrifuged using an Eppendorf Centrifuge 5810R with rotor F-34-6-38 (6 × 125 g) at 15,249× g for 5 min. Finally, the supernatant was separated and transferred into another 2 mL microcentrifuge tube. After extraction, the extractive solution was analyzed for the content of total phenolics, total flavonoids, and DPPH radical scavenging activity.

2.2.2. Anthocyanin Content

The measurement of the anthocyanin content was conducted using a spectrophotometer with minor modification, as described in [13,38]. First, 600 µL of 1% HCl in methanol was added into 50 mg of fine powder. The extract solution was incubated in the dark at 25 °C for 3 h. After incubation, 400 µL of deionized water and 400 µL of chloroform were added and thoroughly mixed. The mixture was centrifuged at 10,621× g at 25 °C for 5 min. The supernatant solution was pipetted into a microplate for spectrophotometer analysis (Multiskan Sky, Thermo Fisher Scientific Inc., Waltham, MA, USA) at 530 and 657 nm. The anthocyanin content was calculated using the absorbance formula, A530 − (0.33 × A657), and the result was presented as the relative anthocyanin concentration in an absorbance unit (AU).

2.2.3. DPPH Free Radical Scavenging Activity

The free radical scavenging activity of holy basil was assayed using a minor modified approach, following the procedure described by [13,37], using the free radical 2,2-diphenyl-1-picrylhydrazyl (DPPH). First, 100 µL of the extracted solution was added into 900 µL of 0.1 mM DPPH. The reaction solution was thoroughly mixed and incubated in the dark at 25 °C for 30 min. Then, the mixture was centrifuged at 15,249× g for 2 min. The homogenate solution was detected using a spectrophotometer (Multiskan Sky, Thermo, Scientific) at 515 nm. We used 0.5 mM of Trolox as a reference antioxidant. The antioxidant activity was presented as the percentage of DPPH scavenging through the equation: (Acontrol-A515)/Acontrol) × 100 [39,40], where: Acontrol—Control reaction absorbance.

2.2.4. Flavonoid Content

Quantification of the total flavonoid content in holy basil samples was determined using the modified colorimetric approach, following [13,37]. First, 350 µL of the extracted solution was mixed with 75 µL of 5% sodium nitrite (NaNO2) in a 1.5 mL microcentrifuge tube, and the mixture was centrifuged at 25 °C and 12,000 rpm for 2 min. The mixture solution was incubated at room temperature for 5 min; 75 µL of 10% aluminium chloride (AlCl3·6H2O) was added and completely mixed through vortex. The reaction mixture was centrifuged as before and left to stand for 5 min at room temperature. Then, 500 µL of 1 M sodium hydroxide (NaOH) was added and left at 25 °C for 15 min. The solution absorbance was determined at 515 nm using a spectrophotometer (Multiskan Sky, Thermo, Scientific), using the standard range of 0–2 mg/mL for rutin (2, 1, 0.8, 0.6, 0.4, 0.2 and 0.1 mg/mL). The standard curve of rutin solution dissolving in dimethyl sulfoxide (DMSO) was used to determine the total flavonoid content, and the result was presented as milligrams of rutin equivalents per gram dry weight (DW) of the sample.

2.2.5. Phenolics Content

Modified Folin-Ciocalteu colorimetric techniques were used to quantify the total phenolics content in holy basil plants [13,37]. First, 200 μL of the 1 N Folin-Ciocalteu reagent was mixed to 200 μL of the extracted solution, then incubated at 25 °C for 1 h. Next, 600 μL of 7.5% of sodium carbonate (Na2CO3) was added for neutralization. The absorbance of the solution was measured at 730 nm using a spectrophotometer (MultiskanSky, Thermo Scientific), using the standard range of 0–250 µg/mL for gallic acid (250, 125, 62.5, 31.25, 15.63, 7.8, 3.9, 1.9 and 0.97 μg/mL). Gallic acid solution was dissolved in water to prepare and fit the calibration curve. The total phenolics content concentration was calculated as milligrams of gallic acid equivalent (mg GAE) per gram DW of the sample.

2.2.6. Terpenoid Content

Quantification of the terpenoids content of holy basil was determined using a modified method [18,41]; sample extraction was obtained by combining 100 mg of fine powder sample with 99.9% methanol. The extracted solution was combined using a vortex prior and sonicated at 40 °C for 10 min. The extract solution was incubated in the dark at 25 °C for 48 h and was centrifuged at 4487× g at 25 °C for 15 min. Subsequently, 200 μL supernatant was separated and then transferred to a new micro centrifuge (2.0 mL) to verify the total terpenoid content, adding 1.5 mL of chloroform. The extract samples were thoroughly mixed and incubated at 25 °C for 5 min. Then, 100 µL of concentrated sulfuric acid (H2SO4) was added without mixing, and the mixture was then left at 25 °C in the dark for 2 h. A reddish-brown precipitate formed after the incubation period, and all of the reaction mixture supernatant was gently pipetted. Next, 1.5 mL of 99.9% methanol was added and mixed through vortex until all the precipitate was dissolved. Then, the mixture solution was centrifuging at 15,249× g for 10 min. Finally, 99.9% methanol was used as a control, and the absorbance solution was measured at 540 nm using spectrophotometer analysis (Multiskan Sky, Thermo, Scientific) with the standard range of 0–870 mg/mL for linalool (870, 522, 435, 313.2, 187.9, 112.8, 108.8, 67.6, 54.3, 13.6, 7.7, 6.8, 3.4, 2.8, and 0.2 mg/mL). The total terpenoids content was calculated using a regression equation from the linalool standard curve. The result was presented as milligrams of linalool per gramme of DW.

2.3. Statistical Analyses

The dataset contains 384 samples, representing 26 holy basil cultivars retrieved from three generations in the controlled cultivation. This study aims to elucidate the variations in the bioactive compound contents, including anthocyanin, flavonoid, phenolic, and terpenoid content, as well as DPPH antioxidant activity. Statistical analyses were performed in Python, version 3.9.7. The ‘scipy.stats’ module was utilized to summarize descriptive statistics of the antioxidant capacities providing the central tendency, distribution, and variability of antioxidant capacities. The Shapiro-Wilk test was applied to assess the normality of the antioxidant activities using the ‘shapiro’ function. This test determines whether the data follow a normal distribution at a significance level of 0.05. By using the ‘bartlett’ function, Bartlett’s test was utilized to determine the homogeneity of variances at a significance level of 0.05. In cases where the data violate the assumptions of normality or equal variances, the Kruskal-Wallis test was typically utilized using the ‘kruskal’ function. This non-parametric test was applied to assess the equality of medians across the cutting generations. It serves as an alternative to the parametric analysis of variance (ANOVA) test. In the event of rejecting the Kruskal-Wallis test null hypothesis, indicating a statistically significant difference among the medians of the three generations, Conover’s test was performed for post hoc pairwise multiple comparisons using the ‘posthoc_conover’ function from ‘scikit_posthocs’ module. This procedure indicates the median pairwise difference at a significance level of 0.05.

2.4. OPTICS Clustering and Evaluation

In the data preprocessing stage, we resolved missing values through removal and standardized the antioxidant targets, thereby rescaling the attributes for comparability. The samples were individually normalized to have a unit norm, resulting in vectors with a length of 1. The normalized data aid in the subsequent clustering analysis of holy basil cultivars. The OPTICS algorithm was applied to cluster the 26 holy basil cultivars into several groups sharing similar characteristics of five antioxidant capacities by using the ‘OPTICS’ function from the Scikit-learn module [42] available in Python.
The OPTICS algorithm was developed as a DBSCAN concept extension. Conceptually, DBSCAN initially determines all clusters and their core points. Then, the clusters were expanded by all density-reachable points using the concept of ε -neighborhood [27]. However, the notable drawback of DBSCAN is the inability to cluster varying density data due to the determined combination of the maximum neighborhood radius ( ε ) and density threshold ( M i n P t s ) parameters. The OPTICS algorithm addresses the fixed density threshold limitation of DBSCAN by introducing the core distance and reachability distance concepts [30]. OPTICS retains the same parameters as DBSCAN but makes the ε parameter optional for runtime complexity reduction. This algorithm is known for its versatility in generating high-quality clusters and its ability to classify noises in varying-density data [29,33]. To describe OPTICS, we introduced two additional parameters; namely, the core distance and reachability distance.
Definition 1.
Core distance. Core distance is the minimum neighborhood radius given that the neighborhood is not less than the determined density threshold;  M i n P t s  is defined as follow:
c d p ; ε , M i n P t s = U N D E F I N E D ,   i f   N ε p < M i n P t s d p , N ε M i n P t s p ,   i f   N ε p     M i n P t s
where  N ε p  is the set of samples including  ε -neighborhood of sample  p ;  N ε p  is the number of  N ε p ;  N ε i p  is the  i t h  nearest of sample  p ;  d ( p , q )  is the distance between samples  q  and  p .
Definition 2.
Reachability distance. The reachability distance of sample  q  relative to sample  p  is the minimum neighborhood radius that makes  q  directly density-reachable from  p , it is defined as follows:
r d q , p ; ε , M i n P t s = U N D E F I N E D ,   i f   N ε p < M i n P t s max c d p ,   d p , q ,   i f   N ε p     M i n P t s
where  r d ( q , p )  relates to density in the area of  q , and larger density indicates a smaller distance.
In Definition 1, the Core Distance represents the minimum radius required to classify a specific point as a core point within the OPTICS clustering algorithm. In cases where the given point fails to meet the criteria for core point classification, its Core Distance remains undefined. Secondly, Definition 2 defines the reachability distance concerning another data point, denoted as q. The reachability distance between point p and q is the maximum of two values: the core distance of point p and the Euclidean distance between points p and q. It is crucial to emphasize that the reachability distance is only defined when point q qualifies as a Core point within the OPTICS analysis.
As an unsupervised learning task for generating new groups, there is no ground truth or known labeling of the dataset. When evaluating OPTICS clustering algorithms, the Silhouette coefficient [43], Calinski-Harabasz index [44], and Davies-Bouldin index [45] can be utilized to assess the model performance and estimate the OPTICS parameters: MinPts or ‘min_samples’ from 3 to 9 represent the number of samples in a neighborhood for a point to be considered as a core point, and ‘min_cluster_size’ from 3 to 25 contribute to the minimum number of samples required in an OPTICS cluster. The Silhouette coefficient measures the quality of clustering by considering both the cohesion and separation of clusters; it ranges between −1 and 1, where values closer to 1 indicate well-separated and distinct groups. The Calinski-Harabasz index measures the ratio of between-cluster dispersion to within-cluster dispersion. Higher index values indicate better-defined clusters. The Davies-Bouldin index evaluates the quality of clustering based on the average dissimilarity between clusters. Lower values determine better clustering, with zero being the best score. Gaining insights from the clustering, we created and visualized the reachability-distance plot for each antioxidant target representing the relationship between data points and their neighboring points, including the principal component analysis (PCA), by using the ‘PCA’ function from the Scikit-learn module [42]. Then, we performed statistical analyses on the cultivar clusters and indicated the holy basil cultivars with the highest average antioxidant accumulation compared among cutting generations.

3. Results

3.1. Exploration of Antioxidant Capacities and Distributions

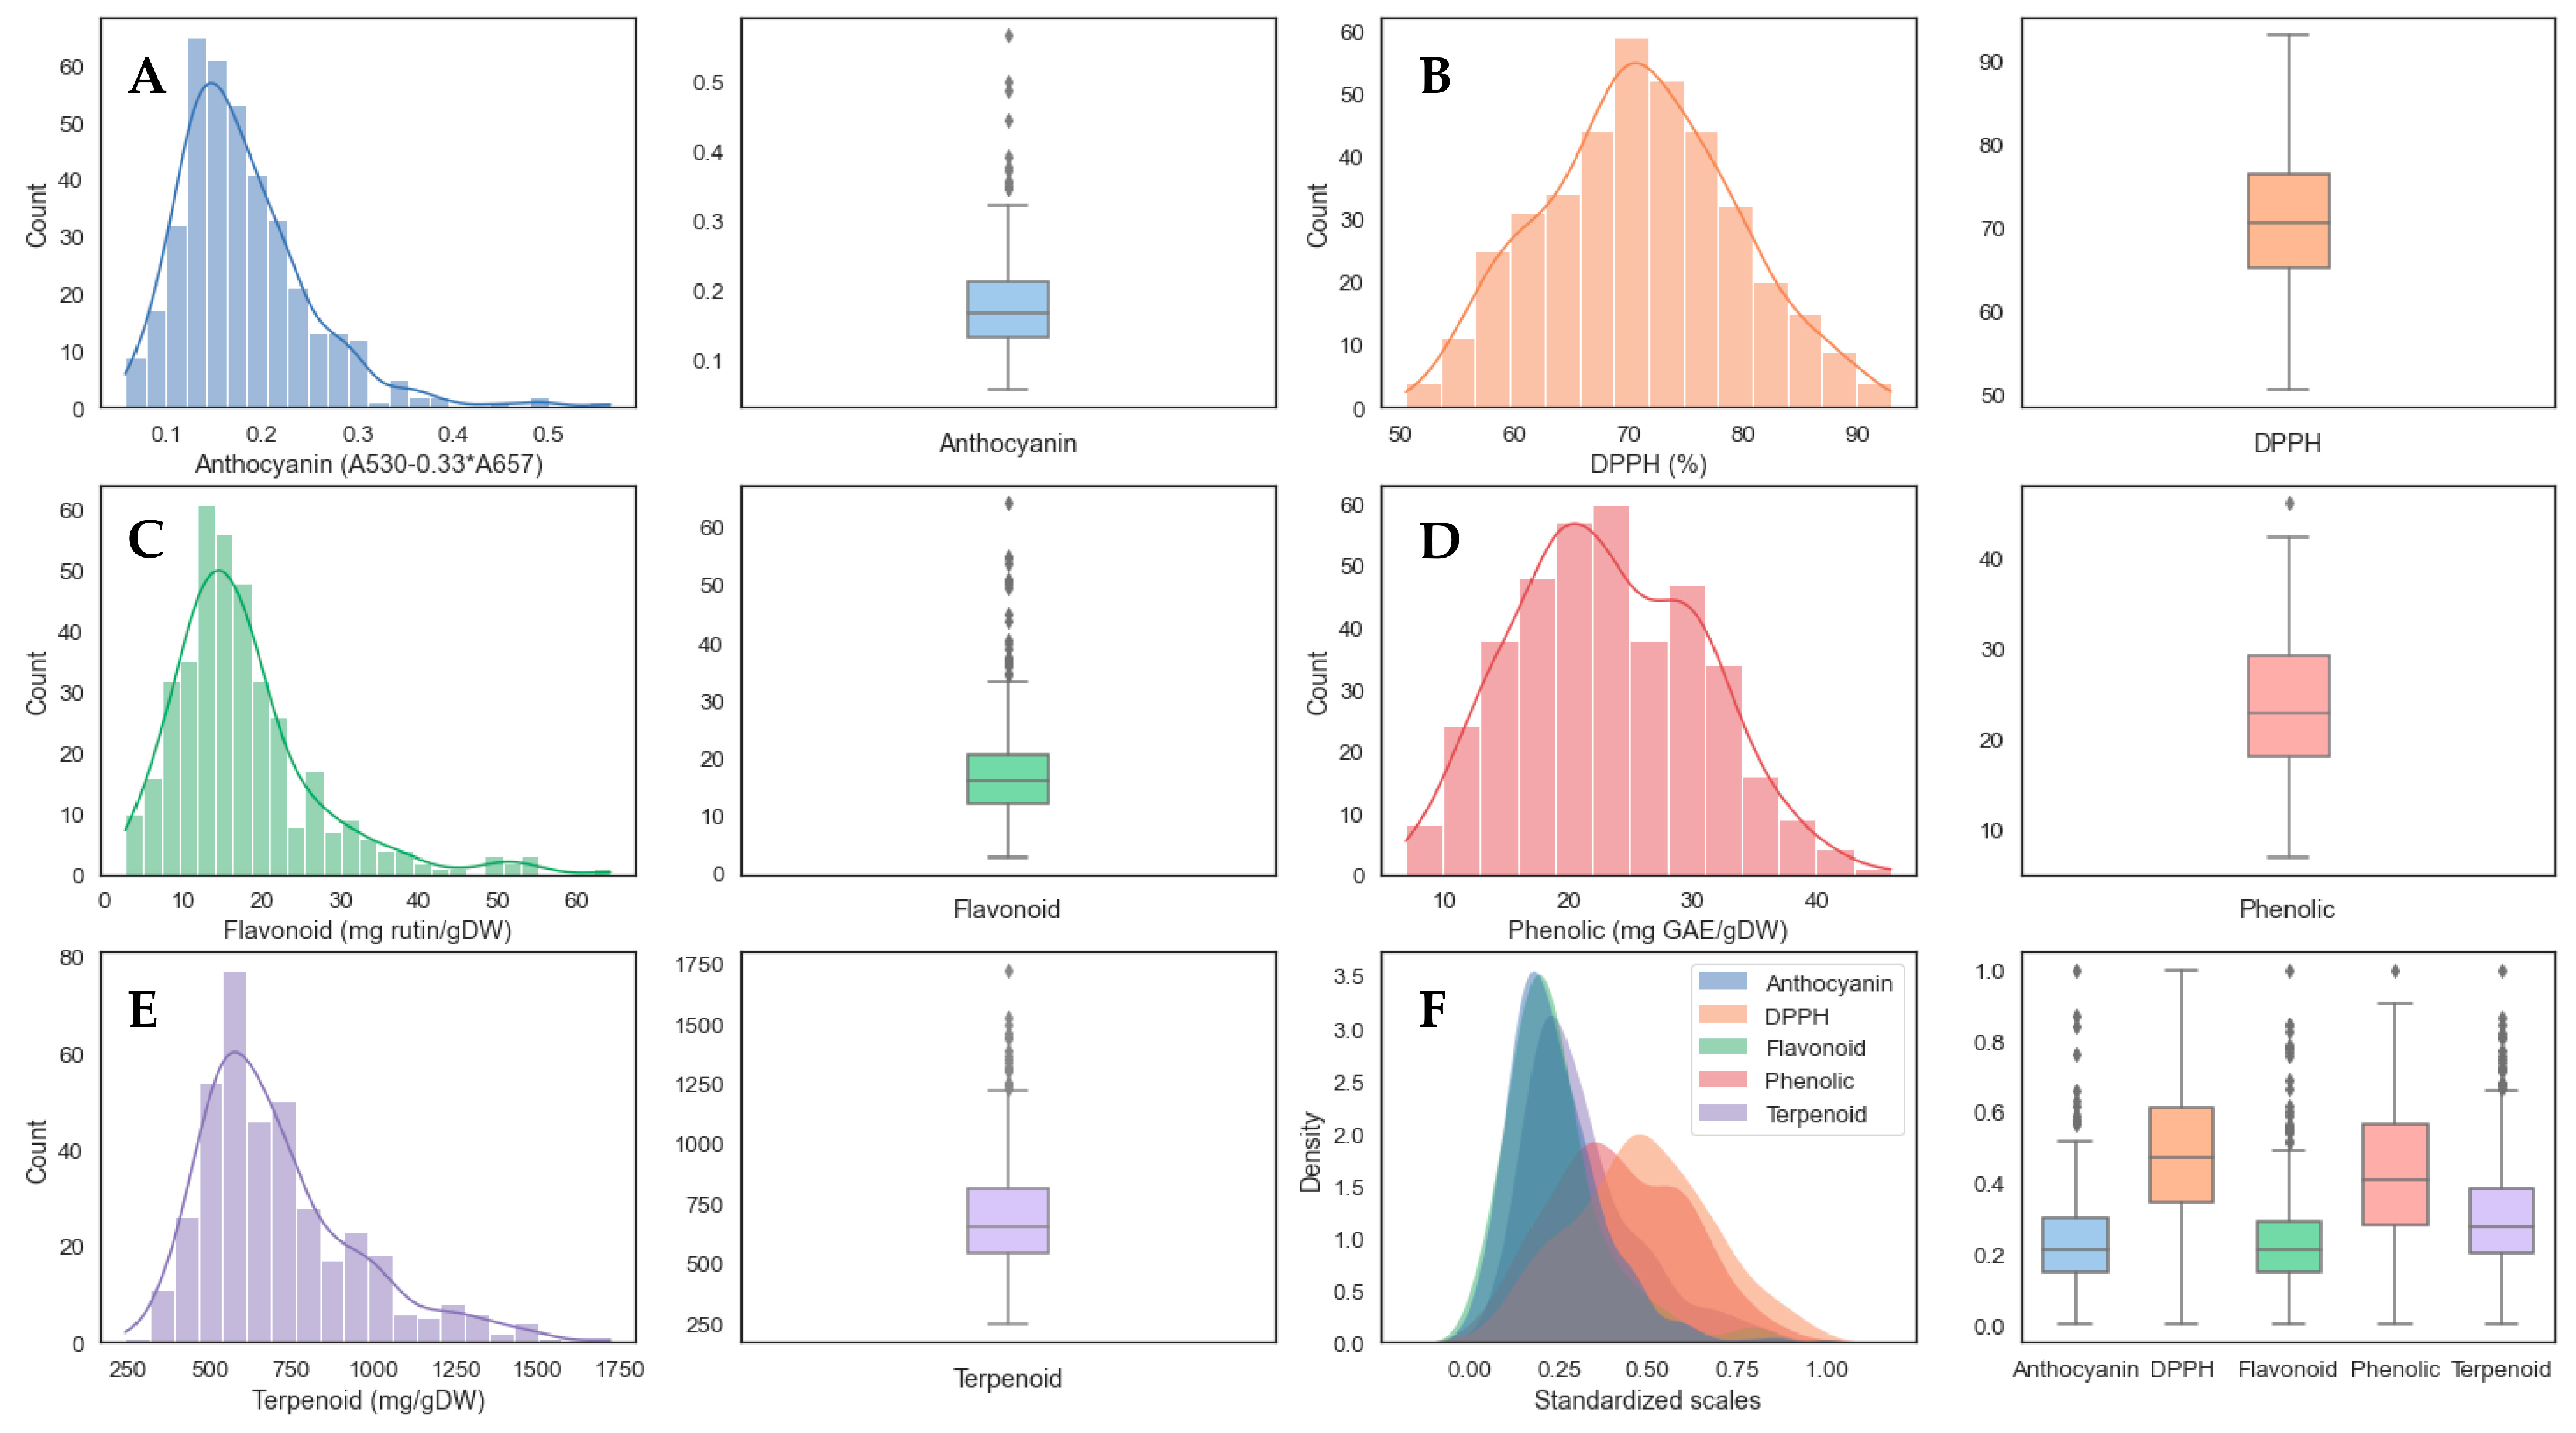
During the exploratory analysis of the dataset, we observed distinct ranges and distributions among the various antioxidant capacities, as detailed in Table 2 and illustrated in Figure 2. The average anthocyanin content detected was approximately 0.18 mg/gDW. To measure the antioxidant activity in the holy basil, the DPPH assay was employed, revealing an average antioxidant activity of around 70.96% in the Thai holy basil cultivars. Moderate levels of flavonoids, ranging between 2.76 and 64.18 mg rutin/gDW and with an average content at 17.58 mg rutin/gDW, were detected, similar to the presence of phenolics, which are widely studied antioxidants. However, the average phenolic content was approximately 23.19 mg GAE/gDW. Intriguingly, a substantial presence of terpenoids, ranging between 243.26 and 1721.48 mg/gDW, was found in the Thai holy basil (as shown in Table 2). Noteworthy cultivars of holy basil, including OC194 (Udon Thani) and OC195 (Kumphawapi, Udon Thani), exhibited remarkable terpenoid production. Despite the diverse measurement ranges for these antioxidant constituents, we standardized their values to a uniform range of 0 to 1 using the min-max scaling technique, as illustrated in Figure 2F. Of special interest is the significantly abundant terpenoid production, with certain holy basil cultivars displaying notably higher quantities, namely those originating from OC194 (Udon Thani), OC195 (Kumphawapi, Udon Thani), OC057 (Damnoen Saduak, Ratchaburi), OC063 (Chai Badan, Lopburi), and OC059 (Kamphaeng Saen, Nakhon Pathom).
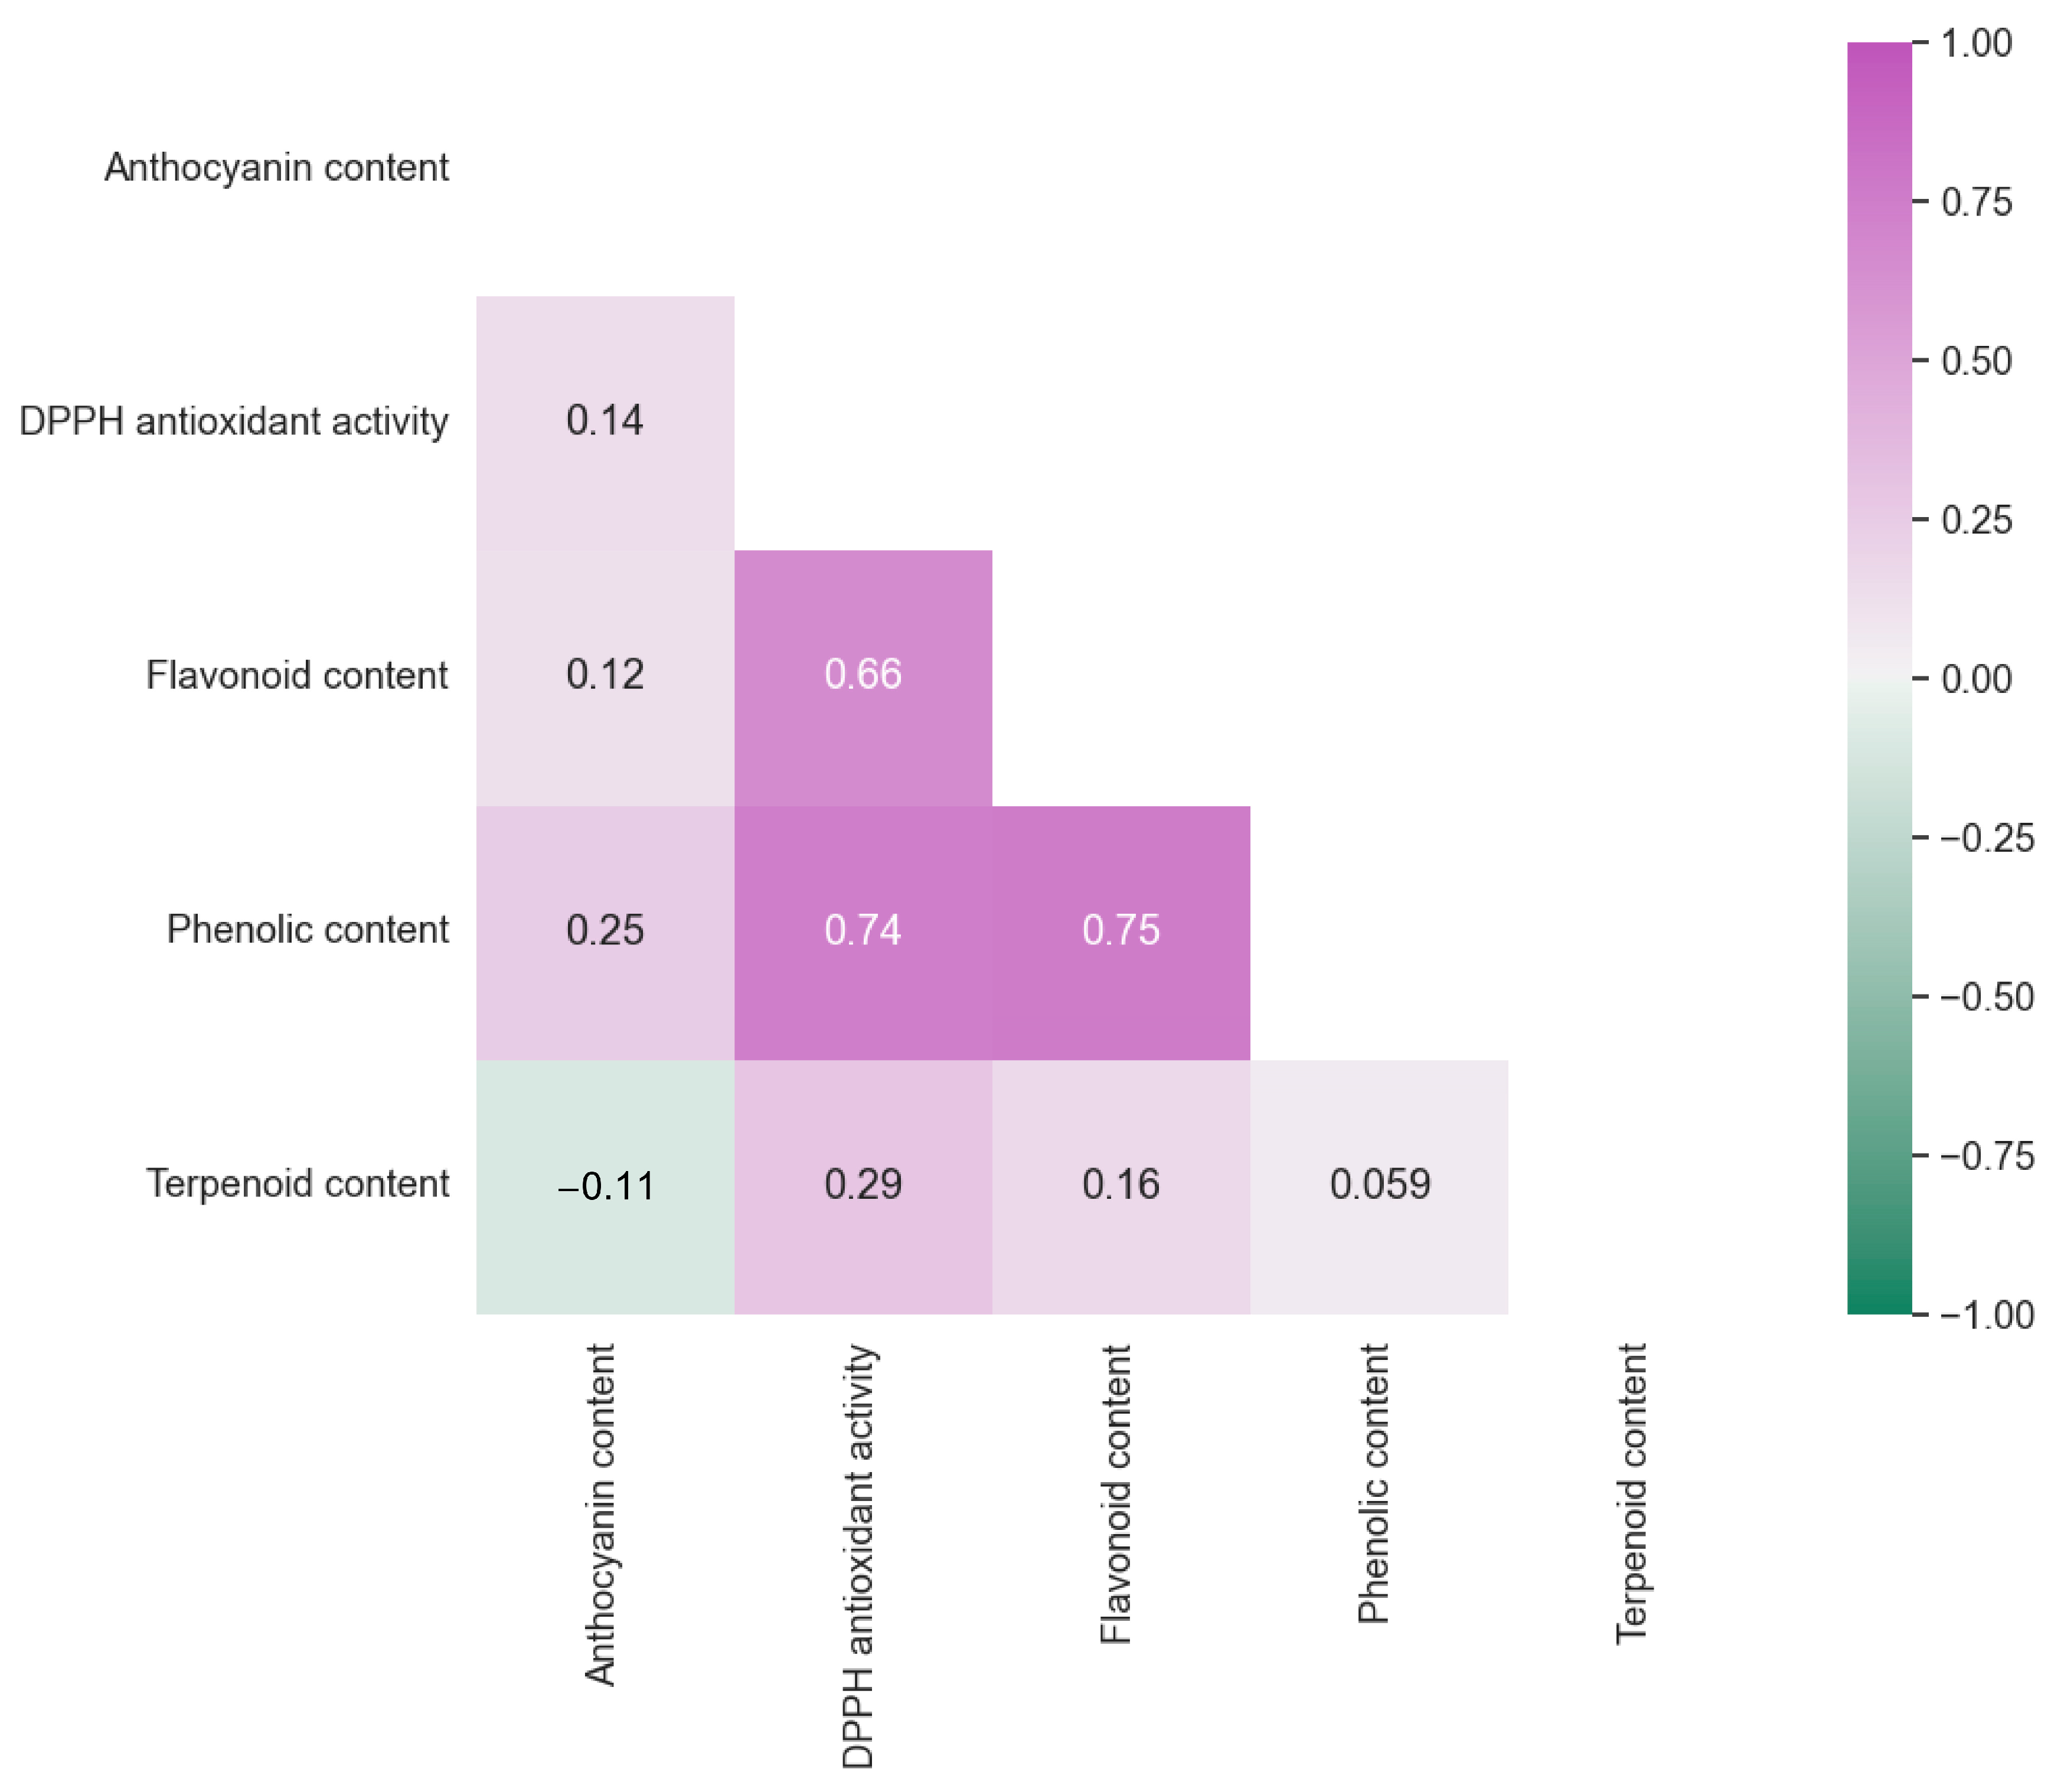
The correlation among the antioxidants is depicted in the heatmap in Figure 3. Strongly positive correlations were observed among three main antioxidants: DPPH activity, flavonoid contents, and phenolic contents. In this research, we conducted DPPH, Folin-Ciocalteu, and AlCl3 assays to assess the antioxidant activity, total phenolic content, and flavonoid content, respectively. These three assays rely on colorimetric principles, gauging the ability of aromatic and hydroxylated compounds to counteract free radicals, hinder Folin reactivity, or form complexes with AlCl3. It is important to note that these assays lack specificity towards any particular compound group (with partial specificity in the case of the AlCl3 test) and may be susceptible to various interferences. For instance, both ascorbic and dehydroascorbic acids yielded positive results in the DPPH and Folin assays, which contributes to the strong correlations observed among these three colorimetric tests. In contrast, anthocyanins and terpenoids did not exhibit a significant correlation with the DPPH antioxidant activity, as their respective tests are considerably more specific. It is worth highlighting that while the total phenolic content is a valuable parameter, it should not be solely relied upon to quantify the overall antioxidant activity. Nonetheless, in this study, we specifically extracted and quantified total phenolic compounds from Thai holy basil. This information is of particular interest for further exploration and analysis in the context of the pharmaceutical research and various industries seeking essential compound data.

3.2. Parameter Optimization for the OPTICS Clustering Algorithm

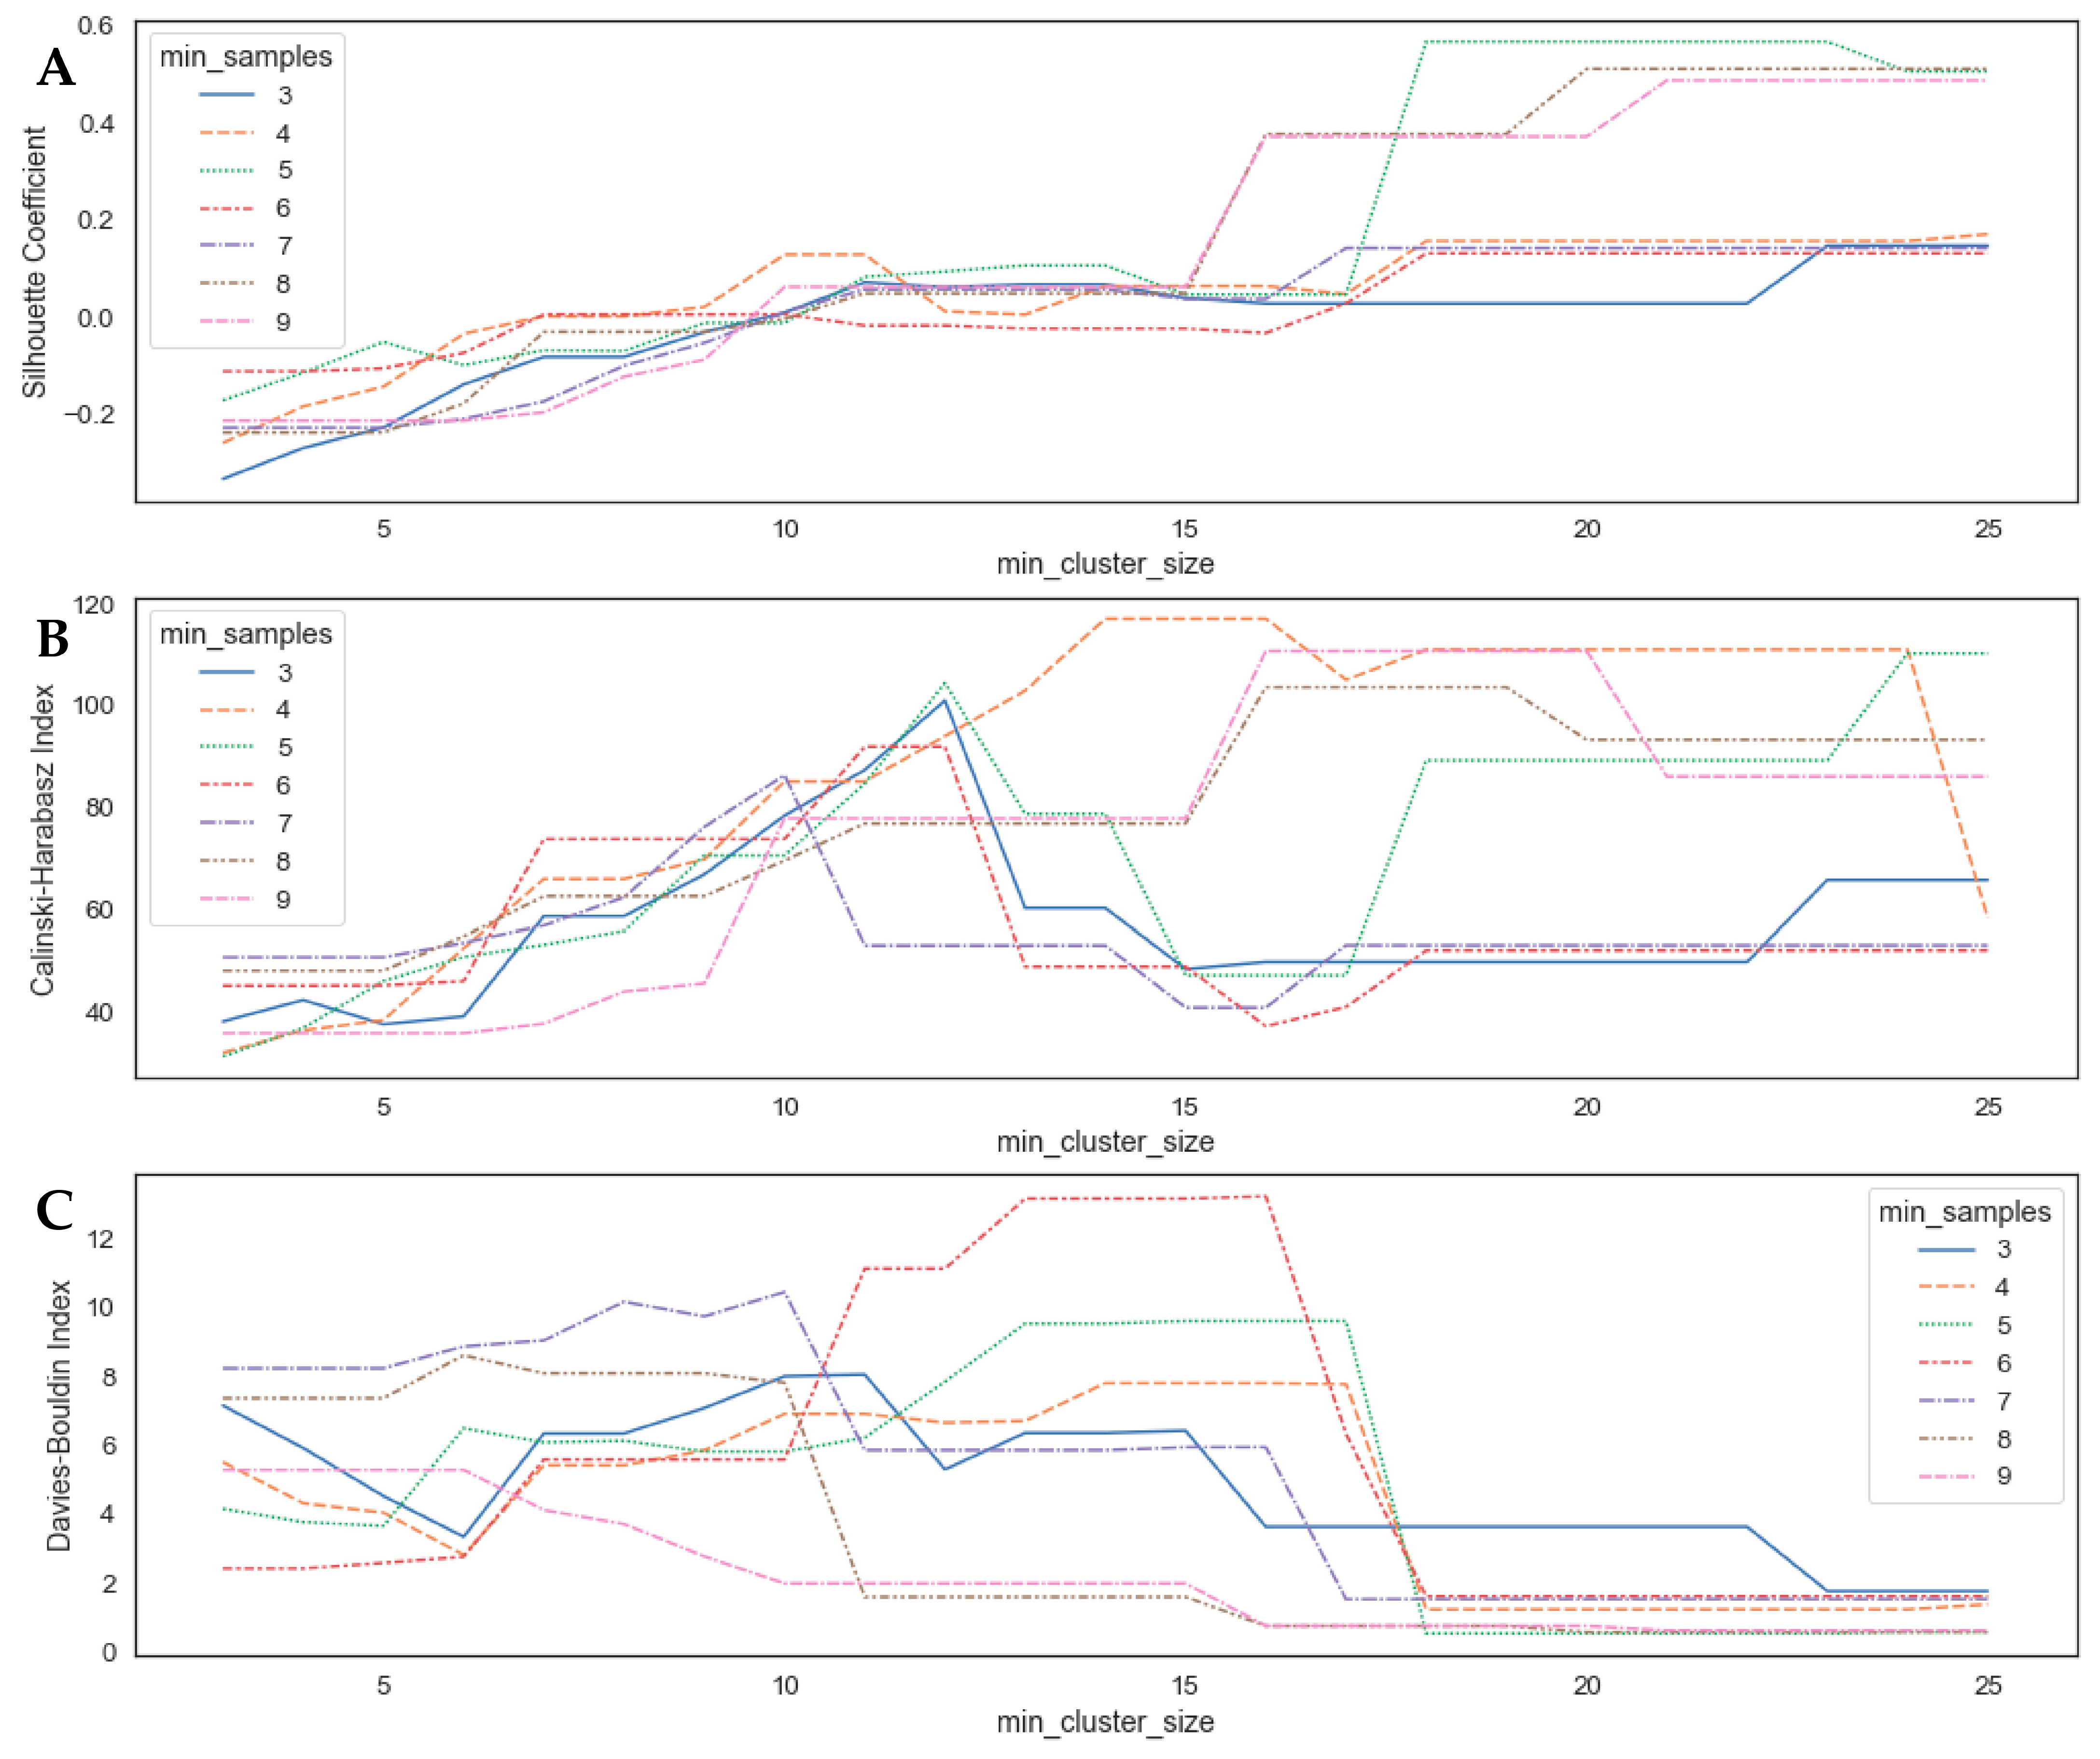
We utilized the Silhouette coefficient, Davies-Bouldin index, and Calinski-Harabasz index as performance metrics to determine the optimal ‘min_samples’ and ‘min_cluster_size’ parameters within the OPTICS algorithm. Figure 4 illustrates the performance of the OPTICS model in clustering holy basil cultivars based on the Silhouette coefficient (A), Calinski-Harabasz index (B), and Davies-Bouldin index (C). The Silhouette Coefficient measures how well data points within a cluster are grouped together compared to the distance to the data points in the nearest neighboring cluster. A higher value signifies a more distinct and well-defined cluster arrangement. The Calinski-Harabasz Index quantifies the distinction between clusters by evaluating the dispersion between clusters in comparison to the dispersion within clusters. A higher score indicates more clearly defined clusters. The Davies-Bouldin Index assesses the cluster sizes in relation to the average inter-cluster distance, with a lower score signifying more well-defined clusters.
Our experimentation revealed that the ‘min_cluster_size’ parameter within the range of 21 to 23, coupled with ‘min_samples’ values of 5, 8, and 9, yielded two distinct and well-defined groups of cultivars with the highest Silhouette Coefficient. However, increasing the parameter values led to fewer well-defined clusters, resulting in reduced information. By systematically evaluating the model’s performance across various parameter pairs, we identified that a ‘min_samples’ value of 4 and a ‘min_cluster_size’ of 24 were optimal. This configuration resulted in four cultivar groups, providing a detailed insight into the terpenoid content. The corresponding index values were as follows: Silhouette coefficient of 0.16, Calinski-Harabasz index of 111.49, and Davies-Bouldin index of 1.24.

3.3. Clustering Analysis and Identification of Cultivar Groups in Holy Basil

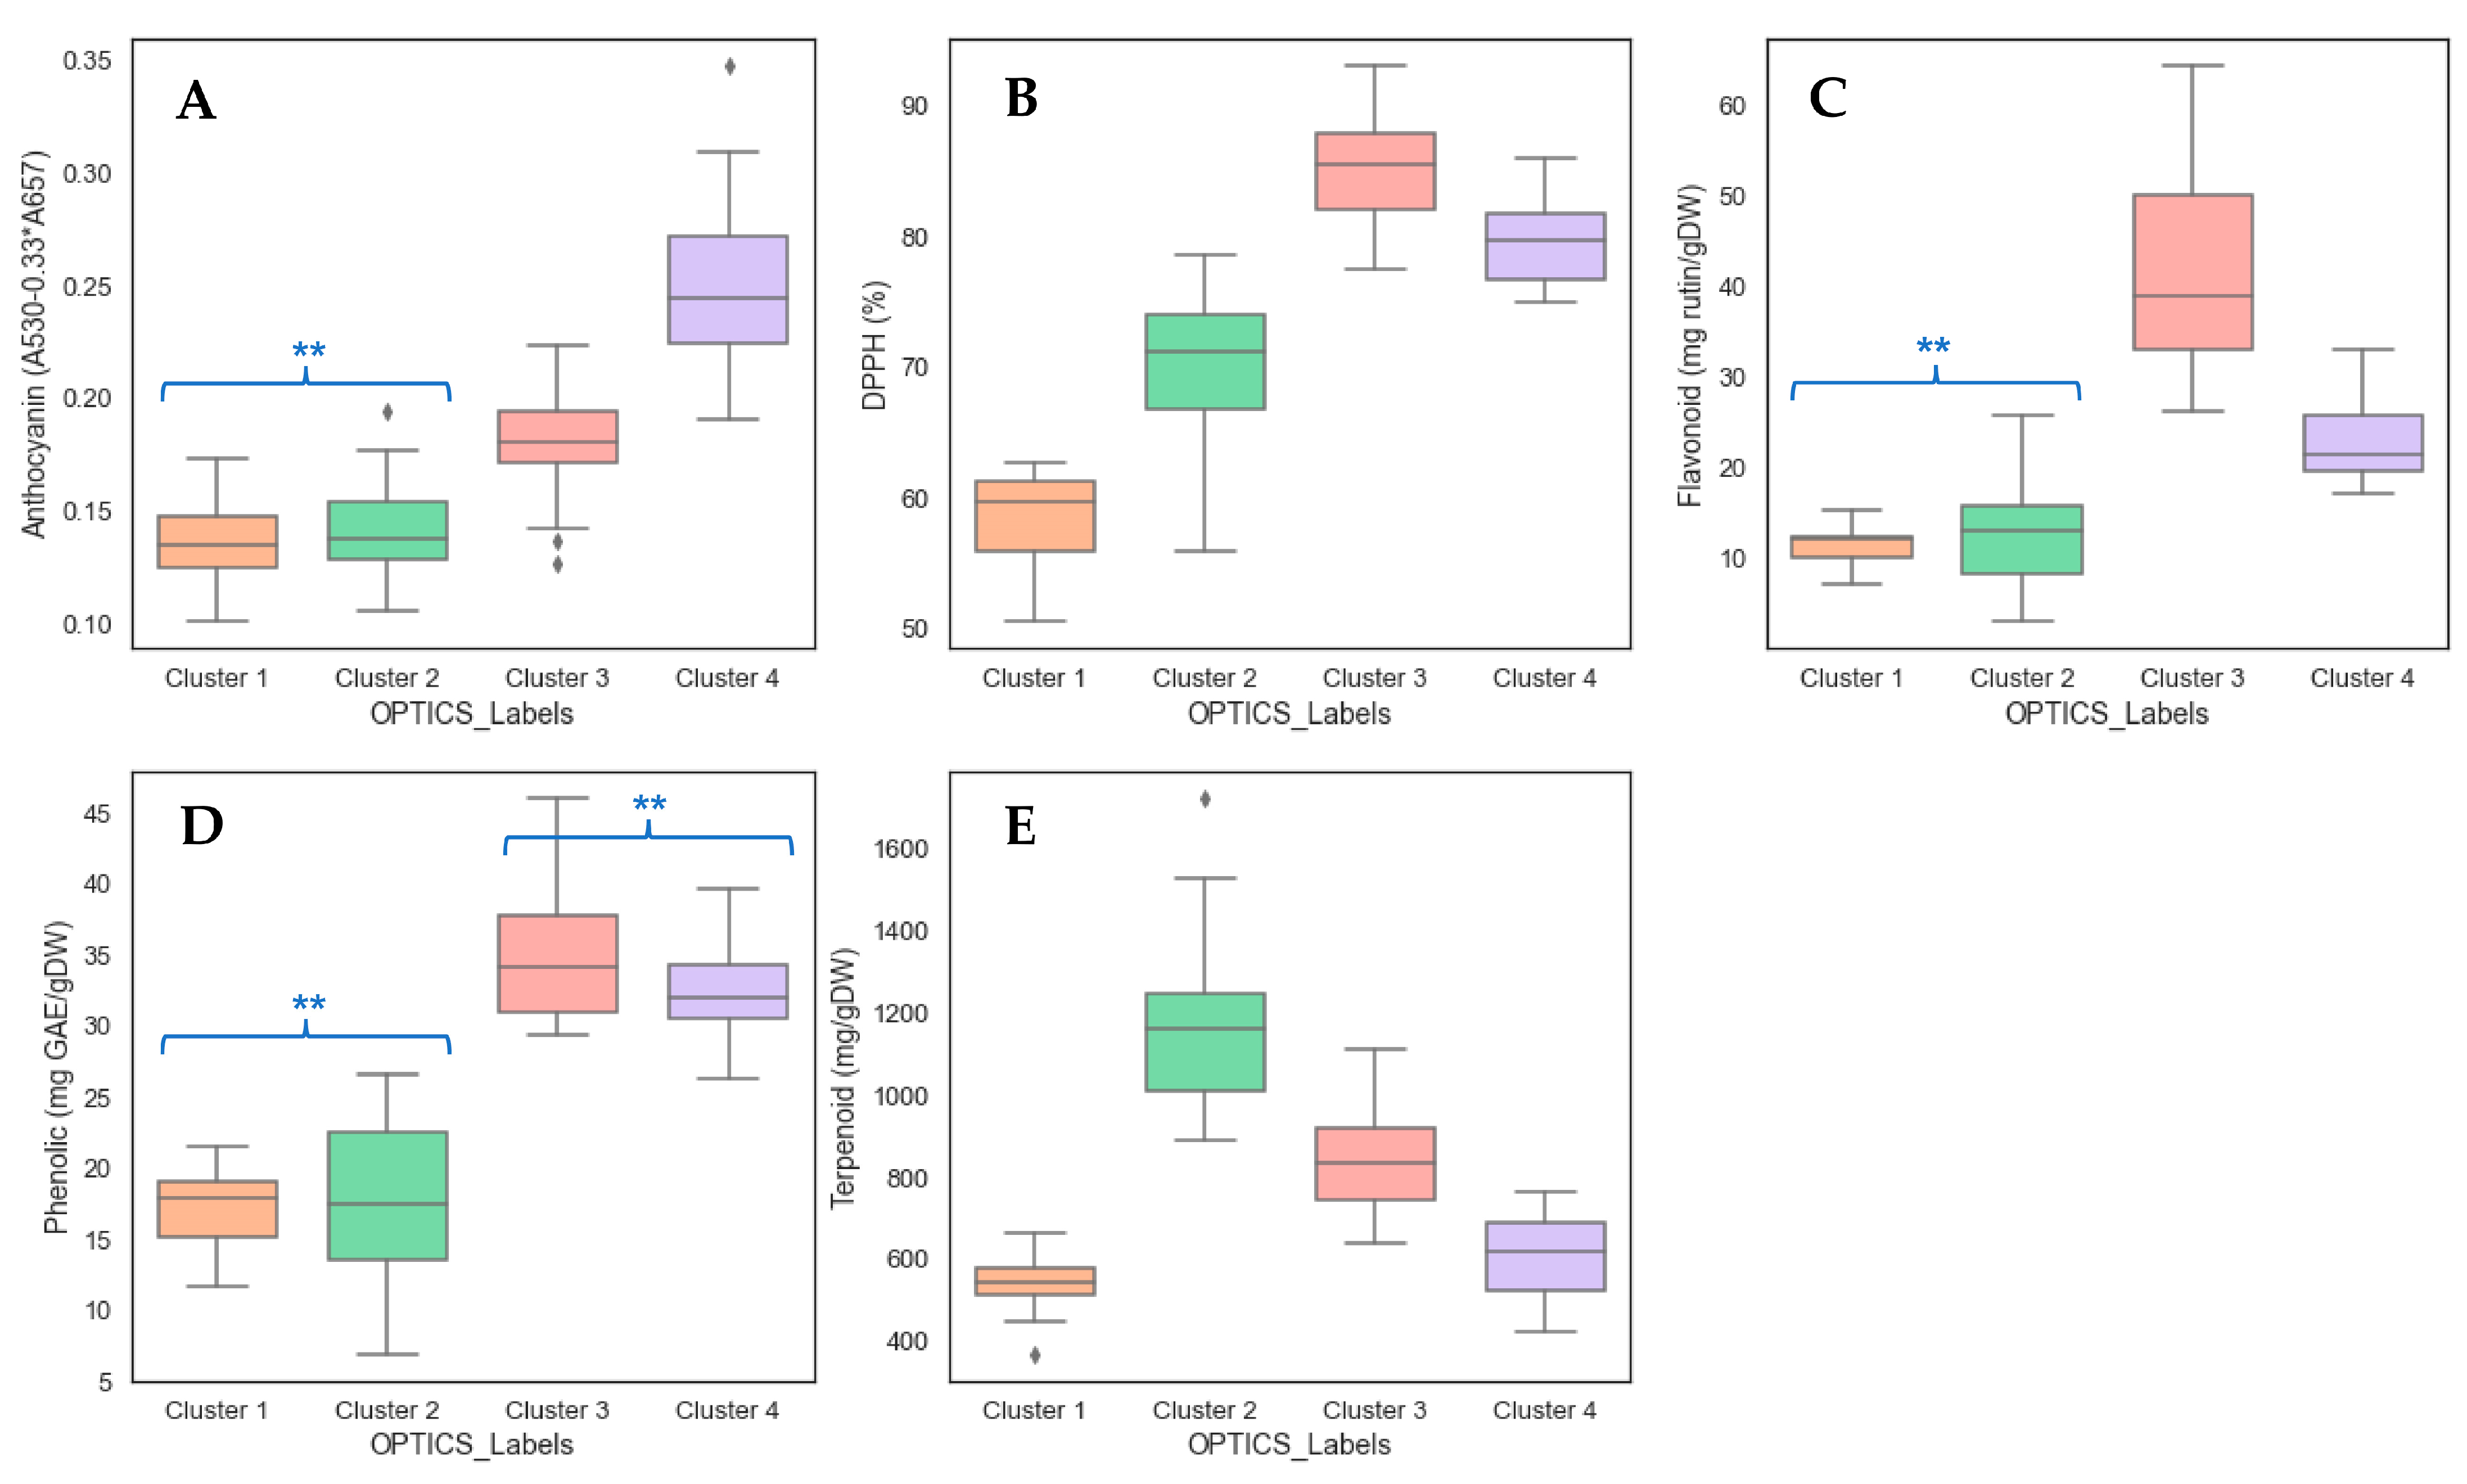
The subsequent application of the OPTICS clustering algorithm to the dataset resulted in the creation of a reachability plot. This visual representation delineates the distances from each data point to the core point of its respective cluster, as exemplified in Figure 5. The valleys evident within the reachability plot indicate regions of elevated density across the five antioxidant capacities. Smaller reachability distances correspond to a higher concentration within a particular cluster. The peaks visible in the plot indicate data points that are distanced from core points, effectively singling them out as outliers or points of divergence. Furthermore, the holy basil cultivars were effectively categorized into four distinct clusters (cluster 1–4), as identified and showcased in the boxplot presented in Figure 6. This comprehensive approach contributes to a more accurate interpretation of the data’s underlying patterns and variations, enhancing the overall reliability of the clustering results.
Among the 26 holy basil cultivars examined, four cultivars (OC097, OC101, OC135, and OC102) formed a distinct noise cluster, deviating from the main clustered points. Cluster 1 is characterized by lower antioxidant capacities across all of the measured metrics and encompasses nine holy basil cultivars: Green, OC095, OC099, OC105, OC130, OC133, OC139, OC141, and OC148. Additionally, a notable positive correlation (correlation coefficient of 0.718) was identified between the flavonoid content and phenolic content. Moving to Cluster 2, it comprises eleven holy basil cultivars: Green, OC057, OC059, OC064, OC081, OC104, OC130, OC133, OC141, OC194, and OC195.
This cluster demonstrates higher antioxidant capacities specifically in the terpenoid content. Within Cluster 2, a robust positive correlation (correlation coefficient of 0.748) is observed between the phenolic content and both the flavonoids and DPPH antioxidant activity. Moreover, a strong linear relationship (correlation coefficient of 0.882) exists between the flavonoid content and DPPH antioxidant activity.
Cluster 3 is composed of nine cultivars: OC057, OC059, OC063, OC064, OC072, OC081, OC113, OC130, and OC141. This cluster showcases the highest antioxidant capacities in terms of the phenolic content, flavonoid content, and DPPH radical scavenging activity. Importantly, strong positive correlations and linear relationships (with correlation coefficients around 0.75 to 0.80) exist among the flavonoids, DPPHantioxidant activity, and phenolic contents within Cluster 3. In Cluster 4, nine holy basil cultivars are grouped: Green, OC059, OC106, OC108, OC130, OC139, OC141, OC148, and Red. This cluster exhibits elevated antioxidant capacities in the phenolic content, DPPH radical scavenging activity, and anthocyanin content. However, it demonstrates relatively lower values in the flavonoid content and terpenoid compounds. Within Cluster 4, the phenolic content is positively correlated with the DPPH antioxidant activity and anthocyanin content at correlation coefficients of 0.865 and 0.674, respectively. Additionally, a positive correlation (correlation coefficient of 0.705) exists between the DPPH antioxidant activity and anthocyanin content. These detailed associations and variations among the clusters provide valuable insights into the diverse antioxidant profiles of different holy basil cultivars.
During the analysis, two cultivars, OC130 and OC141, were observed in all clusters (1–4), but they were deliberately classified as varied antioxidant accessions to avoid potentially misleading interpretations. Notably, the green holy basil cultivars were identified in clusters 1, 2, and 4, while the OC059 accession appeared in clusters 2, 3, and 4. OC133 was assigned to both cluster 1 and 2, characterized by a high terpenoid content and low levels of the other compounds. Interestingly, the accessions OC148 and OC139 were concurrently present in clusters 1 and 3. In clusters 2 and 3, three cultivars (OC057, OC064, and OC081) shared common attributes. Exclusive to Cluster 1 were the accessions OC095, OC105, and OC099, while Cluster 2 solely encompassed OC194, OC195, and OC104. Within Cluster 3, the cultivars OC113, OC063, and OC072 were exclusively situated. Finally, in Cluster 4, the accessions OC108, OC106, and the red cultivars were grouped together. This categorization provides valuable insights into the distribution and associations of these holy basil accessions across different clusters based on their distinct characteristics.
To examine the variations among the cultivar clusters regarding their antioxidant capacities, the normality of distribution was assessed using the Shapiro-Wilk test. This evaluation revealed that the majority of the antioxidant capacities within each cultivar cluster exhibited a normal distribution, except for DPPH in cluster 1 and flavonoids in cluster 4, which displayed significant deviations from the normal distribution patterns. Subsequently, leveraging the Bartlett’s test and Kruskal-Wallis test, it was found that all antioxidants exhibited unequal variances and statistically significant differences in their medians across the cultivar clusters. To delve deeper into these disparities, pairwise multiple comparisons were performed using Conover’s test. The outcomes highlighted pairs of cultivar clusters with insignificant differences for specific cultivars, as depicted in Figure 6. Notably, these pairs encompassed cluster 1 and cluster 2 in terms of the phenolic content, flavonoid content, and anthocyanin content, all at a significance level of 0.05. Furthermore, clusters 3 and 4 exhibited no statistically significant difference in their phenolic content. This comprehensive analysis provides a detailed understanding of the nuances in the antioxidant capacities among the different cultivar clusters.
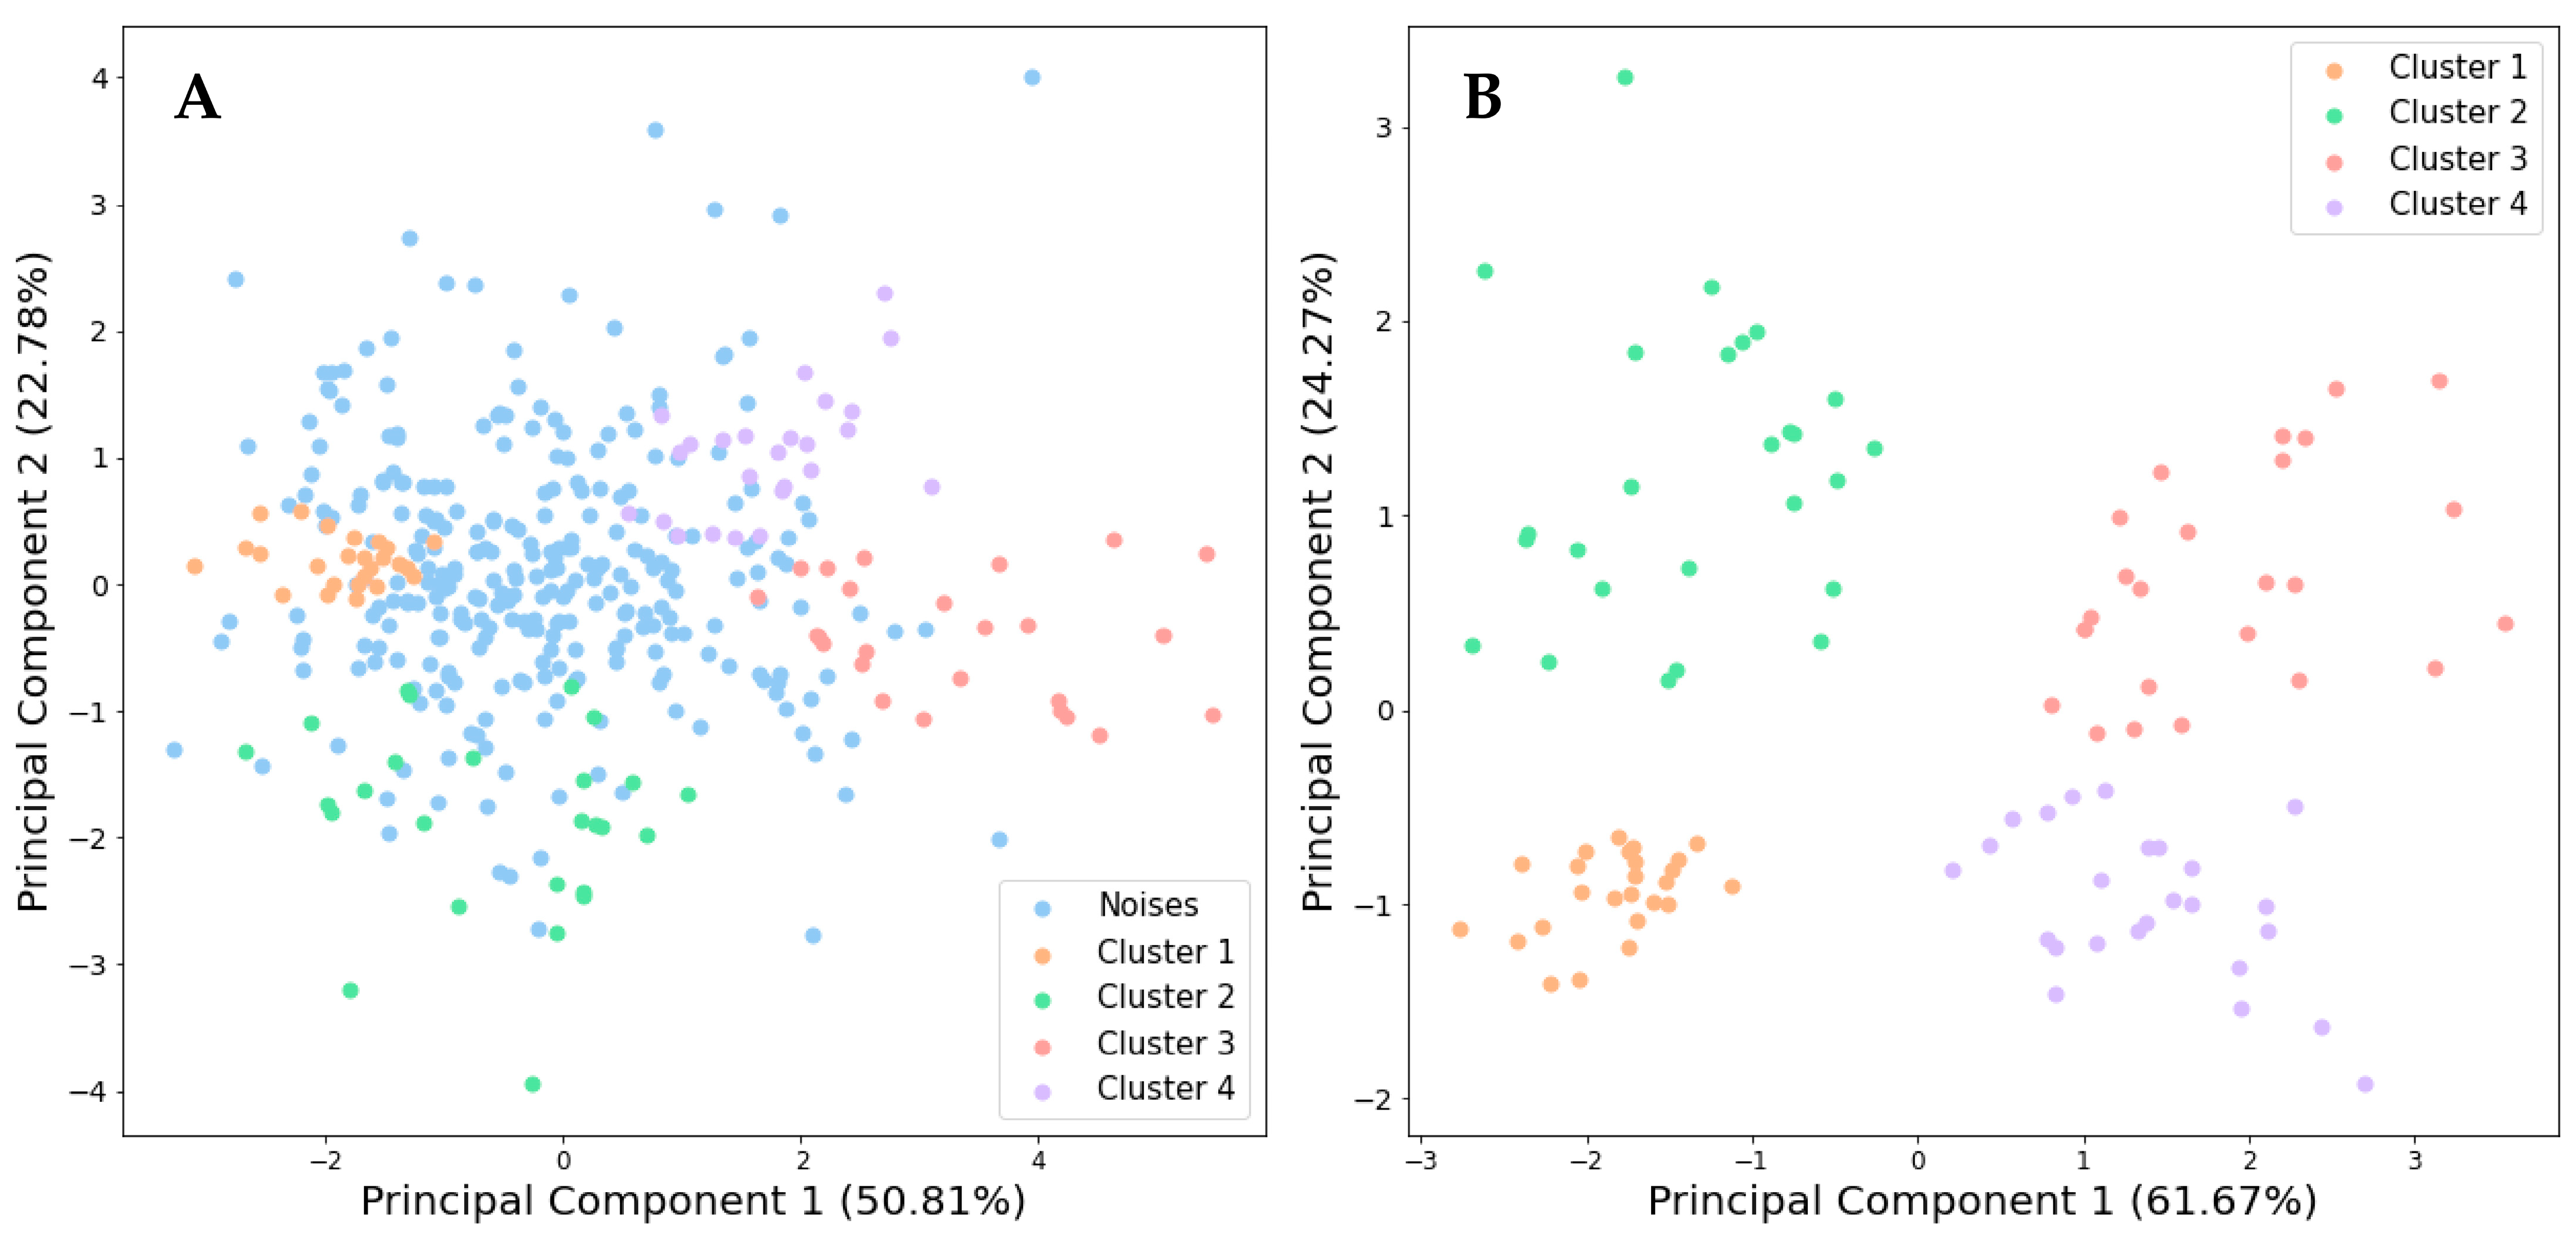
Furthermore, to complement the exploration of the antioxidant capacity distribution, Principal Component Analysis (PCA) was performed (see Figure 7). The combined portion of variance explained by the first two principal components was 73.59% for all clusters, as defined by the OPTICS algorithm and as illustrated in Figure 7A. Similarly, for the four distinct accession groups without any noise, the two principal components accounted for 85.94% of the variance, as exhibited in Figure 7B. Impressively, the PCA outcomes showcased a comprehensive visualization of the four clusters of holy basil cultivars generated by the OPTICS clustering algorithm. This analysis contributes to a more comprehensive understanding of the relationships and patterns among the clusters of holy basil accessions.
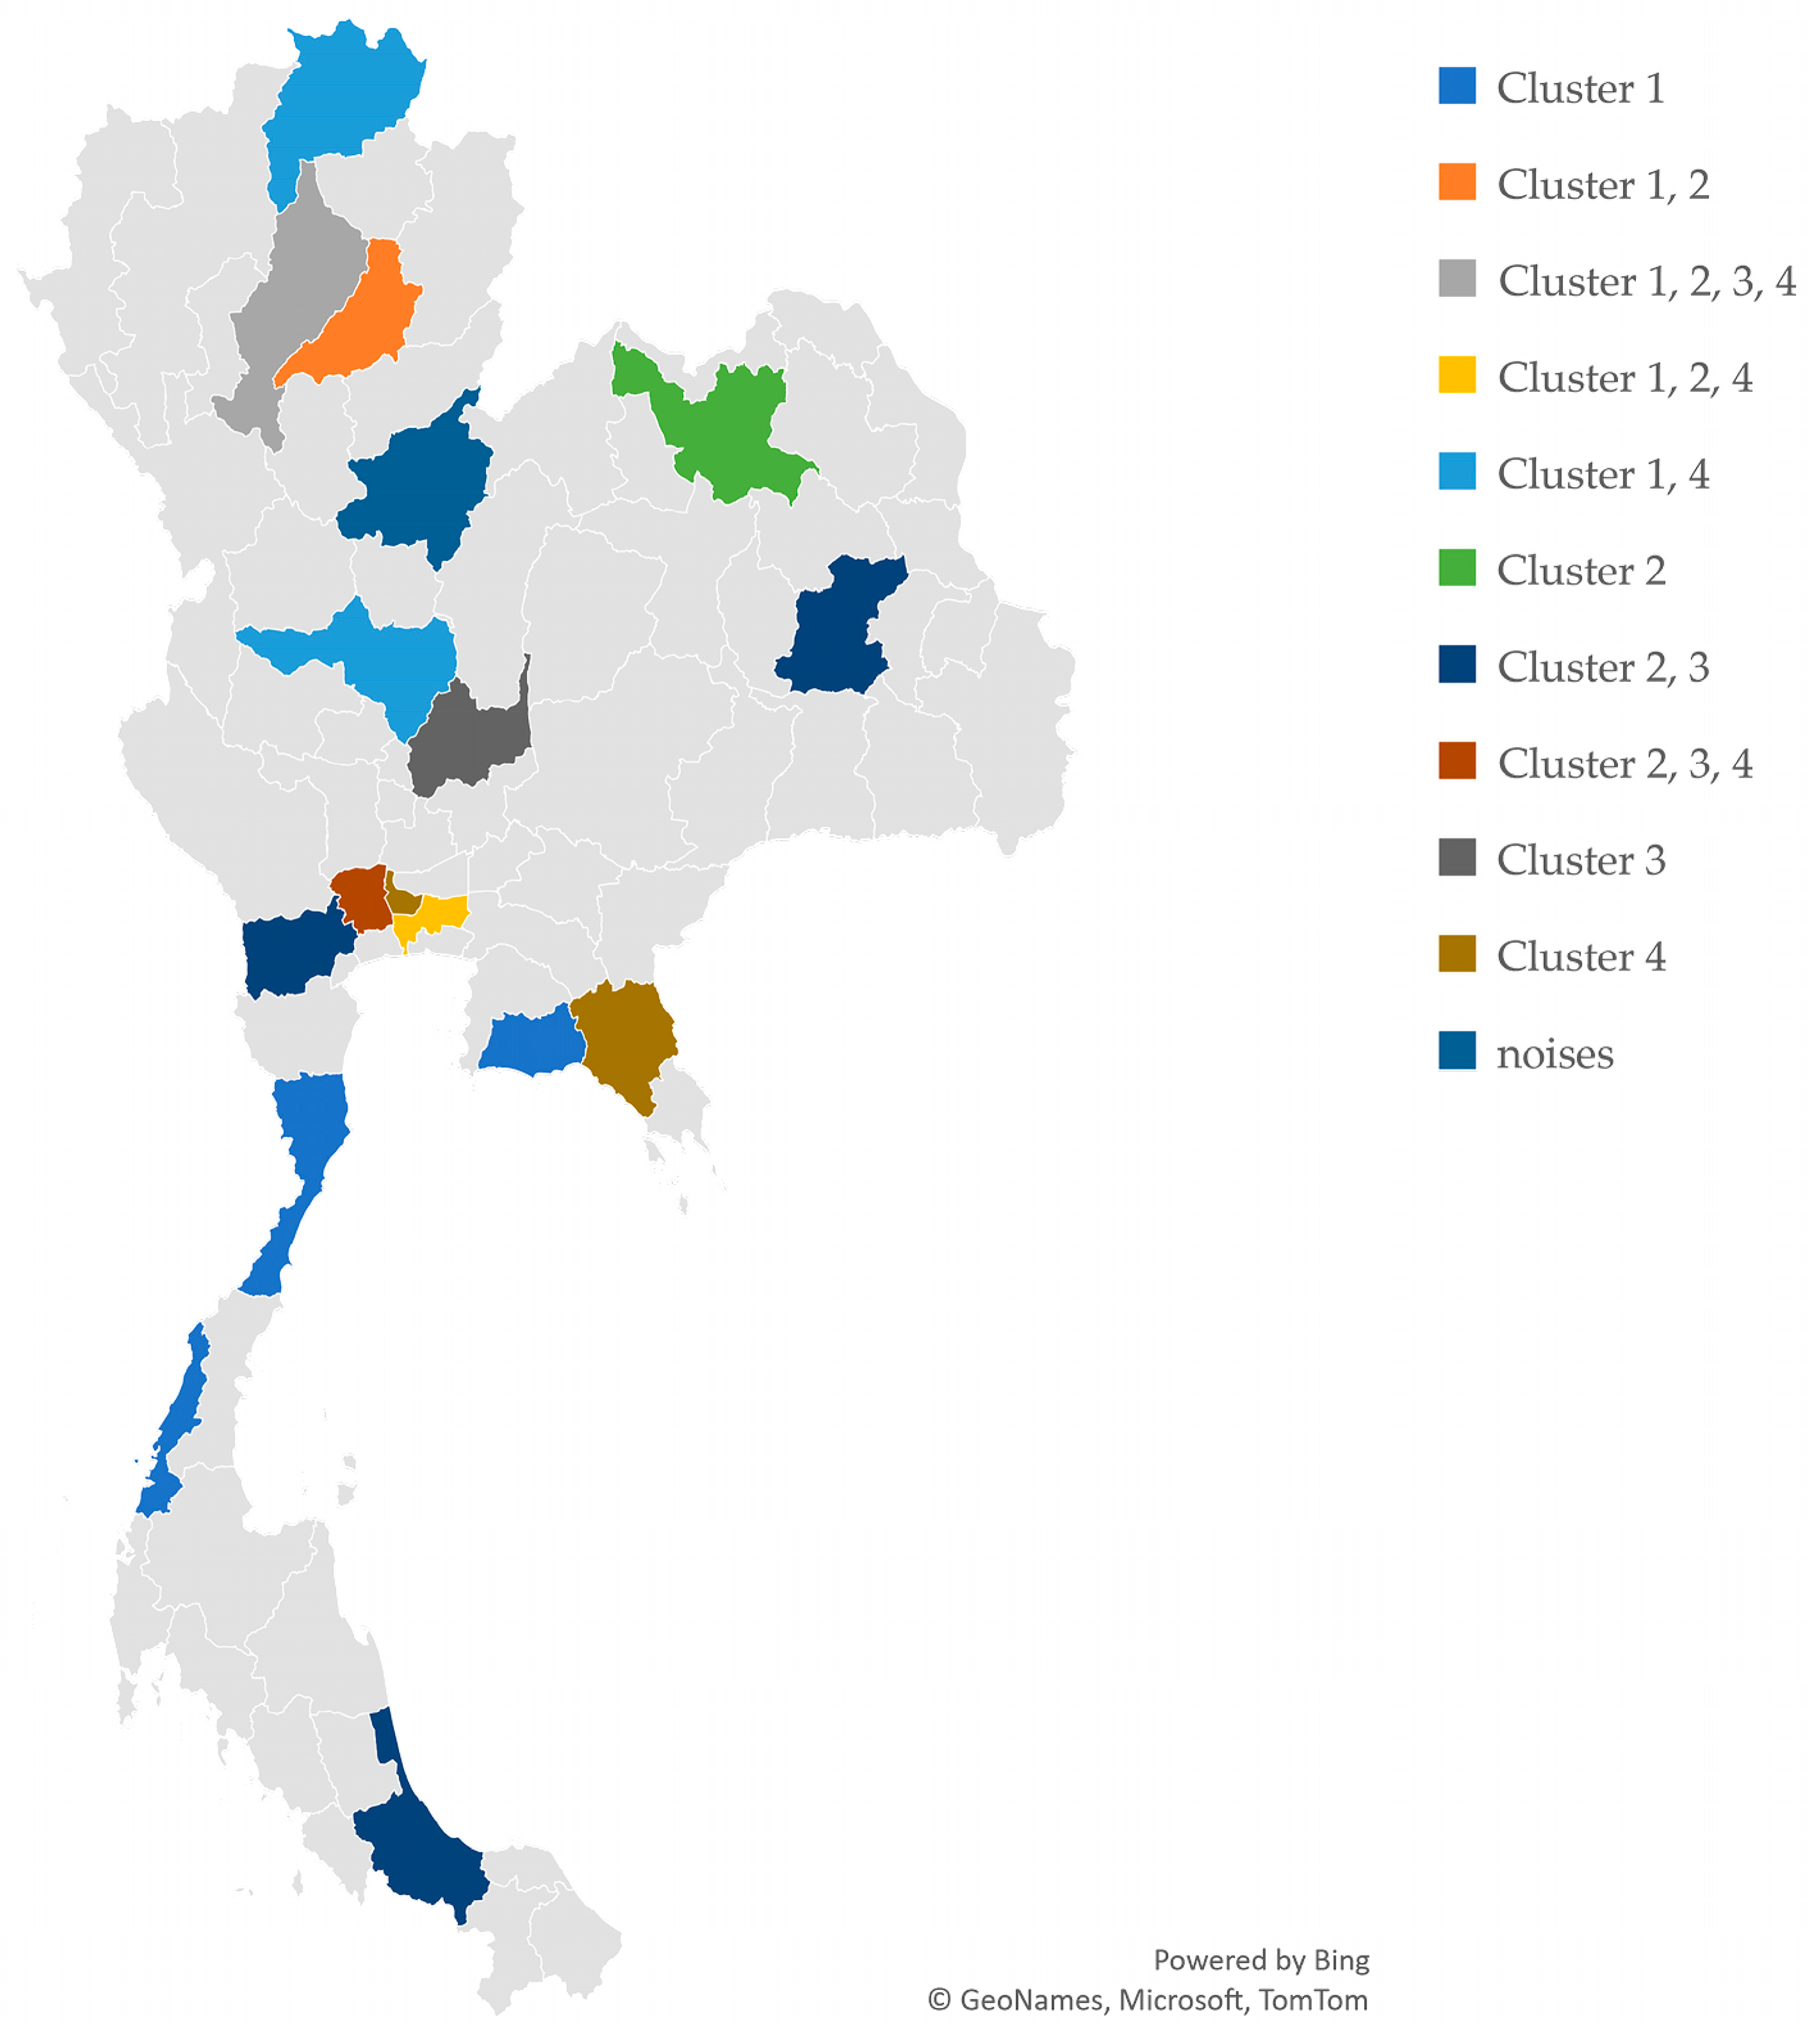
Within the cluster of holy basil accessions, the samples share distinct characteristics that set them apart from the other groups, as shown in Figure 8. To enable fair comparison, we rescaled all of the antioxidant capacities to a standardized range of 0 to 1, and subsequently depicted the distinct traits of each cluster. Cluster 1 comprises accessions with lower antioxidant capacities, while cluster 2 exhibits a higher terpenoid content. In cluster 3, the accessions demonstrate elevated levels of DPPH antioxidant activity, flavonoid, and phenolics. Similarly, the last group (cluster 4) includes accessions with high DPPH antioxidant activity and phenolic contents; however, it also displays a higher level of anthocyanin and lower flavonoid content than the accessions in cluster 3. The density-based clustering applied to the holy basil cultivars reveals instances of overlapping accessions that share common characteristics across different groups. Moreover, considering that the holy basil cultivars are sourced from diverse regions across Thailand. This geographical context is visually presented in Figure 9; where the regions of cultivation are juxtaposed with the determined clusters—an additional layer of insight to the clustering results—providing a more comprehensive understanding of the distribution and relationships among the holy basil cultivars based on both their shared traits and regional origins.

4. Discussion

Holy basil has a long history of medicinal use in Asian countries [1,2]. Indeed, prior studies have delved into the intricate compositions of secondary metabolites within Ocimum species [46,47]. The understanding of the variations in secondary metabolites among distinct Ocimum species has been studied, but has proven somewhat elusive for some specific accessions [19,20,21]. This study entails antioxidant analysis of the anthocyanin, flavonoid, phenolic, and terpenoid content, alongside the DPPH antioxidant activity, within a dataset comprising 26 distinct Thai holy basil accessions sourced from diverse geographical locations across Thailand, yielding several significant findings. The supplementary information, specifically Supplementary Table S1, presents the holy basil accessions, antioxidant capacities, their geographical locations, and the resultant clusters that have been determined. Notably, the anthocyanin content exhibited low variability, with tight clustering around the mean, while the terpenoid content displayed greater scatter, with the highest standard deviation. The presence of positive linear correlations among the flavonoid, DPPH antioxidant activity, and phenolic levels was observed due to these three assays detecting colorimetric responses related to the ability of aromatic and/or hydroxylated compounds to neutralize free radicals.
The experimental and chemical results have been gathered and harnessed through the utilization of a density-based clustering method, namely the OPTICS algorithm, to ascertain the appropriate clusters for accessions that share comparable antioxidant profiles. Our findings demonstrate the importance of parameter tuning in achieving meaningful clustering results. We determined the optimal parameter for the OPTICS algorithm, seeking a balance between various clustering indices. Our selection was guided by achieving a high Silhouette coefficient and Calinski-Harabasz index, along with a low Davies-Bouldin index, resulting in fewer clusters. However, this approach yielded at least two groups of accessions, each exhibiting a range of antioxidant variations, making it challenging to pinpoint significant antioxidant profile characteristics. These findings underscore that the best index may not always be the most suitable choice [31]. To effectively determine the parameter, a more profound consideration of biological outcomes is essential. A simple approach involving random parameter value selection has proven to be an effective alternative for enhancing the performance [48]. Consequently, the OPTICS algorithm necessitated extensive manual parameter adjustments, aligning computational and biological perspectives, and considering the number of clusters and their characteristics in order to yield meaningful cluster results. By selecting a ‘min_samples’ value of 4 and a ‘min_cluster_size’ of 24, it strikes a balance between cluster distinctness and comprehensiveness. This configuration produced four distinct cultivar groups, offering deeper insights into the terpenoid content variation. The findings emphasize the utility of systematic parameter exploration in optimizing clustering outcomes.
Each of the identified clusters exhibits distinct antioxidant capacities and profiles, shedding light on the variations among the holy basil cultivars. Cluster 4 had higher levels of anthocyanin content. Additionally, anthocyanin is a widely recognized plant pigmen.t classified into flavonoids that play a dual role in contributing to both the color and antioxidant activity [49]. Among the cultivars in cluster 4—namely OC106 (Mueang Chanthaburi, Chanthaburi), OC148 (Mae Lao, Chiang Rai), and OC108 (Leam Sing, Chanthaburi)—the Red holy basil cultivar (BENJAMITR ENTERPRISE (1991) Co., Ltd., Nonthaburi) stands out with the highest anthocyanin content accumulation, as represented in Supplementary Figure S1A. Furthermore, within cluster 3, both OC072 (Wat Phleng, Ratchaburi) and OC081 (Bang Klam, Songkhla) also exhibit significant levels of anthocyanin. The study supported that the Red variety demonstrates a similar significant anthocyanin accumulation pattern as OC072 [18]. However, using an alternative approach, namely hierarchical clustering, a prior study indicated that OC072 (cluster 3) was grouped alongside the Red cultivar (cluster 4) [18]. Hierarchical clustering is proficient at identifying embedded data structures and merging closely related clusters, but may not consider information about samples beyond the identified clusters [50]. Conversely, density-based approaches excel in identifying an unknown number of clusters and accommodating arbitrary cluster shapes with more generalized, similar density patterns [51]. Intriguingly, within cluster 4, we observed that OC106, OC148, and OC108 displayed higher levels of anthocyanin content than OC072, indicating the presence of potentially distinct varieties.
The DPPH antioxidant activity plays a crucial role as an indicator, revealing the collective potential for antioxidants across the different cultivated varieties [52]. Notably, within cluster 3, the OC063 (Chai Badan, Lopburi), OC113 (Mueang Rayong, Rayong), OC059 (Kamphaeng Saen, Nakhon Pathom), OC072, OC057 (Damnoen Saduak, Ratchaburi), and OC064 (Roi Et) accessions distinguish themselves with high DPPH percentages, reaching values exceeding 73%. Adding to the intrigue, the Red, OC108, and OC106 cultivars within cluster 4 also demonstrate elevated DPPH antioxidant activity. While a previous study indicated that Red, OC064, and OC135 exhibit higher levels of DPPH radical scavenging compared to the Red holy basil accession mentioned in [18], our findings reveal that OC063 and OC113 surpass even those accessions with higher DPPH antioxidant activity, presenting a fascinating aspect of their antioxidant capabilities.
Both flavonoids and phenolics are well-known antioxidants that play a vital role in scavenging reactive free radicals [53,54]. The variations in the flavonoid and phenolic content among the cultivars could potentially influence their therapeutic properties and applications. We identified that moderate levels of flavonoid content and phenolic content were detected within a similar range. Significantly, within cluster 3, OC113 stands out with the highest flavonoid content when compared to other suggested accessions; namely OC059, OC057, and OC072, shown in Figure S1C. The absence of a significant discrepancy in the phenolic content between cluster 3 and cluster 4 accentuates the fact that certain accessions in both clusters exhibited heightened levels of phenolic content, as depicted in Figure 6D. Shifting our focus to the cultivars within cluster 4, the Red holy basil cultivar stands out with the highest phenolic content, surpassing OC108 and OC106. Our result was consistent with a prior study [18], in which the commercial Red cultivar was noted for its highest compound levels. This observation aligns with a prior study on red and green holy basil cultivars, where red holy basil cultivated under four different light spectra exhibited higher levels of total phenolic content and flavonoid content than green cultivars during the flowering stage [13]. These accessions, belonging to clusters 3 and 4, also exhibit significant levels of flavonoid content.
Terpenoid content is a diverse class of compounds with a wide range of biological activities, including antimicrobial, anti-inflammatory, and anticancer properties [55,56,57]. Adding to the intrigue, our analysis uncovered the substantial presence of terpenoid compounds within cluster 2. In the identified cluster 2, two cultivars—namely OC194 and OC195, both originating from Udon Thani, Thailand—distinguish themselves with noteworthy terpenoid quantities, as depicted in Figure S1E. This observation aligns with the findings in [18], in which OC194 stood out with the highest total terpenoid content, closely resembling the levels found in the Green and OC195 cultivars when compared to other Thai local accessions. However, it is important to highlight that the OC057, OC063, and OC059 accessions in cluster 3 also showcased noteworthy terpenoid levels. The diverse terpenoid profiles among cultivars open avenues for further investigation into their specific roles and potential synergistic effects with other antioxidants.
Interestingly, certain cultivars appear in multiple clusters, indicating their varied antioxidant attributes across different metrics. For instance, OC130 (Mueang Lampang, Lampang) and OC141 (Mueang Phrae, Phrae) are observed in all clusters (1–4), but are intentionally categorized as varied antioxidant accessions to avoid misinterpretation. This underscores the dynamic nature of their antioxidant capacities. The categorization of holy basil accessions into clusters based on their distinctive characteristics allows for a comprehensive understanding of their distribution and associations. The Green holy basil cultivar (Chia Tai Co., Ltd., Bangkok, Thailand) is identified in clusters 1, 2, and 4, while the OC059 accession appears in clusters 2, 3, and 4. This pattern of overlap provides insights into the shared antioxidant profiles among these cultivars.
Overall, this comprehensive analysis provides valuable insights into the antioxidant capacities of holy basil cultivars and their clustering patterns based on antioxidant profiles. These findings can be instrumental in selecting and breeding holy basil cultivars with enhanced antioxidant properties for potential applications in health and nutrition. Further investigations and experimental studies could shed more light on the underlying factors driving the full potential of holy basil as a valuable source of antioxidants and other beneficial compounds.

5. Conclusions

This study provides valuable insights into the variation in the antioxidant capacities among accessions of holy basil. By employing a range of statistical tools and the OPTICS clustering algorithm, we identified distinct clusters of holy basil cultivars based on their antioxidant profiles. The density-based clustering evaluation indexes and PCA analysis further supported the clustering results, enhancing the understanding of the relationships between the cultivars and their antioxidant capacities. The study’s findings hold significant implications for various industries, including medicine, functional foods, and the nutraceutical industry. By identifying holy basil cultivars with high antioxidant capacities, this research facilitates the selection of the optimal candidates for specific applications, such as developing natural health supplements or functional food products enriched with antioxidants. Furthermore, the insights gained from this analysis can aid in the breeding and cultivation of holy basil cultivars with enhanced antioxidant properties, further maximizing their potential for health and nutritional benefits. As with any scientific study, further investigations and experimental studies are necessary to build upon these results and delve deeper into the mechanisms underlying the antioxidant capacities of holy basil. Continued research in this area can unlock the full potential of holy basil as a valuable source of antioxidants and other bioactive compounds, contributing to the advancement of various industries and improving human health and well-being.

Supplementary Materials

The following supporting information can be downloaded at: https://www.mdpi.com/article/10.3390/horticulturae9101094/s1, Table S1: List of holy basil accessions, their locations, and determined clusters by OPTICS clustering algorithm. Figure S1: Bar plots of average antioxidant capacities are depicted for all accessions in high antioxidant clusters.

Author Contributions

Conceptualization, T.S., P.C., A.S. and K.P.; methodology, P.C., T.S., A.S. and K.P.; software, T.S.; validation, T.S., P.C., A.S. and K.P.; formal analysis, T.S., A.S. and K.P.; investigation, T.S.; data curation, T.S. and P.C.; writing—original draft preparation, T.S.; writing—review and editing, T.S., P.C., A.S. and K.P.; visualization, T.S. and K.P.; funding acquisition, P.C., K.P., T.S. and A.S.; supervision, P.C., K.P. and A.S. All authors have read and agreed to the published version of the manuscript.

Funding

This research was financially supported by the Sci-Super IX fund from the Faculty of Science, Chulalongkorn University. Tanapon Saelao was supported by the Development and Promotion of Science and Technology Talents Project (DPST). Apichat Suratanee was funded by National Science, Research and Innovation Fund (NSRF) and King Mongkut’s University of Technology North Bangkok with Contract no. KMUTNB-FF-66-08.

Data Availability Statement

All data are displayed in the manuscript and Supplementary Files.

Acknowledgments

The authors would like to thank Suriyan Cha-umfor and Cattarin Theerawitaya from the National Center for Genetic Engineering and Biotechnology (BIOTEC) and the National Science and Technology Development Agency (NSTDA) for their help and support in the Plant Phenomics experiments.

Conflicts of Interest

The authors declare no conflict of interest.

References

  1. Patwardhan, B.; Warude, D.; Pushpangadan, P.; Bhatt, N. Ayurveda and traditional Chinese medicine: A comparative overview. Evid.-Based Complement. Altern. Med. 2005, 2, 629537. [Google Scholar] [CrossRef]
  2. Singh, N.; Hoette, Y.; Miller, D.R. Tulsi: The Mother Medicine of Nature; International Institute of Herbal Medicine: Lucknow, India, 2002. [Google Scholar]
  3. Singh, S.; Taneja, M.; Majumdar, D.K. Biological activities of Ocimum sanctum L. fixed oil-an overview. Indian J. Exp. Biol. 2007, 45, 403–412. [Google Scholar] [PubMed]
  4. Deme, P.; Aluganti Narasimhulu, C.; Parthasarathy, S. Evaluation of anti-inflammatory properties of herbal aqueous extracts and their chemical characterization. J. Med. Food 2019, 22, 861–873. [Google Scholar] [CrossRef] [PubMed]
  5. Chukwuma, I.F.; Uchendu, N.O.; Asomadu, R.O.; Ezeorba, W.F.C.; Ezeorba, T.P.C. African and Holy Basil—A review of ethnobotany, phytochemistry, and toxicity of their essential oil: Current trends and prospects for antimicrobial/anti-parasitic pharmacology. Arab. J. Chem. 2023, 16, 104870. [Google Scholar] [CrossRef]
  6. Mallikarjun, S.; Rao, A.; Rajesh, G.; Shenoy, R.; Pai, M. Antimicrobial efficacy of Tulsi leaf (Ocimum sanctum) extract on periodontal pathogens: An in vitro study. J. Indian Soc. Periodontol. 2016, 20, 145–150. [Google Scholar] [CrossRef] [PubMed]
  7. Baliga, M.S.; Jimmy, R.; Thilakchand, K.R.; Sunitha, V.; Bhat, N.R.; Saldanha, E.; Rao, S.; Rao, P.; Arora, R.; Palatty, P.L. Ocimum sanctum L (holy basil or Tulsi) and Its phytochemicals in the prevention and treatment of cancer. Nutr. Cancer 2013, 65, 26–35. [Google Scholar] [CrossRef]
  8. Giridharan, V.V.; Thandavarayan, R.A.; Konishi, T. Chapter 98—Ocimum sanctum Linn. (Holy Basil) to Improve Cognition. In Diet and Nutrition in Dementia and Cognitive Decline; Martin, C.R., Preedy, V.R., Eds.; Academic Press: San Diego, CA, USA, 2015; pp. 1049–1058. [Google Scholar]
  9. Joshi, H.; Parle, M. Cholinergic basis of memory improving effect of Ocimum tenuiflorum Linn. Indian J. Pharm. Sci. 2006, 68, p364–p365. [Google Scholar] [CrossRef]
  10. Singh, D.; Chaudhuri, P.K. A review on phytochemical and pharmacological properties of Holy basil (Ocimum sanctum L.). Ind. Crops Prod. 2018, 118, 367–382. [Google Scholar] [CrossRef]
  11. Al-Owaisi, M.; Al-Hadiwi, N.; Khan, S.A. GC-MS analysis, determination of total phenolics, flavonoid content and free radical scavenging activities of various crude extracts of Moringa peregrina (Forssk.) Fiori leaves. Asian Pac. J. Trop. Biomed. 2014, 4, 964–970. [Google Scholar] [CrossRef]
  12. Mahajan, N.; Singh, J.; Sinha, S. Comparison of total flavonoid, phenolic content and antioxidant capacity in leaf and seed extracts from white holy basil (Ocimum sanctum). Int. J. Appl. Biol. Pharm. Technol. 2014, 5, 34–42. [Google Scholar]
  13. Chutimanukul, P.; Wanichananan, P.; Janta, S.; Toojinda, T.; Darwell, C.T.; Mosaleeyanon, K. The influence of different light spectra on physiological responses, antioxidant capacity and chemical compositions in two holy basil cultivars. Sci. Rep. 2022, 12, 588. [Google Scholar] [CrossRef] [PubMed]
  14. Raina, A.P.; Kumar, A.; Dutta, M. Chemical characterization of aroma compounds in essential oil isolated from “Holy Basil” (Ocimum tenuiflorum L.) grown in India. Genet. Resour. Crop Evol. 2013, 60, 1727–1735. [Google Scholar] [CrossRef]
  15. Malav, P.; Pandey, A.; Bhatt, K.C.; Gopala Krishnan, S.; Bisht, I.S. Morphological variability in holy basil (Ocimum tenuiflorum L.) from India. Genet. Resour. Crop Evol. 2015, 62, 1245–1256. [Google Scholar] [CrossRef]
  16. Tangpao, T.; Chung, H.-H.; Sommano, S.R. Aromatic Profiles of Essential Oils from Five Commonly Used Thai Basils. Foods 2018, 7, 175. [Google Scholar] [CrossRef]
  17. Wangcharoen, W.; Morasuk, W. Antioxidant capacity and phenolic content of holy basil. Songklanakarin J. Sci. Technol. 2007, 29, 1407–1415. [Google Scholar]
  18. Chutimanukul, P.; Jindamol, H.; Thongtip, A.; Korinsak, S.; Romyanon, K.; Toojinda, T.; Darwell, C.T.; Wanichananan, P.; Panya, A.; Kaewsri, W.; et al. Physiological responses and variation in secondary metabolite content among Thai holy basil cultivars (Ocimum tenuiflorum L.) grown under controlled environmental conditions in a plant factory. Front. Plant Sci. 2022, 13, 1008917. [Google Scholar] [CrossRef]
  19. Wongpraneekul, A.; Havananda, T.; Luengwilai, K. Variation in aroma level of holy basil (Ocimum tenuiflorum L.) leaves is related to volatile composition, but not trichome characteristics. J. Appl. Res. Med. Aromat. Plants 2022, 27, 100347. [Google Scholar] [CrossRef]
  20. Saran, P.L.; Tripathy, V.; Saha, A.; Kalariya, K.A.; Suthar, M.K.; Kumar, J. Selection of superior Ocimum sanctum L. accessions for industrial application. Ind. Crops Prod. 2017, 108, 700–707. [Google Scholar] [CrossRef]
  21. Saran, P.L.; Patel, R.B. Field marker character for essential oil content in green herbage through leaf colour intensity in holy basil (Ocimum sanctum L.). Vegetos 2021, 34, 889–897. [Google Scholar] [CrossRef]
  22. Wang, M.; Cantrell, C.L.; Mathews, S.T.; Paudel, P.; Lee, J.; Mentreddy, S.R. Agronomy, chemical analysis, and antidiabetic activity of basil (Ocimum Species). ACS Food Sci. Technol. 2022, 2, 1243–1256. [Google Scholar] [CrossRef]
  23. Day, W.H.E.; Edelsbrunner, H. Efficient algorithms for agglomerative hierarchical clustering methods. J. Classif. 1984, 1, 7–24. [Google Scholar] [CrossRef]
  24. Hartigan, J.A.; Wong, M.A. Algorithm AS 136: A K-means clustering algorithm. J. R. Stat. Society. Ser. C Appl. Stat. 1979, 28, 100–108. [Google Scholar] [CrossRef]
  25. Park, H.-S.; Jun, C.-H. A simple and fast algorithm for K-medoids clustering. Expert Syst. Appl. 2009, 36, 3336–3341. [Google Scholar] [CrossRef]
  26. Guorong, X.; Wei, Z.; Peiqi, C. EM algorithms of Gaussian mixture model and hidden Markov model. In Proceedings of the Proceedings 2001 International Conference on Image Processing (Cat. No.01CH37205), Thessaloniki, Greece, 7–10 October 2001; Volume 141, pp. 145–148. [Google Scholar]
  27. Ester, M.; Kriegel, H.-P.; Sander, J.; Xu, X. A density-based algorithm for discovering clusters in large spatial databases with noise. In Proceedings of the KDD-96 Proceedings, Portland OR, USA, 2–4 August 1996; pp. 226–231. [Google Scholar]
  28. Zhao, L.; Zaki, M.J. TRICLUSTER: An effective algorithm for mining coherent clusters in 3D microarray data. In Proceedings of the Proceedings of the 2005 ACM SIGMOD International Conference on Management of Data, Baltimore, MD, USA, 14–16 June 2005; pp. 694–705. [Google Scholar]
  29. Hahsler, M.; Piekenbrock, M.; Doran, D. dbscan: Fast density-based clustering with R. J. Stat. Softw. 2019, 91, 1–30. [Google Scholar] [CrossRef]
  30. Ankerst, M.; Breunig, M.M.; Kriegel, H.-P.; Sander, J. OPTICS: Ordering points to identify the clustering structure. SIGMOD Rec. 1999, 28, 49–60. [Google Scholar] [CrossRef]
  31. Wu, C.; Chen, Y.; Dong, Y.; Zhou, F.; Zhao, Y.; Liang, C.J. VizOPTICS: Getting insights into OPTICS via interactive visual analysis. Comput. Electr. Eng. 2023, 107, 108624. [Google Scholar] [CrossRef]
  32. Prieto Santamaría, L.; García del Valle, E.P.; Zanin, M.; Hernández Chan, G.S.; Pérez Gallardo, Y.; Rodríguez-González, A. Classifying diseases by using biological features to identify potential nosological models. Sci. Rep. 2021, 11, 21096. [Google Scholar] [CrossRef] [PubMed]
  33. Wang, W.; Xiao, G.; Yang, B.; Ye, J.; Zhang, X.; Zheng, Y.; Chen, B. Instar determination for the tomato leafminer Tuta absoluta (Lepidoptera: Gelechiidae) using the density-based OPTICS clustering algorithm. Environ. Entomol. 2022, 51, 940–947. [Google Scholar] [CrossRef] [PubMed]
  34. Wang, S.; Wong, D.; Forrest, K.; Allen, A.; Chao, S.; Huang, B.E.; Maccaferri, M.; Salvi, S.; Milner, S.G.; Cattivelli, L.; et al. Characterization of polyploid wheat genomic diversity using a high-density 90 000 single nucleotide polymorphism array. Plant Biotechnol. J. 2014, 12, 787–796. [Google Scholar] [CrossRef]
  35. Alkhalifah, Y.; Phillips, I.; Soltoggio, A.; Darnley, K.; Nailon, W.H.; McLaren, D.; Eddleston, M.; Thomas, C.L.P.; Salman, D. VOCCluster: Untargeted metabolomics feature clustering approach for clinical breath gas chromatography/mass spectrometry data. Anal. Chem. 2020, 92, 2937–2945. [Google Scholar] [CrossRef]
  36. Thongtip, A.; Mosaleeyanon, K.; Korinsak, S.; Toojinda, T.; Darwell, C.T.; Chutimanukul, P.; Chutimanukul, P. Promotion of seed germination and early plant growth by KNO3 and light spectra in Ocimum tenuiflorum using a plant factory. Sci. Rep. 2022, 12, 6995. [Google Scholar] [CrossRef] [PubMed]
  37. Bao, J.; Cai, Y.; Sun, M.; Wang, G.; Corke, H. Anthocyanins, flavonols, and free radical scavenging activity of chinese bayberry (Myrica rubra) extracts and Their color properties and stability. J. Agric. Food Chem. 2005, 53, 2327–2332. [Google Scholar] [CrossRef] [PubMed]
  38. Liang, J.; He, J. Protective role of anthocyanins in plants under low nitrogen stress. Biochem. Biophys. Res. Commun. 2018, 498, 946–953. [Google Scholar] [CrossRef] [PubMed]
  39. Cai, Y.; Sun, M.; Corke, H. Antioxidant activity of betalains from plants of the amaranthaceae. J. Agric. Food Chem. 2003, 51, 2288–2294. [Google Scholar] [CrossRef] [PubMed]
  40. Yen, G.C.; Duh, P.D. Scavenging effect of methanolic extracts of peanut hulls on free-radical and active-oxygen species. J. Agric. Food Chem. 1994, 42, 629–632. [Google Scholar] [CrossRef]
  41. Ghorai, N.; Chakraborty, S.; Gucchait, S.; Saha, S.K.; Biswas, S.K. Estimation of total Terpenoids concentration in plant tissues using a monoterpene, Linalool as standard reagent. Protoc. Exch. 2012, 1–5. [Google Scholar] [CrossRef]
  42. Pedregosa, F.; Varoquaux, G.; Gramfort, A.; Michel, V.; Thirion, B.; Grisel, O.; Blondel, M.; Prettenhofer, P.; Weiss, R.; Dubourg, V.; et al. Scikit-learn: Machine learning in Python. J. Mach. Learn. Res. 2011, 12, 2825–2830. [Google Scholar]
  43. Rousseeuw, P.J. Silhouettes: A graphical aid to the interpretation and validation of cluster analysis. J. Comput. Appl. Math. 1987, 20, 53–65. [Google Scholar] [CrossRef]
  44. Caliński, T.; Harabasz, J. A dendrite method for cluster analysis. Commun. Stat. 1974, 3, 1–27. [Google Scholar] [CrossRef]
  45. Davies, D.L.; Bouldin, D.W. A cluster separation measure. IEEE Trans. Pattern Anal. Mach. Intell. 1979, PAMI-1, 224–227. [Google Scholar] [CrossRef]
  46. Patel, F.; Modi, N.R. Estimation of total phenolic content in selected varieties of Ocimum species grown in different environmental condition. J. Pharmacogn. Phytochem. 2018, 7, 144–148. [Google Scholar]
  47. Khoo, H.E.; Azlan, A.; Tang, S.T.; Lim, S.M. Anthocyanidins and anthocyanins: Colored pigments as food, pharmaceutical ingredients, and the potential health benefits. Food Nutr. Res. 2017, 61, 1361779. [Google Scholar] [CrossRef] [PubMed]
  48. Rodriguez, M.Z.; Comin, C.H.; Casanova, D.; Bruno, O.M.; Amancio, D.R.; Costa, L.d.F.; Rodrigues, F.A. Clustering algorithms: A comparative approach. PLoS ONE 2019, 14, e0210236. [Google Scholar] [CrossRef]
  49. Gomez-Casati, D.F.; Zanor, M.I.; Busi, M.V. Metabolomics in Plants and Humans: Applications in the Prevention and Diagnosis of Diseases. BioMed Res. Int. 2013, 2013, 792527. [Google Scholar] [CrossRef] [PubMed]
  50. Bu, J.; Liu, W.; Pan, Z.; Ling, K. Comparative Study of Hydrochemical Classification Based on Different Hierarchical Cluster Analysis Methods. Int. J. Environ. Res. Public Health 2020, 17, 9515. [Google Scholar] [CrossRef]
  51. Bhattacharjee, P.; Mitra, P. A survey of density based clustering algorithms. Front. Comput. Sci. 2020, 15, 151308. [Google Scholar] [CrossRef]
  52. Chen, X.; Shang, S.; Yan, F.; Jiang, H.; Zhao, G.; Tian, S.; Chen, R.; Chen, D.; Dang, Y. Antioxidant Activities of Essential Oils and Their Major Components in Scavenging Free Radicals, Inhibiting Lipid Oxidation and Reducing Cellular Oxidative Stress. Molecules 2023, 28, 4559. [Google Scholar] [CrossRef]
  53. Soobrattee, M.A.; Neergheen, V.S.; Luximon-Ramma, A.; Aruoma, O.I.; Bahorun, T. Phenolics as potential antioxidant therapeutic agents: Mechanism and actions. Mutat. Res. Fundam. Mol. Mech. Mutagen. 2005, 579, 200–213. [Google Scholar] [CrossRef]
  54. Kumar, V.; Roy, B.K. Population authentication of the traditional medicinal plant Cassia tora L. based on ISSR markers and FTIR analysis. Sci. Rep. 2018, 8, 10714. [Google Scholar] [CrossRef]
  55. Masyita, A.; Mustika Sari, R.; Dwi Astuti, A.; Yasir, B.; Rahma Rumata, N.; Emran, T.B.; Nainu, F.; Simal-Gandara, J. Terpenes and terpenoids as main bioactive compounds of essential oils, their roles in human health and potential application as natural food preservatives. Food Chem. X 2022, 13, 100217. [Google Scholar] [CrossRef]
  56. Álvarez-Martínez, F.J.; Barrajón-Catalán, E.; Herranz-López, M.; Micol, V. Antibacterial plant compounds, extracts and essential oils: An updated review on their effects and putative mechanisms of action. Phytomedicine 2021, 90, 153626. [Google Scholar] [CrossRef]
  57. Pandey, A.K.; Kumar, P.; Singh, P.; Tripathi, N.N.; Bajpai, V.K. Essential Oils: Sources of Antimicrobials and Food Preservatives. Front. Microbiol. 2017, 7, 2161. [Google Scholar] [CrossRef]
Figure 1. Plant material and growth condition.
Horticulturae 09 01094 g001
Figure 2. Histograms representing the distributions of antioxidant contents in Thai holy basil: (A) anthocyanin content, (B) DPPH antioxidant activity, (C) flavonoid content, (D) phenolic content, (E) terpenoid content, and (F) the plot of the distributions and boxplots of the standardized data for each antioxidant (“*” is the symbol of multiplication). The grey diamonds represent outliers.
Horticulturae 09 01094 g002
Figure 3. Heatmap of the correlation between five antioxidants reveals the positive correlation among DPPH antioxidant activity, flavonoid content, and phenolic content.
Horticulturae 09 01094 g003
Figure 4. OPTICS clustering parameters: ‘min_samples’ and ‘min_cluster_size’ are estimated by implementing (A) Silhouette coefficient, (B) Calinski-Harabasz index, and (C) Davies-Bouldin index.
Horticulturae 09 01094 g004
Figure 5. Results of the OPTICS clustering technique visualize a reachability plot in part (A), where four groups of cultivars are highlighted within the valley of low reachability distance and represent cluster separation in a 2-dimensional plot shown in part (B).
Horticulturae 09 01094 g005
Figure 6. The comparison of each antioxidant target: (A) anthocyanin content, (B) DPPH radical scavenging activity, (C) flavonoid content, (D) phenolic content, and (E) terpenoid content based on the well-defined clusters. The brackets indicate no statistically significant differences between clusters (“*” is the symbol of multiplication, and “**” means p > 0.05). The grey diamonds represent outliers.
Horticulturae 09 01094 g006
Figure 7. Clusters obtained in the OPTICS clustering algorithm were also found in the principal component analysis (PCA), where (A) the whole dataset with noises is performed in PCA section, while (B) the well-separated groups are investigated.
Horticulturae 09 01094 g007
Figure 8. The antioxidant characteristics varied among the determined clusters: (A) cluster 1 with low antioxidant levels, (B) cluster 2 with high terpenoid content, (C) cluster 3 with high flavonoid, DPPH antioxidant activity, and phenolic content, and (D) cluster 4 with elevated levels of anthocyanin, DPPH antioxidant activity and phenolic content. The grey diamonds represent outliers.
Horticulturae 09 01094 g008
Figure 9. Clustering geographical map representing the determined cluster(s) of holy basil accession retrieved from different places in Thailand.
Horticulturae 09 01094 g009
Table 1. The list of 26 holy basil accessions in Thailand gown in greenhouse used for investigation of Density-Based OPTICS Clustering Algorithm. Holy basil accessions are tabled with their geographical locations.
No.Accession NameLocation
1GreenChia Tai Co., Ltd., Bangkok, Thailand
2OC057Damnoen Saduak, Ratchaburi, Thailand
3OC059Kamphaeng Saen, Nakhon Pathom, Thailand
4OC063Chai Badan, Lopburi, Thailand
5OC064Roi Et, Thailand
6OC072Wat Phleng, Ratchaburi, Thailand
7OC081Bang Klam, Songkhla, Thailand
8OC095Krabure, Ranong, Thailand
9OC097Bangsaphan, Prachuap Khiri Khan, Thailand
10OC099Bangsaphan, Prachuap Khiri Khan, Thailand
11OC101Bangsaphan, Prachuap Khiri Khan, Thailand
12OC102Bangsaphan, Prachuap Khiri Khan, Thailand
13OC104Mueang Rayong, Rayong, Thailand
14OC105Mueang Rayong, Rayong, Thailand
15OC106Mueang Chanthaburi, Chanthaburi, Thailand
16OC108Leam Sing, Chanthaburi, Thailand
17OC113Mueang Rayong, Rayong, Thailand
18OC130Mueang Lampang, Lampang, Thailand
19OC133Den Chai, Phrae, Thailand
20OC135Mueang Phitsanulok, Phitsanulok, Thailand
21OC139Banphot Phisai, Nakhon Sawan, Thailand
22OC141Mueang Phrae, Phrae, Thailand
23OC148Mae Lao, Chiang Rai, Thailand
24OC194Udon Thani, Thailand
25OC195Kumphawapi, Udon Thani, Thailand
26RedBENJAMITR ENTERPRISE (1991) CO., LTD., Nonthaburi, Thailand
Table 2. Descriptive statistics of each antioxidant capacities.
Antioxidant CapacitiesMinMaxMeanMedianStandard Deviation
Anthocyanin
A530 − (0.33 × A657)
0.0560.5650.1780.1650.07
DPPH
(%)
50.56892.97470.96170.5988.361
Flavonoid
(mg rutin/gDW)
2.76464.18417.58315.8079.333
Phenolic
(mg GAE/gDW)
6.90745.95523.19122.8167.464
Terpenoid
(mg/gDW)
243.2591721.481707.343652.778240.498
Disclaimer/Publisher’s Note: The statements, opinions and data contained in all publications are solely those of the individual author(s) and contributor(s) and not of MDPI and/or the editor(s). MDPI and/or the editor(s) disclaim responsibility for any injury to people or property resulting from any ideas, methods, instructions or products referred to in the content.