Article

Anthocyanin Composition in Cabernet Sauvignon Grape Skins: Effect of Regulated Deficit Irrigation in a Warm Climate

by
Gonzalo Aris
1,
Italo F. Cuneo
1,
Claudio Pastenes
2 and
Alejandro Cáceres-Mella
1,*
1
Faculty of Agriculture and Food Science, Pontificia Universidad Católica de Valparaíso, San Francisco s/n, Quillota 2260000, Chile
2
Faculty of Agronomical Sciences, University of Chile, Santa Rosa 11315, La Pintana, Santiago 8820808, Chile
*
Author to whom correspondence should be addressed.
Horticulturae 2022, 8(9), 796; https://doi.org/10.3390/horticulturae8090796
Submission received: 10 August 2022 / Revised: 27 August 2022 / Accepted: 28 August 2022 / Published: 1 September 2022
(This article belongs to the Special Issue Advanced Studies in Fruit Trees under Water Stress)

Abstract

:
The influence of regulated deficit irrigation on the anthocyanin composition in Cabernet Sauvignon grape skins throughout ripening and when grown in a warm geographic area for two consecutive seasons was investigated. The assay was carried out on own-rooted Cabernet Sauvignon plants maintained under three irrigation regimes (i.e., T1 = 12 L h−1 (90% of ETp), T2 = 6 L h−1 (60% of ETp) and T3 = 2 L h−1 (30% of ETp)) from veraison until harvest. The results showed that the concentration of total anthocyanins varied among the three groups. In terms of the different fractions of anthocyanins, mild water stress generated slight changes with a different behavior between the 2014 and 2015 seasons, although the pattern of accumulation was similar. The trihydroxylated anthocyanins were much higher in concentration than the dihydroxylated counterparts in both seasons, with no significant differences among irrigation treatments. The water status did not produce differences in terms of the different anthocyanin proportions at harvest, which could indicate that the different irrigation treatments did not induce a greater accumulation of one or another type of anthocyanin.

1. Introduction

In recent years, climate change has led to serious threats in wine-producing regions around the world, including a strong decrease in rainfall and an increased frequency of high-temperature events, thus worsening water scarcity scenarios [1,2]. Regulated deficit irrigation (RDI) is a widespread practice in viticulture during grape ripening since water stress has been proven to improve berry quality by increasing the skin-to-pulp ratio and promoting the metabolism and concentration of phenolic compounds such as tannins, anthocyanins and phenolic acids [3,4,5,6,7].
Anthocyanins are phenolic compounds that highly influence the organoleptic quality of wines since they are responsible for giving color to red varieties and, therefore, red wine [8]. In Vitis vinifera L., these compounds are found in monoglucosylated forms of methoxylated and/or hydroxylated anthocyanins. The number and type of substitutes in the B-ring of the chemical structure of anthocyanins allow the identification of different compounds: cyanidin-3-glucoside and peonidin-3-glucoside with two substitutes and delphinidin-3-glucoside, petunidin-3-glucoside and malvidin-3-glucoside with three substitutes. The substitution depends on the action of diverse enzymes that are present in the synthesis pathway of the abovementioned molecules, such as flavonoid-3′-hydroxylase and flavonoid-3′5′-hydroxylase. In addition, a higher diversity of anthocyanins results from the acylation of glucose by acetic, p-coumaric and caffeic acids [9].
The concentration of anthocyanins can vary depending on diverse environmental factors and agricultural practices [10,11,12,13]. In a study by Zarrouk et al. [14], the authors described an increase in these flavonoid compounds under deficit irrigation, yet the opposite effect was found under dry farming conditions due to excessive dehydration, suggesting a strong relationship between seasonal climate (i.e., temperature profile) and the success of the deficit irrigation regime. In terms of anthocyanins, their concentration has been found to increase or decrease in grapes subjected to deficit irrigation; the change in concentration depends on many aspects, such as the timing of deficit irrigation [7] or the local regional climate [3]. To date, we have largely ignored what happens with these compounds in warm areas when deficit irrigation is utilized, especially regarding the concentration of the different anthocyanin fractions and the proportion of each class of anthocyanins. As anthocyanins are one of the most important molecules for wine quality, influencing its color, is important to analyze how water stress could modulate the concentration pattern throughout ripening in the different types of anthocyanins.
Clearly, water stress will change in a context of climate change and much more so in an area with a hot climate that can be affected by the progressive increase in temperatures and water scarcity. Thus, the aim of this study was to evaluate the effect of slightly to moderately controlled water deficits during grape ripening on the concentration of phenolic compounds, especially anthocyanins, in the skins of Cabernet Sauvignon grapes growing in a warm valley, specialized in red wine production, over two consecutive seasons (i.e., 2014 and 2015).

2. Materials and Methods

2.1. Reagents and Equipment

The following reagents were used in this assay: methylcellulose (1500 cP, viscosity at 20 g L−1), acetone, methanol, sodium hydroxide, ammonium sulphate, diethyl ether, ethyl acetate, potassium metabisulfite, phenolphthalein, formic acid, acetonitrile and sodium hydroxide, which were purchased from Merck (Darmstadt, Germany). PVDF membranes of 0.22 and 0.45 µm pore size were acquired from Millipore (Billerica, MA, USA). All reagents used were of analytical grade or higher. The absorbance values were measured using a UV-1601 model UV-Visible spectrophotometer (Shimadzu, Kyoto, Japan). The pH was measured with an 8417N pH meter (Hanna Instruments, Woonsocket, RI, USA). The anthocyanin profile was assessed using an Agilent 1200 Series HPLC System, consisting of a G1315B photodiode array detector (DAD), a G1311A quaternary pump, a G1313A autosampler, a G1322A degasser and a G1316A thermostated column compartment (Agilent Technologies, Santa Clara, CA, USA).

2.2. Experimental Site and Vegetal Material

The assay was carried out in 12-year-old, own-rooted Vitis vinifera L. plants of cv. Cabernet Sauvignon from an organic vineyard located in Central Chile (Haras de Pirque Winery, 33°42′30′′ S, 70°36′13′′ W) during two consecutive seasons (i.e., 2014 and 2015). The experimental site has a warm, semi-arid Mediterranean climate. In brief, the mean maximum and minimum temperatures showed warm conditions during the assay (January to April; see Figure S1), with a mean maximum temperature of 28.9 °C in 2014 and 29.7 °C in 2015 and a mean minimum temperature of 7.1 °C in 2014 and 8.4 °C in 2015. The solar radiation was 925.2 W m−2 in 2014 and 866.05 W m−2 in 2015. The accumulation of degree days (base 10 °C) between January and April was 1356.1 in 2014 and 1332.9 in 2015. In general, no rain occurred in either season (<1 mm). The mean potential evapotranspiration (ETp) during the season was 3.7 mm day−1 in 2014 and 3.6 mm day−1 in 2015. The soil was a deep colluvial type with a texture of 37% clay, 38% silt and 25% sand and between 0 and 60 cm corresponding to a clay loam texture. The pH of the soil was approximately between 7.6 and 7.8. The vineyard was trained using vertical shoot positioning with N–S-oriented rows with a planted distance of 2.5 m between rows and 1.5 m above the row and using a Guyot double pruning system. Water management was carried out using a drip irrigation system. Canopy management is the standard for vineyards located in this area, and the average yield was approximately 8000 kg ha−1.

2.3. Experimental Design, Treatments and Berry Sampling

A randomized complete block design was used in the assay. Five replicates were used in the field, and each replicate consisted of seven consecutive plants, excluding plants in the border of the vineyard or plants that presented evident disease symptoms. All blocks were comprised in one row in the field, and between each treatment in the block, five buffer vines were utilized. Three irrigation treatments were applied every week for up to five days before the last sampling date (commercial harvest) and were established using a combination of drip emitters with different volumes of water, resulting in the following treatments: Treatment 1 (T1) = 12 L h−1 (90% of potential evapotranspiration (ETp), Treatment 2 (T2) = 6 L h−1 (60% of ETp) and Treatment 3 (T3) = 2 L h−1 (30% of ETp). The irrigation regimes selected in this assay correspond to volumes of water commonly used in the production of commercial red wines prioritizing the sustainability of the vineyard. To reduce the stem water potential of the vines, irrigation was suspended 25 days before veraison until 10 days before veraison—that is, the time when irrigation treatments were started. The application of treatments produced the following midday stem water potential during both seasons: T1, Ψ = −0.8 MPa; T2, Ψ = −0.9 MPa; and T3, Ψ = −1.0 MPa. The water status of vines was checked weakly in the field using a Scholander pressure chamber. Further details concerning water status measurements are available in Talaverano et al. [15]. For reference, values from −0.9 to −1.1 MPa are considered to represent weak to moderate water deficits, respectively [16]. Berries were sampled on the following dates: three days before veraison and 13, 27, 41 and 60 days after veraison (DAV). Samples consisting of 50 berries per replicate were randomly collected from five to seven clusters per vine during ripening and were immediately weighed, frozen and stored at −80 °C until processing. The veraison dates (8 February 2014 and 5 February 2015) were determined by visual observation in the field and berry firmness. All treatments were harvested on the same day. This corresponded to the last sampling date (60 days after veraison), which was determined by the chemical parameters and mouthfeel characteristics of the berries.

2.4. Extraction of Phenolic Compounds from Grape Berry Skins

Ten grams of grape skins obtained from 50 berries were subjected to two consecutive extractions under mechanical stirring, first using a methanol–water solution (80:20 v/v) and then an acetone–water solution (80:20 v/v). In each case, 100 mL of solution was used with 60 min of extraction. A sieve was used for the separation of liquid and solid parts of the berries. After extraction, the liquid parts were mixed, centrifuged at 2500× g for 15 min and later evaporated under vacuum using a rotary evaporator at 30 °C to remove methanol and acetone until obtaining 40 mL of aqueous solution. The aqueous solution was adjusted to 100 mL with ultrapure water and was finally filtered through a 0.45 µm PVDF membrane [17]. This aqueous solution was used in all the methodologies for the analysis of phenolic compounds in this assay.

2.5. General Analytical Parameters

The total and skin weights of 50 berries, titratable acidity (g tartaric acid L−1), total soluble solids (°Brix) and pH were determined following OIV protocols [18]. The total phenol content was determined as follows: 1 mL of the aqueous solution was diluted 1:50 v/v) with distilled water and read at 280 nm in a spectrophotometer. Subsequently, the results were quantified by means of a standard curve of gallic acid and expressed as mg GAE (gallic acid equivalent) L−1 [19]. The total tannins were determined using methylcellulose as a precipitant agent. The precipitation of tannins was performed using a 0.04% methylcellulose solution (w/v in deionized water). The tannin concentration was determined by the difference at 280 nm between the tube without the addition of methylcellulose and the methylcellulose precipitated. After that, the content was quantified against a catechin standard curve and expressed as mg catechin g−1 [20]. The total anthocyanin content was measured using the method described by Ribéreau-Gayon and Stonestreet [21]. In brief, a dilution of the aqueous solution (sample) was carried out with a solution of HCl at 2% in ethanol, which was divided into two tubes. Into one of the tubes was added a solution of sodium metabisulfite at 15% (w/v in distilled water), and the other was mixed with distilled water. After 20 min of reaction, the absorbance of both tubes was measured at 520 nm. The anthocyanin concentration was calculated though the differences between both tubes from a calibration curve made with malvidin. The results are expressed in mg malvidin g−1.

2.6. HPLC-DAD Analysis of Anthocyanin Composition

A 2-milliliter sample of aqueous solution from grape skins was filtered through a 0.22 µm PVDF membrane, and an aliquot of 150 µL was subjected to reversed-phase chromatographic separation at 20 °C using a LiChro Cart 100 RP-18 column (5 µm, 4.0 mm × 250 mm, Agilent Technologies, Santa Clara, CA, USA) in an Agilent 1200 series system (Agilent Technologies, Santa Clara, CA, USA). The diode array detector (DAD) was set from 210 to 600 nm. Two mobile phases were utilized: A, water/formic acid (90:10 v/v), and B, acetonitrile. The gradient was applied at a flow rate of 1.1 mL min−1 from 0 to 22 min and 1.5 mL min−1 from 22 to 35 min as follows: 96–85% A from 0 to 22 min, 85–15% A from 12 to 22 min and 85–70% A from 22 to 35 min. Quantification was carried out by measuring the area of the peak at 520 nm. Calibration curves were obtained by injection of different volumes of standard solutions under the same conditions used for the samples over the range of concentration observed (r2 ≥ 0.94) [22].

2.7. Statistical Analysis

For the chemical analyses, analysis of variance (ANOVA) and Tukey’s honestly significant difference (HSD) test were used for mean separation with a significance level of 95% (p < 0.05). Statistical analysis was performed using Minitab 17 software (Minitab, Inc., State College, PA, USA).

3. Results

3.1. Water Relationships

The different irrigation treatments per plant in each treatment resulted in substantial differences in the stem water potential throughout ripening over the two seasons. The average xylem water potentials in 2014 were −0.83 ± 0.03 MPa for T1, −0.09 ± 0.03 MPa for T2 and −1.00 ± 0.03 MPa for T3. In 2015, the values were −0.85 ± 0.02 MPa for T1, −0.96 ± 0.02 MPa for T2 and −1.04 ± 0.01 MPa for T3. Statistical differences in water potentials were observed, particularly when irrigation was resumed before veraison. More details regarding the evolution of the xylem water potential throughout ripening over both seasons are available in Talaverano et al. [15].

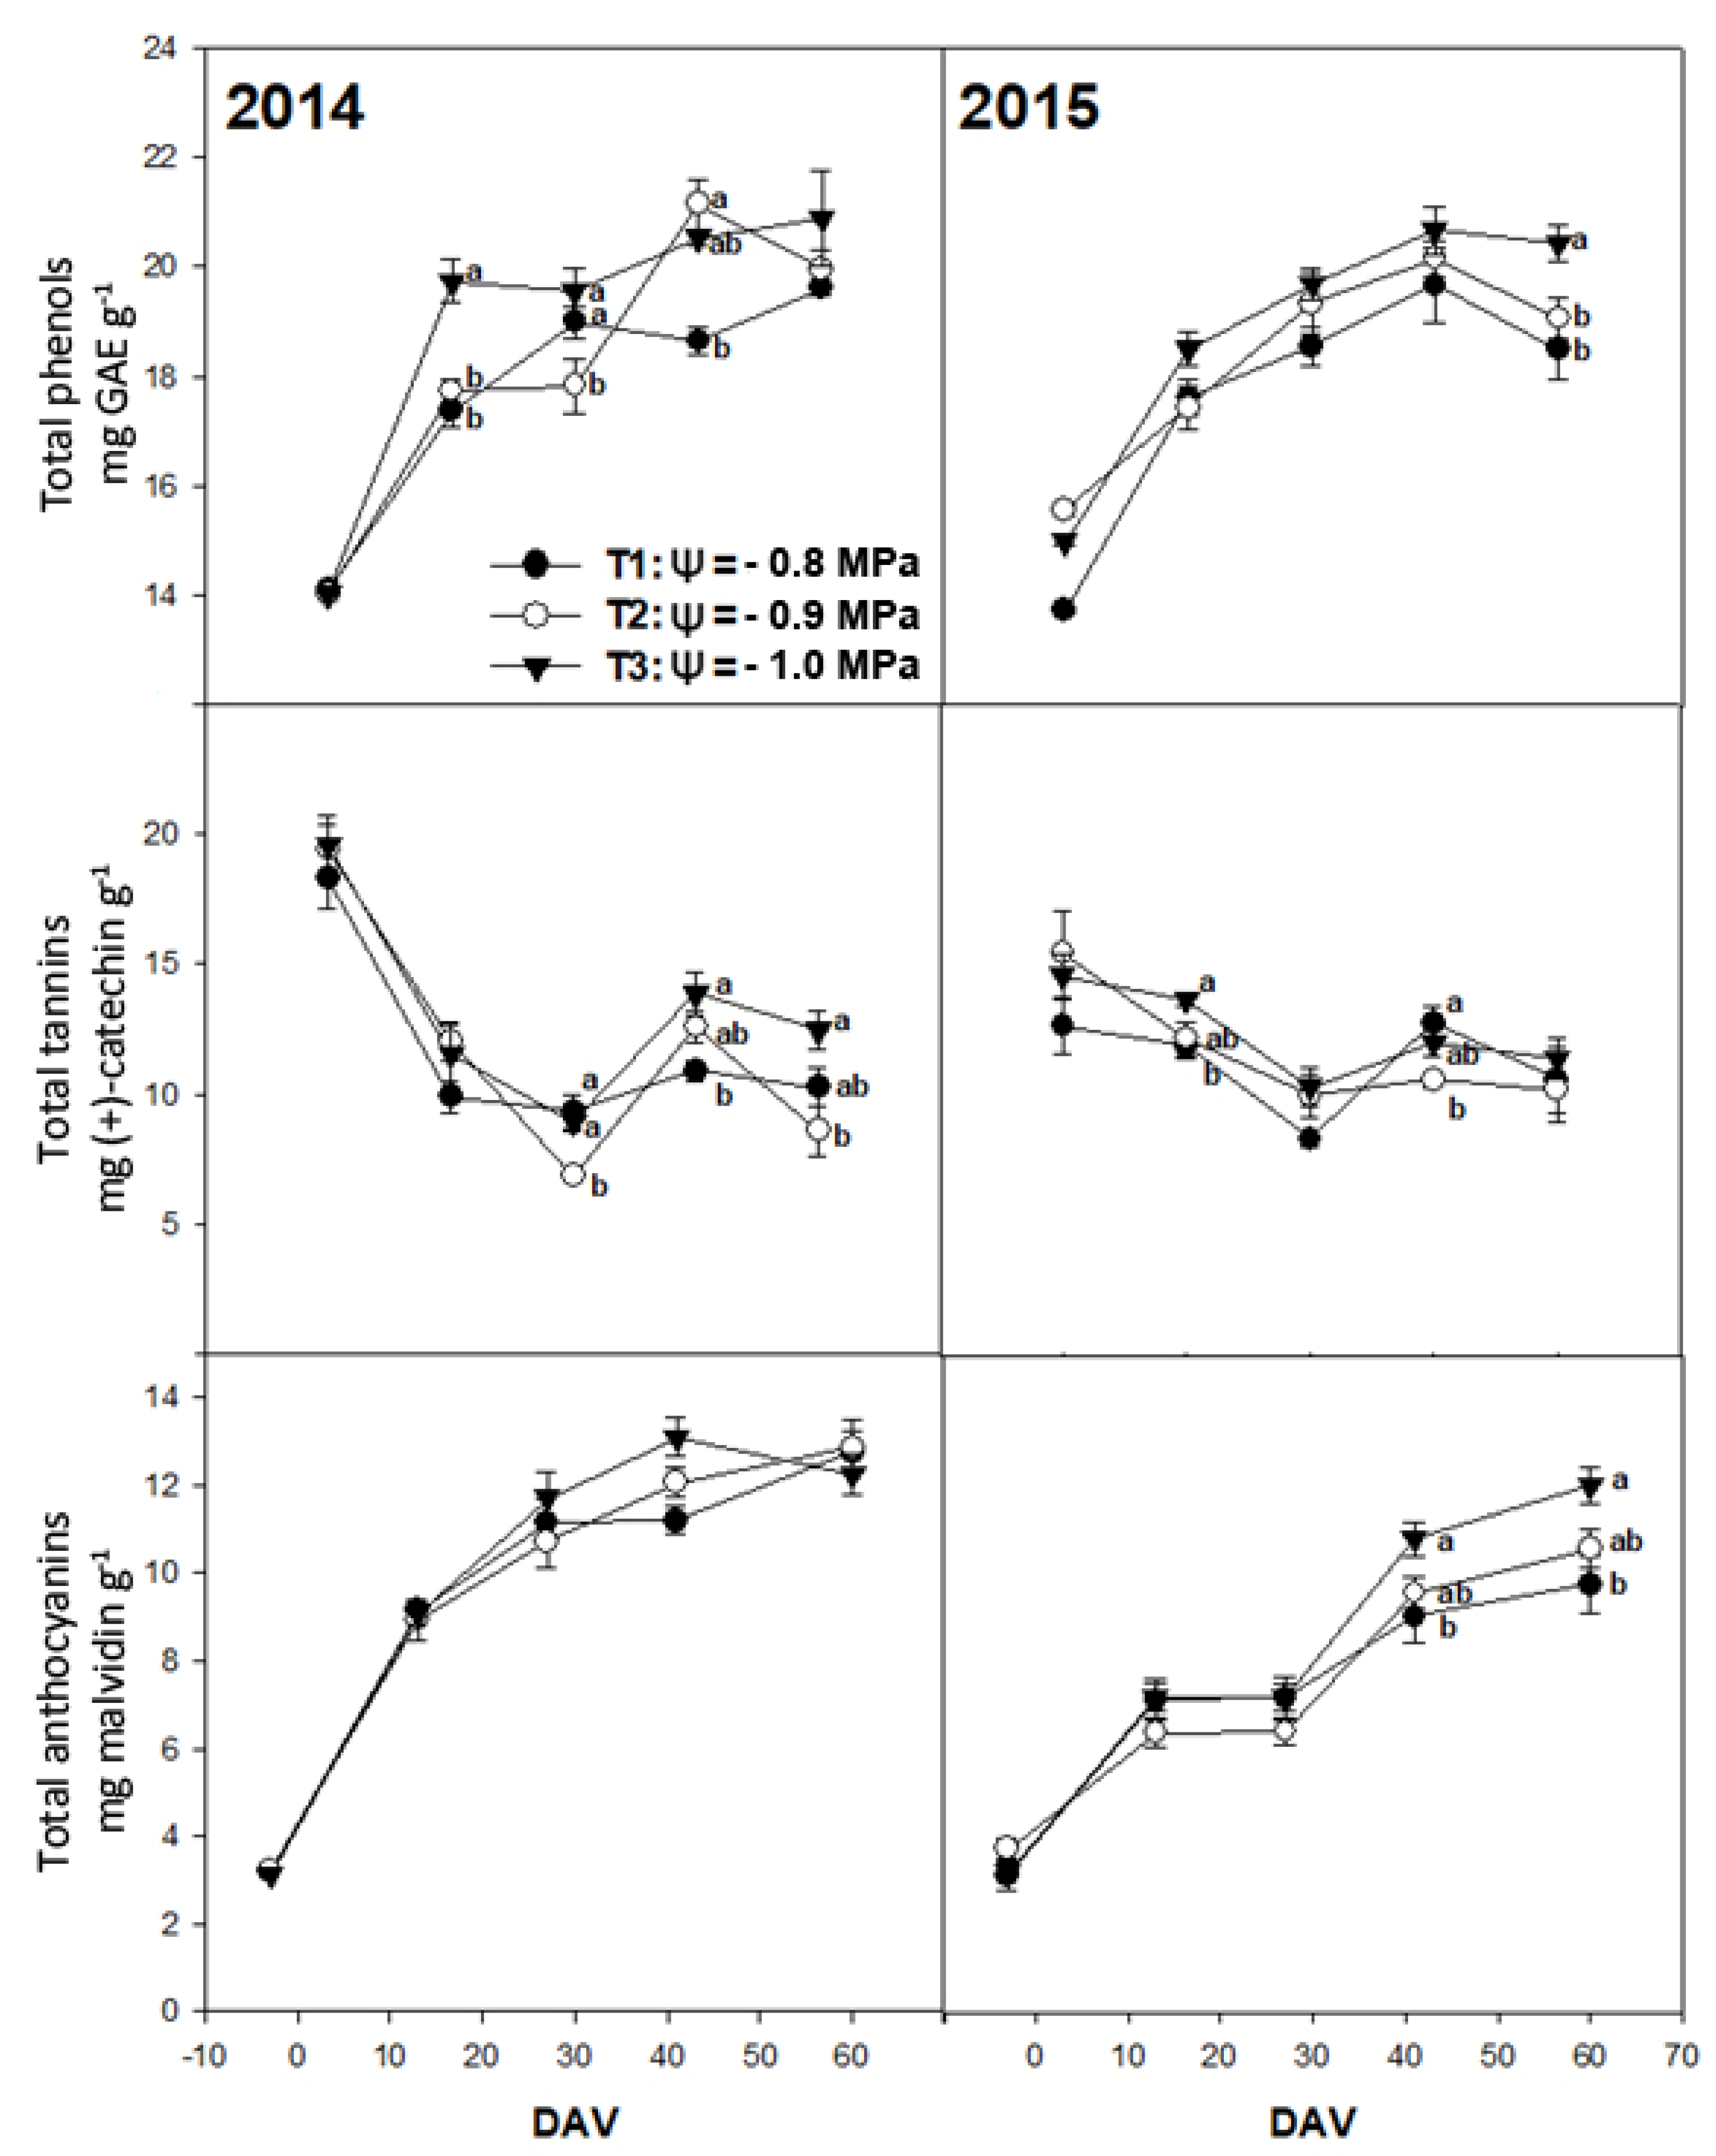
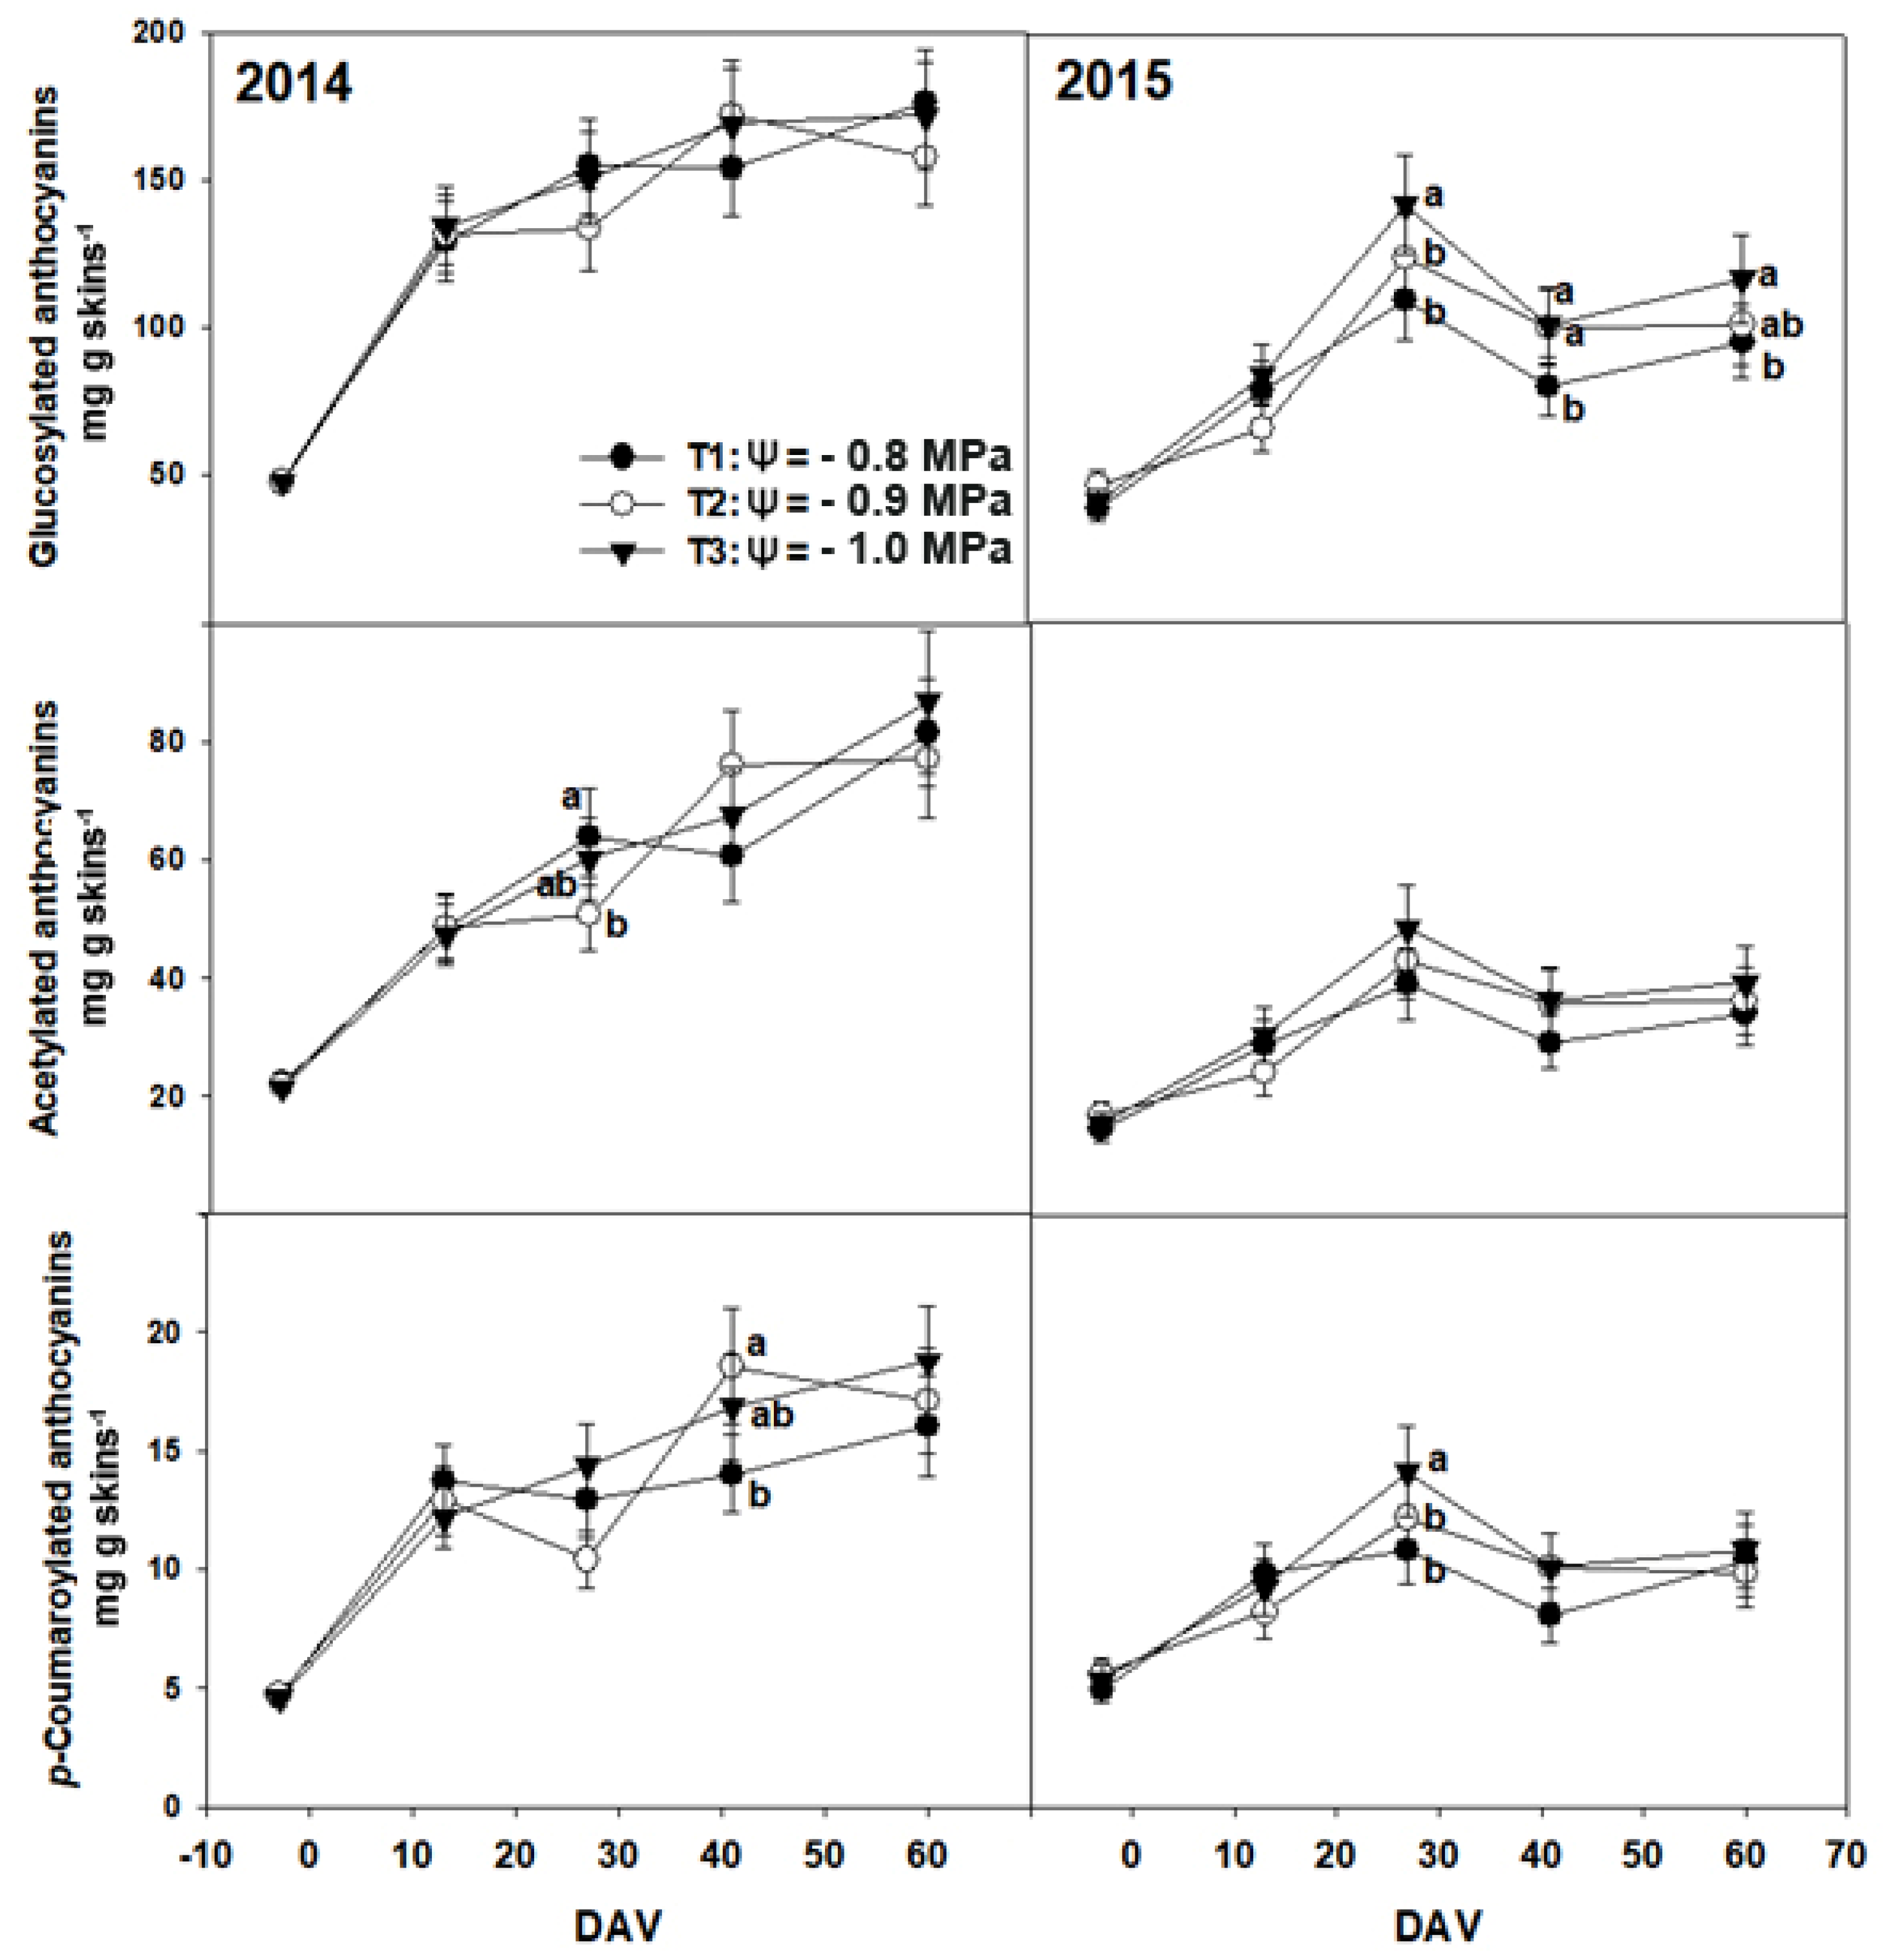
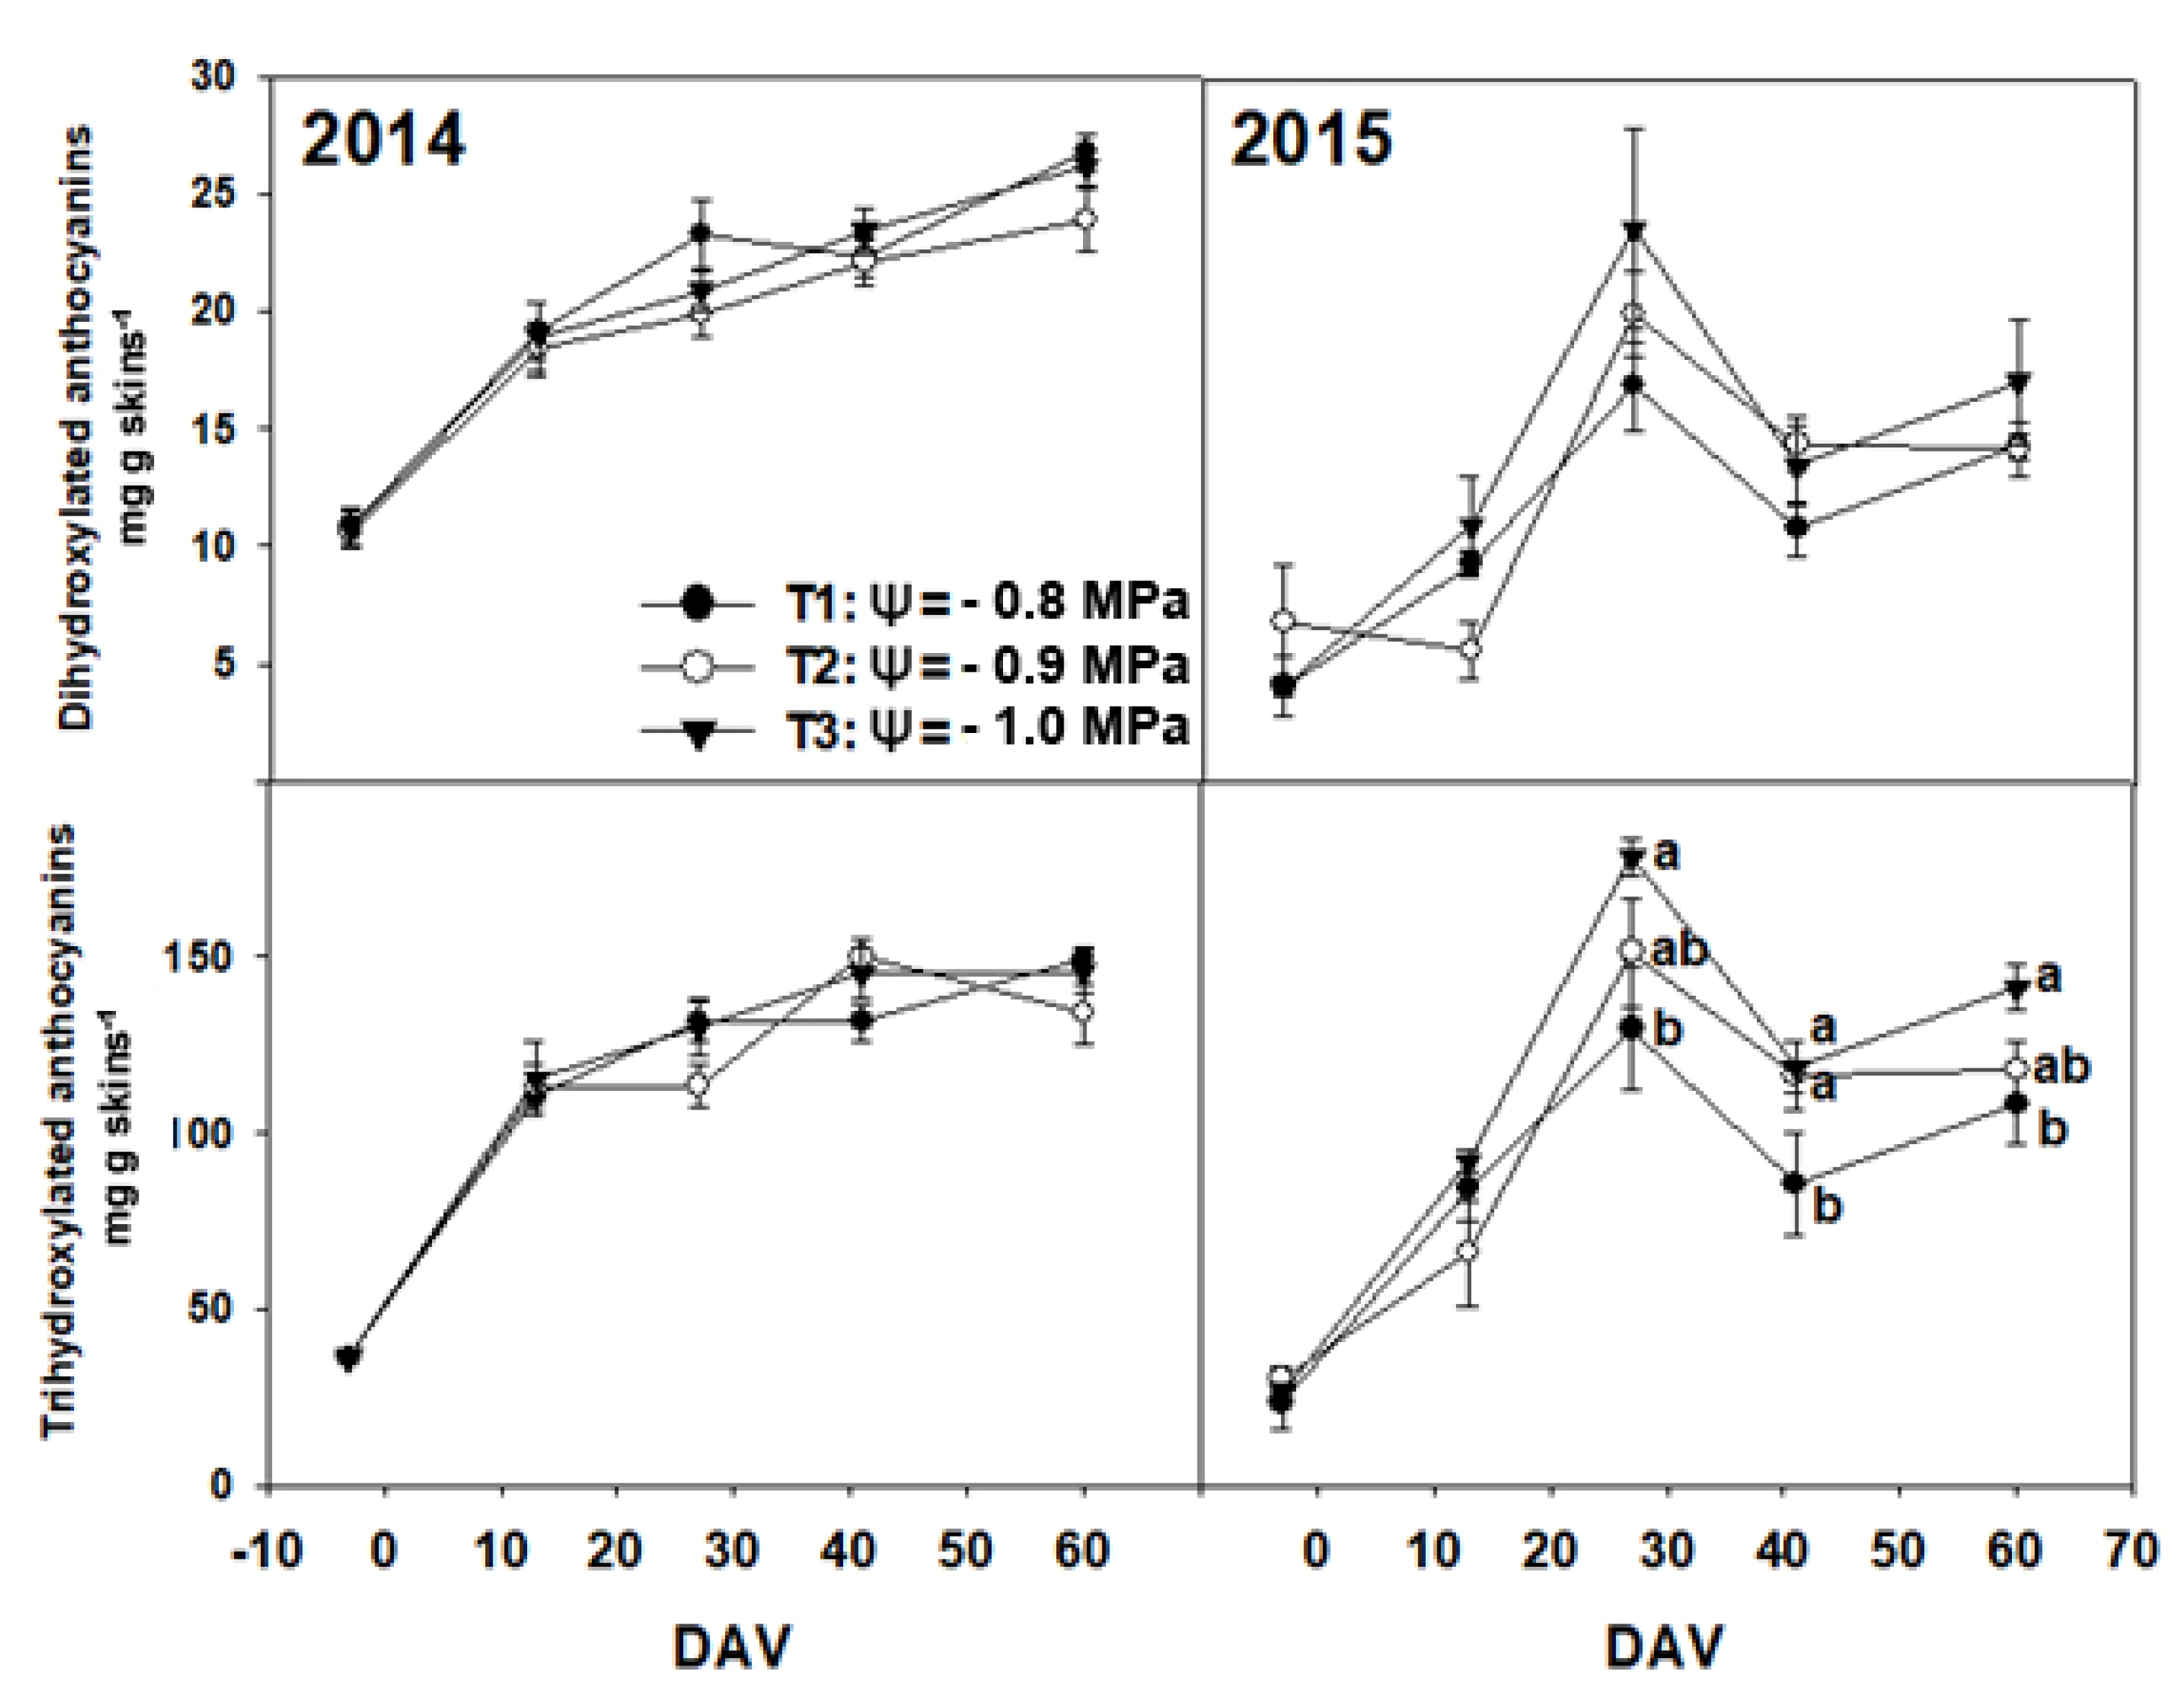
3.2. Chemical Composition of Grapes

In general, and as expected, the pH constantly increased during grape berry ripening over the two seasons. This parameter varied between 2.56 and 3.59 in 2014 and between 2.81 and 3.73 in 2015, with differences between irrigation treatments (Table 1). Concomitantly, the titratable acidity diminished throughout grape berry ripening, from 15.45 to 2.97 g tartaric acid L−1 in 2014 and from 12.40 to 3.45 g tartaric acid L−1 in 2015, again with differences between treatments at 41 DAV in 2014 and 13 DAV in 2015. Regarding soluble solid content, °Brix increased from 12.88 to 21.57 in 2014 and from 12.00 to 21.27 in 2015 (Table 1). In both seasons, there were significant differences between treatments at 41 DAV, and particularly during the 2015 season, differences were also present at 27 DAV, although similar values were reached at harvest. The average berry weight varied from 0.98 to 1.16 g in 2014 and from 0.85 to 1.21 g in 2015. Water deficit increased the skin weight to berry weight ratio throughout ripening, especially in the 2014 season (Table 1).
Total phenols increased over ripening from 14.04 to 20.87 mg GAE g−1 in 2014 and from 13.73 to 20.42 mg GAE g−1 in 2015 (Figure 1). Some differences among treatments were found, as T2 and T3 led to higher concentrations of phenolic compounds than T1, especially in 2015, when T3 maintained higher levels of these compounds at harvest. In both seasons, the concentration of total tannins decreased from veraison until approximately 25 DAV but rose again until approximately 45 DAV (Figure 1). Significant differences in tannins between treatments were observed on some of the sampling dates, with higher concentrations in T2 and T3. Regarding total anthocyanins, a step increase in concentration was observed from veraison until 45 DAV, from 3.12 to 12.84 mg malvidin g−1 in 2014, while a lag between 15 and 30 DAV occurred in 2015, reaching 11.98 mg malvidin g−1, which was a lower average concentration compared with the previous season (Figure 1). In 2015, there were significant differences among treatments, with a higher concentration in grapes from T3 at the end of grape berry ripening and harvest.
The profiles of glucosylated, acetylated and p-coumaroylated anthocyanins are shown in Tables S1–S3, respectively. Some differences were observed in some anthocyanins, but in general terms, the irrigation treatments did not produce changes in the anthocyanin profile, and a clear seasonal effect was found to produce a higher concentration of the three types of anthocyanins in the 2014 season. To analyze the effect of the treatments on anthocyanins during ripening, these compounds were grouped into three categories: glucosylated, acetylated and coumaroylated. During the 2015 season, the grapes from T3 reached the highest average concentration of glucosylated anthocyanins at 13, 27 and 60 DAV, while coumaroylated anthocyanins reached a peak at 27 DAV, displaying significant differences in all cases compared with the control. In 2014, on the other hand, T2 reached a transiently lower concentration of acetylated anthocyanins at 27 DAV while reaching a significantly higher concentration of coumaroylated anthocyanins than T1 at 41 DAV (Figure 2).
For the number of substitutes in the B-ring of the chemical structure of anthocyanins, the concentration of dihydroxylated anthocyanins went from 10.58 to 26.78 mg g−1 in 2014 and from 5.94 to 15.04 mg g−1 in 2015 yet did not show clear effects by irrigation treatment (Figure 3). In contrast, the trihydroxylated anthocyanins ranged from 35.97 to 150 mg g−1 in 2014 and from 34.29 to 127.03 mg g−1 in 2015 (Figure 3). The trihydroxylated anthocyanins were much higher in concentration than the dihydroxylated counterparts in both seasons, resulting in a strong reduction in the dihydroxylated-to-trihydroxylated ratio, with no significant differences between treatments. The evolution of these compounds was season-dependent, with a progressive increase in concentration in 2014, while in 2015, a transient reduction was observed at 30 DAV, slightly increasing again from 40 DAV. Additionally, in 2015, the most restrictive irrigation treatment resulted in a higher concentration of trihydroxylated anthocyanins (Figure 3).
The proportion of the different types of anthocyanins at harvest did not show significant differences between treatments (Figure 4).

4. Discussion

Our study was carried out in Central Chile, which is the most important wine production area of the country and is characterized by a Mediterranean climate with dry summers. The Multicriteria Climatic Classification System developed by Tonietto and Carbonneau [23] showed that this geographic zone corresponds to a temperate warm zone (HI+1) with very cool nights (CI+2) and very dry conditions (DI+2). In addition, this area has been under a megadrought event for the past 10 years, with precipitation lower than 20–40% on average compared with a normal year [24]. The extent of water shortages has become a threat for the future cultivation of grapevines [2,25]. Among the cultivated species, however, Vitis vinifera L. is a species recognized as water-stress-tolerant, associated with a deep rooting system and with different hydraulic responses depending on the variety [26,27]. The abovementioned xylem water potential values are common in Mediterranean wine-producing areas [28], and they are considered slight (T1) to moderate (T3) water deficits [16]. However, the combination of a low water supply with high temperatures leads to a high vapor pressure deficit at the leaf–atmosphere interface, a phenomenon that is common at the study site and might end in earlier leaf shedding in vineyards, thus negatively affecting the carbon balance and the sugar supply to grape berries as well as yield and berry quality [1,4,29,30]. It is well known that water deficit results in smaller grape berries [31], but changes in the skin-to-pulp ratio might also occur. Indeed, a similar pattern was observed in our study toward the end of grape berry ripening in 2014 and only transiently after veraison in 2015. For sugar accumulation, it has been reported that water stress induces an earlier sugar load at veraison but with no important differences at the end of berry ripening. This effect is mediated by ABA and involves sugar transporter proteins in grapes [32,33]. In the present study, differences in sugar accumulation were observed in 2014 rather late in the ripening stage, with higher °Brix in control berries. In contrast, differences were observed earlier in 2015, but this time with higher concentrations in the more restricted berries (Table 1). These discrepancies might have been related to the fact that the sugar concentration in grape berries under water deficit results from the balance of the carbon export capacity, affected by stomatal limitations, and the grape berry volume, which is also affected by water availability [32]. In this regard, seasonal differences were evident in terms of the impact of water stress on the grape berry sugar concentration. It should be highlighted that water stress induced fasting on sugar accumulation in grape berries, something that has been observed very close to veraison [3] and that might have occurred earlier than 13 DAV, the earliest sampling date from ripening in our study. Together, sugars and abscisic acid act as synergistic signals triggering and modulating the gene expression of proteins involved in the synthesis of phenolic compounds in berry skins, leading to the accumulation of flavonols and anthocyanins [33,34]. Additionally, higher concentrations of secondary metabolites in berries result from reductions in the grape berry volume, increasing the skin-to-pulp ratio [31]. It is unlikely that this was the case in this study since no differences in the berry weight or skin-to-pulp ratio occurred during the irrigation treatments (Table 1). Therefore, the differences observed in total phenols, tannins and anthocyanins (Figure 1) were likely a result of a metabolic response. Tannins are thought to accumulate up to a maximum concentration at veraison, decreasing afterward during berry ripening [35]. Recently, it was reported in the Carménère variety that tannin synthesis resumed nearly 30 to 40 DAV, supported by an increase in the gene expression of proteins involved in tannin synthesis [33]. This was also observed in the present study during both seasons, as tannins increased in concentration after 25 DAV, which, as reported before, might have resulted from the positive response of genes such as VvLAR2, involved in the synthesis of (+)-catechin [36]; VvMYBPA1 and VvMYBPA2, all of which are involved in tannin synthesis [37] and have been observed to be responsive to water stress [38].
For the anthocyanins, when considering all these compounds during the 2015 season, differences were recorded toward the end of ripening, where the greater water restriction caused a higher concentration, which is consistent with previous studies [39,40,41]; however, in the different groups of anthocyanins, i.e., glycosylated, acetylated or p-coumaroylated, only small differences were observed, although in 2015, the higher concentration of glucosylated anthocyanins (Figure 2) could explain the higher concentration of total anthocyanins in the same season (Figure 1). A different behavior was observed in these types of anthocyanins during the 2014 and 2015 seasons, probably due to a seasonal effect, but the pattern of accumulation throughout the season in each type of anthocyanin was similar compared with the different treatments, although there was a higher concentration of these types of anthocyanins in 2014 compared with 2015. Other authors [3,5,42] have reported an increase in the concentration of anthocyanins caused by the combined effect of a smaller berry size and a greater concentration of these compounds; in this study, however, it seems that the increase in concentration was related to a greater quantity of anthocyanins and not to a smaller berry size (Table 1, Figure 1). Sofo et al. [43] also reported an increase in acetylated anthocyanin concentration in berries of the cv. Aglianico grown under rainfed conditions, but in this study, we observed an opposite effect, with no differences between treatments for this type of anthocyanin (Figure 2). The differences in climatic conditions, the higher water restriction due to rainfed growing conditions and the different grape varieties could explain the differences observed above [13]. Differences regarding the anthocyanin concentration were also observed when these compounds were grouped according to the hydroxylation of the B-ring in flavonoid compounds. This hydroxylation determines the coloration, stability and antioxidant capacity of these compounds [44]. The accumulation curve was different depending on the season but with an increase during ripening in both years. The differences due to the irrigation treatments caused differences only in the trihydroxylated anthocyanins, which were highly dependent on the season. In addition, when the proportion of the different types of anthocyanins was analyzed, no differences were observed at harvest, which could indicate that the different irrigation treatments did not influence a greater accumulation of one or another type of anthocyanin. In general, the concentration of anthocyanins in grapes from the same geographic location changes from year to year, probably because of differences in the biosynthesis of these compounds modulated by different climatic conditions during the grape-growing season [40,41,45,46]; however, in this study, we found differences in terms of concentration in some types of anthocyanins. In previous studies by our research group, water stress produced differences, especially in the concentration and composition of proanthocyanidins, with changes in their concentration toward the end of ripening and especially an increase in their size in the more restrictive irrigation treatment. This was related positively to the expression of genes and transcription factors involved in the synthesis of proanthocyanidins [38], especially VvMYB4a, a negative regulator of the synthesis of low molecular weight phenols [37], with a higher expression in the more restrictive irrigation treatments. This transcription factor could act as a biochemical valve, diverting substrates from the phenylpropanoid pathway toward the production of proanthocyanidins instead of small phenols, such as anthocyanins. This behavior could explain the minor differences in the concentration and composition of anthocyanins found between treatments in this work.

5. Conclusions

The results from this study highlight how challenging it can be to apply a desired regulated deficit irrigation system at the vineyard level. The irrigation regimes applied in this study were quite different (i.e., T1 = 12 L h−1 (90% of ETp), T2 = 6 L h−1 (60% of ETp) and T3 = 2 L h−1 (30% of ETp)). However, the resulting stem water potentials were consistently mild (T1, Ψ = −0.8 MPa; T2, Ψ = −0.9 MPa; and T3, Ψ = −1.0 MPa). Nevertheless, we found that controlled water deficit produced a slight increase in tannin concentration after 25 DAV. The concentration of total anthocyanins showed significant differences among treatments, but these differences were influenced by the seasons. Mild water stress generated changes regarding the different fractions of anthocyanins—i.e., glycosylated, acetylated and p-coumaroylated—with a different behavior between the 2014 and 2015 seasons, but the pattern of accumulation during the season in each type of anthocyanin was similar compared with the different treatments, although the concentration was different between seasons. The trihydroxylated anthocyanins were much higher in concentration than their dihydroxylated counterparts in both seasons, with no significant differences between treatments, and again, the evolution of these compounds during ripening was season-dependent. Finally, no differences in terms of the different anthocyanin proportions were observed at harvest, which could indicate that the different irrigation treatments did not influence a greater accumulation of one or another type of anthocyanin. Future studies involving gene expression that encodes the synthesis of these compounds are necessary to observe changes regarding the different types of anthocyanins that are present in grapes. Working with a narrow range of stem water potential is desired since we think most of important effects in secondary metabolism are happening in the water stress region presented in the study. Moreover, our data are field-based for this specific region of Chile and are very important for viticulturists and winemakers that work in this warm climate area. Most likely, the plants in the vineyard under study had a root system that allowed the plants to explore the soil for water resources, yielding mild differences in terms of plant water status. This is probably true in many wine-growing regions of the world with similar conditions of soil and climate. Future studies should take this into account and try to understand whether the results presented here hold for different cultivar/rootstock combinations.

Supplementary Materials

The following supporting information can be downloaded at: https://www.mdpi.com/article/10.3390/horticulturae8090796/s1, Table S1: Glucosylated anthocyanins in Cabernet Sauvignon grape skins throughout ripening (2014 and 2015 seasons); Table S2: Acetylated anthocyanins in Cabernet Sauvignon grape skins throughout ripening (2014 and 2015 seasons); Table S3: p-coumaroylated anthocyanins in Cabernet Sauvignon grape skins throughout ripening (2014 and 2015 seasons).

Author Contributions

Conceptualization, A.C.-M.; formal analysis, G.A. and I.F.C.; investigation, G.A. and I.F.C.; resources, C.P. and A.C.-M.; data curation, G.A.; writing—original draft preparation, G.A. and A.C.-M.; writing—review and editing, I.F.C., C.P. and A.C.-M.; visualization, I.F.C., C.P. and A.C.-M.; project administration, A.C.-M.; funding acquisition, A.C.-M. All authors have read and agreed to the published version of the manuscript.

Funding

This work was funded by the Agencia Nacional de Investigación y Desarrollo (ANID-Chile), Fondecyt Postdoctoral Fund (grant number 3140269).

Institutional Review Board Statement

Not applicable.

Informed Consent Statement

Not applicable.

Data Availability Statement

The data presented in this study are available on request from the corresponding author.

Acknowledgments

The authors thank Haras de Pirque vineyards for their collaboration with the plant material and field support.

Conflicts of Interest

The authors declare that this research was conducted in the absence of any commercial or financial relationships that could be construed as a potential conflict of interest.

References

  1. Jones, G.; White, M.; Cooper, O.; Storchmann, K. Climate change and global wine quality. Clim. Change 2005, 73, 319–343. [Google Scholar] [CrossRef]
  2. Hannah, L.; Roehrdanz, P.R.; Ikegami, M.; Shepard, A.V.; Shaw, M.R.; Tabor, G.; Zhi, L.; Marquet, P.A.; Hijmans, R.J. Climate change, wine, and conservation. Proc. Natl. Acad. Sci. USA 2013, 110, 6907–6912. [Google Scholar] [CrossRef] [PubMed]
  3. Castellarin, S.; Matthews, M.; Di Gaspero, G.; Gambetta, G. Water deficits accelerate ripening and induce changes in gene expression regulating flavonoid biosynthesis in grape berries. Planta 2007, 227, 101–112. [Google Scholar] [CrossRef]
  4. Chaves, M.; Santos, T.; Souza, C.; Ortuño, M.; Rodrigues, M.; Lopes, C.; Maroco, J.; Pereira, J. Deficit irrigation in grapevine improves water-use efficiency while controlling vigour and production quality. Ann. Appl. Biol. 2007, 150, 237–252. [Google Scholar] [CrossRef]
  5. Bucchetti, B.; Matthews, M.; Falginella, L.; Peterlunger, E.; Castellarin, S. Effect of water deficit on Merlot grape tannins and anthocyanins across four seasons. Sci. Hortic. 2011, 128, 297–305. [Google Scholar] [CrossRef]
  6. Villangó, S.; Szekeres, A.; Bencsik, O.; Láposi, R.; Pálfi, Z.; Zsófi, Z. The effect of post veraison water deficit on the phenolic composition and concentration of the Kékfrankos (Vitis vinifera L.) berry. Sci. Hortic. 2016, 209, 113–116. [Google Scholar] [CrossRef]
  7. Cáceres-Mella, A.; Ribalta-Pizarro, C.; Villalobos-González, L.; Cuneo, I.; Pastenes, C. Controlled water deficit modifies the phenolic composition and sensory properties in Cabernet Sauvignon wines. Sci. Hortic. 2018, 237, 105–111. [Google Scholar] [CrossRef]
  8. Castañeda-Ovando, A.; Pacheco-Hernández, M.; Páez-Hernández, M.; Rodríguez, J.; Galán-Vidal, C. Chemical studies of anthocyanins: A review. Food Chem. 2009, 113, 859–871. [Google Scholar] [CrossRef]
  9. Cheynier, V.; Dueñas-Paton, M.; Salas, E.; Maury, C.; Souquet, J.M.; Sarni-Manchado, P.; Fulcrand, H. Structure and properties of wine pigments and tannins. Am. J. Enol. Vitic. 2006, 57, 298–305. [Google Scholar]
  10. Downey, M.; Harvey, J.; Robinson, S. The effect of bunch shading of berry development and flavonoid accumulation in Shiraz grapes. Aust. J. Grape Wine Res. 2004, 10, 55–73. [Google Scholar] [CrossRef]
  11. Mori, K.; Goto-Yakamoto, N.; Kitayama, M.; Hashizume, K. Loss of anthocyanins in red-wine grape under high temperature. J. Exp. Bot. 2007, 58, 1935–1945. [Google Scholar] [CrossRef] [PubMed]
  12. Romero-Cascales, I.; Fernández-Fernández, J.; López-Roca, J.M.; Gómez-Plaza, E. The maceration process during winemaking. Extraction of anthocyanins from grape skins into wine. Eur. Food Res. Technol. 2005, 221, 163–167. [Google Scholar] [CrossRef]
  13. Romero, P.; Navarro, J.; Botía Ordaz, P. Towards a sustainable viticulture: The combination of deficit irrigation strategies and agroecological practices in Mediterranean vineyards. A review and update. Agric. Water Manag. 2022, 259, 107216. [Google Scholar] [CrossRef]
  14. Zarrouk, O.; Francisco, R.; Pinto-Marijuan, M.; Brossa, R.; Santos, R.; Pinheiro, C.; Costa, J.; Lopes, C.; Chaves, M. Impact of irrigation regime on berry development and flavonoids composition in Aragonez (Syn. Tempranillo) grapevine. Agric. Water Manag. 2012, 114, 18–29. [Google Scholar] [CrossRef]
  15. Talaverano, I.; Ubeda, C.; Cáceres-Mella, A.; Valdés, M.E.; Pastenes, C.; Peña-Neira, A. Water stress and ripeness effects on the volatile composition of Cabernet Sauvignon wines. J. Sci. Food Agric. 2018, 98, 1140–1152. [Google Scholar] [CrossRef]
  16. Van Leuween, C.; Tregoat, O.; Choné, X.; Bois, B.; Pernet, D.; Gaudillère, J.P. Vine water status is a key factor in grape ripening and vintage quality for red Bordeaux wine. How can it be assessed for vineyard management purposes? J. Int. Sci. Vigne Vin. 2009, 43, 121–134. [Google Scholar] [CrossRef]
  17. Izquierdo-Hernández, A.; Peña-Neira, A.; López-Solís, R.; Obreque-Slier, E. Low molecular weight phenols, and flavanol fractions in Vitis vinifera L. cv Carménère skins and seeds by differential solvent extraction and high performance liquid chromatography. Anal. Lett. 2015, 49, 1127–1142. [Google Scholar] [CrossRef]
  18. OIV (International Organization of Vine and Wine). Compendium of International Methods of Wine and Must Analysis; OIV: Paris, France, 2012. [Google Scholar]
  19. Glories, Y. La coleur des vins rouges. 2eme Partier. Mesure, origine et interpretation. Connaiss. Vigne Vin. 1984, 18, 253–271. [Google Scholar]
  20. Sarneckis, C.; Dambergs, R.; Jones, P.; Mercurio, M.; Herderich, M.; Smith, P. Quantification of condensed tannins by precipitation with methylcellulose: Development and validation of an optimized tool for grape and wine analysis. Aust. J. Grape Wine Res. 2006, 12, 39–49. [Google Scholar] [CrossRef]
  21. Ribéreau-Gayon, J.; Stonestreet, E. Le dosage des anthocyanies dans le vin rouge. Bull. Soc. Chim. Fr. 1965, 9, 2649–2652. [Google Scholar]
  22. Fanzone, M.; Peña-Neira, A.; Gil, M.; Jofré, V.; Assof, M.; Zamora, F. Impact of phenolic and polysaccharidic composition on commercial value of Argentinean Malbec and Cabernet Sauvignon wines. Food Res. Int. 2012, 45, 402–414. [Google Scholar] [CrossRef]
  23. Tonietto, J.; Carbonneau, A. A multicriteria climatic classification system for grape-growing regions worldwide. Agric. For. Meteorol. 2004, 124, 81–97. [Google Scholar] [CrossRef]
  24. Garreaud, R.; Boisier, J.; Rondanelli, R.; Montecinos, A.; Sepúlveda, H.; Veloso-Aguila, D. The Central Chile mega drought (2010–2018): A climate dynamics perspective. Int. J. Climatol. 2020, 40, 421–439. [Google Scholar] [CrossRef]
  25. Kizildeniz, T.; Mekni, I.; Santesteban, H.; Pascual, I.; Morales, F.; Irigoyen, J.J. Effects of climate change including elevated CO2 concentration, temperature and water deficit on growth, water status, and yield quality of grapevine (Vitis vinifera L.) cultivars. Agric. Water Manag. 2015, 159, 155–164. [Google Scholar] [CrossRef]
  26. Patakas, A.; Noitsakis, B. Mechanisms involved in diurnal changes of osmotic potential in grapevines under drought conditions. J. Plant Physiol. 1999, 154, 767–774. [Google Scholar] [CrossRef]
  27. Lovisolo, C.; Hartung, W.; Schubert, A. Whole-plant hydraulic conductance and root-to-shoot flow of abscisic acid are independently affected by water stress in grapevines. Funct. Plant Biol. 2002, 29, 1349–1356. [Google Scholar] [CrossRef]
  28. Choné, X.; Van Leeuwen, C.; Dubourdieu, D.; Gaudillere, J.P. Stem water potential is a sensitive indicator of grapevine water status. Ann. Bot. 2001, 87, 477–483. [Google Scholar] [CrossRef]
  29. Escalona, J.; Flexas, J.; Medrano, H. Stomatal and non-stomatal limitations of photosynthesis under water stress in field-grown grapevines. Aust. J. Plant Physiol. 1999, 26, 421–433. [Google Scholar] [CrossRef]
  30. Chaves, M.; Zarrouk, O.; Francisco, R.; Costa, J.; Santos, T.; Regalado, A.; Rodrigues, M.; Lopes, C. Grapevine under deficit irrigation: Hints from physiological and molecular data. Ann. Bot. 2010, 105, 661–676. [Google Scholar] [CrossRef]
  31. Thomas, T.; Matthews, M.; Shackel, K. Direct in situ measurement of cell turgor in grape (Vitis vinifera L.) berries during development and in response to plant water deficits. Plant Cell Environ. 2006, 29, 993–1001. [Google Scholar] [CrossRef]
  32. Pastenes, C.; Villalobos, L.; Rios, N.; Reyes, F.; Turgeon, R.; Franck, N. Carbon partitioning in berries in water stressed grapevines: The role of active transport in leaves and fruits. Environ. Exp. Bot. 2014, 107, 154–166. [Google Scholar] [CrossRef]
  33. Villalobos-González, L.; Peña-Neira, A.; Ibáñez, F.; Pastenes, C. Long-term effects of abscisic acid (ABA) on the grape Berry phenylpropanoid pathway: Gene expression and metabolite content. Plant Physiol. Biochem. 2016, 105, 213–223. [Google Scholar] [CrossRef] [PubMed]
  34. Guo, S.-H.; Yang, B.-H.; Wang, X.-W.; Li, J.-N.; Li, S.; Yang, X.; Ren, R.-H.; Fang, Y.-L.; Xu, T.-F.; Zhang, Z.-W.; et al. ABA signaling plays a key role in regulated deficit irrigation-driven anthocyanins accumulation in Cabernet Sauvignon grape berries. Environ. Exp. Bot. 2022, 181, 104290. [Google Scholar] [CrossRef]
  35. Hanlin, R.; Downey, M. Condensed tannin accumulation and composition in skin of Shiraz and Cabernet Sauvignon grapes during berry development. Am. J. Enol. Vitic. 2009, 60, 13–23. [Google Scholar]
  36. Bogs, J.; Downey, M.; Harvey, J.; Ashton, A.; Tanner, G.; Robinson, S. Proanthocyanidin synthesis and expression of genes encoding leucoanthocyanidin reductase and anthocyanidin reductase in developing grape berries and grapevine leaves. Plant Physiol. 2005, 139, 652–663. [Google Scholar] [CrossRef]
  37. Matus, J.; Loyola, R.; Vega, A.; Peña-Neira, A.; Bordeau, E.; Arce-Johnson, P.; Alcalde, J.A. Post-veraison sunlight exposure induces MYB-mediated transcriptional regulation of anthocyanin and flavonol synthesis in berry skins of Vitis vinifera. J. Exp. Bot. 2009, 60, 853–867. [Google Scholar] [CrossRef]
  38. Cáceres-Mella, A.; Talaverano, M.I.; Villalobos-González, L.; Ribalta-Pizarro, C.; Pastenes, C. Controlled water deficit during ripening affects proanthocyanidin synthesis, concentration and composition in Cabernet Sauvignon grape skins. Plant Physiol. Biochem. 2017, 117, 34–41. [Google Scholar] [CrossRef]
  39. Lizama, V.; Pérez-Álvarez, E.; Intrigliolo, D.; Chirivella, C.; Álvarez, I.; García-Esparza, M.J. Effects of the irrigation regimes on grapevine cv. Bobal in a Mediterranean climate: II. Wine, skins, seeds, and grape aromatic composition. Agric. Water Manag. 2021, 256, 107078. [Google Scholar] [CrossRef]
  40. Yang, B.; He, S.; Liu, Y.; Liu, B.; Ju, Y.; Kang, D.; Sun, X.; Fang, Y. Transcriptomic integrated with metabolomics reveals the effect of regulated deficit irrigation on anthocyanin biosynthesis in Cabernet Sauvignon grape berries. Food Chem. 2020, 314, 126170. [Google Scholar] [CrossRef]
  41. Calderan, A.; Sivilotti, P.; Braidotti, R.; Mihelcic, A.; Lisjak, K.; Vanzo, A. Managing moderate water deficit increases anthocyanin concentration and proanthocyanidin galloylation in “Refosk” grapes in Northeast Italy. Agric. Water Manag. 2021, 246, 106684. [Google Scholar] [CrossRef]
  42. Castellarin, S.; Ofeiffer, A.; Sivilotti, P.; Degan, M.; Peterlunger, E.; Di Gaspero, G. Transcriptional regulation of anthocyanin biosynthesis in ripening fruits of grapevine under seasonal water deficit. Plant Cell Environ. 2007, 30, 1381–1399. [Google Scholar] [CrossRef] [PubMed]
  43. Sofo, A.; Nuzzo, V.; Tataranni, G.; Manfra, M.; De Nisco, M.; Scopa, A. Berry morphology and composition in irrigated and non-irrigated grapevine (Vitis vinifera L.). J. Plant Physiol. 2012, 169, 1023–1031. [Google Scholar] [CrossRef]
  44. Bogs, J.; Ebabi, A.; McDavid, D.; Robinson, S. Identification of the flavonoid hydrolases from grapevine and their regulation during fruit development. Plant Physiol. 2006, 140, 179–291. [Google Scholar] [CrossRef] [PubMed]
  45. Perez-Alvarez, E.P.; Intrigliolo, D.; Vivaldi, G.A.; García-Esparza, M.J.; Lizama, V.; Alvarez, I. effects of the irrigation regimes on grapevine cv. Bobal in a Mediterranean climate: I. Water relations, vine performance and grape composition. Agric. Water Manag. 2021, 248, 106772. [Google Scholar] [CrossRef]
  46. Zhu, L.; Huang, Y.; Zhang, Y.; Xu, C.; Lu, J.; Wang, Y. The growing season impacts the accumulation and composition of flavonoids in grape skins in two-crop-a-year viticulture. J. Food Sci. Technol. 2017, 54, 2861–2870. [Google Scholar] [CrossRef]
Figure 1. Total phenols, tannins and anthocyanin concentrations in Cabernet Sauvignon grape skins throughout ripening in the 2014 and 2015 seasons. Vertical bars indicate standard error from five replicates. Different letters indicate significant differences between treatments (Tukey’s HSD test, p < 0.05).
Horticulturae 08 00796 g001
Figure 2. Glucosylated, acetylated and p-coumaroylated anthocyanin concentrations in Cabernet Sauvignon grape skins throughout ripening in the 2014 and 2015 seasons. Vertical bars indicate standard error from five replicates. Different letters indicate significant differences between treatments (Tukey’s HSD test, p < 0.05).
Horticulturae 08 00796 g002
Figure 3. Dihydroxylated and trihydroxylated anthocyanin concentrations in Cabernet Sauvignon grape skins throughout ripening in the 2014 and 2015 seasons. Vertical bars indicate standard error from five replicates. Different letters indicate significant differences between treatments (Tukey’s HSD test, p < 0.05).
Horticulturae 08 00796 g003
Figure 4. Proportion of glucosylated, acetylated and p-coumaroylated anthocyanins in Cabernet Sauvignon grape skins at harvest date. Different letters indicate significant differences between treatments (Tukey’s HSD test, p < 0.05).
Horticulturae 08 00796 g004
Table 1. Global analyses in Cabernet Sauvignon grapes throughout ripening.
20142015
DAVT1T2T3T1T2T3
pH−32.57 ± 0.022.58 ± 0.012.56 ± 0.022.83 ± 0.002.87 ± 0.032.81 ± 0.01
132.84 ± 0.03 b3.01 ± 0.01 a2.88 ± 0.02 b3.05 ± 0.022.99 ± 0.022.99 ± 0.03
273.14 ± 0.023.15 ± 0.013.13 ± 0.013.36 ± 0.023.35 ± 0.023.31 ± 0.02
413.29 ± 0.03 b3.40 ± 0.04 a3.44 ± 0.03 a3.54 ± 0.013.54 ± 0.023.54 ± 0.01
603.50 ± 0.043.58 ± 0.043.59 ± 0.043.69 ± 0.02 ab3.73 ± 0.02 a3.63 ± 0.01 b
Titratable acidity−315.32 ± 0.1515.30 ± 0.1515.45 ± 0.1612.40 ± 0.0911.30 ± 0.2311.75 ± 0.47
(g tartaric acid L−1)137.77 ± 0.198.13 ± 0.188.03 ± 0.315.65 ± 0.18 b6.47 ± 0.16 a5.97 ± 0.20 ab
275.30 ± 0.155.47 ± 0.255.25 ± 0.248.92 ± 4.514.80 ± 0.144.75 ± 0.13
414.13 ± 0.13 a3.72 ± 0.18 b3.97 ± 0.16 ab3.80 ± 0.093.72 ± 0.063.62 ± 0.12
603.42 ± 0.132.97 ± 0.103.07 ± 0.153.45 ± 0.093.57 ± 0.083.60 ± 0.11
Soluble solids (°Brix)−312.97 ± 0.2513.00 ± 0.2512.88 ± 0.3012.33 ± 0.0512.00 ± 0.4112.47 ± 0.45
1316.90 ± 0.3016.07 ± 0.3216.07 ± 0.2517.60 ± 0.3016.07 ± 0.5616.87 ± 0.58
2718.97 ± 0.4018.30 ± 0.3319.07 ± 0.1517.80 ± 0.68 b19.27 ± 0.71 ab20.47 ± 0.50 a
4120.20 ± 0.28 a18.37 ± 0.27 b19.83 ± 0.46 a21.93 ± 0.30 a20.27 ± 0.50 b20.63 ± 0.48 ab
6021.53 ± 0.4221.57 ± 0.4121.13 ± 0.2821.13 ± 0.2221.27 ± 0.3721.27 ± 0.38
Average berry weight (g)−30.98 ± 0.020.99 ± 0.020.98 ± 0.020.85 ± 0.02 b0.97 ± 0.04 a0.93 ± 0.01 a
131.09 ± 0.051.09 ± 0.021.07 ± 0.031.07 ± 0.021.05 ± 0.021.11 ± 0.01
271.11 ± 0.031.14 ± 0.031.11 ± 0.021.20 ± 0.031.19 ± 0.031.21 ± 0.03
411.10 ± 0.031.12 ± 0.041.16 ± 0.021.13 ± 0.021.12 ± 0.021.15 ± 0.02
601.14 ± 0.031.11 ± 0.031.09 ± 0.051.11 ± 0.031.09 ± 0.051.07 ± 0.02
Skin weight/total weight−30.10 ± 0.040.10 ± 0.040.09 ± 0.040.15 ± 0.020.12 ± 0.000.10 ± 0.00
relationship130.11 ± 0.04 a0.10 ± 0.04 ab0.10 ± 0.04 b0.11 ± 0.00 a0.10 ± 0.01 b0.09 ± 0.00 b
270.11 ± 0.04 ab0.12 ± 0.05 a0.10 ± 0.04 b0.10 ± 0.000.10 ± 0.000.09 ± 0.00
410.11 ± 0.04 b0.11 ± 0.04 b0.12 ± 0.05 a0.12 ± 0.000.10 ± 0.000.11 ± 0.01
600.11 ± 0.04 ab0.10 ± 0.04 b0.12 ± 0.05 a0.12 ± 0.000.12 ± 0.000.13 ± 0.01
Values are presented as mean ± standard error (n = 5). Different letters indicate significant differences between treatments in the same season (Tukey’s HSD test, p < 0.05). DAV: days after veraison.
Publisher’s Note: MDPI stays neutral with regard to jurisdictional claims in published maps and institutional affiliations.

