Article

Nutrient Content with Different Fertilizer Management and Influence on Yield and Fruit Quality in Apple cv. Gala

1
Associated Laboratory TERRA, LEAF—Linking Landscape, Environment, Agriculture and Food Research Center, Instituto Superior de Agronomia, Universidade de Lisboa, Tapada da Ajuda, 1349-017 Lisboa, Portugal
2
CEF—Centro de Estudos Florestais, Instituto Superior de Agronomia, Universidade de Lisboa, Tapada da Ajuda, 1349-017 Lisboa, Portugal
3
BioISI—Biosystems & Integrative Sciences Institute, Faculdade de Ciências da Universidade de Lisboa, Campo Grande, 1749-016 Lisboa, Portugal
4
FRUBAÇA—Cooperativa de Horto—Fruticultores, C.R.L. Lugar Acipreste Aptd. 12, Alcobaça, Leiria, 2460-471 Alcobaça, Portugal
5
GRANFER—Produtores de Frutas, CRL. Rua Principal 167, 2510-772 Usseira, Portugal
6
INIAV, I.P., Polo Alcobaça, Estrada de Leiria, 2460-059 Alcobaça, Portugal
7
CAMPOTEC IN—Cons. e Transformação de Hortofrutícolas, SA. EN 9, 2560-393 Torres Vedras, Portugal
*
Author to whom correspondence should be addressed.
Horticulturae 2022, 8(8), 713; https://doi.org/10.3390/horticulturae8080713
Submission received: 18 July 2022 / Revised: 30 July 2022 / Accepted: 5 August 2022 / Published: 8 August 2022

Abstract

:
Assessing a plant’s nutritional status and fertilizer rates and types that can optimize fruit quality and yield are critical in intensive apple orchards. The aim of this work was to identify correlations between nutrients in the different organs that allow the early diagnosis of the nutritional status and to assess the impact on the optimal nutrient content in apple leaves, as well as in the yield and quality of chemical and organic fertilization. Five orchards of ‘Gala’ were fertilized with different levels of NPK over a period of four years. Macro and micronutrients of buds, flowers, 45 and 90–110 days after full bloom (DAFB) leaves and 60 DAFB and 15 days before harvest (DBH) fruits were determined. Boron was the only element for which strong correlations, 0.7 < r < 0.9, were observed between all organ pairs. The fertilization treatments did not affect the nutrient concentrations in the leaves of 90–110 DAFB other than P, Ca and Mg and did not affect the macronutrients in the fruit. In one of the five orchards, the yield increased by 26% with double fertilization compared to standard fertilization and, for the other four orchards, the impact depended on the year. Fruit size was more related to crop load than to fertilization and TSS and firmness were not affected by the type or amount of fertilizers. Replacing part of the chemical fertilizer with organic materials did not affect productivity or fruit quality.

1. Introduction

The annual production of apples (Malus domestica Borkh.) has been steadily increasing, becoming the third most produced fruit in the world in 2022 with 86.4 million tons [1]. The increased production was fuelled by the introduction of technology; in particular, the introduction of new cultivars and dwarf rootstocks, which enable intensive orchards with more than 3000 trees per hectare and achieve yields of over 50 t ha−1. Currently, environmental constraints and increasingly lower economic yields characterize apple growing systems, implying a rationalization and precision of cultural practices and resource use. In particular, minimizing N-losses from ecosystems is an important ecological and economic concern [2]. In these modern intensive orchards, a fertigation system is mandatory. Apple precision fertilization has recently been reviewed [3] and focuses on nutrient transport and functions, foliar diagnosis and nutrient management of apple orchards. As these authors note, the recommended dosages of the most important nutrients (nitrogen, phosphorus and potassium) can vary significantly, as the amount and type of fertilizers differ between orchards. These fertilizer recommendation frameworks are not strict and the soil nutrients, cultivar needs, rootstock activity and orchard geographic location affect the limits of the fertilizers applied. In Portugal, the recommended frameworks were established more than 15 years ago [4] for less productive orchards compared to the current ones and need to be confirmed in the actual context. Besides the use of chemical fertilizers, the use of organic fertilizers and the combined use of organic and chemical fertilizers or the use of bio-fertilizers are beginning to become common practice in intensive apple-growing systems. However, there are few studies on how this more environmentally friendly fertilizer management affects fruit and leaf nutrient content, productivity and apple fruit quality [5,6,7,8]. Fertilization strategies affect orchard productivity, fruit size and quality, with fruit quality being highly dependent on nutrition, particularly storage capacity and the development of metabolic disorders [9]. The relationships between certain nutrients, nitrogen, calcium and potassium, and their ratios, apple quality and post-harvest disorders have been founded [7,10,11,12,13,14,15,16,17]. Implemented and recommended diagnostic methods for the nutritional status of fruit trees are based on leaf analysis at an advanced stage of the cycle 90–110 days after full bloom (DAFB). In the case of fruits that have already formed, the results of this analysis are very limiting with regard to the possibility of interventions in the same year and only serve as a basis for a recommendation for the fertilization of the plant in the following year. Besides the leaves, as in other fruit species [18], the analysis of other organs in the apple tree has also been studied, with some success for some nutrients, such as the early diagnosis of iron in flowers [19] or the boron content in buds and flowers [20]. Recently, Uçgun and Gezgin (2017) [21] determined the nutritional status of early-season apples to obtain reference values for leaves in early growth stages. However, they concluded that the references depended on additional factors such as the rootstock, cultivar, age of the tree and yield, which were not taken into account.
In this work, we aimed (i) to assess the nutritional status of apples throughout the growing cycle by analyzing flower buds, flowers, leaves and fruits in different orchards subjected to different levels and types of fertilizers over a four-year period; (ii) to establish correlations of each nutrient between organs, which would allow early diagnosis of the nutritional status in the orchards; (iii) to assess whether the fertilization level and type affect leaf nutrients, productivity and fruit quality.

2. Materials and Methods

2.1. Site Description, Plant Material and Experimental Design

The main characteristics of the soils of the five orchards (A, B, C, D and E) are shown in Table 1 according to soil analyses in 2018. The experiment took place between 2018 and 2021. These orchards were representative of the main apple growing area in Portugal, Alcobaça. In general, soils have clay texture with the exception of orchard C clay loam and the pH value (H2O) is between 7.2 and 8.3 (neutral to alkaline); these are soils with no or very little salinity (EC in water extract 1:2 < 0.44 mS cm−1) and the percentage of organic matter (OM) is low (<2%). Regarding the NPK macronutrients in the soil, the amount of nitrogen N-NH4 varied between 8.4 and 11.1 mg kg−1 and of N-NO3 between 3.3 and 15.7 mg kg−1; the levels of extractable K and P (ammonium lactate extraction [22]) were high.
The climate of the Alcobaça region is a Csb (temperate climate with rainy winters and dry, mild summers) according to the Köppen–Geiger climate classification [23]. In the experimental region, the average annual temperatures in 2018, 2019, 2020 and 2021 were 14.4, 14.7, 15.1 and 14.7 °C, respectively, similar to the long-term average (1981–2010) of 15.0 °C. In these years, the total annual precipitation was 1045.2, 703, 746 and 596.3 mm, slightly less than compared to (1981–2010) 839.6 mm. No spring frost damage or other weather disturbances occurred during the test period. See Table 2 for planting date, site details, Gala clones, rootstocks and spacing.
The design of each apple orchard consisted of three randomized blocks (trial plots) per treatment. Each block consisted of an experimental plot of 15 trees. The trees selected for sampling showed homogeneous vegetative growth and flowering intensity. Orchards’ size was A—1 ha; B—1 ha; C- 4 ha; D—4.5 ha; E—0.8 ha and the age of the trees in 2018, orchards A and B—3 years old; orchards C and D—4 years old and orchard E—15 years old. Soil management in the orchards consisted of natural grass sward in alley (with multiple cuts) and herbicide weeding along the rows. This is the usual soil management in this region in these orchards. Fruit thinning was performed. The orchards were central leader trained and the trees were pruned and protected from pests and diseases in accordance with local commercial practices.

2.2. Treatments Application

The treatments consisted of standard fertilization according to the rules of integrated fruit production [24], double standard fertilization and double standard fertilization with organic materials (OM). The fertilization values are listed in Table 3. In orchards A, C and D, organic fertilizer consisted of cow manure (5 t ha1) and in orchards B and D, organic granular fertilizers were Organocad and Biofert (1.125 t ha1 and 1.5 t ha1, respectively). The N-P-K percentage was 3-2.4-12 for cow manure, 2.8-1.5-2.7 for Organocad and 4.5-3-2 for Biofert. Each treatment was applied in three randomized trial plots for 45 trees per treatment. Since the orchards were different, the amount of fertilizer applied differed between the orchards; the fertilization levels are shown in Table 3. Fifty percent of the fertilization was applied to the soil and 50% by fertigation, except for orchard E, where the soil was fertilized three times a year. The percentage of fertilization units by fertigation varied with the growing season (from bud burst to post-harvest) and nutrients. With the exception of orchard E, magnesium (15–20 kg ha−1) was applied by fertigation and calcium and boron by foliar sprays from fruit cell division to fruit cell enlargement. For orchard E, these nutrients were applied to the soil. The amounts of these nutrients were consistent with commercial practices. As can be seen from Table 3, the amounts of N, P and K did not differ between 2× standard and 2× standard OM.

2.3. Sample Preparation of Buds, Flowers, Leaves and Fruits

For mineral analysis, all testing was performed with three biological replicates removed from 15 trees per replicate. Sampling per replicate was as follows: 150 flower buds were collected during dormancy, 150 flowers from 40 flower clusters in full bloom (BBCH 65), 120 whole leaves (leaf and petiole) with 8 leaves per tree collected at 45 and 90–110 days after full bloom (DAFB) and 15 fruits at 60 DAFB and 15 days before harvest (DBH), corresponding to 115–120 DAFB. The harvest date was considered optimal in the terms of production. For fruit sample preparation, 10 fruits were randomly selected and the portion containing the seeds was removed and cut into 3-mm slices. All samples were dried in an oven at 65 °C to constant weight (24 to 72 h depending on the material) and ground.

2.4. Mineral Organ Analysis

The Soil and Plant Chemistry Laboratory of the Instituto Superior de Agronomia, Lisbon, Portugal, analyzed the concentrations of macro and microelements in plant tissue. The collected plant material samples (buds, flowers, leaves and fruit slices) from each treatment were placed in a forced air dryer at 65 °C for 48 h. After grinding and wet mineralization in acids, the concentrations of P, K, Ca, Mg, S, Fe, Mn, Zn, Cu and B, were determined in 0.30 g of dried, ground whole tissue, which was digested in a mixture of HCl and HNO3, according to an adapted version of the European standard EN 13650 [25] and analyzed by ICP-OES. To determine N, 0.25 g dried crushed material was digested in 4 mL H2SO4 with selenium as a catalyzer, according to the Kjeldahl method [26], and quantified by visible spectrophotometry using the Berthelot method [27]. Macronutrient concentration is expressed as % DW and micronutrient as mg kg−1 DW.

2.5. Deviation from Optimum Percentage (DOP Index)

To assess the optimum mineral nutrition, the DOP index was determined from apple leaf mineral elements at 90–110 DAFB. The DOP index is a method of interpreting plant mineral analysis [28]. According to the authors who developed the method, the DOP index of a nutrient is defined as:
DOP = ((Cn × 100)/Cref) − 100
where C n is the foliar content of the nutrient and C ref is the optimal nutrient concentration used as a reference value. The reference values (in % DW) for ‘Royal Gala’, are as follows [24]: N—2.75; P—0.17; K—1.65; Ca—1.25; Mg—0.25; S—0.26. The reference range values are the national values used for Gala (see Table S1 in the Supplementary Material).
When a given element is at its optimal concentration, the DOP for that element is zero. A large absolute value in a DOP index indicates a large deviation from the optimal situation, a deficiency (DOP < 0) or an excess (DOP > 0). The sum of the absolute DOP index values (ΣDOP) serves as a relative measure of the nutrient balance in the sample. The smaller the ΣDOP, the closer the sample is to optimal nutritional status. In a balanced sample, ΣDOP approaches zero.

2.6. Fruit Production and Fruit Quality Attributes

Yield was evaluated on 15 trees (5 trees × 3 replicates) per fertilization treatment, determining the number of fruits and production weight per tree to calculate yield and average fruit weight. The harvest date was taken into account for optimal quality and short-term storage, for ‘Gala’ firmness > 6 kg cm−2, brix > 12 and starch index 7–8. Harvest date varied with the year and orchard. Firmness and total soluble solids (TSS) measurements were taken at harvest. Three replicates of 14 fruits per fertilizer treatment were randomly selected for pulp firmness, measured with a fruit pressure tester (TR Turoni 5320, Italy) using an 11-mm probe, after removing skin on two opposite sides of each fruit; TSS or Brix was measured using a refractometer (ATAGO PR-32, Tokyo, Japan).

2.7. Statistical Analysis

All data were stored in R objects (https://CRAN.R-project.org (accessed on 1 April 2022)) and all statistical analyses and graphs were produced in R. Parallel boxplots, produced with function boxplot, and were used to compare the distribution of each nutrient across the apple organs. The Pearson correlation coefficient was computed and tested for its significance with functions cor and cor.test. Means were compared using ANOVA models, fitted with function aov. Whenever the factors have principal or interaction significant effects (F-tests with p-value less than 0.05), the Tukey’s test was applied in order to detect the pairs of means that are significantly different. Tukey’s tests were performed with the function HSD.test from package agricolae (https://CRAN.R-project.org/package=agricolae (accessed on 1 April 2022)).

3. Results

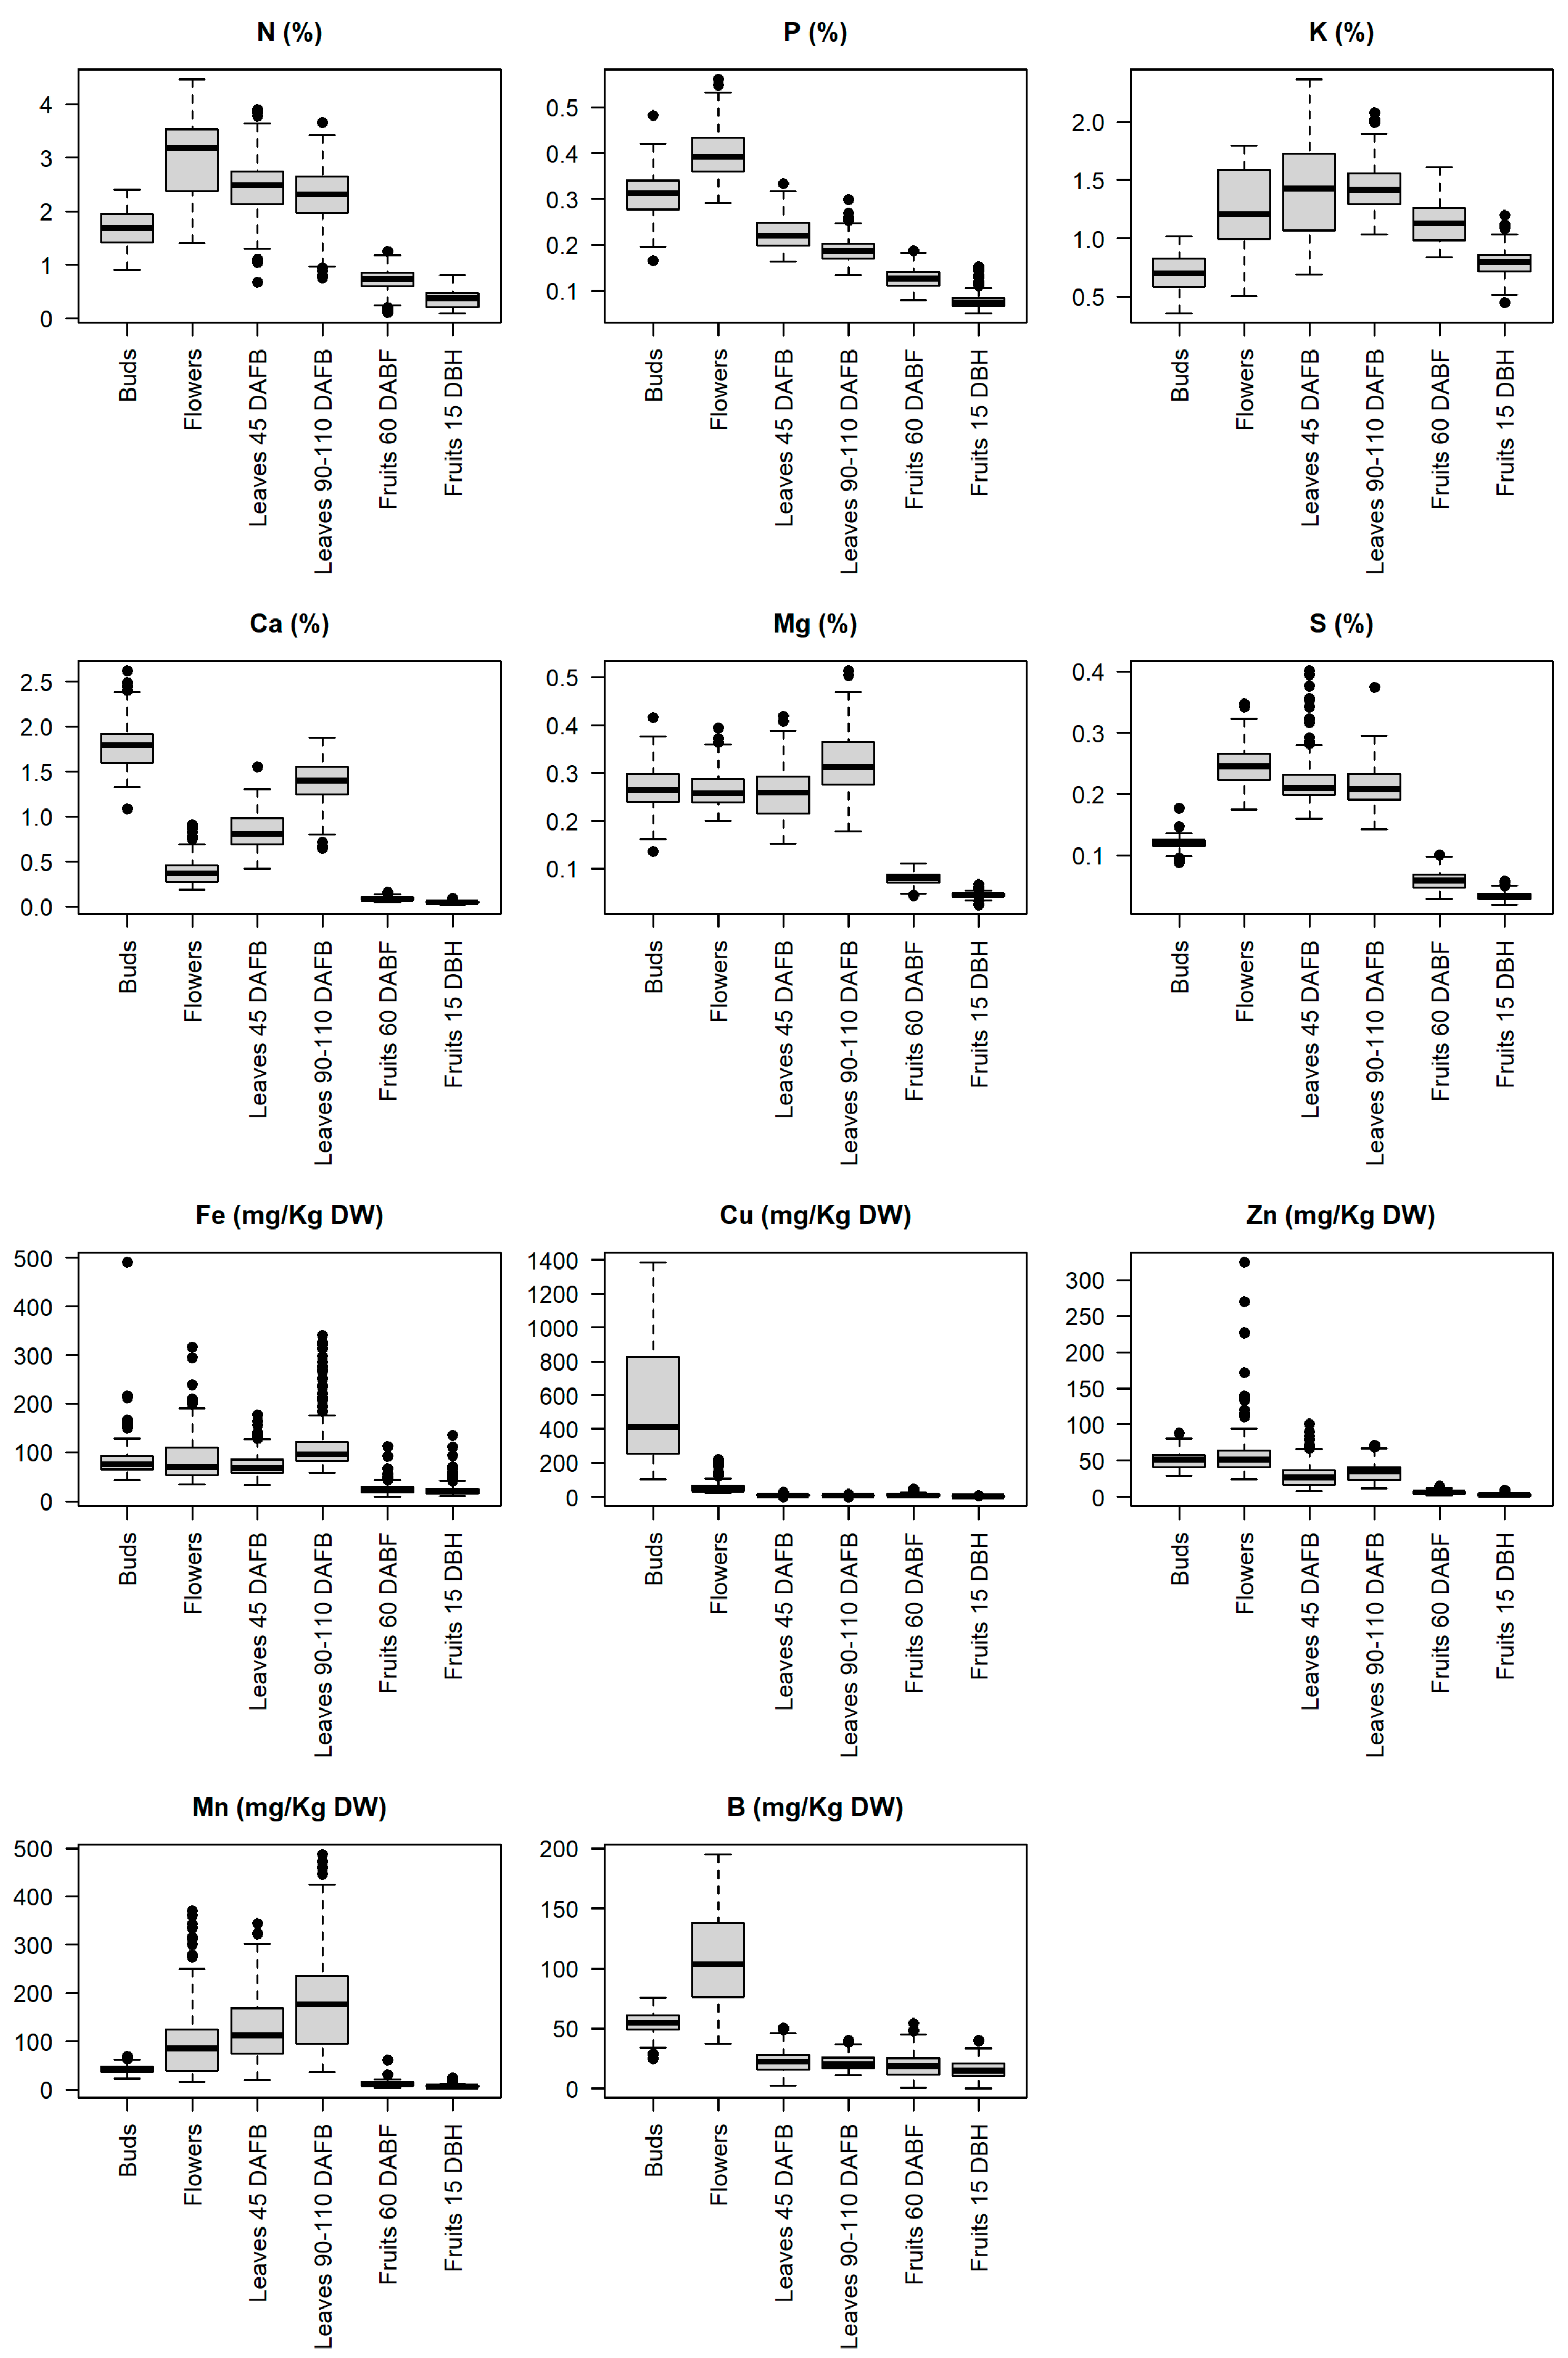
3.1. Nutrient Concentration Ranges in Buds, Flowers, Leaves and Fruits

The mineral composition of the various apple organs in the multi-year study is shown in Figure 1. Buds had the highest content of Ca and Cu. The Cu concentration in the buds was high possibly due to crop protection Cu treatment after pruning. The highest concentrations of N, P and B were found in flowers and minimal values in fruits. Ca, Mg and Mn in leaves 90–110 DAFB were higher than in leaves 45 DAFB, but for other elements, the values were similar. When comparing fruits 60 DAFB and fruits 15 DBH for the elements N, P, K, Mg and S, there is a slight decrease, but micronutrients and Ca data show no clear differences.

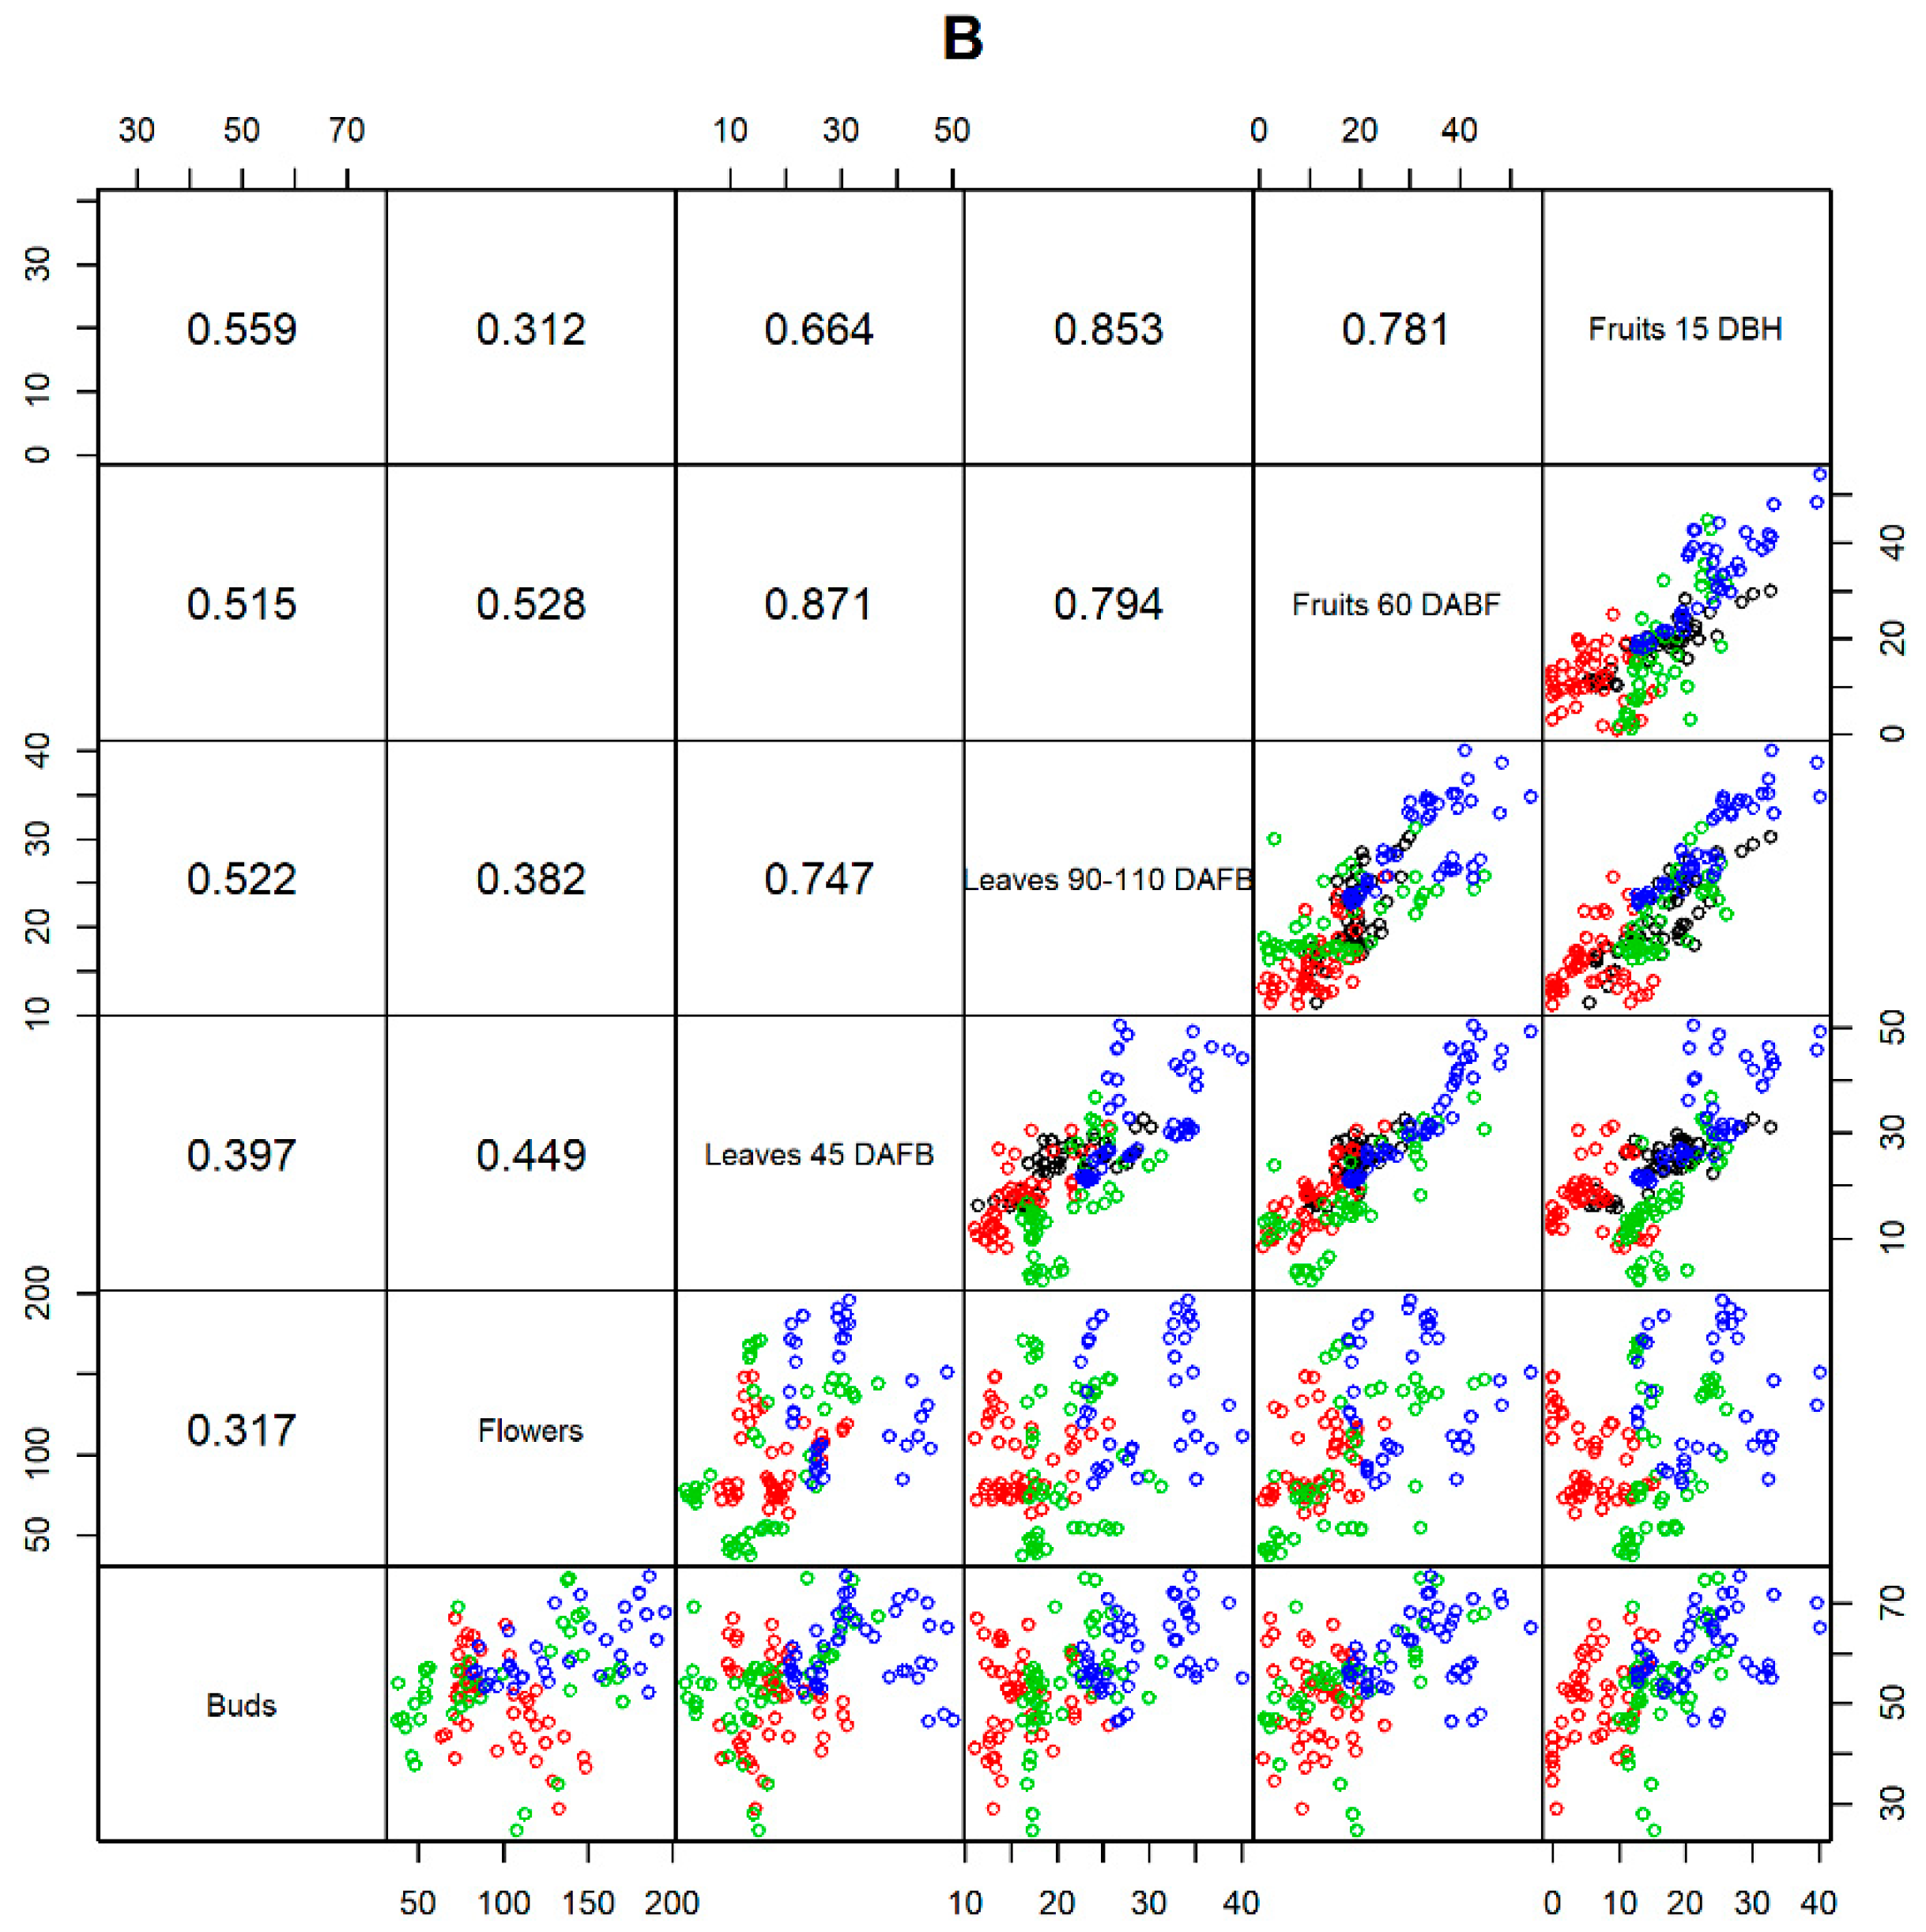
3.2. Correlation of an Element in Different Organs

A simple linear correlation for the content of each element in all pairs of organs was performed to examine the possibility of anticipating plant analysis (Table 4). Leaves analysis 90–110 DAFB is currently used to determine the nutritional status of apple trees and perform optimal fertilization according to macro and micronutrient needs. According to Table 4, the correlation coefficients between 90 and 110 DAFB leaves and bud, flower and 45 DAFB leaves were weak for all macronutrients.
The highest correlations found were for N with buds (r = 0.498) and with 45 DAFB leaves for P (r = 0.503), Mg (r = 0.496) and Ca (r = 0.486). There are positive, albeit weak, correlation values between the N content of the 15 DBH fruits and buds, flowers, 45 DAFB leaves and 90–110 DAFB leaves (r = 0.734, 0.581, 0.549, and 0.447).
Among the micronutrients, boron was the only element for which strong correlations r > 0.7, were observed (Figure 2). Boron in leaves 45 DAFB is highly correlated with B in leaves 90–100 DAFB (r = 0.747) and in fruits 60 DAFB (r = 0.871) and moderately correlated with B in fruits 15 DBH (r = 0.664). The content of B in leaves 90–100 DAFB is highly correlated with B in fruits 60 DAFB (r = 0.794) and in fruits 15 DBH (r = 0.853). The correlation coefficient between the B content in fruits is also high (r = 0.781). The scatterplots in Figure 2 show different patterns over the years.

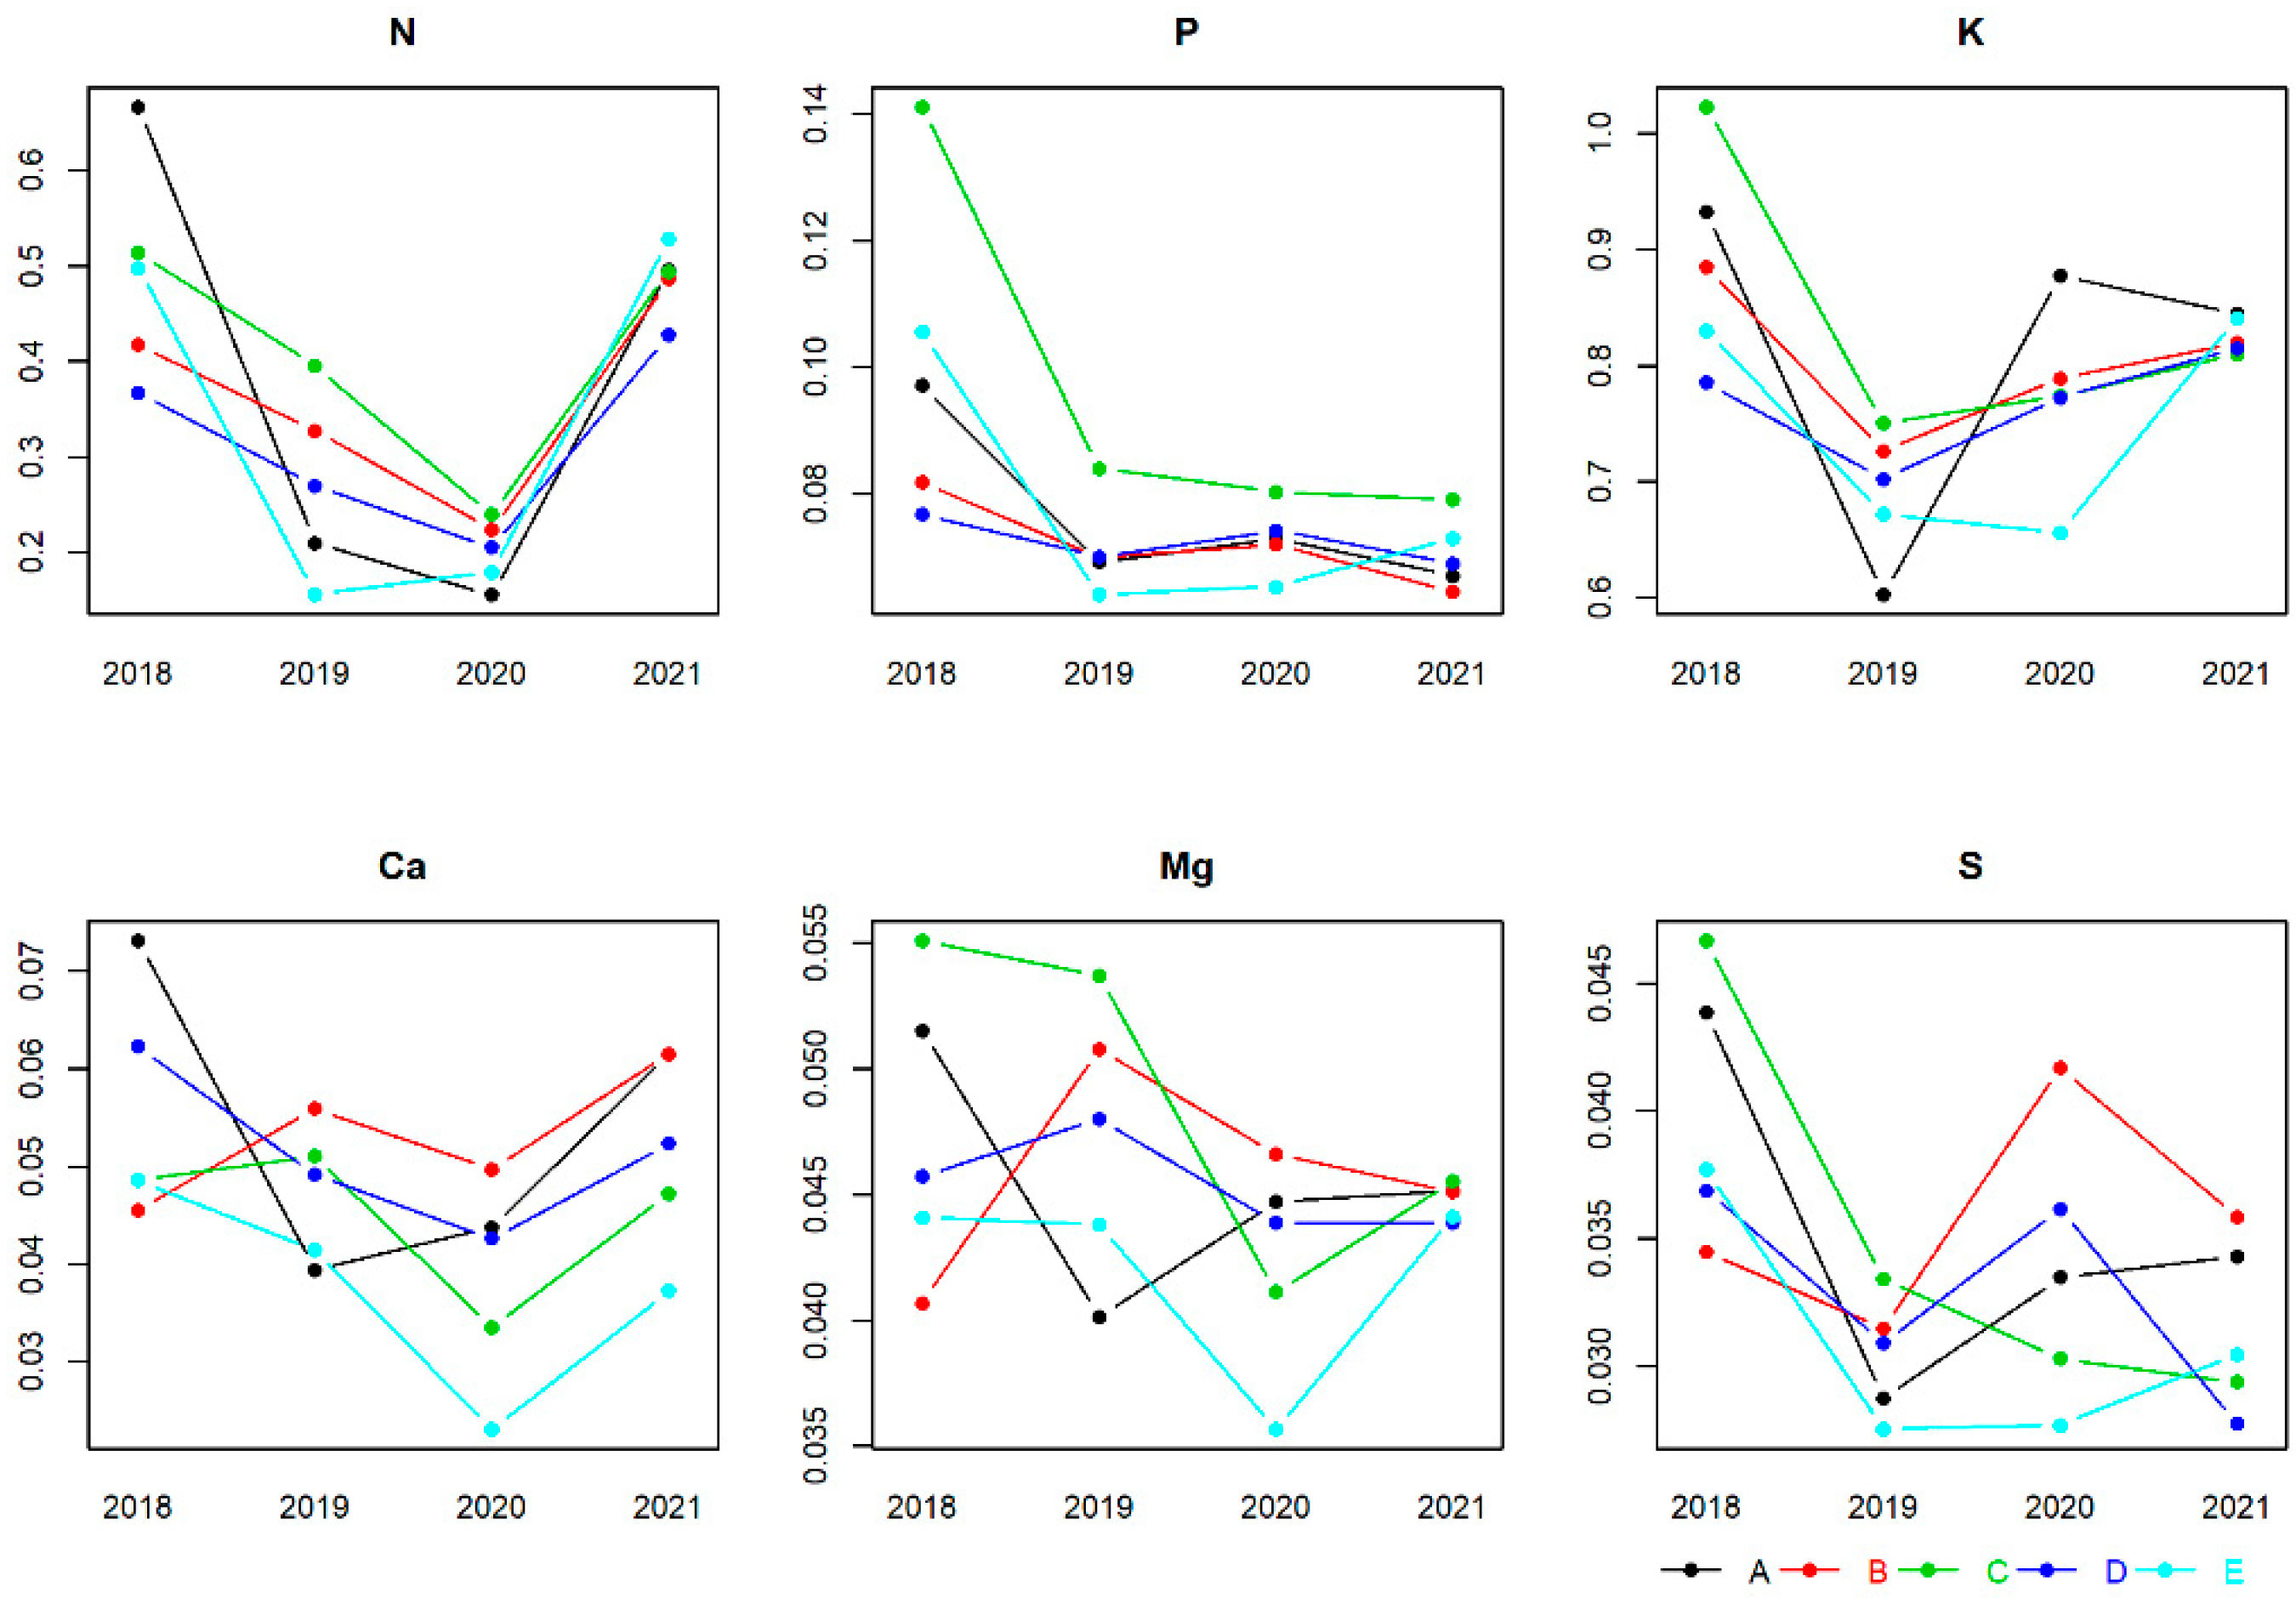
3.3. Macronutrients and Micronutrients in Leaf 90–110 DAFB and Deviation from Optimum Percentage (DOP Index)

As shown in Table 5, the fertilization treatments did not affect the nutrient concentrations in leaves 90–110 DAFB, except for those of P, Ca and Mg. Without accounting for the interactions, the P content in the leaves of treatment 2× standard OM (0.193% ± 0.03) was higher than in the standard treatment and 2× standard (0.185% ± 0.02 and 0.186% ± 0.02, respectively). For Ca, the standard treatment resulted in a lower content (1.368% ± 0.28) compared to 2× standard (1.419% ± 0.21), but not statistically different from 2× standard OM (1.382% ± 0.20). Leaves from trees treated with the standard treatment had less Mg (0.312% ± 0.07) compared to 2× standard (0.324% ± 0.06) and 2× standard OM (0.326% ± 0.07). It should be noted that the values of the sufficiency range for ‘Royal Gala’ for the P content in the leaves in % are 0.14–0.18, for Ca 0.90–1.34 and for Mg 0.20–0.30, i.e., in the upper values of the range of the concentration interval. For the macronutrient content in the leaves 90–110 DAFB, see Table S2 of the Supplementary Material.
The DOP was analyzed by year and orchard and the fertilization treatment was considered as a repeat.
The data in Table 6 show that relative deviations from optimal leaf macronutrient levels were observed across all orchards and years. N, K and S are usually in deficit (negative values) and P, Ca and Mg in excess (positive values). The DOPN was negative with the exception of orchard C in 2019 and 2021 (+6.7 and +2.1) and in orchard E in 2019 (+2.9), a value close to zero. For the DOPK, the absolute values are not very high and are always negative with only two exceptions: orchard B in 2020 (+12.3) and orchard A in 2021 (+1.5). Taking the DOPS into account, the values are negative except for orchards B and D in 2020 with values approaching zero +1.2 and +1.9, respectively. For P and Ca, the absolute DOP values are lower compared to the DOPMg. There is a large variability between the DOP values of the different replicates, which is reflected in high standard deviation values. The ANOVA results for ΣDOP show that the year, orchard and interaction were highly significant (p < 0.001). For each year, there is a large variability between orchards. For example, orchard B had the smaller ΣDOP, closer to the optimal nutritional status in 2020 and 2021, but not in 2018 and 2019. The largest deviations (group a) were found in orchards D and E in 2019 and in orchard C in 2021. In the three situations, the nutrient that contributes most to the large deviation is Mg, which is in large excess compared to the appropriate value. As can be seen from Table 6, the groups with the letter “a” correspond to situations where the DOPMg is greater than 50, i.e., where the Mg content is more than one and a half times the reference value. In reality, a DOPMg value >40% means that the concentration level is higher than the upper limit of the sufficiency range.
Table 7 shows the micronutrient content in leaves 90–110 DAFB for each year and each orchard. In contrast, Mn levels are high in some years and orchards and B levels in leaves are above the lower limit in most years and orchards.

3.4. Macronutrients in Fruits 15 DBH

The fertilization strategy did not significantly affect the nutrient content in the fruit 15 DBH (Table 5) and on average, the macronutrients in the leaves were much higher than in fruits; in particular, the Ca concentration in the leaves was about 28-fold higher than in fruits. Figure 3 clearly shows the interaction between the orchard and year. The variation of N and P in the fruits was similar between orchards, but varied significantly between years. The N content in the fruit was similar in 2018 and 2021, with a mean of 0.489%. In 2019, the mean was 0.272% ± 0.102 and in 2020, this value was the lowest at 0.201% ± 0.054. The mean values for P were similar in 2019 to 2021 (0.072%), with a higher value for 2018 (0.100%). With the exception of orchards A and E, the trend of K variation between years was also very similar and in 2018 and 2021, the values were higher compared to 2019 and 2020. In the case of Ca, Mg and S, the fluctuations were very dependent on the orchard and the year, without a clear trend being discernible.

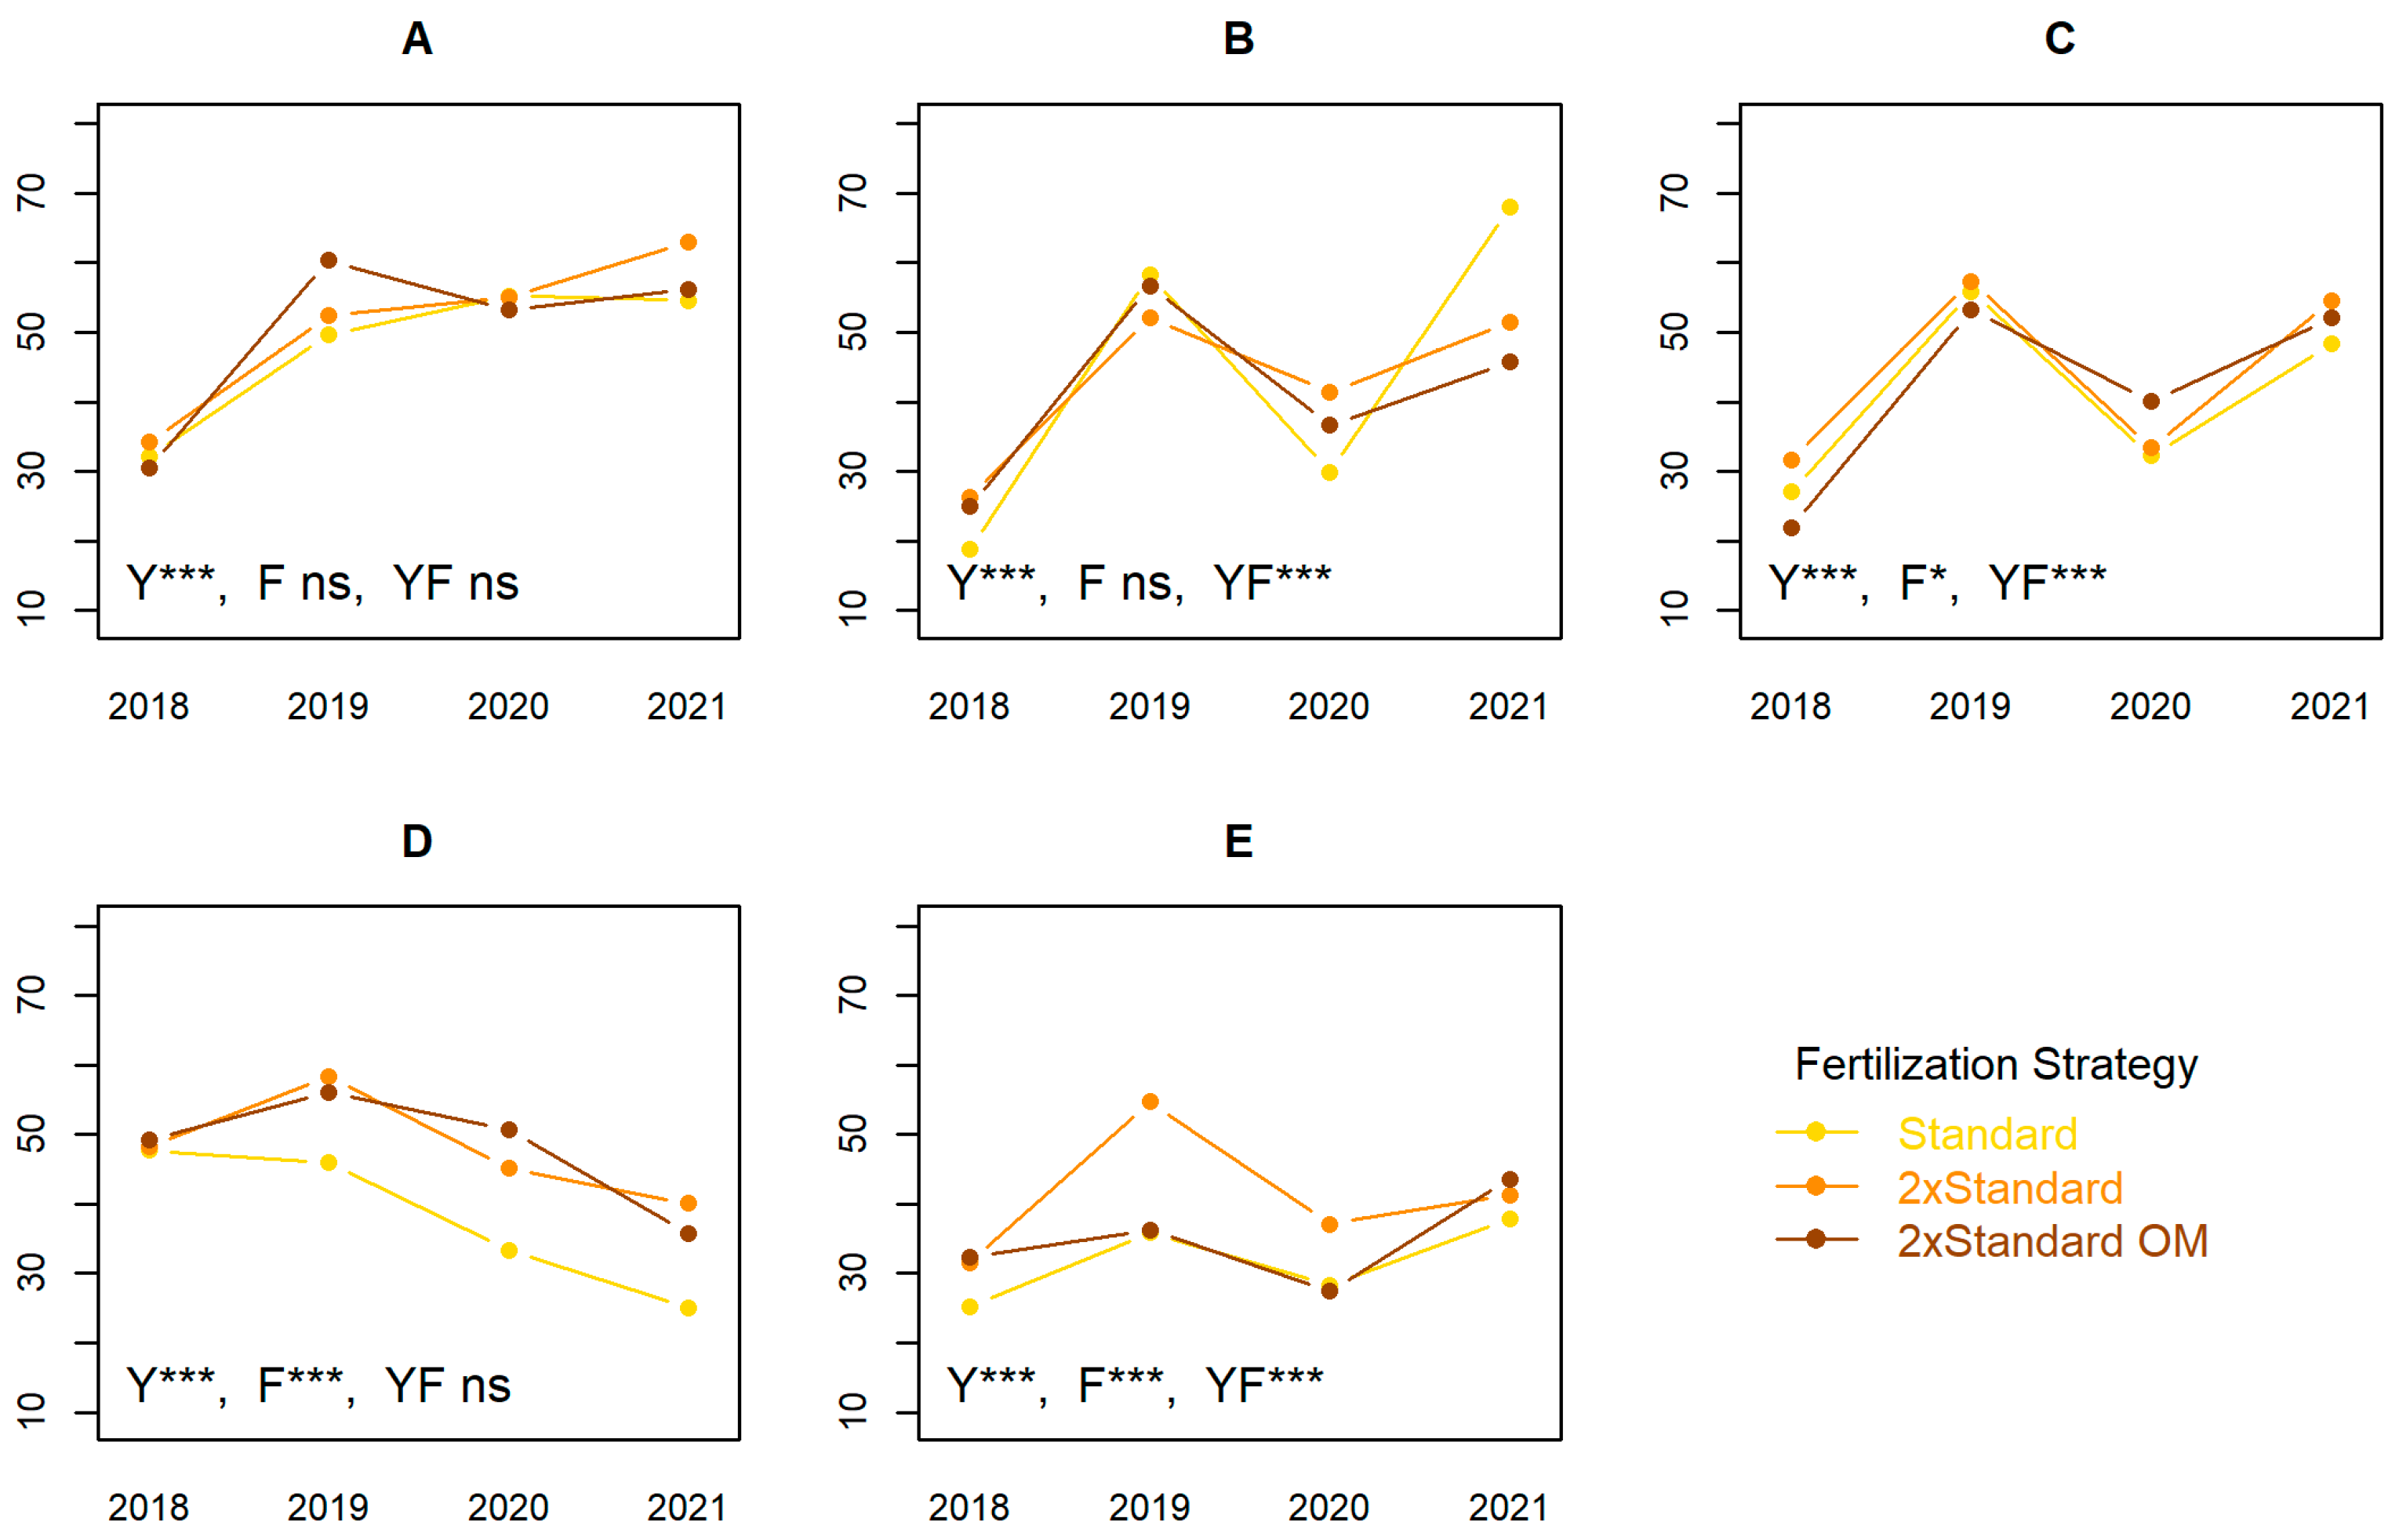
3.5. Fruit Production

3.5.1. Yield and Fruit Size

Orchards differed in yield (t ha−1) (Figure 4). Considering the standard fertilization, the average productivity per orchard, disregarding the year, follows the order E < D < C < B < A (not shown in Figure 4). In terms of yield, 2019 was a more favorable year compared to 2018 and 2020. For orchards planted in 2016 (A, B and C), the yield increase from 32.2 ± 9.7, 23.3 ± 8.5 and 26.8 ± t ha−1 in 2018 to 57.9 ± 15.0, 55.1 ± 15.2 and 51.6 ± 9.7 t ha−1 in 2021, respectively. The age of the orchard had an influence on these results and the differences in yield between fertilization treatments became more apparent when the orchard reached full production. In orchards C, D and E, the fertilization factor was significant, mainly in orchards D and E, where twice the standard level led to an increase in yield and a slight increase in orchard C. Replacing some nutrients with organic matter did not result in an increase in yield and in orchard E, there was a decrease compared to the 2× standard fertilization. If we analyze the year 2020, when the orchards are all in full production and the orchard effect is removed, it can be seen that the strategies influenced (p < 0.001) the yield. Thus, the double standard and the double standard fertilization with organic fertilization resulted in higher yields with values of 42.4 ± 10.6 and 41.6 ± 12.7 t ha−1, respectively, and the standard fertilization in an average yield of 35.8 ± 13.2 t ha−1 (p < 0.05). In 2021, however, the level of fertilization had no effect on the yield; the mean values were 46.8 ± 18.9, 50.1 ± 15.6 and 46.7 ± 12.6 t ha−1 for standard fertilization, double standard fertilization and double standard fertilization with organic fertilization, respectively. With the exceptions of orchards A and D, the interaction between the fertilizer level and year was significant. Orchard D was the only case where fertilization significantly affected yield and in this case, doubling the fertilizer content, taking into account the 4-year mean, resulted in 47.9 t ha−1 compared to 38.1 t ha−1 (p < 0.001). In contrast, the amount of fertilizer applied in orchard A had no effect on the yield (p > 0.05) and was similar in 2019, 2020 and 2021 at 53.2, 54.5 and 57.9 t ha−1, respectively.
In general, the fruit weight was higher in lower-yielding orchards (Figure S1 in Supplementary Material). Fruit weights were higher in 2018 and 2019 in A, B and C orchards, where average fruit weights over 150 g were achieved (Figure 5). In orchard D, the fruit size was smaller in 2018 and in orchard E the higher production in 2019 was also reflected in a lower fruit size. In orchard A and D, fruit size differed only between years; fertilization had no effect on fruit mass. In orchard A, 2018 was the lowest yielding year and the year with the heaviest fruits, 207.1 g, compared to an average weight of 149.4 g in the 2019–2021 period (p < 0.05). In orchard D, 2018 was a high yielding year with smaller fruit, 124.5 g, compared to an average of 145.5 g in 2019–2021 (p < 0.05). In orchards B and C, the fertilization x year interaction was statistically significant and the amount of fertilizer had a positive impact in some years, but there were no differences between the 2× standard fertilization and 2× standard fertilization OM. In orchard E, there were differences in the year and fertilization strategy: the double fertilization resulted in larger fruits, 134.7 g compared to 127.4 g (p < 0.05), with standard fertilization, while 2× standard fertilization OM produced fruits with an intermediate weight (131.2 g), which was not statistically different from the other two.

3.5.2. Fruit Quality

At harvest, the TSS was unaffected by fertilizer treatment (p > 0.05 in F tests in a 3-way ANOVA with Year, Orchard and Fertilizer as factors). The overall mean was 13.4 ± 1.25 °Brix. Table 8 shows the mean and standard deviation of the TSS content in the fruits at harvest for each year and orchard. It can be seen that in 2018, the only significant difference occurs for orchards B (maximum) and D (minimum); in 2019 the order of the orchards in terms of the TSS was E > C and C > B; in 2020 was E > C, C > A and A > B; and in 2021 was D > C and C > B. The remaining differences are not significant at a 5% significance level.
Concerning the firmness, Tukey tests in an ANOVA model with three factors (year, orchard and fertilization strategy) showed that the fertilization only affected firmness in 2018 and orchard E, where the mean firmness is 8.4 ± 1.00 kg cm2 with standard fertilization and 7.0 ± 0.65 kg cm2 with the 2× standard OM strategy. For the other years and orchards, the strategies did not lead to any significant differences in firmness. When considering only the year and orchard as factors, it can be seen (Table 8) that, for each year, the firmness is significantly different in the following pairs of orchards: in 2018, E > D and D > C; in 2019, D > B; in 2020, E > C and C > B; and in 2021, E > C > A > B. In general, orchards E and D produced the firmest fruits while orchard B produced the less firm fruits.
The correlation coefficient between the TSS and the N and K content of the fruit was low (r = −0.042 and r = −0.115, respectively), as was the correlation coefficient between the firmness and N and Ca (r = 0.323 and r = 0.009, respectively). Taking into account the element ratios related to fruit quality, N/Ca and K/Ca and firmness at harvest (Figure 6), the correlation coefficients remain low.

4. Discussion

4.1. Nutrient Concentration Ranges in Buds, Flowers, Leaves and Fruits

Our results show that the concentration of N, P, K, S, Mn and B in flowers is higher than in buds, but the concentration of Ca and Cu decreases from buds to flowers. This high Cu content in buds may be due to agrochemical treatments with Cu. Although the nutrient uptake of pears may differ from that of apples, these results are quite similar to those of El-Jendoubi et al. (2012) [18] in pears, where flowers had higher concentrations of N, P, K and Zn and lower concentrations of Ca compared to buds. Comparing 45 DAFB leaves and 90–110 DAFB leaves, there were no major differences in the nutrient concentration between these data, with the exception of Ca where the concentration was higher in the latter sampling. In the case of Ca applied by foliar sprays from fruit cell division to fruit cell enlargement, these sprays modified the Ca content. For pears, the data show no significant differences in nutrient concentrations between leaves sampled at 60 and 120 DAFB [18]. According to Nachtigall and Dechen (2006) [29], who studied the seasonality of nutrient levels in the tree apple cultivars Gala, Golden Delicious and Fuji over 3 years, nutrient concentrations of apple leaves along the growth cycle showed relative stability after the 10th week after full bloom, which suggest that leaf samples could be taken 30 days earlier for nutritional diagnosis. However, the data from this study do not suggest earlier time points, namely the 45 DAFB leaves, as the data at this time point indicate higher variability and the correlation coefficients are not robust enough (see Section 4.2).
The accumulation of the macronutrient content in apple fruits is continuously with different absorption rates during fruit development [30,31], however, the fruits grow at an increasing rate [32] and their macronutrient concentration decreases when comparing the 60 DAFB and 15 DBH fruits. In particular, the concentration of N, P, K, Mg and S decreased between 60 DAFB and 15 DBH fruits and those of Ca and micronutrients were similar.

4.2. Correlations between Nutrient Concentrations between Organs

In apples, leaves of one-year-old shoots collected 90–110 days after full bloom are commonly used as tissues to diagnose plant nutrition. This timing was suggested because most nutrient concentrations remain stable over a long period of time and provide a wide window for sampling. However, it is generally too late in the season to help with fertilization decisions regarding this year’s crop. Previous studies have shown that early-stage shoot, bark, flower, fruit bud and leaf analysis can provide important information about the nutritional status of plants. The relationship between the mineral content in tree organs or tissues is described in the literature for various species and although the results are statistically significant, with few exceptions, the correlation coefficients are low. Sanz et al. (1994) [33] report that in pears, the correlation coefficient between the Mn content of flowers and leaves collected at 60 DAFB and 120 DAFB was r = 0.427 and r = 0.431, respectively. Between the Fe content of flowers and leaves, 60 DAFB and 120 DAFB were r = 0.434 and r = 0.349, respectively. All other correlation coefficients between other nutrients were around zero and boron was not tested. For peaches, the correlations coefficient between the flowers and leaves taken 60 DAFB were, for N, r = 0.309, P r = 0.342, K r = 0.319, Ca r = −0.214, Mg r = −0.012, Fe r = 0.222, Mn r = 0.455 and Zn r = 0.026 [34]. Belkhodja et al. (1998) [35] reported very low correlation coefficients between the flowers and leaves collected at 60 DAFB and 120 DAFB and for peaches, the maximum values between flowers and leaves 60 DAFB were for Mn r = 0.476 and the flowers and leaves 120 DAFB for Fe were r = 0.343. The highest reported correlation coefficients were for cherry concentrations in flowers and leaves, for N r = −0.50, Ca r = 0.74 and Mn r = 0.86 [36].
In apples, highly significant correlations between B concentrations in leaves of annual shoots and B in flower buds and flowers are reported; for a period of 3 years, the correlation coefficients were 0.797 and 0.800, respectively [20]. Weak correlations between elements in apple flowers and leaves are reported, except for P with an r = 0.75 [37]. Uçgun et al. (2018) [38] found a correlation between 10 cm “offshoot samples” taken about 15 days before full bloom from the midsection’s previous year’s shoots and leaf samples 14, 21, 28, 42, 56, 77 and 98 days after full bloom. However, the statistically significant correlation coefficients were low, ranging from for N r = 0.148 to 0.311, P r = −0.024 to 0.377, K r = 0.025 to 0.296, Mg r = 0.322 to 0.507 and B r = 0.148 to 0.311.
Our four-year results (Table 4 and Figure 2) do not differ significantly from previous ones. Although the highest correlation for B was found between leaves 45 DAFB and fruits, the correlations between B in buds or flowers and leaves were not as high as previously reported [20]. As also reported by Wojcik (2002) [20] in this study, the correlation coefficients varied slightly with the year (Figure 2). Spraying B immediately after blooming to increase the fruit set is a common practice and flowers showed a high B content compared to other organs (Figure 1). The concentration of B remained fairly stable in leaves 45 DAFB and 90–110 DAFB and fruits 60 DAFB and 15 DBH. Other approaches look for possible associations between the nutritional status of dormant shoots, bark, flowers and various parameters of tree performance or chlorophyll content [19,39,40,41] or the comparison of nutritional variations in flowers, leaves and fruits during their development [21,42]. In reality, the early analysis of organs is only possible when values are proposed to interpret the nutritional analysis of these organs, as Kucukyumuk and Erdal (2011) [37] have suggested for apple flowers. With new technologies, it will be possible in the future to better quantify the nutrient uptake and distribution in plant tissue [43] and thus contribute to the solution of this problem.

4.3. Macronutrients and Micronutrients in Leaf 90–110 DAFB and Deviation from Optimum Percentage (DOP Index)

With the exception of P, Ca and Mg, the macronutrients in the leaves were not affected by the fertilization treatment. This effect varied with the year and orchards (Y × F and O × F were statistically significant for P and Ca and orchards for Mg, O × F interaction). For P, the 2× standard OM treatment resulted in a higher P concentration in 90–110 leaves. The Ca and Mg concentration values in the 90–110 leaves were lower with the standard treatment than with the 2× standard and 2× standard OM. It should be noted that the levels of these elements in the leaves were all within the sufficiency range for ‘Royal Gala’. Milošević and Milošević (2015) and Milošević et al. (2022) [5,7] found that the macronutrient content of ‘Idared’ and ‘Melrose’ apple leaves was significantly affected by fertilizer treatments (organic, organo-mineral and mineral fertilizers), indicating that the leaf nutrient composition of the same cultivar can change when fertilizer treatments change. However, the differences were not consistent and depended on the cultivar. Based on a cultivar ‘Jonagored’ and N fertilization doses (0 to 100 kg ha−1), increasing the nitrogen fertilization led to an increase in the N content in the leaves compared to the unfertilized treatment, the opposite was observed in the case of phosphorus in the leaves [44]. In another study with Rocha pear [45], the application of high doses of N (120 and 160 kg N ha1) did not lead to an increase in N, K and P concentrations in the leaves.
In this study, fertilization had no effect on the micronutrient concentration in the leaves. Other authors reported changes in the micronutrient content in apple leaves of ‘Jonagored’ [44] and ‘Golden Delicious’ [7] influenced by soil fertilization. With the exception of Mn and B, the micronutrient levels were within a sufficient range. High Mn levels could be due to crop protection fungicides and low B levels on apple leaves are common in soils with pH > 7.0, as in these orchards, where B availability decreases.
The relative deviation from the optimum of the macronutrient content of the leaves shows that N, K and S are usually in deficiency and P, Ca and Mg in excess. The results of Milošević and Milošević (2015) [5] showed that the DOPN,P,K,Ca was negative and the DOPMg positive regardless of the fertilizer treatment. In a more recent study with ‘Golden Delicious Reinders’ [7], the DOPN,P,K,Ca was negative or zero and the DOPMg positive or zero, depending on the fertilization treatment. These results may be related to the seasonality of nutrients in the leaves during the growth cycle and soil availability. According to Nachtigall and Dechen (2006) [29], N, P and K depletion in apple leaves may be due to a dilution effect that occurs with leaf growth and nutrient redistribution to other plant organs at the end of the cycle. The increase in the Ca concentration in leaves can be explained by Ca immobility in plant tissues and no redistribution to other plant organs. Mg increases are likely the result of less K competition as leaf K decreased over the cycle. Furthermore, in these orchards with low organic matter and a high pH (>7.0), soil N and S levels reduce in availability.
Significant differences were found between the year, orchard and interaction for nutritional balance or the ΣDOP index. The higher the DOP index value, the greater the intensity of the imbalance between the nutrients. The lowest values were found in 2021 for orchards A, B and D and in 2018 for orchards C and D. The highest values were found in 2021 for orchard C, 2020 for orchards C and D and 2019 for orchards C, D and E. The influence of the year on an orchard clearly shows that the mineral content of apple leaves is influenced by factors such as soil and climate, as well as cultural practices such as irrigation. Furthermore, Mészáros et al. (2021) [17] showed that the mineral content, including N, K, Mg, Ca, Fe, Mn and, to some extent, also P, in leaves in fruit trees depends on the crop load. These results are important to improve diagnostic models for estimating the nutritional status of fruit trees.

4.4. Macronutrients in Fruits 15 DBH

Although there are several studies on fertilization and fruit quality, there are very few that deal with fertilization and fruit minerals. In this study, fertilization had no effect on the macronutrients content of the fruit (Table 5). Similar results were reported by Kowalczyk et al. (2017) [44], where nitrogen fertilizer (0 to 100 kg ha−1) had no effect on the N, K, Mg, P or Ca content in apple fruits. A previous long-term study (1998 to 2006), found an increase in the N and K mineral content in fruits at increased N and K application rates of 0, 50, 100 and 200 kg ha−1 N and K2O [46]. In this later study, the Ca fruit concentration was reduced by N fertilization and often by K.
For the N and P fruit concentration, and to some extent for K, the trend between years was very similar between orchards; in 2018 and 2021, the values were higher than in 2019 and 2020.

4.5. Yield

Looking at the five orchards, only orchard D showed consistent yield increases (the year × fertilization interaction was not statistically significant) when fertilizer rates were doubled (p < 0.001) and the yield was 26% higher compared to standard fertilization. There were no statistical differences between the 2× standard and 2× standard OM treatment (mean 48 t ± 14.5 ha−1). This means that replacing part of the chemical fertilizer with organic matter does not affect productivity. In this orchard, the N, P and K levels of the standard treatment were low (Table 3). With yields between 40–60 t ha−1, the N and K removals from the soil were in the range of 60–75 kg N and 80–100 kg K ha−1 per year [47] and the amounts applied in the standard treatment were 70% and 45% lower, respectively. In the other orchards, the amounts of fertilizers in the standard treatment were in the range of the amounts removed from the soil.
In orchard E, the older, less intensive and less productive orchard, the year, the amount fertilizer and the year x fertilizer interaction were statistically significant. The average yield over the four years was 36.0 ± 11.3 t ha−1. Disregarding the year × fertilizer interaction, doubling the amount of fertilizer resulted in a higher yield (41.1 ± 13.1 t ha−1) with an increase of 29% compared to standard treatment. In this case, the 2× standard OM treatment and standard were not statistically significant different (34.9 ± 11.4 and 31.8 ± 12.0 t ha−1, respectively). The partial substitution of mineral fertilizers with organic matter does not appear to have any impact on the yield. This is a non-fertigated orchard, however, fertilization was applied at key moments in the growth cycle and in some years and there was a positive response to increased fertilization. In this orchard, it is likely that low irrigation could result in the slower mineralization of OM.
The removal of the first year 2018 from the analysis of orchards A, B and C shows that the year and fertilization strategy did not affect the yield in orchard A, with a mean production of 55.5 t ± 13.1 ha−1. In this orchard, the N and K for the standard fertilization corresponded to the removal for this production level, so doubling the fertilization did not lead to an increase in the yield. Orchards B and C had similar results. For orchard B, the year, the amount of fertilizer and the year × fertilizer interaction were statistically significant and the standard fertilization yielded 58.3 ± 15.6, 29.9 ± 6.2 and 68.1 ± 14.2 t ha−1 in 2019, 2020 and 2021, respectively, showing biennial bearing. In these 3 years, the yield with double fertilization was 52.1 ± 8.0, 41.4 ± 7.9 and 51.5 ± 9.3 t ha−1 (p > 0.05) and when part of the fertilization consisted of organic material, the yield was 56.7 ± 13.8, 36.6 ± 7.8 or 45.8 ± 12.4 t ha−1, with the production in 2020 being statistically different from the other two years (p < 0.05). The yield of orchard C followed the same trend as orchard B, with differences in years and the interaction between year and fertilization, but without differences between fertilization strategies. For these 3 years (mean 47.4 ± 8.4 t ha−1), the yield for the standard fertilizer treatment was 55.9 ± 8.4, 32.2 ± 4.4 and 48.3 ± 10.0 t ha−1, for the 2× standard treatment was 57.4, ± 9.3, 33.4 ± 4.2 and 54.5 ± 11.7 t ha−1 and for the 2× standard OM was 53.2 ± 11.9, 40.0 ± 5.3 and 52.16.4 ± t ha−1, where the production in 2020 differed statistically from the other two years.
These results indicate that the year and orchard had an influence on the yield in response to fertilization as soil parameters vary with precipitation and temperature. Cultural practices that differed between orchards could also influence the results, as orchard E was not fertigated. Another problem in comparing the few published studies in this area is the amount/type of fertilizer and soil properties (organic matter, other macronutrients, soil pH) in comparison. For example, when the control is no fertilizer, there is a yield response to N and K [13,46]. The annual yield may have be significantly increased by the N rate in a single year, but their cumulative yields were not different between treatments [48]. More sustainable production techniques, in which mineral fertilizers are partially replaced by organic fertilizers, are becoming more common and regularly on the agenda [2]. The few studies show that the type of organic, organo-mineral and mineral fertilizer also affects the yield [6,7], but the results are inconsistent and varied with the cultivar and site.

4.6. Fruit Size, TSS and Firmness

Average fruit weight is an important variable in orchard profitability because the price paid to the grower for Gala apples depends on fruit size: 115–130 g (60–65 mm), 130–149 g (65–70 mm) and >150 g (>70 mm). In two out of five orchards, fertilization had no effect on fruit mass and in three orchards, the effect of the fertilization strategy on the fruit mass depended on the orchard and year with two trends; firstly, there was a strong yield effect and secondly, there was a tendency to increase fruit mass with the 2× standard treatment, but only in some years. The effect of the 2× standard treatment was not different from the 2× standard OM treatment on this variable. In a trial of ‘Golden Delicious’ fertilized with a medium and high dose and three types of fertilization (organic, chemical and a combination of chemical and organic fertilization), no statistical differences in the fruit weight or size were found [8]. The fruit size in apples depends on climatic factors, mainly temperature after full bloom, and agronomic factors such as pruning and thinning, which determine crop load, and irrigation [9]. Mineral nutrition may have an indirect influence and results from field trials on the influence of the fertilizer amount and fruit size vary.
At harvest, the TSS was unaffected by fertilization (p > 0.05) and for firmness, with the exception of one year and one orchard, the strategies resulted in no significant differences in firmness (Table 8). The level and type of fertilization (high and medium chemical, organic and integrated) were found in ‘Golden Delicious’ to influence the TSS. Medium amounts of fertilizer showed a higher content of soluble solids and organic fertilizer showed the highest concentration of the TSS, however, no statistical differences in the firmness [8]. In another study, different types of fertilization in ‘Golden Delicious Reinders’ resulted in fruit with statistically different firmness and TSS [7]. Others report no differences in the TSS and firmness in relation to fertilization treatments [6,49].
The TSS and firmness are very dependent on the cultivar, location and harvest date (maturity) [9]. Efforts have been made to relate optimal fertilizers rates to optimal fruit quality, for which these optimization models may need to be developed at the orchard level. For example, under conditions in southern Brazil under a low plant density system (600 trees ha−1), the TSS content in ‘Fuji’ apple fruits was positively influenced by K and the fertilization rates between 125 and 143 kg ha−1 K2O resulted in the maximum TSS; for N, the TSS values decreased linearly with N fertilization, but at the highest N rate (200 kg ha−1), TSS values were in the normal range [12]. The relationship between K and the TSS is more established than between N and the TSS; however, excessive N uptake may decrease the fruit skin color and storability [47].
Recently, the K mechanism for the TSS increase at the biochemical level has been reported. The K level can change the content of soluble sugars and malate due to the interaction between the sugars and acid-metabolic enzymes in fruits [50]. The molecular mechanisms for mineral nutrition studies and fruit quality will contribute to provide a theoretical basis to improve the efficient utilization of fertilizer and sustainable fruit production [51].
In this study, the N/Ca ratio values in fruits were <14 (with few exceptions) and <10 in most cases (Figure 6). The critical values of N/Ca, determined as a percentage of the dry weight, for the absence of metabolic disorders should be <10 [32]. In ‘Gala’, it was found that the risk of incidence of a bitter pit is low when N/Ca < 10, medium with N/Ca between 10 and 14 and high when N/Ca > 14 [52]. In ‘Jonagold’, the risk of senescent scald is low with N/Ca < 12 [53].
High K/Ca ratios in fruits lead to the development of physiological disorders during storage, usually due to K and Ca competition, resulting in the inhibition of calcium uptake, which is mainly directed to the leaves, and decreases in the fruits [54]. Bitter pit incidences in ‘Honeycrisp’ (a more susceptible cultivar than ‘Gala’) occurred when K/Ca > 25 [16]. In this study, the K/Ca values ranged from 5 to 25 (Figure 6). Accordingly, the fruits should have a good shelf life without developing metabolic disorders.

5. Conclusions

The results of the present study relate to ‘Gala’ on M9 rootstock. The nutrient concentration in flowers is higher than in buds, except for Ca and Cu. Comparing 45 DAFB leaves and 90–110 DAFB leaves, except for Ca, there were no major differences in the nutrient concentration range between these data. As the fruit continues to grow, its macronutrient concentration decreases when comparing the 60 DAFB and 15 DBH fruits. With the exception of B, it does not seem possible to predict the content of an element at 90–110 DAFB in the leaves from the values obtained in the previous states of leaves 45 DAFB, flowers or buds, since the correlations coefficients were <0.7. The concentration of B remained stable in leaves 45 DAFB and 90–110 DAFB and fruits 60 DAFB and 15 DBH and the correlation coefficients between organ pairs were high; indeed, it is the only element for which early prediction is possible.
With the exception of P, Ca and Mg, leaf macronutrients were unaffected by fertilization and, in these cases, varied by year and orchard. Fertilization had no effect on the micronutrient concentration in the leaves. The relative deviation from the optimum of the macronutrient content of the leaves shows that N, K and S are mostly in deficiency and P, Ca and Mg in excess. Significant differences between the year, orchard and interaction for nutritional balance were found. In this study, fertilization had no effect on the macronutrients content of the fruit.
Only one orchard showed consistent yield increases when fertilization rates were doubled, for the other four orchards, the year affected the yield in response to fertilization. No statistical differences between the 2× standard and 2× standard OM treatments were found, which means that replacing part of the chemical fertilizer with organic material does not affect productivity. In two out of five orchards, fertilization had no effect on fruit mass and in three orchards, the effect of the fertilization strategy on fruit mass depended on the orchard and year, since this variable is mainly related to crop load. The TSS and firmness were not affected by the fertilization strategy (except for firmness in one year and one orchard) and the N/Ca and K/Ca ratios were in a range that ensures that no physiological disorders occurred during storage.

Supplementary Materials

The following supporting information can be downloaded at: https://www.mdpi.com/article/10.3390/horticulturae8080713/s1, Table S1: Adequate nutrient levels in leaves of apple trees cv Gala harvested at 90–110 DAFB. Table S2: Nutrients in leaves collected 90–110 DAFB; Figure S1: Relation between productivity and average fruit weight.

Author Contributions

Conceptualization: C.M.O., M.M. and M.J.M.; Data Curation: M.J.M., M.M. and C.M.O.; Funding acquisition: C.M.O., A.B.d.S., A.M., C.R., M.L.d.S. and R.S.; Investigation: G.P., L.S., P.A., M.P., A.M., C.R., J.F., M.L.d.S., R.S. and M.B.M.; Methodology: C.M.O., H.R., A.M., C.R., M.L.d.S., R.S. and R.M.d.S.; Project administration: C.M.O.; Resources: A.B.d.S., H.R. and R.M.d.S.; Supervision: C.M.O.; Writing—Original Draft: C.M.O., M.M. and M.J.M.; Writing—critical review and editing, C.M.O. All authors have read and agreed to the published version of the manuscript.

Funding

This research was supported with national funding by Programa de Desenvolvimento Rural PDR 2020 within the MACFERTIQUAL PDR2020-101-031590 project and by FCT—Fundação para a Ciência e a Tecnologia, I.P., under the project UIDB/04129/2020 of LEAF-Linking Landscape, Environment, Agriculture and Food, Research Unit.

Conflicts of Interest

The authors declare no conflict of interest.

References

  1. Food and Agriculture Organization of the United Nations (FAO). 2022. Available online: www.faostat.fao.org (accessed on 30 June 2022).
  2. Carranca, C.; Brunetto, G.; Tagliavini, M. Nitrogen nutrition of fruit trees to reconcile productivity and environmental concern. Plants 2018, 7, 4. [Google Scholar] [CrossRef] [PubMed]
  3. Ličina, V.; Krogstad, T.; Simić, A.; Akšić, M.F.; Meland, M. Precision fertilization to apple trees A review. NIBIO Rep. 2021, 7, 59–88. [Google Scholar]
  4. INIAP-Laboratório Químico Agrícola Rebelo da Silva. Manual de Fertilização das Culturas; Instituto Nacional de Investigação Agrária, Lisboa: Lisboa, Portugal, 2006; p. 281. ISBN 989-95131-0-5. [Google Scholar]
  5. Milošević, T.; Milošević, N. Apple fruit quality, yield and leaf macronutrients content as affected by fertilizer treatment. J. Soil Sci. Plant. Nut. 2015, 15, 76–83. [Google Scholar] [CrossRef]
  6. Milošević, T.; Milošević, N. Influence of mineral fertilizer, farmyard manure, natural zeolite, and their mixture on fruit quality and leaf micronutrient levels of apple trees. Commun. Soil Sci. Plant Anal. 2017, 48, 539–548. [Google Scholar] [CrossRef]
  7. Milošević, T.; Milošević, N.; Mladenović, J. The influence of organic, organo-mineral and mineral fertilizers on tree growth, yielding, fruit quality and leaf nutrient composition of apple cv. “Golden Delicious Reinders”. Sci. Hortic. 2022, 297, 110978. [Google Scholar] [CrossRef]
  8. Hernández-Rodríguez, A.; Montaño-Carrasco, M.; Ojeda-Barrios, D.; Martínez-Rosales, A.; Cruz-Álvarez, O.; Martínez-Damián, M.T.; Rodríguez-Roque, M.J. Foliar nutritional content and apple fruit quality as affected by organic, conventional, or integrated management. J. Plant. Nutr. 2021, 44, 1886–1902. [Google Scholar] [CrossRef]
  9. Musacchi, S.; Serra, S. Apple fruit quality: Overview on pre-harvest factors. Sci. Hortic. 2018, 234, 409–430. [Google Scholar] [CrossRef]
  10. Marcelle, R. Mineral nutrition and fruit quality. Acta Hortic. 1995, 383, 219–226. [Google Scholar] [CrossRef]
  11. Casero, T.; Benavides, A.; Puy, J.; Recasens, I. Relationships between leaf and fruit nutrients and fruit quality attributes in Golden Smoothee apples using multivariate regression techniques. J. Plant. Nutr. 2005, 27, 313–324. [Google Scholar] [CrossRef]
  12. Nava, G.; Dechen, A.R.; Nachtigall, G.R. Nitrogen and potassium fertilization affect apple fruit quality in Southern Brazil. Commun. Soil Sci. Plant. Anal. 2008, 39, 96–107. [Google Scholar] [CrossRef]
  13. Fallahi, E.; Fallahi, B.; Neilsen, G.H.; Neilsen, D.; Peryea, F.J. Effects of mineral nutrition on fruit quality and nutritional disorders in apples. Acta Hortic. 2010, 868, 49–60. [Google Scholar] [CrossRef]
  14. Jivan, C.; Sala, F. Relationship between tree nutritional status and apple quality. Hortic. Sci. 2014, 41, 1–9. [Google Scholar] [CrossRef]
  15. Doryanizadeh, M.; Mahmood, G.; Sabouri, A. Estimation of postharvest quality of “Red Delicious” apple fruits based on fruit nutrient elements composition. J. Agric. Sci. 2017, 9, 164–173. [Google Scholar] [CrossRef]
  16. Fazio, G.; Lordan, J.; Grusak, M.A.; Francescatto, P.; Robinson, T.L.I. Mineral nutrient profiles and relationships of ‘Honeycrisp’ grown on a genetically diverse set of rootstocks under Western New York climatic conditions. Sci. Hortic. 2020, 266, 108477. [Google Scholar] [CrossRef]
  17. Mészáros, M.; Hnátková, H.; Čonka, P.; Náměstek, J. Linking mineral nutrition and fruit quality to growth intensity and crop load in apple. Agronomy 2021, 11, 506. [Google Scholar] [CrossRef]
  18. El-Jendoubi, H.; Igartua, E.; Abadía, J.; Abadía, A. Prognosis of iron chlorosis in pear (Pyrus communis L.) and peach (Prunus persica L. Batsch) trees using bud, flower and leaf mineral concentrations. Plant. Soil 2012, 354, 121–139. [Google Scholar] [CrossRef]
  19. Sanz, M.; Pérez, J.; Pascual, J.; Machín, J. Prognosis of iron chlorosis in apple trees by floral analysis. J. Plant. Nutr. 1998, 2, 1697–1703. [Google Scholar] [CrossRef]
  20. Wojcik, P. Boron analysis in tissues before apple tree bloom can be used to assess boron nutritional status. J. Plant. Nutr. 2002, 25, 1011–1020. [Google Scholar] [CrossRef]
  21. Uçgun, K.; Gezgin, S. Interpretation of leaf analysis performed in early vegetation in apple orchards. Commun. Soil Sci. Plant. Anal. 2017, 48, 1719–1725. [Google Scholar] [CrossRef]
  22. Egnér, H.; Riehm, H.; Domingo, W. Untersuchungen über die chemische Bodenanalyse als Grundlage für die Beurteilung des Nährstoffzustandes der Böden. II. Chemische Extraktions methoden zur Phosphor und Kaliumbestimmung. K. Lantbr. Ann. 1960, 26, 199–215. [Google Scholar]
  23. Instituto Português do Mar e da Atmosfera (IPMA). Atlas climático Ibérico. 2022. Available online: https://www.ipma.pt/export/sites/ipma/bin/docs/institucionais/pr_atlas.clima.iberico.dmm11.pdf (accessed on 30 June 2022).
  24. Direção-Geral de Agricultura e Desenvolvimento Rural (DGADR) Normas Técnicas Para a Produção Integrada de Pomóideas; DGADR: Lisbon, Portugal, 2012; p. 252. Available online: https://www.dgadr.gov.pt/images/docs/prod_sust/normas_pi/i012008.pdf (accessed on 30 June 2022).
  25. EN 13650; Comite Europeen de Normalisation (CEN). Soil Improvers and Growing Media—Extraction of Aqua Regia Soluble Elements. European Standard: New York, NY, USA, 2001.
  26. Horneck, D.A.; Miller, R.O. Determination of Total Nitrogen in Plant Tissue. In Handbook of Reference Methods for Plant Analysis; Karla, Y.P., Ed.; Soil and Plant Science Council, CRC Press: Boca Raton, FL, USA, 1998; pp. 75–83. [Google Scholar]
  27. Houba, V.J.G.; Novozamsky, I.; van Dijk, D. Certification of an air-dry soil for pH and extractable nutrients using one hundredth molar calcium chloride. Commun. Soil Sci. Plant. Anal. 1998, 29, 1083–1090. [Google Scholar] [CrossRef]
  28. Montañés, L.; Heras, L.; Abadía, J.; Sanz, M. Plant analysis interpretation based on a new index: Deviation from optimum percentage (DOP). J. Plant. Nutr. 1993, 16, 1289–1308. [Google Scholar] [CrossRef]
  29. Nachtigall, G.R.; Dechen, A.R. Seasonality of nutrients in leaves and fruits of apple trees. Sci. Agric. 2006, 63, 493–501. [Google Scholar] [CrossRef]
  30. Cheng, L.; Raba, R. Nutrient requirements of Gala/M.26 apple trees for high yield and quality. N. Y. Fruit Quart. 2009, 17, 5–10. [Google Scholar]
  31. Casero, T.; Torres, E.; Alegre, S.; Recasens, I. Macronutrient accumulation dynamics in apple fruits. J. Plant. Nutr. 2017, 40, 2468–2476. [Google Scholar] [CrossRef]
  32. Faust, M. Nutrition of fruit trees. In Physiology of Temperature Fruit Trees; Wiley-Interscience publication: New York, NY, USA, 1989; pp. 53–132. [Google Scholar]
  33. Sanz, M.; Montañés, L.; Carrera, M. The possibility of using floral analysis to diagnose the nutritional status of pear trees. Acta Hortic. 1994, 367, 290–295. [Google Scholar] [CrossRef]
  34. Sanz, M.; Montañés, L. Flower analysis as a new approach to diagnosing the nutritional status of the peach tree. J. Plant. Nutr. 1995, 18, 1667–1675. [Google Scholar] [CrossRef]
  35. Belkhodja, R.; Morales, F.; Sanz, M.; Abadía, A.; Abadía, J. Iron deficiency in peach trees: Effects on leaf chlorophyll and nutrient concentrations in flowers and leaves. Plant. Soil 1998, 203, 257–268. [Google Scholar] [CrossRef]
  36. Jiménez, S.; Garín, A.; Gogorcenat, Y.; Betrán, J.A.; Moreno, M.A. Flower and foliar analysis for prognosis of sweet cherry nutrition: Influence of different rootstocks. J. Plant. Nutr. 2004, 27, 701–712. [Google Scholar] [CrossRef]
  37. Kucukyumuk, Z.; Erdal, I. Rootstock and cultivar effect on mineral nutrition, seasonal nutrient variation and correlations among leaf, flower and fruit nutrient concentrations in apple trees. Bulg. J. Agric. Sci. 2011, 17, 633–641. [Google Scholar]
  38. Uçgun, K.; Altındal, M.; Cansu, M. Usage of shoot analyses to assess early-season nutritional status of apple trees. Erwerbs-Obstbau 2018, 60, 113–117. [Google Scholar] [CrossRef]
  39. Johnson, R.S.; Andris, H.; Day, K.; Bede, R. Using dormant shoots to determine the nutritional status of the nutritional status of peach trees. Acta Hortic. 2006, 721, 285–290. [Google Scholar] [CrossRef]
  40. Pestana, M.; Varennes, A.; De Goss, M.J.; Abadía, J.; Faria, E.A. Floral analysis as a tool to diagnose iron chlorosis in orange trees. Plant. Soil 2004, 259, 287–295. [Google Scholar] [CrossRef]
  41. Karagiannidis, N.; Thomidis, T.; Zakinthinos, G.; Tsipouridis, C. Prognosis and correction of iron chlorosis in peach trees and relationship between iron concentration and Brown Rot. Sci. Hortic. 2008, 118, 212–217. [Google Scholar] [CrossRef]
  42. Bouranis, D.L.; Chorianopoulou, S.N.; Zakynthinos, G.; Sarlis, G.; Drossopoulos, J.B. Flower analysis for prognosis of nutritional dynamics of almond tree. J. Plant. Nutr. 2001, 24, 705–716. [Google Scholar] [CrossRef]
  43. Kalcsits, L.; Lotze, E.; Tagliavini, M.; Hannam, K.D.; Mimmo, T.; Neilsen, D.; Neilsen, G.; Atkinson, D.; Casagrande Biasuz, E.; Borruso, L.; et al. Recent achievements and new research opportunities for optimizing macronutrient availability, acquisition, and distribution for perennial fruit crops. Agronomy 2020, 10, 1738. [Google Scholar] [CrossRef]
  44. Kowalczyk, W.; Wrona, D.; Przybyłko, S. Content of minerals in soil, apple tree leaves and fruits depending on nitrogen fertilization. J. Elem. 2017, 22, 67–77. [Google Scholar] [CrossRef]
  45. Sete, P.B.; Comin, J.J.; Ciotta, M.N.; Salume, J.A.; Thewes, F.; Brackmann, A.; Toselli, M.; Nava, G.; Rozane, D.E.; Loss, A.; et al. Nitrogen fertilization affects yield and fruit quality in pear. Sci. Hortic. 2019, 258, 108782. [Google Scholar] [CrossRef]
  46. Nava, G.; Dechen, A.R. Long-term annual fertilization with nitrogen and potassium affect yield and mineral composition of ‘Fuji’ apple. Sci. Agric. 2009, 66, 377–385. [Google Scholar] [CrossRef]
  47. Brunetto, G.; de Melo, W.G.B.; Toselli, M.; Quartieri, M.; Tagliavini, M. The role of mineral nutrition on yields and fruit quality in grapevine, pear and apple. Rev. Bras. Frutic. 2015, 37, 1089–1104. [Google Scholar] [CrossRef]
  48. Neilsen, G.H.; Neilsen, D.; Herbert, L. Nitrogen fertigation concentration and timing of application affect nitrogen nutrition, yield, firmness, and color of apples grown at high density. HortScience 2009, 44, 1425–1431. [Google Scholar] [CrossRef]
  49. Bennewitz, E.; Cazanga-Solar, R.; Carrasco-Benavides, M.; Fredes-Monsalve, C.; Alba-Mejía, J.E.; Losak, T. Vegetative and productive responses of organic apple (Malus domestica L.) to fossilized red guano and a controlled-release fertilizer. Chil. J. Agric. Anim. Sci. 2017, 33, 213–220. [Google Scholar] [CrossRef]
  50. Zhang, W.; Zhang, X.; Wang, Y.; Zhang, N.; Guo, Y.; Ren, X.; Zhao, Z. Potassium fertilization arrests malate accumulation and alters soluble sugar metabolism in apple fruit. Biol. Open 2018, 7, bio024745. [Google Scholar] [CrossRef] [PubMed]
  51. Bai, Q.; Shen, Y.; Huang, Y. Advances in mineral nutrition transport and signal transduction in Rosaceae fruit quality and postharvest storage. Front. Plant. Sci. 2021, 12, 620018. [Google Scholar] [CrossRef] [PubMed]
  52. Amarante, C.V.T.; Steffens, C.A.; Ernani, P.R. Identificação pré-colheita do risco de ocorrência de “bitter pit” em maçãs ‘Gala’ por meio de infiltração com magnésio e análise dos teores de cálcio e nitrogênio nos frutos. Rev. Bras. Frutic. 2010, 32, 27–34. [Google Scholar] [CrossRef]
  53. Marcelle, R.D. Is there any relationship between the flesh mineral content and the peel hexane extracts of apple fruit? Acta Hortic. 1993, 326, 251–258. [Google Scholar] [CrossRef]
  54. Kuzin, A.; Solovchenko, A. Essential role of potassium in apple and its implications for management of orchard fertilization. Plants 2021, 10, 2624. [Google Scholar] [CrossRef]
Figure 1. Boxplots with the distribution of each macronutrient content (%) and micronutrient content (mg kg−1 DW) across the apple organs. Dots represent outliers defined as values outside the whiskers Q1 − 1.5 (Q3–Q1) and Q3 + 1.5 (Q3–Q1) where Q1 and Q3 are the first and third quartiles, respectively, that define the extremes of the box.
Horticulturae 08 00713 g001
Figure 2. Matrix of scatterplots of boron content (mg kg−1 DW) between pairs of organs (n = 180). The scatterplot in line i and column j (j > i) contains boron content in organ i plotted against boron content in organ j. Each color corresponds to a year: black for 2018, red for 2019, green for 2020 and blue for 2021. The upper panel displays the corresponding Pearson correlation coefficients, where line i and column j (i > j) contain the correlation between boron content in organs i and j. All correlations are significantly different from zero (p < 0.05).
Horticulturae 08 00713 g002
Figure 3. Each plot refers to a nutrient in fruits 15 DBH. Each point represents the average of 9 values (3 biological replicates for each of the 3 fertilization strategies) observed for a given year and orchard (%). Lines connect observations from the same orchard.
Horticulturae 08 00713 g003
Figure 4. Productivity (t ha−1) of orchards (AE). Each plot refers to an orchard. Each dot represents the average of 15 replicates (apple trees) observed for a given year and fertilization strategy. Lines join points with the same fertilization strategy. An ANOVA model with 2 factors (Year and Fertilization strategy) with interaction was fitted to the data of each plot. The significance of each F-test is also represented. Y: year, F: fertilization strategy, YF: interaction. “***” for p-value < 0.01, “*” for 0.05 < p-value < 0.1 and “ns” for p-value > 0.1.
Horticulturae 08 00713 g004
Figure 5. Average weight per fruit (g) of orchards (AE). Each plot refers to an orchard. Each dot represents the average of 15 replicates (apple trees) observed for a given year and fertilization strategy. Lines join points with the same fertilization strategy. An ANOVA model with 2 factors (Year and Fertilization strategy) with interaction was fitted to the data of each plot. The significance of each F-test is also presented. Y: year, F: fertilization strategy, YF: interaction. “***” for p-value < 0.01, “**” for 0.01 < p-value < 0.05 and “ns” for p-value > 0.1.
Horticulturae 08 00713 g005
Figure 6. Firmness versus ratios of nutrients in fruits. Each point corresponds to an experimental condition defined by year, orchard and fertilization strategy, with coordinates: y—average of 14 measures in different fruits and x—average of 3 measures in independent biological replicates (n = 60). The Pearson correlation is only significant for N/Ca (r = 0.406 with p = 0.0017); for K/Ca, r = 0.109 with p = 0.422.
Horticulturae 08 00713 g006
Table 1. Main soil characteristics according to soil analysis 2018.
OrchardpHECTextureOMN-NH4N-NO3P2O5K2O
(mS cm−1) (%)---------- mg kg−1 ----------
A8.00.15Clay1.4410.93.3552437
B7.30.32Clay1.609.512.7958393
C7.20.14clay loam1.508.47.4920203
D8.30.24Clay1.6711.113.2323305
E7.80.21Clay1.809.715.7391213
Table 2. Planting date, locations, Gala clone and rootstock and spacing.
OrchardPlanting
Date
Latitude
Longitude
CloneRootstockSpacing
(m)
(m × m)
A201639°26′59.95″ NSchniga SchniCoM9 T3373.80 × 0.70
9°01′05.14″ W
9°01′05.14″ W
B201639°30′55.01″ NGala SchnicoM9 T3373.30 × 0.85
9°00′54.71″ W
C201539°35′20.06″ N 8°59′11.40″ WVenus FengalM9 T3373.80 × 0.80
D201539°28′30.48″ N 9°07′12.72″ WGala BrookfieldM9 T3374.00 × 1.00
E200439°32′55.36″ N 8°57′22.52″ WGalaxy SelectaM9 EMLA4.50 × 1.20
Table 3. Mean and standard error of treatments, amount of fertilizer (kg ha1) during the four-year trial (2018 to 2021).
Orchard
Treatment(kg ha−1)ABCDE
StandardN64.4 ± 3.147.8 ± 5.355.6 ± 5.139 ± 5.149.8 ± 4.2
P2O551.0 ± 2.718.3 ± 1.735.2 ± 4.428.3 ± 5.426.0 ± 11.7
K2O75.5 ± 5.776.5 ± 5.281.5 ± 19.762.1 ± 11.474.4 ± 2.8
2× StandardN101.7 ± 2.592.5 ± 13.1103.2 ± 1.173.0 ± 23.698.6 ± 5.1
P2O564.9 ± 5.337.3 ± 5.765.7 ± 17.952.6 ± 12.741.8 ± 4.0
K2O160.0 ± 0.7158.5 ± 21.2154.3 ± 10.0112.6 ± 18.2144.6 ± 4.4
2× Standard OMN107.7 ± 9.594.0 ± 12.4103.4 ± 1.080.4 ± 17.7103.0 ± 4.7
P2O569.1 ± 3.340.0 ± 5.065.6 ± 17.957.2 ± 7.357.5 ± 19.4
K2O166.0 ± 12.7149.5 ± 9.9154.3 ± 10.0120.8 ± 15.6141.3 ± 8.8
Table 4. Pearson correlation coefficients for the content of each element in all pairs of organs (n = 180. The top triangle contains the macronutrient correlations and the bottom triangle contains the micronutrient correlations. Only correlations whose absolute value is less than 0.123 are not significantly different from zero (at a 5% significance level).
BudsFlowersLeaves
45 DAFB
Leaves
90–110 DAFB
Fruits
60 DABF
Fruits
15 DBH
BudsN0.5210.5230.4980.3160.734N
P0.3250.196−0.008−0.1820.169P
K0.2660.7340.120−0.1550.225K
Mg0.1410.4230.2800.2800.217Mg
Ca0.3280.4620.1520.2150.069Ca
S−0.047−0.366−0.065−0.2670.058S
FlowersFe−0.191Fe            N0.3760.3920.4480.581N
Cu0.27Cu            P0.2750.015−0.2900.151P
Zn0.491Zn            K0.195−0.468−0.675−0.375K
Mn0.125Mn           Mg0.134−0.097−0.0850.456Mg
B0.317B              Ca0.235−0.094−0.1380.069Ca
                  S−0.0620.180−0.221−0.164S
Leaves
45 DAFB
Fe0.2850.094Fe            N0.2810.1780.549N
Cu0.1310.114Cu            P0.5030.5360.407P
Zn0.160.525Zn            K0.156−0.0730.067K
Mn0.18−0.045Mn           Mg0.4960.1900.29Mg
B0.3970.449B              Ca0.4860.2370.066Ca
S0.0810.461−0.213                  S
Leaves
90–110 DAFB
Fe0.4620.0240.512Fe            N0.3070.447N
Cu00.120.159Cu            P0.3800.057P
Zn0.273−0.070.077Zn            K0.3630.378K
Mn0.281−0.1510.312Mn           Mg0.208−0.017Mg
B0.5220.3820.747B              Ca0.4210.058Ca
                  S−0.0060.005S
Fruits
60 DABF
Fe−0.0830.1810−0.076Fe            N0.343N
Cu−0.0160.1510.0780.134Cu            P0.19P
Zn0.2140.5010.7060.244Zn            K0.154K
Mn0.165−0.2230.0050.302Mn           Mg0.225Mg
B0.5150.5280.8710.794B              Ca0.034Ca
                  S−0.139S
Fruits
15 DBH
Fe0.1570.1050.1450.1790.126Fe
Cu−0.405−0.0070.3660.2590.048Cu
Zn0.30.1710.1180.3450.148Zn
Mn−0.019−0.0570.2710.6240.101Mn
B0.5590.3120.6640.8530.781B
Table 5. p-values of F tests to the principal and interaction effects, based on a 3-way ANOVA with interaction model. The model was fitted to a set of approximately 180 observations for each nutrient, 3 biological replicates by cell.
SignificanceLeaves 90–110 DAFBFruits 15 DBH
NPKCaMgSNPKCaMgS
Y: Year0.0000.0000.0000.0000.0000.0000.0000.0000.0000.0000.0000.000
O: Orchard0.0000.0000.0000.0000.0000.0000.0000.0000.0000.0000.0000.000
F: Fertilizationn.s.0.000n.s.0.0190.009n.s.n.s.n.s.n.s.n.s.n.s.n.s.
YO0.0010.0000.0000.0000.0000.0000.0000.0000.0000.0000.0000.000
YFn.s.0.0430.0010.001n.s.n.s.0.001n.s.n.s.n.s.n.s.n.s.
OF0.0470.000n.s.0.0230.0000.0000.0480.026n.s.n.s.n.s.n.s.
YOFn.s.n.s.n.s.0.002n.s.0.0010.002n.s.n.s.n.s.n.s.n.s.
Factor Y: Year; Factor O: Orchard; Factor F: Fertilization; YO, YF, OF, YOF represent the interaction of the factors. No significance (“n.s. p-value > 0.05”).
Table 6. DOP index (Deviation from Optimum Percentage) for leaves 90–110 DAFB. Reference values from DGADR (2011) [24]. Mean ± standard deviation of 9 individual DOP indices. Column Sum has the average of the 9 sums of the absolute values of DOP of each nutrient. Column Group indicates the sums that are significantly different, based on Tukey’s test at a 0.05 significance level. Bold values indicate that the element concentration is outside the range between the minimum and maximum value.
YearOrchardNPKCaMgSSumGroup
2018A−17.0 ± 11.6−7.6 ± 8.4−9.0 ± 4.7+9.3 ± 8.3−9.2 ± 9.9−36.3 ± 7.388.5defg
B−21.8 ± 6.9−6.8 ± 5.7−9.7 ± 5.1−14.8± 14.4−7.0 ± 16.2−29.0 ± 9.889.1defg
C−0.6 ± 6.1+12.2 ± 6.8−10.9 ± 4.9−4.0 ± 5.5+24.3 ± 12.4−31.5 ± 4.983.5efgh
D−8.7 ± 8.8−1.3 ± 6.0−25.8 ± 5.4+19.3 ± 9.0+5.3 ± 8.8−11.3 ± 10.471.6fgh
E−15.0 ± 12.3+14.3 ± 9.7−22.0 ± 4.8+17.6 ± 9.1+11.5 ± 9.6−18.8 ± 8.199.0defg
2019A−26.7 ± 6.1+8.7 ± 4.7−13.2 ± 4.3+17.0 ± 8.8+31.6 ± 10.6−22.8 ± 6.1120.1cdef
B−24.7 ± 6.3+7.4 ± 7.7−19.1 ± 3.2−13.0 ± 7.4+20.2 ± 9.6−24.2 ± 5.5108.7cdefg
C+6.7 ± 15.8+39.4 ± 22.3−23.0 ± 9.7+12.7 ± 13.0+66.0 ± 24.3−9.5 ± 7.8157.4ab
D−18.5 ± 24.7+11.4 ± 4.4−23.3 ± 4.1+39.2 ± 9.7+61.0 ± 16.5−22.4 ± 6.9175.7a
E−22.0 ± 10.2+24.8 ± 6.6−34.4 ± 3.2+22.9 ± 6.7+52.3 ± 7.9−9.7 ± 20.9166.2a
2020A−30.6 ± 27.8−6.1 ± 8.3−7.7 ± 9.8+20.6 ± 11.0+26.9 ± 4.8−19.1 ± 6.8111.0cde
B−23.7 ± 13.1+10.8 ± 5.8+12.3 ± 9.1−24.2 ± 16.9+0.7 ± 12.6+1.2 ± 15.473.0defg
C−34.2 ± 20.5+20.6 ± 11.6−12.0 ± 6.1−1.8 ± 9.3+56.1 ± 13.3−17.9 ± 4.8142.5abc
D−36.6 ± 35.5+23.4 ± 5.4−18.2 ± 4.5+21.6 ± 5.6+37.1 ± 7.6+1.9 ± 3.8138.8abc
E−41.5 ± 21.6+0.5 ± 5.0−26.0 ± 3.1+7.3 ± 4.2+19.2 ± 8.9−12.4 ± 7.4107.1cdefg
2021A−7.5 ± 4.3+1.0 ± 2.3+1.5 ± 5.4+22.6 ± 9.5+21.6 ± 6.6−19.3 ± 7.473.5gh
B−13.0 ± 4.5−0.3 ± 4.2−0.3 ± 5.2+6.0 ± 10.1+13.8 ± 7.2−4.4 ± 5.737.8h
C+2.1 ± 4.5+30.4 ± 9.2−10.0 ± 8.9+31.6 ± 10.2+73.8 ± 14.5−24.8 ± 3.8172.7a
D−15.7 ± 10.1+8.6 ± 3.4−7.4 ± 10.1+3.9 ± 6.8+18.4 ± 5.9−30.6 ± 6.384.6defgh
E+2.9 ± 5.2+20.5 ± 8.3−5.0 ± 11.5+29.7 ± 7.9+43.1 ± 13.2−23.0 ± 9.4124.1bcd
Table 7. Mean ± standard deviations of each micronutrient content (ppm) in leaves 90–110 DAFB (n = 9). Values in bold indicate that the element concentration is outside the range between the minimum and maximum values for ‘Royal Gala’: Fe > 45; 10 < Zn < 100, 25 < Mn < 200, 25 < Bo < 50 and 10 < Cu < 50 ppm.
YearOrchardFeCuZnMnB
2018A84.7 ± 29.94.0 ± 2.113.4 ± 1.075.9 ± 10.220.6 ± 2.2
B105.4 ± 15.05.6 ± 2.114.6 ± 2.169.1 ± 5.527.4 ± 1.9
C94.5 ± 15.87.4 ± 1.036.5 ± 2.9191.7 ± 13.622.8 ± 2.1
D129.3 ± 74.87.3 ± 2.262.3 ± 6.2306.1 ± 45.415.3 ± 2.0
E67.7 ± 7.77.5 ± 3.135.8 ± 4.0134.3 ± 79.918.9 ± 1.3
2019A90.1 ± 8.68.7 ± 1.018.0 ± 2.4105.5 ± 21.115.6 ± 1.1
B106.7 ± 45.29.0 ± 1.627.3 ± 9.5108.9 ± 14.918.9 ± 2.3
C90.6 ± 14.68.1 ± 1.439.7 ± 4.2263.4 ± 30.219.3 ± 4.2
D263.7 ± 51.49.9 ± 1.140.0 ± 3.5183.3 ± 27.413.2 ± 1.1
E82.4 ± 17.18.8 ± 0.929.2 ± 6.3115.9 ± 68.112.9 ± 0.8
2020A94.6 ± 11.77.8 ± 0.422.7 ± 4.0158.3 ± 22.318.6 ± 1.4
B89.4 ± 13.88.3 ± 0.956.3 ± 14.4387.7 ± 99.826.0 ± 3.1
C92.5 ± 32.25.7 ± 0.732.4 ± 4.4238.5 ± 12.223.8 ± 1.4
D225.5 ± 53.68.4 ± 0.353.0 ± 4.5269.2 ± 33.417.5 ± 0.7
E139.3 ± 17.08.9 ± 1.430.3 ± 2.3156.2 ± 77.117.4 ± 0.6
2021A83.5 ± 12.910.0 ± 0.638.5 ± 8.0264.5 ± 65.726.3 ± 3.2
B149.5 ± 20.8N.D.36.7 ± 4.5166.9 ± 16.935.7 ± 2,4
C122.2 ± 62.614.1 ± 1.520.2 ± 8.376.3 ± 7.333.6 ± 0.9
D122.2 ± 16.011.3 ± 0.838.4 ± 2.7200.1 ± 31.423.5 ± 0.7
E83.9 ± 10.113.1 ± 1.332.7 ± 8.4168.8 ± 89.626.7 ± 0.8
N.D. not determined.
Table 8. TSS (°Brix) and Firmness (kg cm−2) in fruits measured at harvest time for each year and orchard. Means and standard deviations where obtained with 42 observations. Letters show the means that are significantly different in a two-way ANOVA with interaction model with Year and Orchard as factors.
YearOrchardTSS (°Brix)Firmness (kg cm−2)
MeansdMeansd
2018A13.2 ghij1.026.6 bc0.61
B13.3 fgh0.866.4 bcde0.97
C13.1 hij0.936.2 cdef0.57
D12.2 kl0.906.8 b0.55
E13.3 fghi0.847.7 a0.96
2019A12.7 ijk0.925.9 efg0.66
B12.1 kl0.785.1 ijk0.43
C13.1 hij0.696.2 cdef0.66
D13.9 def0.646.3 bcdef0.79
E14.0 cde0.425.9 efg0.35
2020A12.7 jk0.855.8 fgh0.59
B12.0 l0.694.7 k0.36
C14.2 bcd0.675.4 hij0.61
D13.8 defg0.50N.D.N.D.
E15.4 a0.636.2 cdef0.84
2021A13.4 efgh1.015.4 ghi0.55
B12.1 kl0.924.9 jk0.61
C13.5 efgh0.926.0 ef0.55
D14.7 b1.096.1 def0.92
E14.6 bc0.816.6 bcd0.75
N.D. not determined.
Publisher’s Note: MDPI stays neutral with regard to jurisdictional claims in published maps and institutional affiliations.

