Article

Non-Destructive Detection of Fruit Quality Parameters Using Hyperspectral Imaging, Multiple Regression Analysis and Artificial Intelligence

by
Behzad Hasanzadeh
1,*,
Yousef Abbaspour-Gilandeh
1,*,
Araz Soltani-Nazarloo
1,
Mario Hernández-Hernández
2,3,
Iván Gallardo-Bernal
4 and
José Luis Hernández-Hernández
2,3,*
1
Department of Biosystems Engineering, Faculty of Agriculture and Natural Resources, University of Mohaghegh Ardabili, Ardabil 56199-11367, Iran
2
Faculty of Engineering, Autonomous University of Guerrero, Chilpancingo 39087, Mexico
3
National Technological of México/Campus Chilpancingo, Chilpancingo 39070, Mexico
4
Government and Public Management Faculty, Autonomous University of Guerrero, Chilpancingo 39087, Mexico
*
Authors to whom correspondence should be addressed.
Horticulturae 2022, 8(7), 598; https://doi.org/10.3390/horticulturae8070598
Submission received: 20 May 2022 / Revised: 29 June 2022 / Accepted: 30 June 2022 / Published: 4 July 2022

Abstract

:
Currently, destructive methods are often used to measure the quality parameters of agricultural products. These methods are often complex, time consuming and costly. Recently, studying to find a solution to the disadvantages of destructive methods has become a major challenge for researchers. Non-destructive methods can be useful for the rapid detection of the quality parameters of agricultural products. In this study, hyperspectral imaging was used to evaluate the non-destructive quality parameters of Red Delicious (Red Delicious) and Golden Delicious (Golden Delicious) apples, including pH, soluble solids content (SSC), titratable acid (TA) and total phenol (TP). In order to predict the quality characteristics of apples, the partial least squares (PLS) method with different pre-processing was used. The developed models were evaluated using the root mean square parameters of RMSECV validation error, correlation coefficient (Rcv) and standard deviation ratio (SDR). The results showed that in Red Delicious, for pH, TA, SSC and TP the best forecasting methods were SNV, SNV, MSC and normalized pre-processing with the regression coefficient values of 0.9919, 0.9939, 0.9909 and 0.9899, respectively. In Golden Delicious (Golden Delicious), for pH, TA, SSC and TP, the first derivative, (smoothing and second derivative), normalize (and SNV and normalize) preprocessors were selected as the best prediction models, with values of 0.9989, 0.9989, 0.9999 and 0.9989, respectively. The results related to an artificial neural network also showed that in hyperspectral imaging, the best state of the feed-forward network structure with the LM training algorithm was R = 0.93, Performance = 0.005 and RMSE = 0.03 in 325 inputs, 5 outputs and 2 hidden layers. The results showed that hyperspectral imaging has different predictive capabilities for the qualitative characteristics studied in this study with high accuracy.

1. Introduction

The quality of agricultural products is crucial in terms of consumer interest and determining the levels of market acceptance. Therefore, quality directly affects the storage and post-harvest processing operations. Measuring the quality of fruits, vegetables and food products is the focus of the food industry. Non-destructive measurements of quality parameters have been performed on many agricultural products, and are fast and accurate in estimating the quality factors involved [1,2,3,4,5].
Extensive research has been conducted in recent decades on the applications of both destructive and non-destructive methods in fruit quality assessment, but most of the proposed methods have not been able to provide all of the information needed to determine the quality and ripening of fruits.
Over the past decade, hyperspectral imaging has evolved rapidly and widely, and is now being used as a new scientific tool in the non-destructive evaluation of the quality of fruits and vegetables. The spectral imaging technique uses a combination of imaging and spectroscopy in a system that can obtain a set of monochrome images from approximately hundreds of thousands of wavelengths. Many published studies in the field of the processing and analysis of spectral images have suggested the use of hyperspectral imaging techniques to assess the quality of fruits and vegetables.
Destructive methods are now often used to measure qualitative parameters, which are difficult, time consuming and costly. Non-destructive methods of measuring the quality properties of fruit can be useful for the rapid determination of quality and ripening of more fruits individually. As according to the mentioned cases, in this study, the possibility of rapid and non-destructive detection and of the prediction of indicators such as soluble solids (SSC), titratable acid (TA), pH and total phenol (TP) of apple fruit were investigated by hyperspectral imaging. To achieve this goal, we developed the PLS least squares model and compared it with the results obtained from artificial intelligence. Based on the results obtained from data analysis, we introduced the best method for identifying the qualitative characteristics of apple fruit.
In the study by Gao et al. (2022) on Malus Micro-malus Makino, regression and classification models were studied by using NIR-HIS combined with chemo-metrics to develop the efficiency of non-destructive detection. The SPA, iRF and SCARS methods were used to extract effective wavelengths sensitive to changes in SSC and FI information. In their study, two types of assessment models, based on full-spectrum and effective wavelengths (namely, partial least squares regression and extreme learning machine), were established to predict the SSC and FI. In addition, the classification models based on the support vector machine, improved by the GWO-SVM and PLSR-DA, were constructed to differentiate the maturity stage. Their results illustrated that the SPA-ELM and SPA-GWO-SVM models achieved satisfactory performances. Finally, it can be said that NIR-HSI is possible to evaluate the quality of Micro-malus Micino Malus [6].
In the study by Benelli et al. (2021) on Sangiovese grapes, grape mean spectra were extracted from each hyperspectral image and used to predict the SSC by PLS, and to classify the samples into the two classes by PLS-DA. The SSC was predicted with a R2 = 0.77 (RMSECV = 0.79° Brix), and classified the samples with 86 to 91% accuracy. Their study shows the potential of the use of HSI technology directly in the field by proximal measurements under natural light conditions for the prediction of the harvest time of the ‘Sangiovese’ red grape [7].
Ekramirad et al. (2017) used hyperspectral imaging in the range of 400 to 1000 nm to detect infected apples, and reported that the classification of infested samples from normal ones was possible with the classification rates of 96% and 94% for normal and infested apples, respectively. The best classification rate was obtained for the decision tree method [8].
Zhu et al. (2017) used hyperspectral imaging to predict the internal quality of Kiwifruit based on variable selection algorithms and geometric models. The firmness, soluble solids content (SSC) and pH of Kiwifruit were evaluated using this technique. Weighted regression coefficients (BW), sequential prediction algorithm (SPA) and genetic algorithm-partial least square (GAPLS) were compared and evaluated to select the effective wavelengths. Furthermore, Multiple Linear Regression (MLR), Partial Least Squares Regression and Least Squares Support Vector Machines (LS-SVM) were developed to predict quantitative quality characteristics using effective wavelengths. The SPA-MLR model showed excellent performance for firmness and SSC at 380–1023 nm, while the GAPLS-LS-SVM model was optimal at 874–1734 nm for pH prediction [9].
Mobli et al. (2020) used hyperspectral imaging in the near-infrared region with the partial least square discriminant method for the rapid detection of leaf lettuce infected with E. coli from control samples (not infected), and reported that four different groups could be classified with an accuracy of more than 90% and an error of less than 0.008 [10].
According to the above, the non-destructive detection of the quality parameters of apple fruit, which is one of the most important fruits for export, can lead to progress in the post-harvest, sorting and grading activities, and can also lead to the construction and design of machines that can grade fruits online in the shortest possible time in terms of quality (amount of ripening, amount of sweetness, etc.) without any damage to the fruit. The detection of qualitative parameters in agricultural products is conducted using various destructive and non-destructive methods. In this research, we try to identify and introduce the best model for diagnosing and predicting the quality parameters of apple fruit using partial least squares regression (PLS).
In this study, pH parameters, soluble solids, titratable acid and phenol were predicted. Because pH indicates the acidity of fruit juice, soluble solids represent fruit sugar, titratable acid indicates taste and phenol as free radical scavengers play an important role in health.
The purpose of this study is to detect and predict the qualitative parameters (pH, soluble solids (SSCs), titratable acid (TA) and total phenol (TP)) of apples with spectral imaging and using a multiple regression analysis to determine the quality of apple fruit quality parameters and also to determine the best artificial intelligence algorithms in determining apple fruit quality parameters. This method is of great importance due to there being no need for sample preparation, no need for special skills, field usability, remote usability, fast measurement and no waste generated and the fact that it is accurate, reliable, efficient and non-invasive.

2. Materials and Methods

2.1. Samples

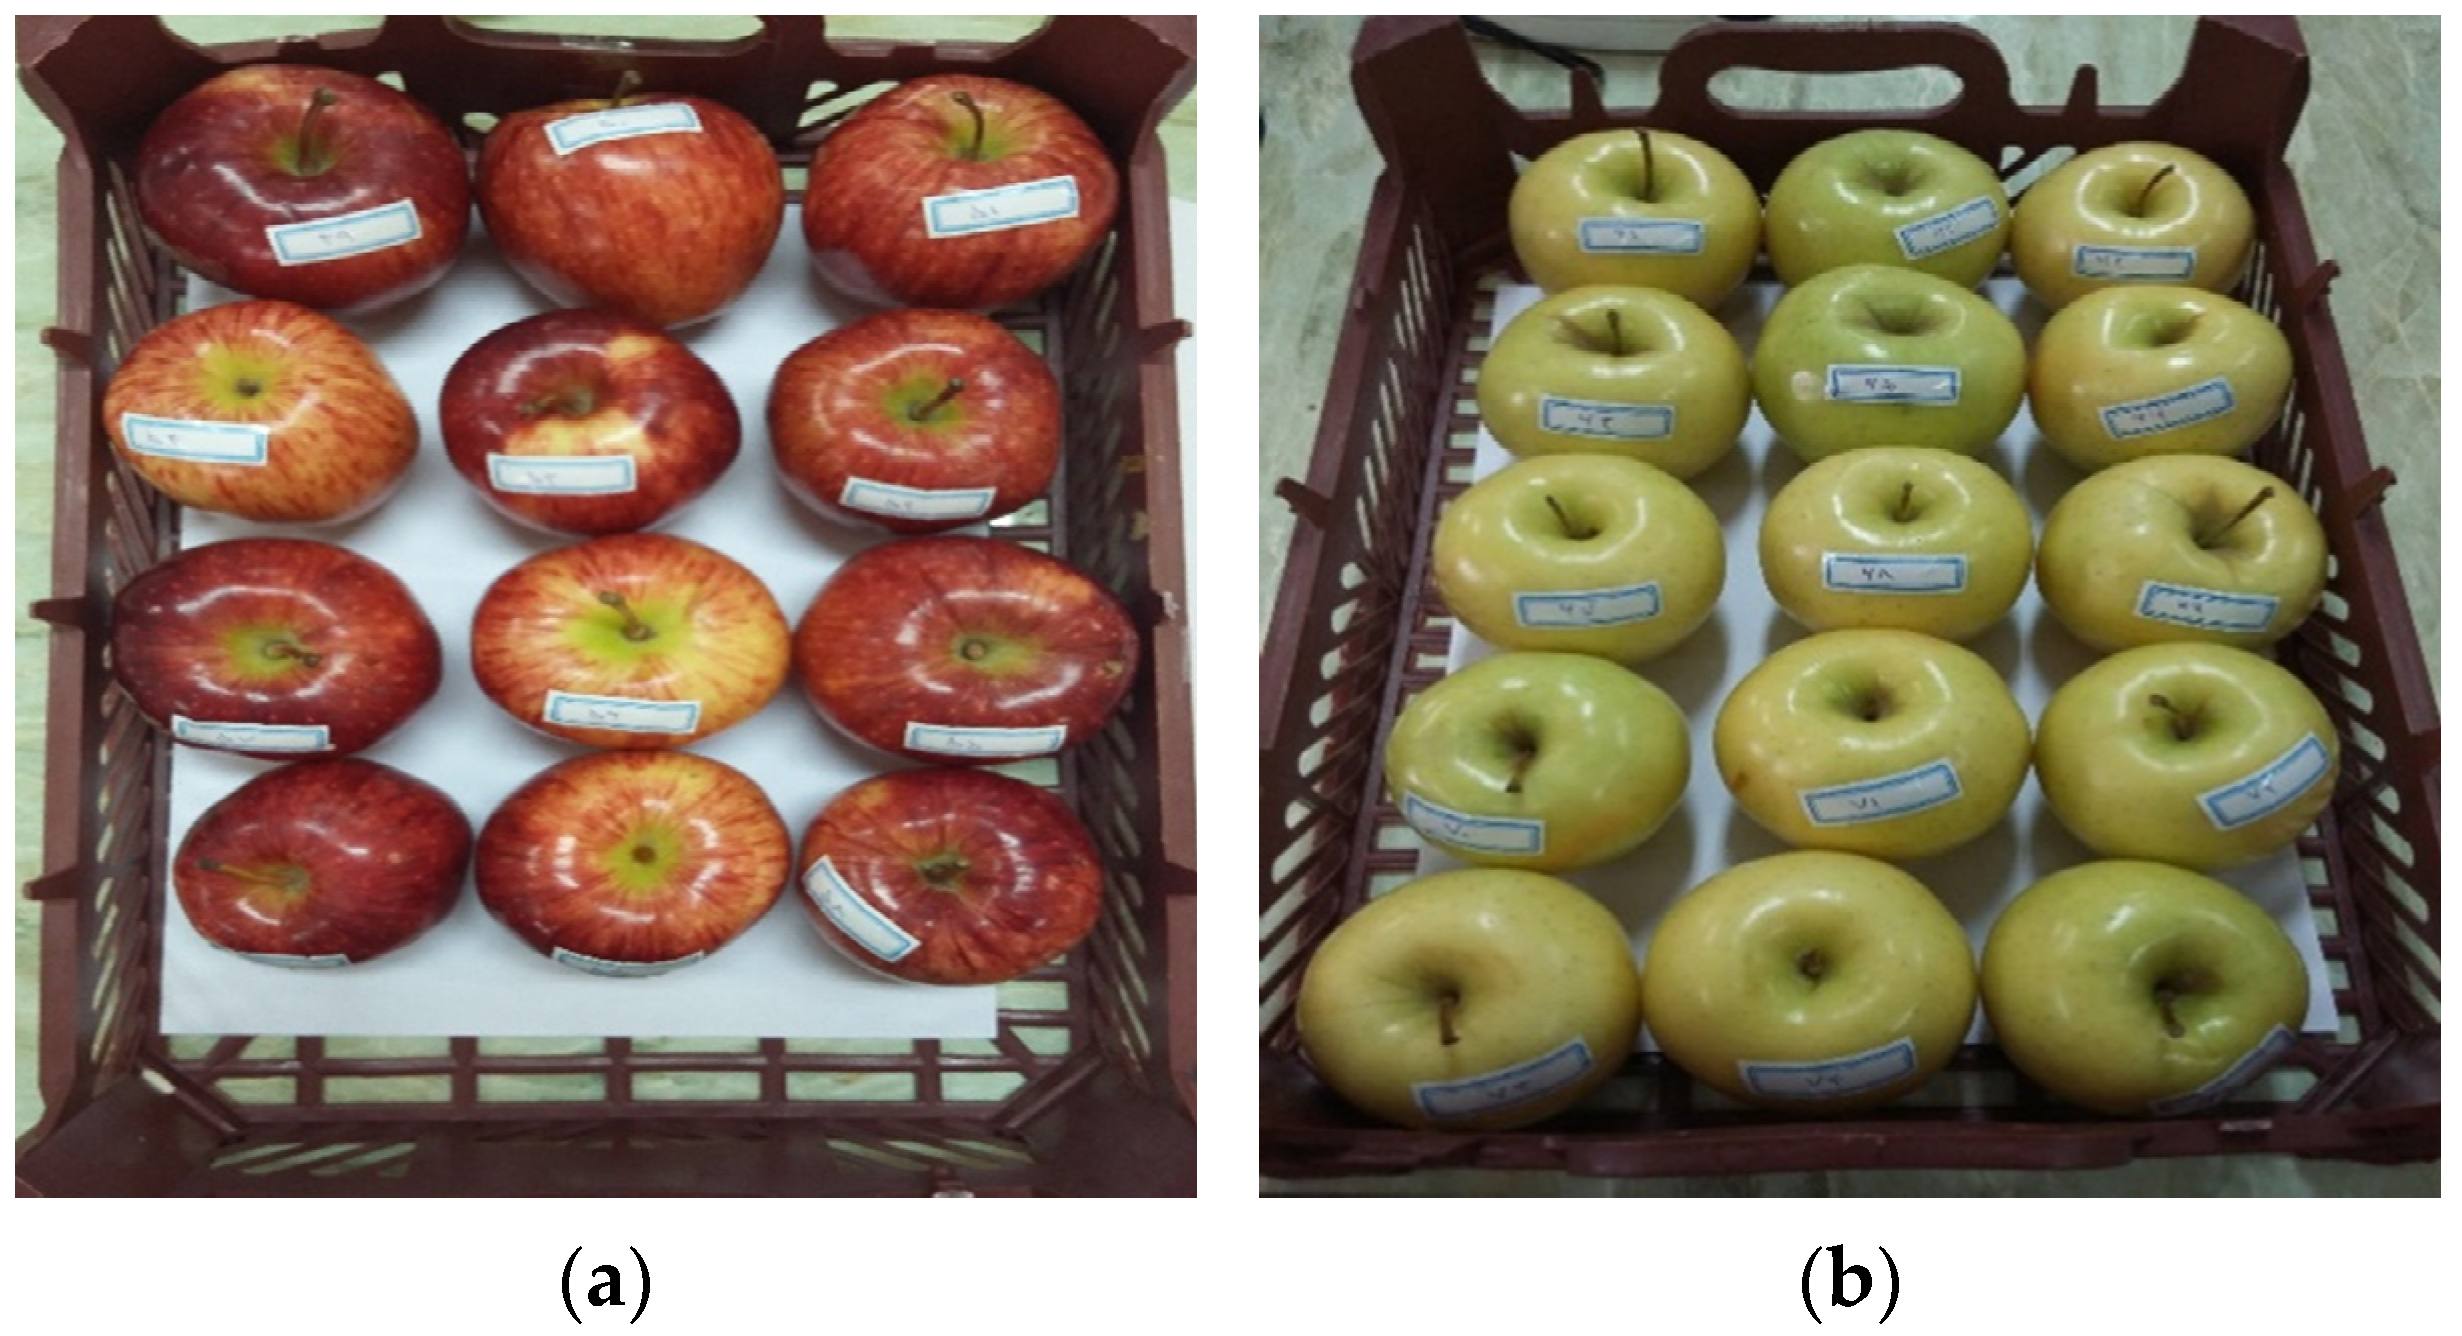
In this study, 120 samples of apples, including 60 samples of Red Delicious apples and 60 samples of Golden Delicious apples, were randomly selected from the fruits of a garden in Ardabil (Figure 1); almost all products in terms of size and appearance were uniform and without damage, crushing, disease, etc. The apples were then transferred directly to the laboratory of the University of Mohaghegh, Ardabili. Before the tests, the samples were exposed to ambient temperature for 2 h to reach an ambient temperature. No preparation was performed on the samples, which is one of the advantages of spectral imaging.

2.2. Hyperspectral Camera

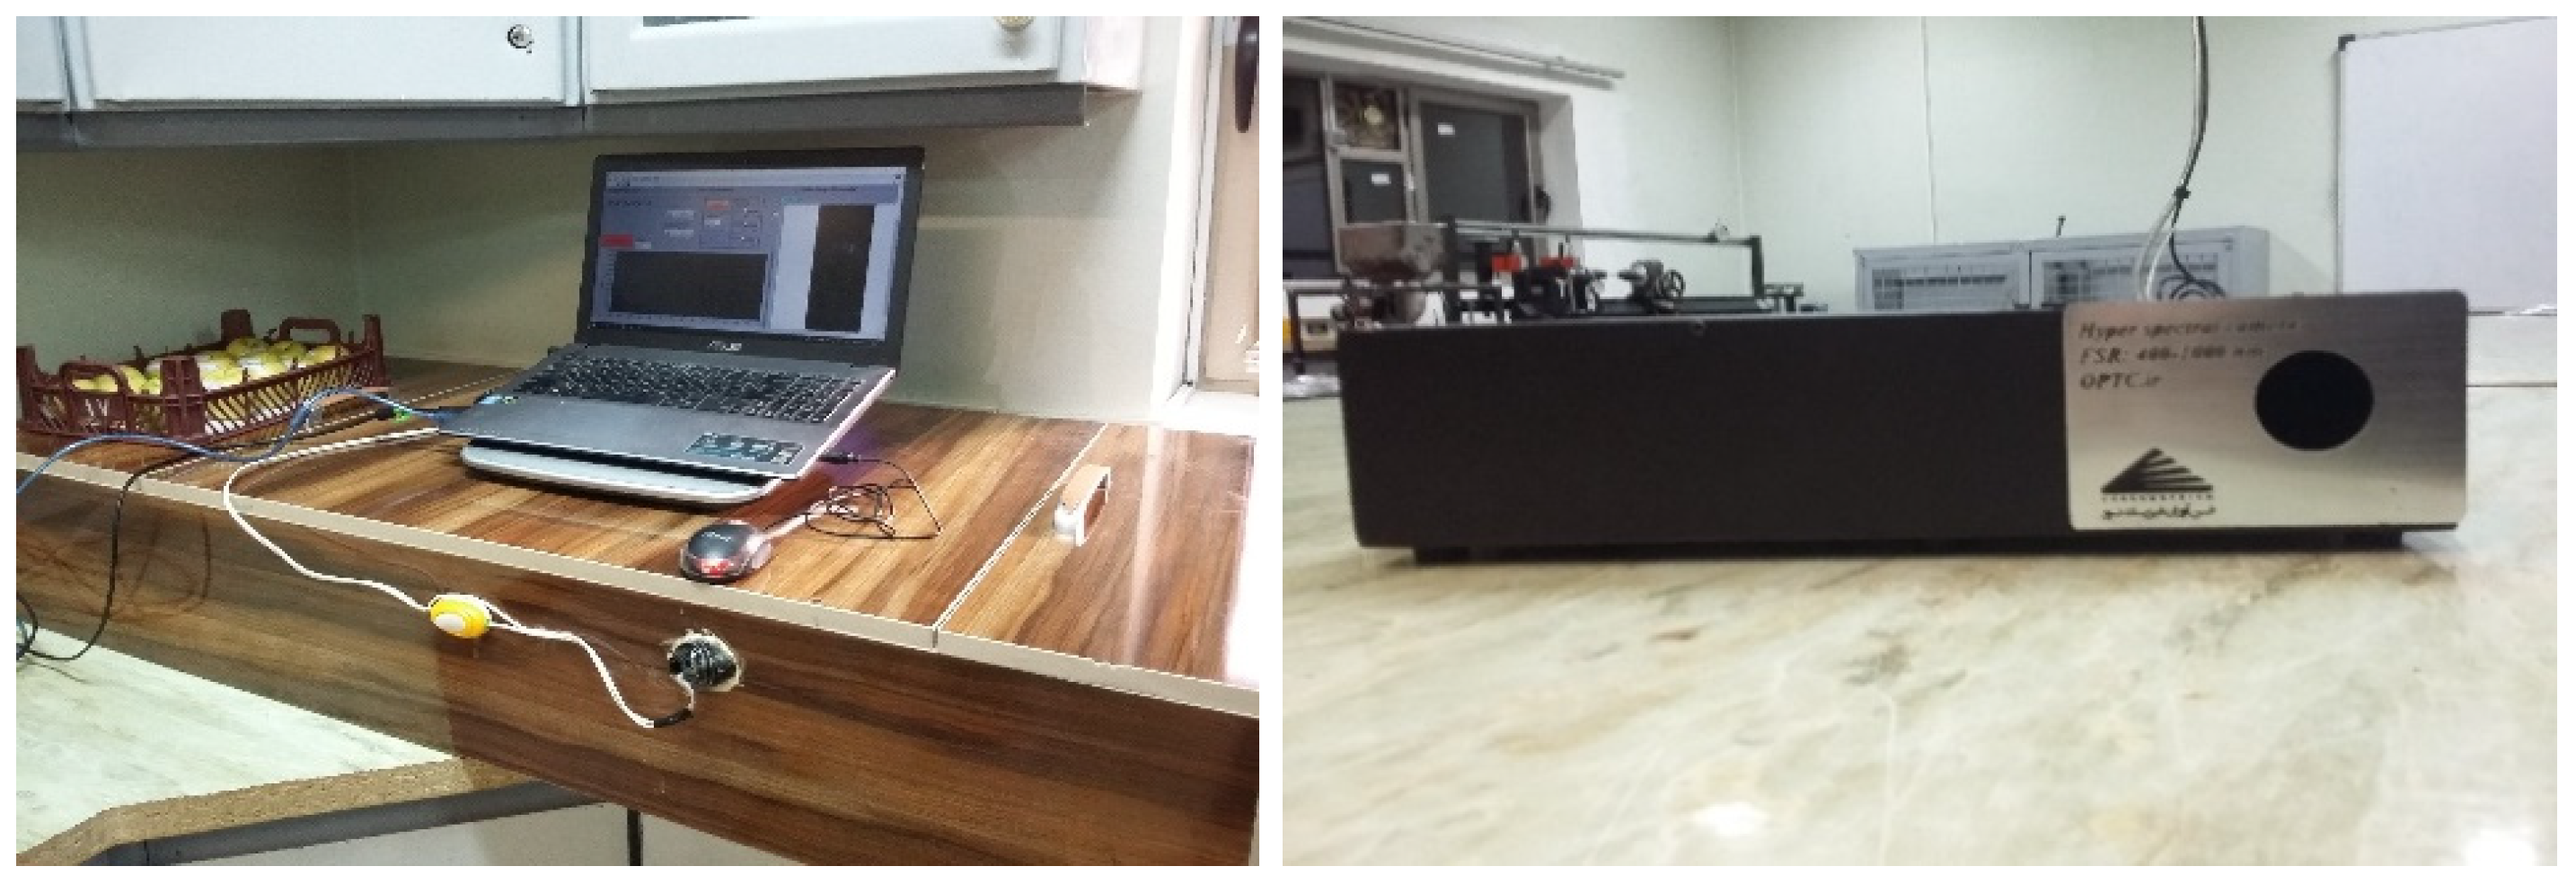
Hyperspectral imaging was performed with a hyperspectral camera (FSR, Optical Physics Technologists, Tehran, Iran) in the range of 400 to 1100 nm with a CCD detector. First, after installing special software for hyperspectral imaging and connecting the camera to a PC, the camera was placed in an MDF box. The light source of the chamber was a 10 watt tungsten halogen bulb (StellarNet, Tampa, FL, USA). The hyperspectral camera was located on the left side of the chamber, and the specimens were located 1 m in front of the camera. In the next step, photographs were taken from both sides of each sample (Figure 2).

2.3. Reference Measurements

After the spectroscopic tests, the quality characteristics of apple fruit were measured for each sample, separately. These quality characteristics that affect the taste and aroma of ripening fruit were: pH, titratable acidity (TA), soluble solids content (SSC) and total phenol (TP).

2.3.1. pH Measurement

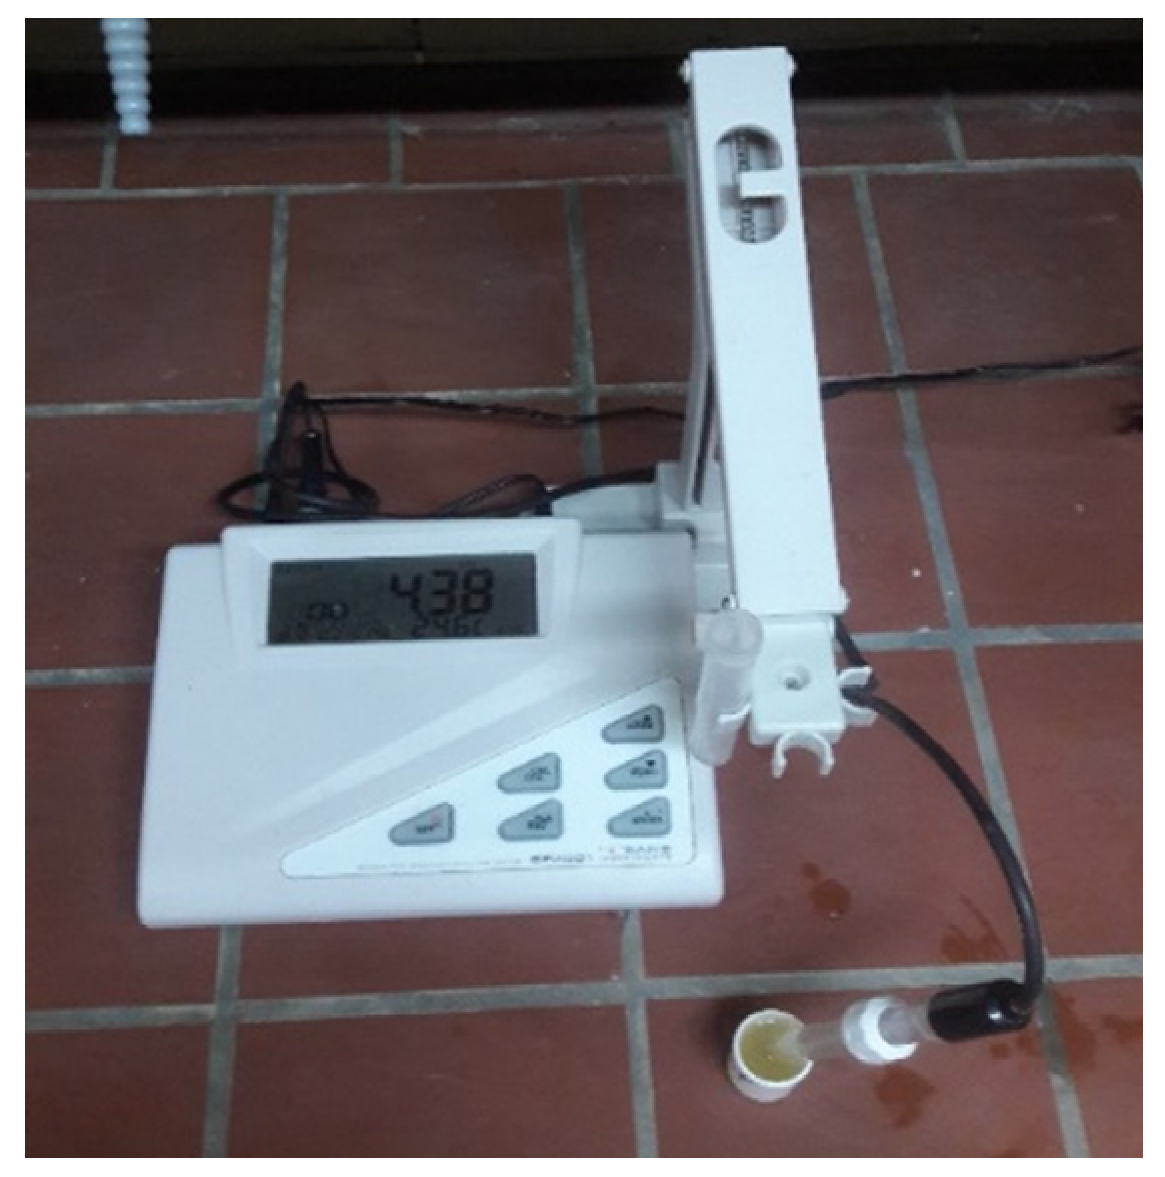
In order to measure the pH of the sample extracts, a digital pH meter of model-inolab 7110 was used (Figure 3).

2.3.2. Measurable Titratable Acidity (TA)

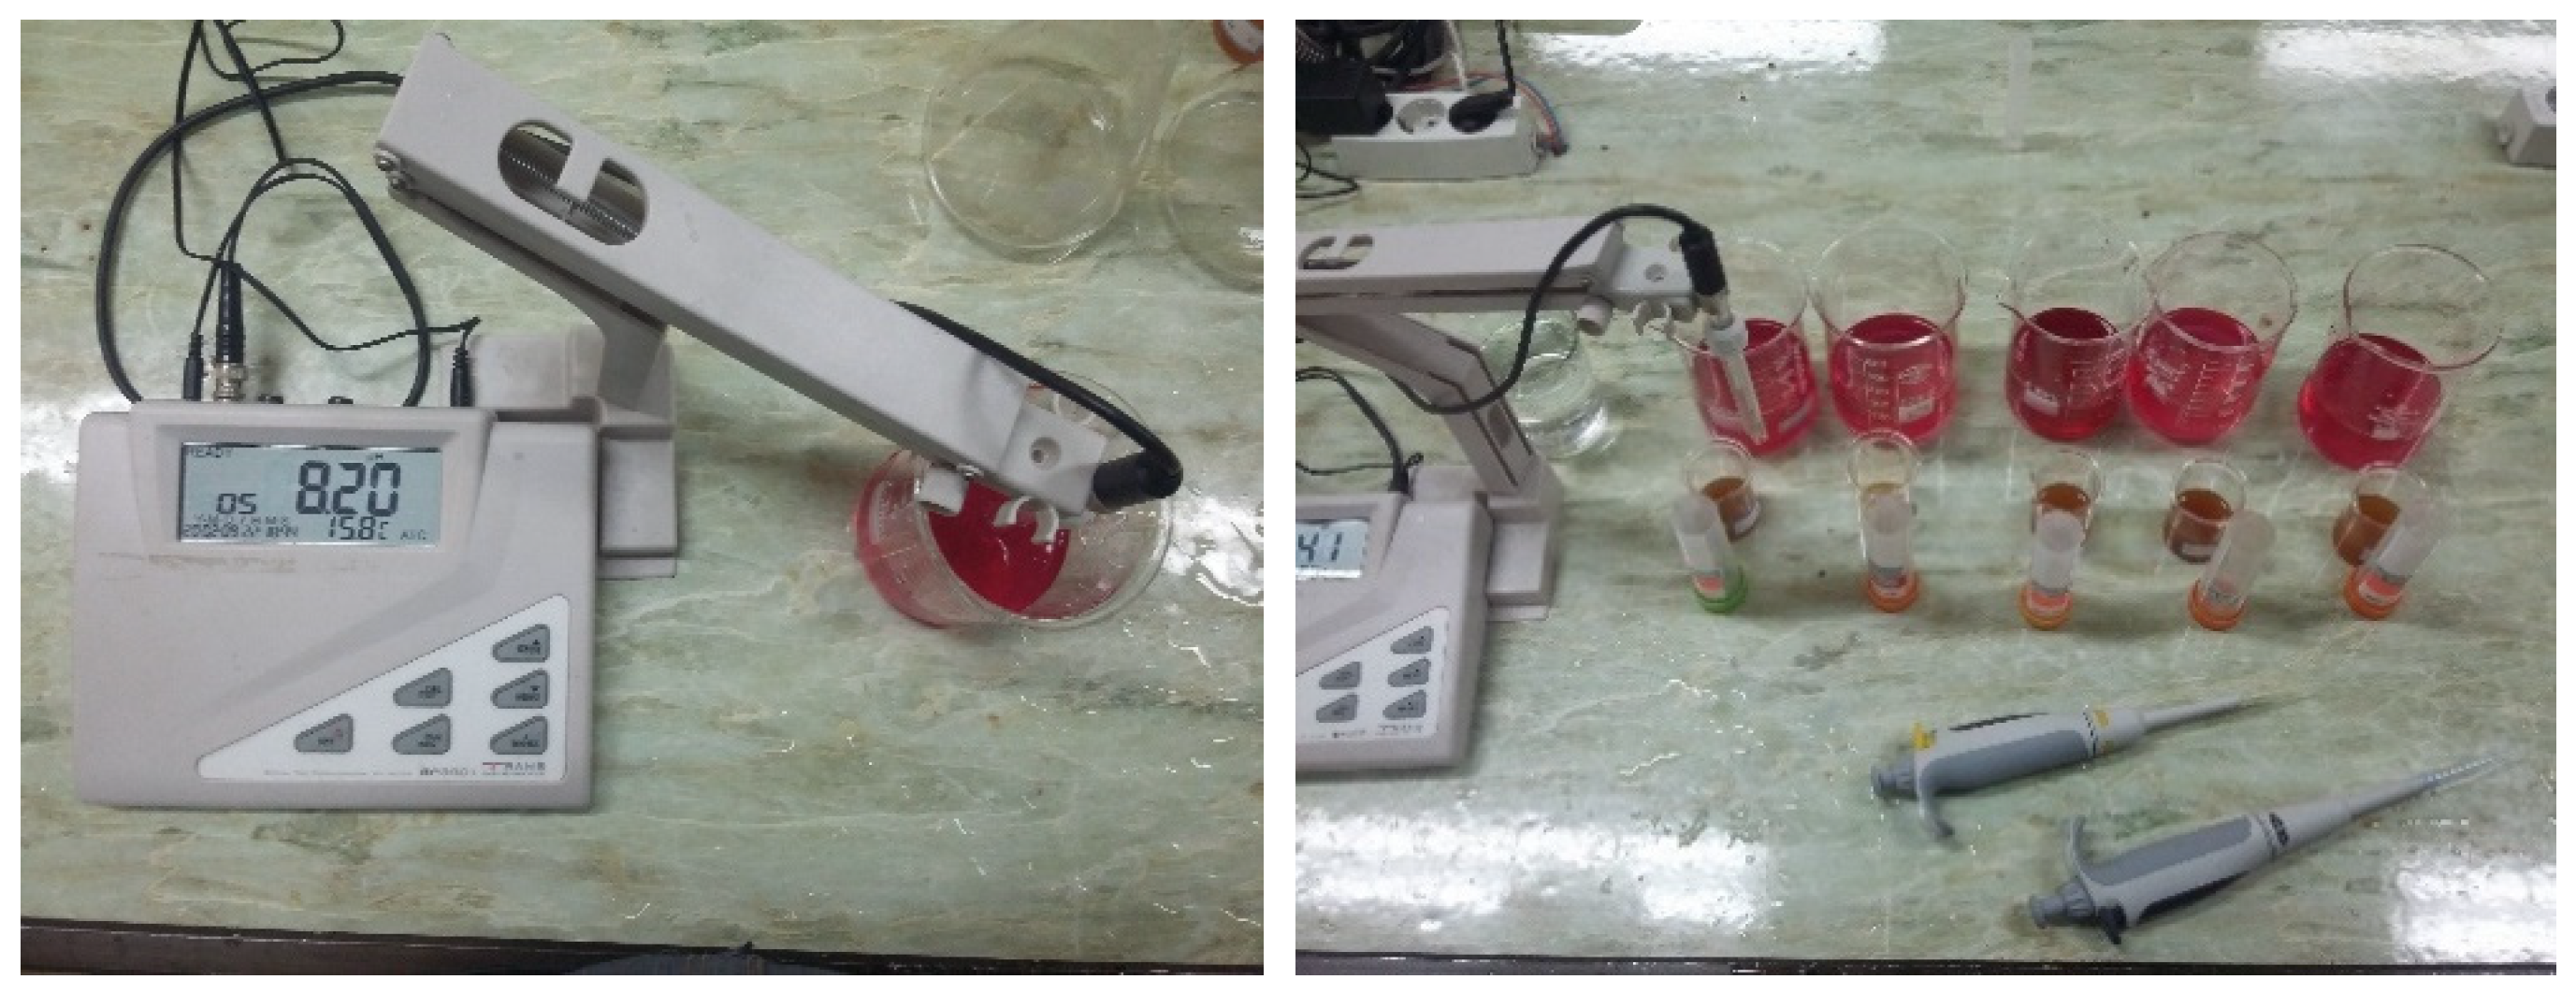
In order to calculate the titratable acidity the method of Jalili Marandi et al., 2004 [11] was used (Figure 4), and the amount of titratable acidity was calculated in terms of the percentage of malic acid (dominant acid of apple) according to the Equation (1):
T A = mL ( NaOH ) × N ( NaOH ) × a c i d m e q . f a c t o r m l j u i c e × 100
where mL (NaOH) is the volume of soda consumed (mL), N (NaOH) is the normality of soda, mljuice is the volume of the extract (mL). acidmeq factor was calculated based on the dominant organic acid of each fruit.

2.3.3. Measurement of Soluble Solids Content (SSC)

To measure the SSC, a manual refractometer model PAL-1 made by the ATAGO company in Japan, with an accuracy of 0.1 degrees Brix, was used (Figure 5) [12].

2.3.4. Measurement of Total Phenol (TP)

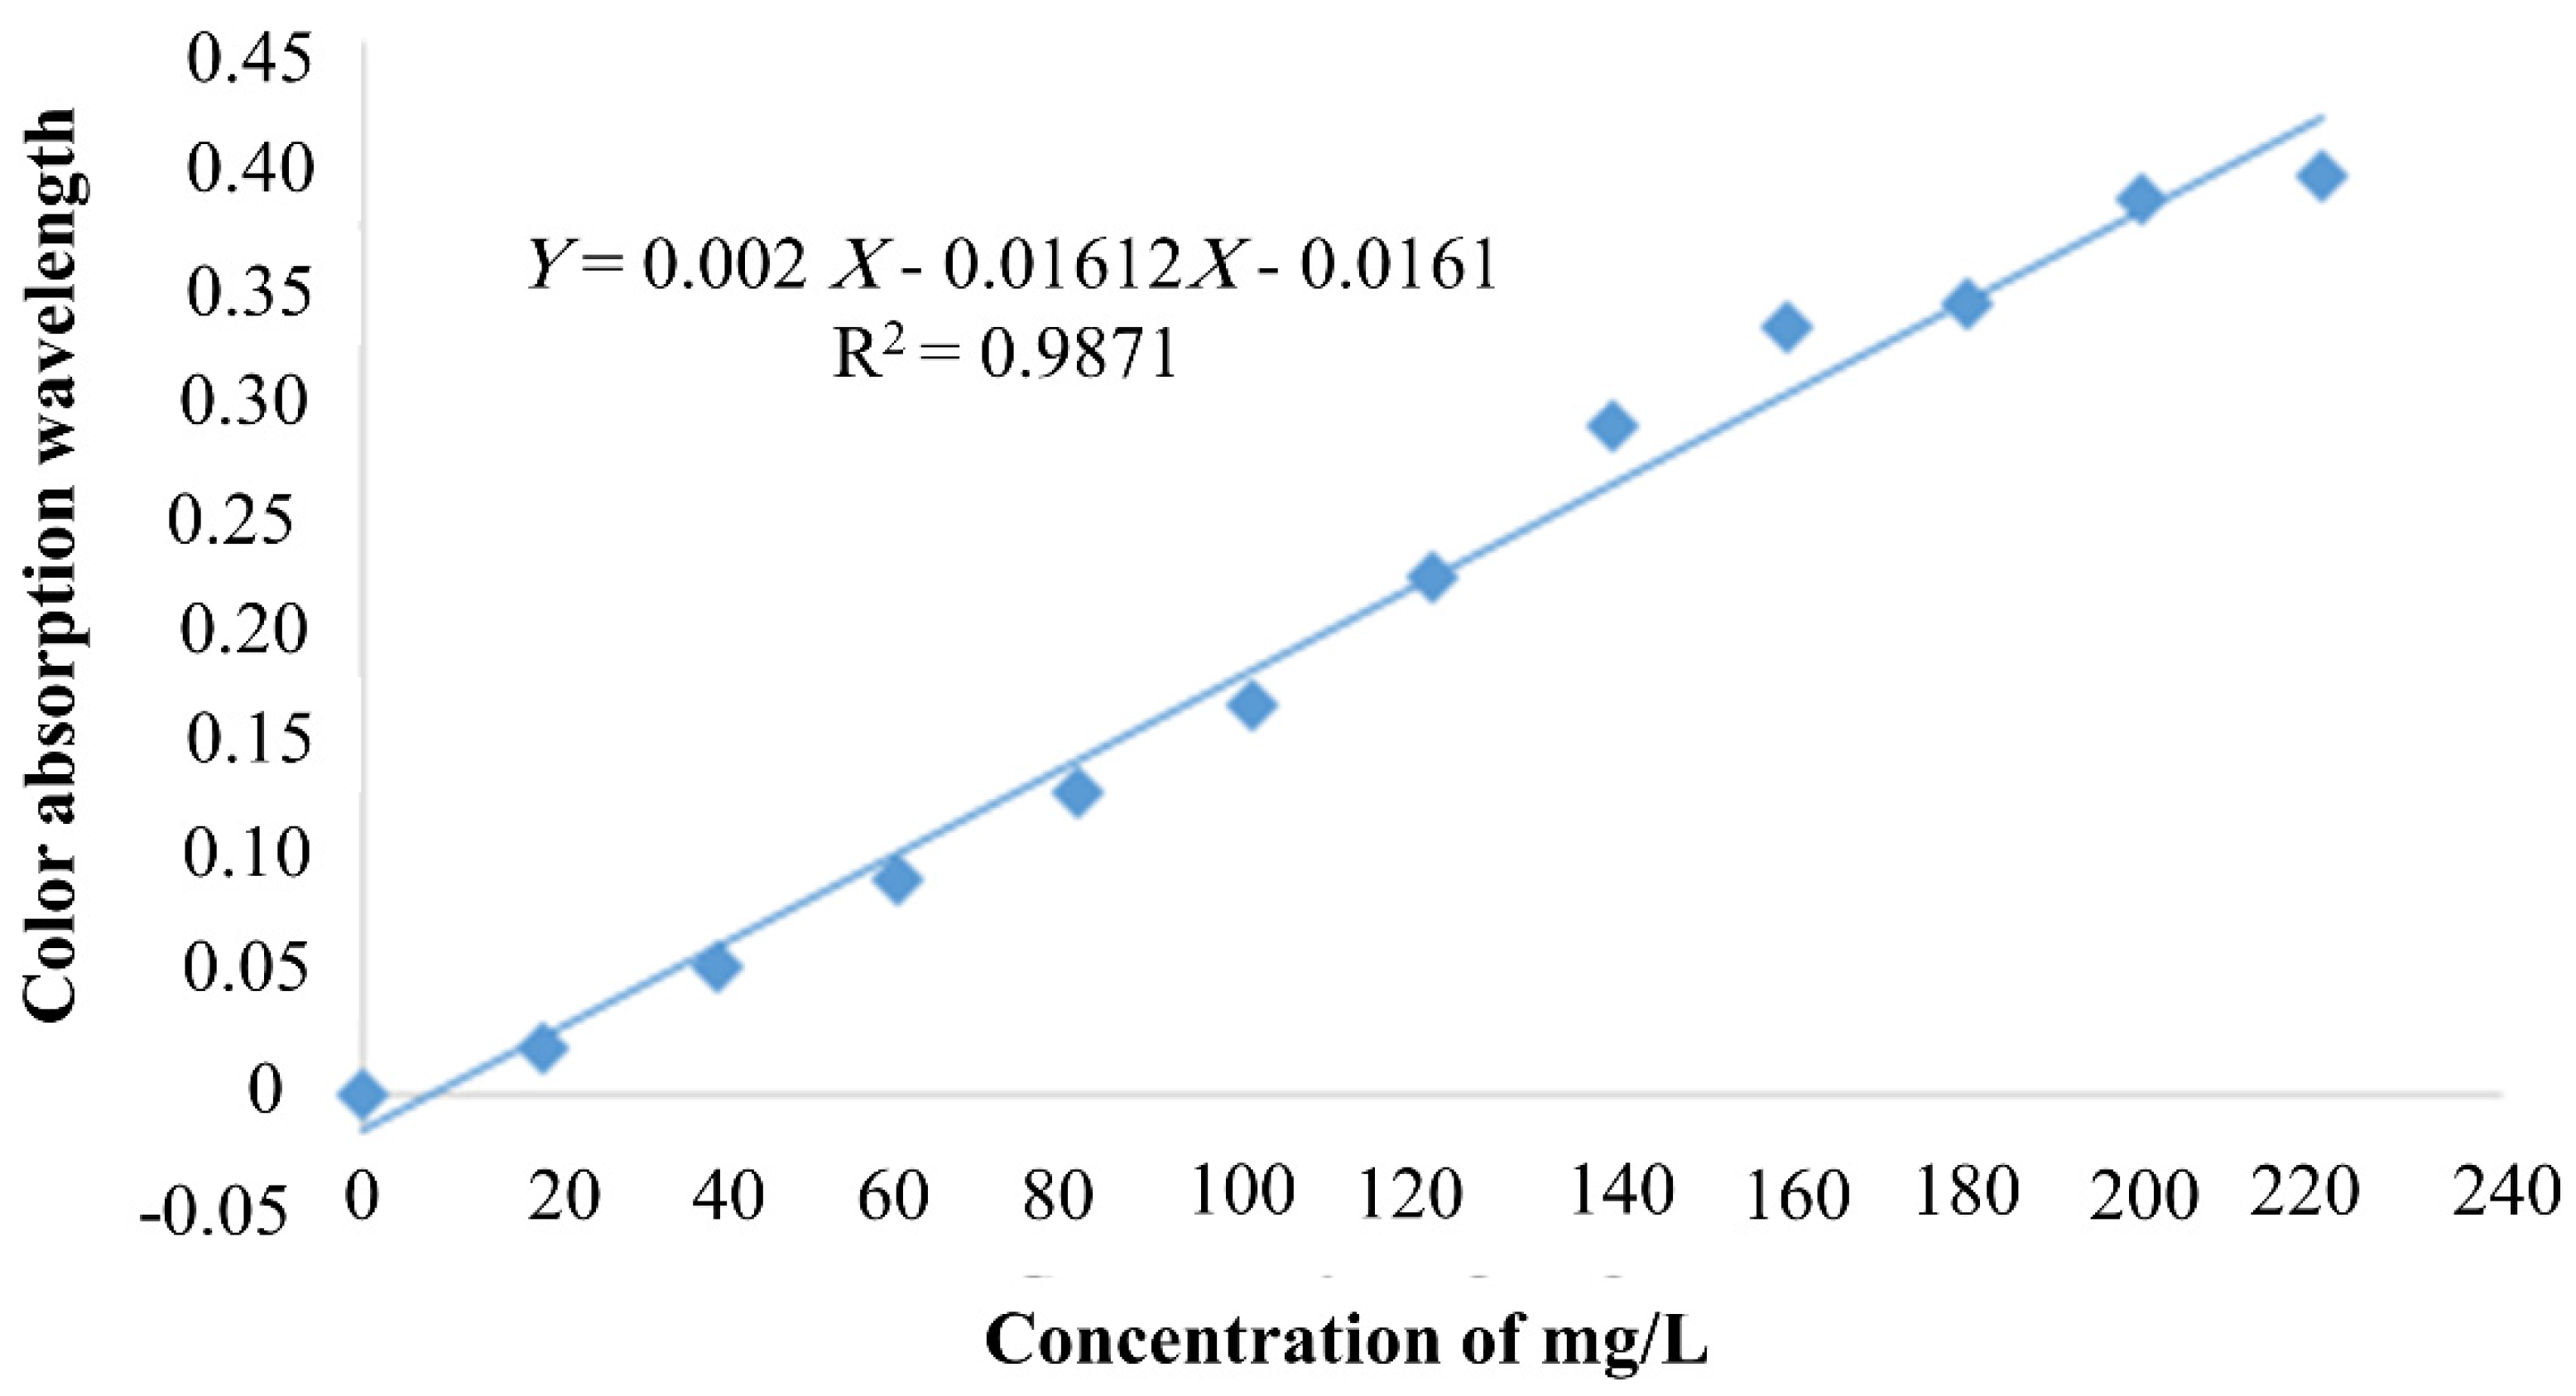
To evaluate the total phenol, the standard method of Du et al., 2009, was used [13]. To measure it, the model spectrophotometer (Termo One C-Termo scientific-America) (Figure 6) was used, and the amount of total phenol was calculated by plotting the standard curve of gallic acid (Figure 7) according to Equation (2) [14].
Y = 0.002 X 0.01612 X 0.0161
where Y is the amount of adsorption read in the sample and X is the amount of total phenol (mg/L).

2.4. Model Development

2.4.1. Preparation and Pre-Processing of Spectra

After storing the spectra and transferring them to Excel software, the spectra related to the spectral imaging of each sample were averaged and considered as the index spectrum of that sample. The initial and final wavelengths of the spectra were eliminated due to the presence of a lot of noise in these areas, and finally the spectral range of 450–4000 nm was used.
Spectral data are affected by factors, such as the effect of light scattering, changes in the sample size, the surface roughness of the sample, noise caused by rising spectrometer temperatures and many other factors. This unwanted information affects useful information and can reduce the accuracy of calibration models. Therefore, spectral data processing is required to reduce the effects of this useless information and to achieve stable, accurate and reliable calibration models. There are different pre-processing methods, each of which is used for a specific purpose. Choosing the right pre-processing method is experimental and is a trial and error of different pre-processing. Therefore, it is not possible to apply a specific prediction to all models of predicting different parameters in different samples [15].
In this study, different pre-processing smoothing and noise reduction, normalization and increasing of spectral resolution and combinations of these preprocessors were used.
The software used in this research was The Unscrambler X 10.4 (CAMO Software AS, Oslo, Norway).
This software is a powerful tool in the field of multivariate data analysis, with features including powerful multivariate analysis and data modeling and processing.

2.4.2. Validation of Developed Models and Selection of the Best Model

After developing the PLS models, the ability of the developed models to predict the quality parameters of apples should be evaluated, and the so-called models should be validated. Therefore, after compiling the calibration models with the training category samples and measuring their ability to establish the relationship between the spectral data and the desired parameter, the test group samples were used to evaluate the prediction accuracy of the developed calibration models. Data were randomly divided into two categories: calibration set (70%) and forecast set (30%). For this purpose, the desired parameters such as root mean square error of calibration (RMSEC) and root mean square error of prediction (RMSEP), based on Equations (3) and (4), were obtained [16]:
R M S E C = i = 1 n c ( y i y ^ i ) 2 n c
R M S E P = i = 1 n p ( y i y ^ i ) 2 n p
In these equations,
  • yi = measured value of attribute for the ith sample in training or test category;
  • y ^ i = predicted value of attribute for the ith sample in training or test category;
  • nc = the number of training category samples; and
  • np = the number of test category samples
Furthermore, the correlation coefficient of calibration (rc) and the correlation coefficient of prediction (rp) were calculated, based on Equations (5) and (6) [17]:
r c = i = 1 n c ( y i y ^ i ) 2 i = 1 n c ( y m y ^ i )
r p = i = 1 n p ( y i y ^ i ) 2 i = 1 n p ( y m y ^ i )
where,
ym = The average measured values of attributes in the training or test category
In the leave one out cross validation method, one sample is taken out of the sample set and the rest of the samples are used to create the calibration model. Then, using the model, the desired parameter for the removed single sample is predicted and the error rate is obtained. This was repeated for all samples, and finally, the root-mean-square error of cross validation (RMSECV) and the cross-correlation coefficient (rcv) were calculated to validate the models, according to Equations (7) and (8):
R M S E C V = i = 1 n ( y ¯ i y i ) 2 n
r c v = i = 1 n ( y i y ¯ i ) 2 i = 1 n ( y m y ¯ i )
In these equations,
  • n = the number of samples in the calibration category;
  • yi = the measured value of the desired attribute;
  • y ¯ i = the estimated value for the ith sample when the model without the ith sample is constructed.
In addition to these indicators, the standard deviation ratio of the studied feature to the root mean square error was also used based on Equation (9) to evaluate the developed models [16].
S D R = S D R M S E P
where,
  • RMSEP = the root mean square error of prediction;
  • SD = the standard deviation of the examined trait;
  • SDR = the standard deviation ratio
Among the mentioned indicators, the SDR had the ability to evaluate the developed models better than the other two indicators. If the value of the SDR index was between 1.5 and 2, it meant that the developed model could distinguish the low values of the desired attribute from the high values (average accuracy). A value between 2 and 2.5 for this index indicated that the desired trait was predicted with acceptable accuracy. The high accuracy of the model in predicting the desired trait as achieved when the SDR was above 2.5 [16].
In this study, the appropriate selection of the number of latent components or variables, and the selection of the appropriate combination of pre-processing to predict the desired trait, was based on having a low RMSEC and a high Rc and SDR.

2.5. Artificial Neural Network

Artificial neural networks are used for the detection, classification, and prediction of problems in which relationships are typically non-linear. An artificial neural network consists of interconnected networks of processing units, based on the structure of the human brain.
After the regularization or training of the neural network, applying a specific input to it will receive a specific response. The network is adapted based on the matching between the input and the target until the output of the network and the target are matched. Many of these input and output pairs are often used to train the network in this process, called supervised learning.

2.5.1. Training Methods in Artificial Neural Networks

There are different training algorithms for training neural networks. The Levenberg—Marquardt (LM) algorithm and the Bayesian regularization algorithm (BR) were selected for use in the present study due to their faster convergence in the training of medium-sized networks. The back propagation algorithm changed the network weights and bias values in such a way that the performance function decreases more rapidly. MATLAB 2019 software was used to develop the desired network, and its results are presented in the next section [18].
First, the relevant data were prepared from the results of the hyperspectral imaging, and then the data were processed, calculated and matrixed. To determine the best pattern of network input, various factors that may have been contributing to the phenomenon had to be considered. In this study, according to the influencing factors in the studied spectroscopy, 325 network inputs were considered, which included all of our data. The number of hidden layers should be as small as possible. It has been proven that each function can be approximated with a maximum of three hidden layers. For this, the network is trained with a hidden layer so that in case of improper operation, the number of hidden layers will increase [19]. In this study, two hidden layers were used.

2.5.2. Network Performance Evaluation

Finally, in order to check and test the validity of the networks, their performances were evaluated. The following two methods were used to evaluate network performance:
1. Linear correlation coefficient (R2)
The square of the linear correlation coefficient, R2, which determines the degree of correlation between two variables (computational data and observational data), is called the linear correlation coefficient.
R 2 = 1 n ( c a l c a v g . o b s ) 2 1 n ( o b s a v g . o b s ) 2
  • avg.obs: the average observational data
  • n: the total number of pairs of observational and computational data
  • obs: observational data
  • calc: computational data corresponding to observational data
  • The ideal value of R2 is 1.
2. Mean squared error (MSE)
M S E = 1 n ( o b s c a l c ) 2 N
N = the number of data
The ideal value for the MSE criterion is 0.

3. Results and Discussions

3.1. Morphological Characteristics

Qualitative specifications and parameters, including weight, diameter, pH, soluble solids content (SSC), titratable acid (TA) and total phenol (TP) of Golden and Red Delicious apples, will be provided (Table 1 and Table 2). Then, the effect of different pre-processing methods on the spectra was investigated. Finally, using the PLS regression analysis and modeling between qualitative indicators and spectral data, the modeling results for each of the indicators were interpreted and compared to determine the optimal model.

3.2. Multivariate Regression Modeling

In this section, the best pre-processing method among the available pre-processing methods for each trait was predicted, by calculating parameters such as RMSEC, Rc and SDR and comparing the results of the best models. It should be noted that models should be selected that have the lowest value of RMSEC and the highest Rc and SDR, to predict the desired trait in a smaller number of main components. Also, the RMSECV versus LVs diagram was drawn for each cultivar and each trait in the best pre-processing method to determine how to select the optimal number of LVs (latent variables).

3.3. Detection of pH

The results of the calibration and validation of the PLS models, based on the combination of different pre-processing methods of hyperspectral imaging spectra to predict the pH of Red and Golden Delicious apples, are presented in Table 3.
The results presented for hyperspectral imaging in Table 3 (and Figure S1 in Supplementary Materials) show that the best model developed to predict the pH of the Red Delicious apples was obtained from SNV pre-processing with RMSEC = 0.00765, rc = 0.9919 and SDR = 2.51. For the Golden Delicious, the best pH prediction with acceptable accuracy was related to the 1st Derivatives (RMSEC = 0.00425, rc = 0.9989, SDR = 1.43).
The graph of model error changes against the number of main components of hyperspectral imaging (in Figure S2 in Supplementary Materials) shows that, for the Red Delicious apples in the number of LVs = 8, RMSECV is 0.0068, and in Golden Delicious apples in LVs = 9, RMSECV = 0.0017. Increasing the number of principal components after the optimal principal component leads to the over fitting and increasing of the model error.
In the study of Weng et al. (2020), pH was considered as a key parameter for strawberry quality. In this study, hyperspectral reflectance imaging in the range of 400 to 1000 nm was used to develop non-destructive detection methods, by integrating different multivariate methods as a partial least squares regression (PLSR). They found that through spectral properties, the best prediction for pH by LWR is Rp2 = 0.8493 and RMSEP = 0.0501, which is consistent with the findings of our study.

3.4. Detection of Titratable Acidity (TA)

Table 4 shows the calibration and prediction results of titratable acid (TA) for Red and Golden Delicious apples, with a PLS model based on the combination of different hyperspectral imaging pre-processing methods, respectively.
The results presented for hyperspectral imaging in Table 4 show that the best model developed for predicting Red Delicious TA was obtained in SNV pre-processing with RMSEC = 0.0034, rc = 0.9939 and SDR = 2.07. In Golden Delicious, the best TA prediction with acceptable accuracy was related to smoothing S.G. and the 2nd derivatives pre-processions, with similar results (RMSEC = 0.00085, rc = 0.9989 and SDR = 2.94).
(Figure S3 in Supplementary Materials) RMSECV diagrams for each of the LVs in hyperspectral imaging show that they had the lowest RMSECV at LVs = 9 in Red Delicious apples and the lowest RMSECV at LVs = 8 for Golden Delicious apples, which provided the best predictive TA index results. Figure S4 in the Supplementary Materials shows the predicted TA values by the best prediction model, based on hyperspectral imaging versus TA measurement values.
On-the-go hyperspectral imaging in the range of 400–1000 nm was performed on grapes in the study of Fernández-Novales et al. (2021). 144 grape clusters were measured for titratable acidity (TA) throughout the experiment, using standard wet chemistry reference methods. Partial least squares regression (PLS) was used to construct the calibration models, cross-validation and prediction of grape-composition parameters. According to their results, the best performance was from the values of external validation coefficients (R2p) of 0.81 for titratable acidity. This study has similar results to the present study.

3.5. Detection of Soluble Solids (SSC)

Table 5 shows the calibration and validation results of the PLS models based on different pre-processing of spectral imaging spectra for the soluble solids (SSC) of Red and Golden Delicious samples.
Based on model validation, the best multivariate regression model in hyperspectral imaging spectroscopy (Table 5 and Figure S5 in the Supplementary Materials) in MSC pre-processing in Red Delicious apples was able to predict the SSC with RMSEC = 0.1765, rc = 0.9909 and SDR = 2.70. LVs = 8 was the best SSC predictor in this sample. According to the results mentioned in the table, the SSC of Golden Delicious with normalized pre-processing was the best model with values of RMSEC = 0.0459, rc = 0.999 and SDR = 2.13, which also had LVs = 8. Figure S6 in the Supplementary Materials shows the RMSECV diagrams in each of the LVs for the best Red and Golden Delicious prediction model based on hyperspectral imaging.
Hyperspectral imaging in the spectral range of 874–1734, along with feature extraction methods to determine the soluble sugar content (SSC) content of ripe strawberries, was used in the study by Ding et al. (2015). Using different models, they showed that all PLS models achieved good results. PLS models using the full spectrum and features extracted by WT obtained the best results, with a calibration correlation coefficient (rc) and a prediction correlation coefficient (rp) of more than 0.9. The overall results showed that hyperspectral imaging combined with feature extraction methods can be used to detect SSC in strawberries.

3.6. Detection of Total Phenol (TP)

The validation results of the PLS calibration models based on the combination of different hyperspectral imaging processors for predicting the total phenol (TP) of Red and Golden Delicious apples are given in Table 6.
Based on the results presented in Table 6, in terms of TP hyperspectral imaging, Red Delicious apples was predictable in normalize pre-processing, and this pre-processing method was able to predict total phenol with RMSEC = 2.3392, rc = 0.9899 and SDR = 1.73. The total phenol of Golden Delicious apples was predicted in the best case of normalize and SNV preprocesses with RMSEC = 1.23845, rc = 0.9989 and SDR = 2.66 (Figure S7 in Supplementary Materials).
The error changes of the models based on the change in the number of principal components for the TP (Figure S8 in Supplementary Materials) show that in hyperspectral imaging, both Red and Golden Delicious apples had the lowest error in the best pre-processing at LVs = 9.
In a study by Nogales-Bueno et al. (2014), hyperspectral images of intact grapes were recorded during ripening using a near-infrared hyperspectral imaging system (900–1700 nm). Spectral data were correlated with the total phenolic concentration of the grape skin by modified partial least squares regression (MPLS), using a number of spectral pretreatments and different calibration sets. The results obtained for the global model of red grape samples were 0.89 mg/g of grape skin for the total phenolic concentration.

3.7. Artificial Neural Network Analysis

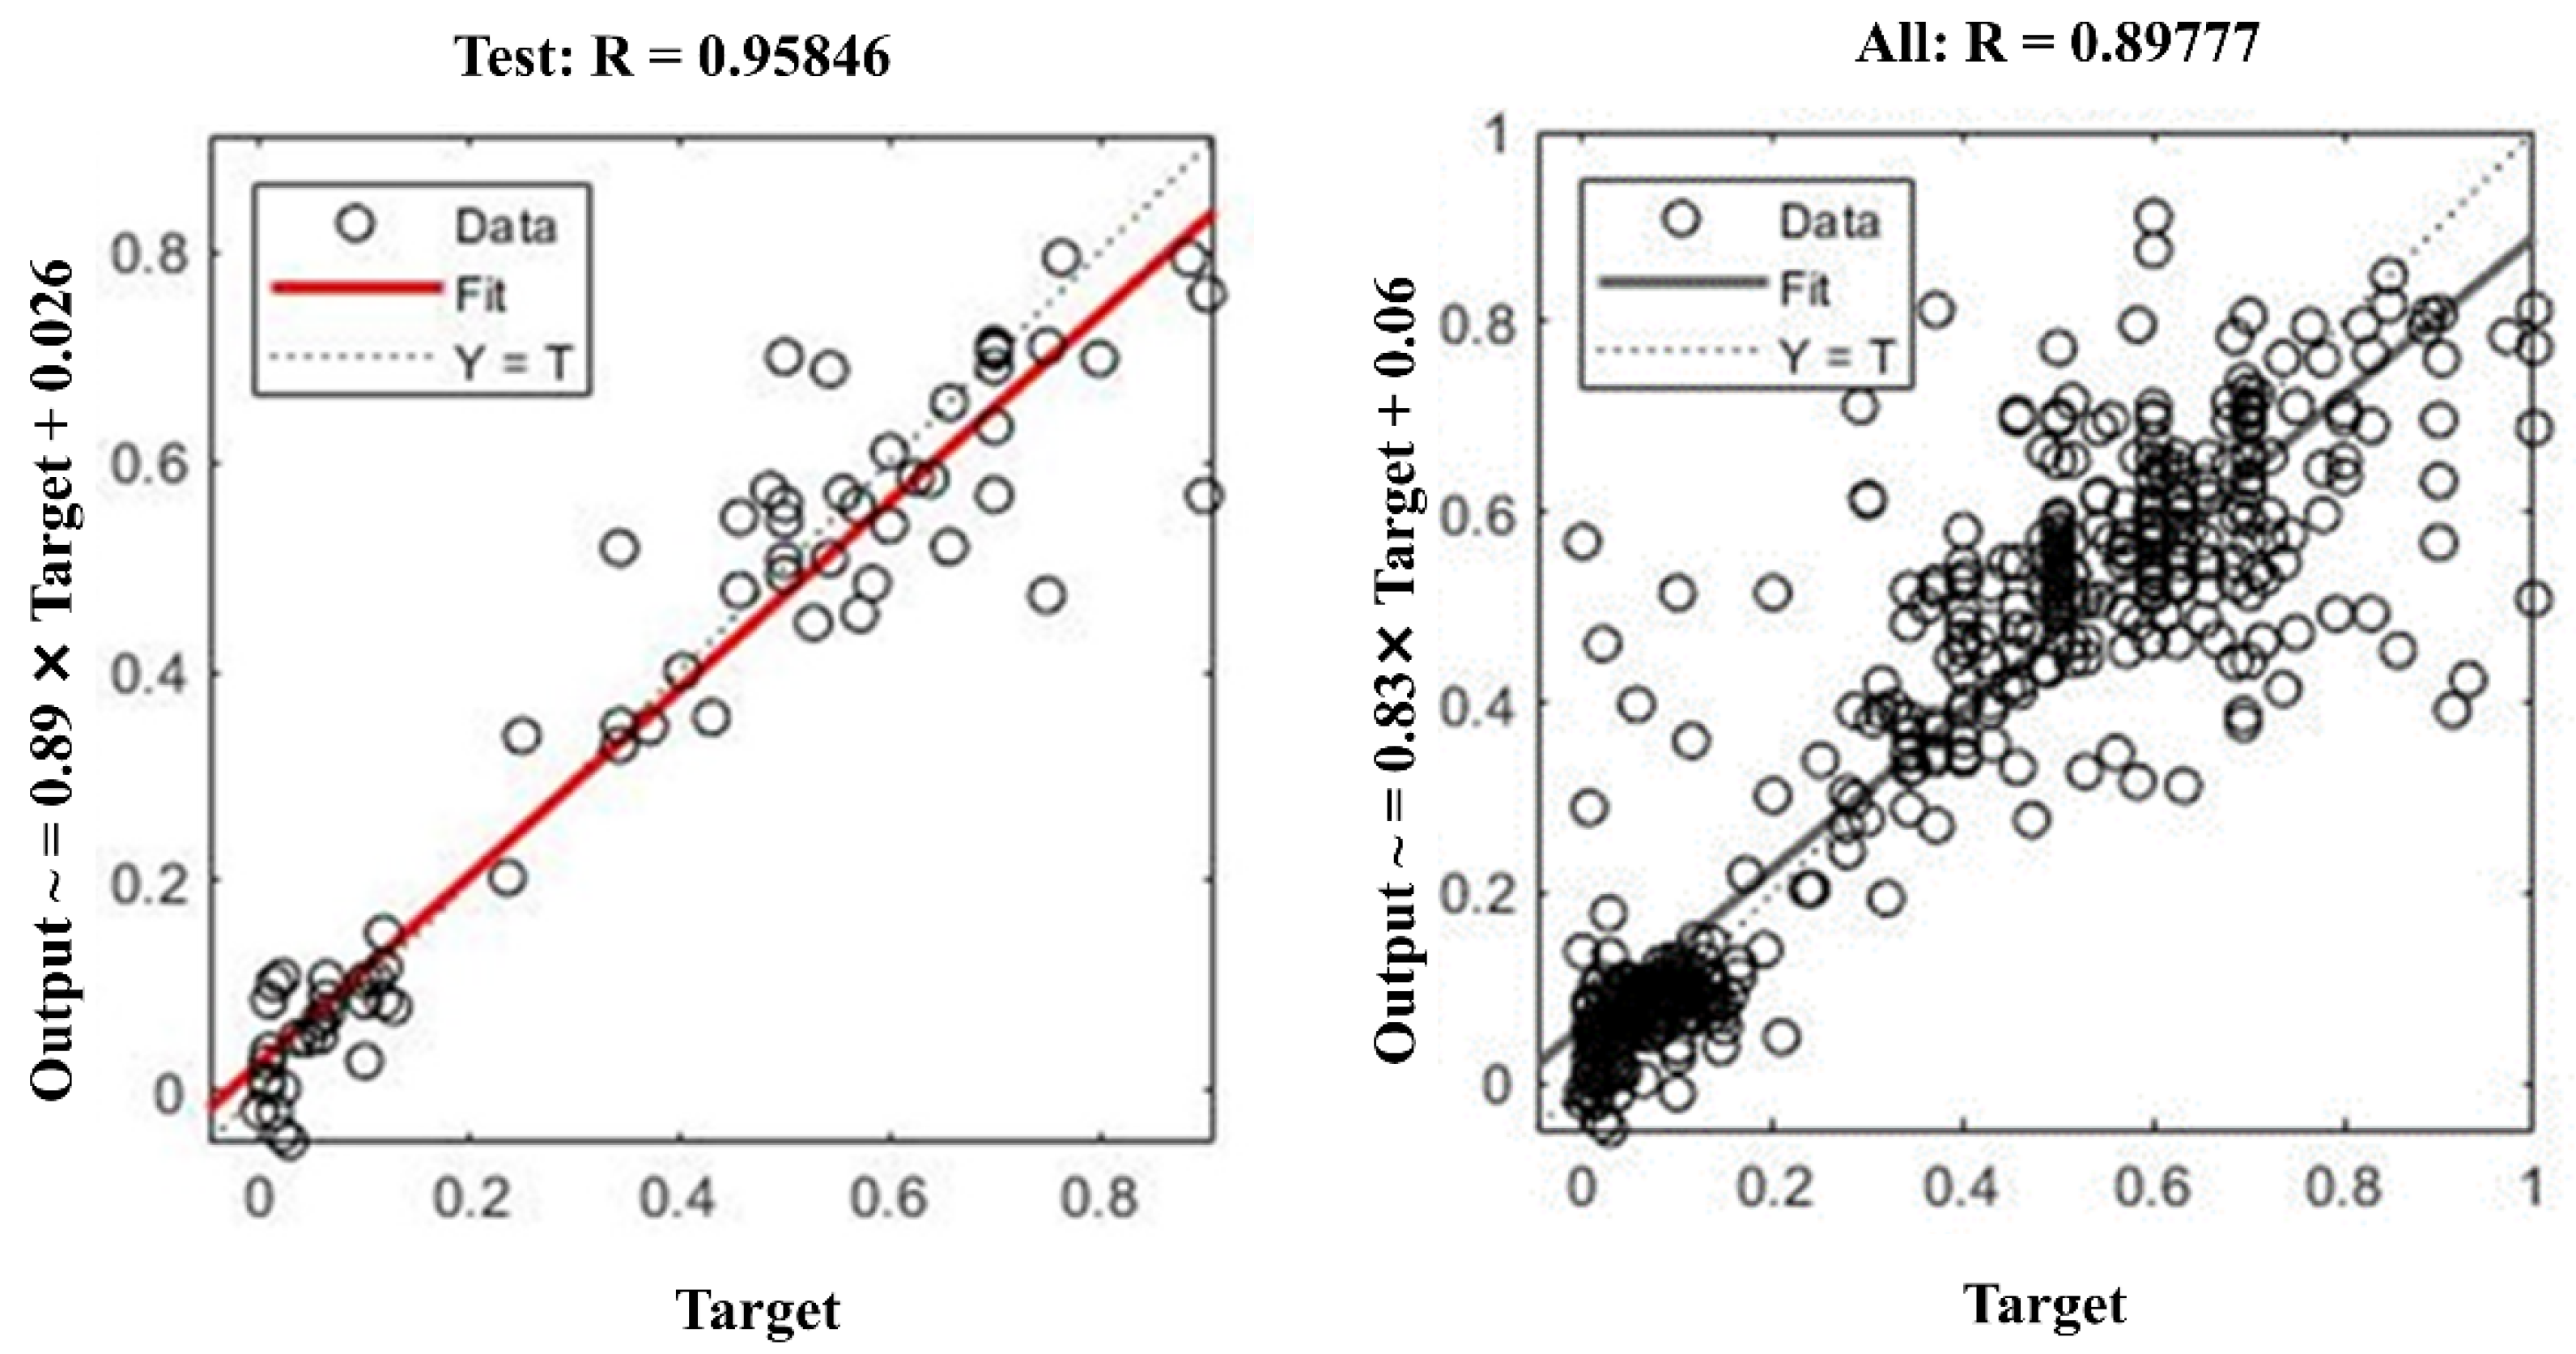
The results of the artificial neural network analysis, according to Table 7 for hyperspectral imaging, also show that the best network mode of feed-forward structure with the LM training algorithm was R = 0.93, Performance = 0.005 and RMSE = 0.03 in 325 inputs, 5 outputs and 2 hidden layers. Figure 8 shows an ANN image constructed to detect the quality properties of apples by hyperspectral imaging, and Figure 9 shows diagrams of the best ANN output for hyperspectral imaging.

4. Conclusions

The results of this study showed that the non-destructive method of hyperspectral imaging in the range of 1000–400 nm has different capabilities in measuring some internal quality characteristics of Red and Golden Delicious apples, and had a high ability to detect indicators. The results were as follows: the best prediction accuracy related to the pH parameter in the hyperspectral imaging method with high accuracy (SDR < 2.5) and low accuracy (SDR > 1.5), respectively, the best prediction accuracy related to the TA parameter in the hyperspectral method for Red and Golden Delicious apples with good accuracy (SDR < 2) and excellent accuracy (SDR < 2.5), respectively, the best prediction accuracy related to the SSC parameter in the hyperspectral method for Red and Golden Delicious apples with excellent accuracy (SDR < 2.5) and good accuracy (SDR < 2), respectively, and the best prediction accuracy related to the TP parameter in the hyperspectral method for Yellow and Red Delicious apples with moderate accuracy (SDR < 1.5) and excellent accuracy (SDR < 2.5), respectively.
In this study, pH parameters, soluble solids, titratable acid and phenol were predicted. These parameters are the main quality characteristics of the fruit and determine the ripening time of the product in order to prevent the loss of the product, and also determine the method of consumption, including market use or shelf-life. In addition, its main application is in exports, which prevents the return of the product due to a lack of quality characteristics.
Supplementary Materials

The following are available online at https://www.mdpi.com/article/10.3390/horticulturae8070598/s1. Figure S1: Predicted pH values with the best models developed against its measured values (a) for Red Delicious (b) Golden Delicious in hyperspectral imaging; Figure S2: RMSECV versus LVs changes to predict pH for best preprocessing (SNV) for red (a) and (1stDerivatives) for Golden Delicious (b) in hyperspectral imaging; Figure S3: RMSECV versus LVS changes to predict TA for best preprocessing (SNV) for red and (Smoothing S.G.) for Golden Delicious (b) in hyperspectral imaging; Figure S4: Predicted values of titratable acidity (TA) with the best models developed against its measured values for Red Delicious (a) Golden Delicious (b) in hyperspectral imaging; Figure S5: Predicted values of soluble solids (SSC) with the best models developed against its measured values for Red Delicious (a) Golden Delicious (b) in hyperspectral imaging; Figure S6: Changes in RMSECV versus LVS to predict SSC for best preprocessing (MSC) (a) for Red Delicious and (Normalize) for Golden Delicious (b) in hyperspectral imaging; Figure S7: Predicted values of total phenol (TP) with the best models developed against its measured values for Red Delicious (a) Golden Delicious (b) in hyperspectral imaging; Figure S8: Changes of RMSECV versus LVS to predict TP for best preprocessing (Normalize) (a) for Red Delicious and (Normalize, SNV) for Golden Delicious (b) in spectral imaging.

Author Contributions

Conceptualization, B.H., Y.A.-G. and A.S.-N.; methodology, B.H., Y.A.-G. and A.S.-N.; software, B.H. and A.S.-N.; validation, Y.A.-G., A.S.-N. and J.L.H.-H.; formal analysis, B.H., Y.A.-G. and A.S.-N.; investigation, B.H. and A.S.-N.; resources, B.H., Y.A.-G. and A.S.-N.; data curation, B.H. and A.S.-N.; writing—original draft preparation, B.H. and A.S.-N.; writing—review and editing, Y.A.-G., M.H.-H., I.G.-B. and J.L.H.-H.; visualization, B.H. and A.S.-N.; supervision, Y.A.-G.; project administration, Y.A.-G.; funding acquisition, Y.A.-G., M.H.-H., I.G.-B. and J.L.H.-H.; All authors have read and agreed to the published version of the manuscript.

Funding

This research was funded by University of Mohaghegh Ardabili.

Institutional Review Board Statement

Not applicable.

Informed Consent Statement

Not applicable.

Data Availability Statement

The data presented in this study are available on request from the corresponding author.

Conflicts of Interest

The authors declare no conflict of interest.

References

  1. Abasi, S.; Minaei, S.; Jamshidi, B.; Fathi, D. Dedicated non-destructive devices for food quality measurement: A review. Trends Food Sci. Technol. 2018, 78, 197–205. [Google Scholar] [CrossRef]
  2. Soltani Nazarloo, A.; Rasooli Sharabiani, V.; Abbaspour-Gilandeh, Y.; Taghinezhad, E.; Szymanek, M.; Sprawka, M. Feasibility of using VIS/NIR spectroscopy and multivariate analysis for pesticide residue detection in tomatoes. Processes 2021, 9, 196. [Google Scholar] [CrossRef]
  3. Nazarloo, A.S.; Sharabiani, V.R.; Gilandeh, Y.A.; Taghinezhad, E.; Szymanek, M. Evaluation of different models for non-destructive detection of tomato pesticide residues based on near-infrared spectroscopy. Sensors 2021, 21, 3032. [Google Scholar] [CrossRef] [PubMed]
  4. Abbaspour-Gilandeh, Y.; Sabzi, S.; Hernández-Hernández, M.; Hernández-Hernández, J.L.; Azadshahraki, F. Nondestructive estimation of the chlorophyll b of apple fruit by color and spectral features using different methods of hybrid artificial neural network. Agronomy 2019, 9, 735. [Google Scholar] [CrossRef] [Green Version]
  5. Basati, Z.; Jamshidi, B.; Rasekh, M.; Abbaspour-Gilandeh, Y. Detection of sunn pest-damaged wheat samples using visible/near-infrared spectroscopy based on pattern recognition. Spectrochim. Acta Part A Mol. Biomol. Spectrosc. 2018, 203, 308–314. [Google Scholar] [CrossRef] [PubMed]
  6. Gao, Q.; Wang, P.; Niu, T.; He, D.; Wang, M.; Yang, H.; Zhao, X. Soluble solid content and firmness index assessment and maturity discrimination of Malus micromalus Makino based on near-infrared hyperspectral imaging. Food Chem. 2022, 370, 131013. [Google Scholar] [CrossRef]
  7. Benelli, A.; Cevoli, C.; Ragni, L.; Fabbri, A. In-field and non-destructive monitoring of grapes maturity by hyperspectral imaging. Biosyst. Eng. 2021, 207, 59–67. [Google Scholar] [CrossRef]
  8. Ekramirad, N.; Eyvani, A. Non-destructive detection of codling Moth (Cydia pomonella L.) damage in apple fruit using hyperspectral imaging method. Iran. J. Biosyst. Eng. 2017, 48, 241–249. [Google Scholar]
  9. Zhu, H.; Chu, B.; Fan, Y.; Tao, X.; Yin, W.; He, Y. Hyperspectral imaging for predicting the internal quality of kiwifruits based on variable selection algorithms and chemometric models. Sci. Rep. 2017, 7, 1–13. [Google Scholar]
  10. Mobli, H.; Jamshidi, B.; Azizi, A.; Sharifi, M. Microbial contamination assessment of lettuce using NIR hyperspectral imaging: Case study on Escherichia coli. Iran. J. Biosyst. Eng. 2020, 51, 599–610. [Google Scholar]
  11. Jalili Marandi, R. Postharvest Physiology (Handling and Storage of Fruits, Vegetables and Ornamental Plants); Publishers Jihad Urmia University: Urmia, Iran, 2004; p. 276. [Google Scholar]
  12. Liu, Y.; Sun, X.; Ouyang, A. Nondestructive measurement of soluble solid content of navel orange fruit by visible–NIR spectrometric technique with PLSR and PCA-BPNN. LWT-Food Sci. Technol. 2010, 43, 602–607. [Google Scholar] [CrossRef]
  13. Du, G.; Li, M.; Ma, F.; Liang, D. Antioxidant capacity and the relationship with polyphenol and vitamin C in Actinidia fruits. Food Chem. 2009, 113, 557–562. [Google Scholar] [CrossRef]
  14. Maurya, S.; Singh, D. Quantitative analysis of total phenolic content in Adhatoda vasica Nees extracts. Int. J. Pharm. Tech. Res. 2010, 2, 2403–2406. [Google Scholar]
  15. Rossel, R.A.V. ParLeS: Software for chemometric analysis of spectroscopic data. Chemom. Intell. Lab. Syst. 2008, 90, 72–83. [Google Scholar] [CrossRef]
  16. Nicolai, B.M.; Beullens, K.; Bobelyn, E.; Peirs, A.; Saeys, W.; Theron, K.I.; Lammertyn, J. Nondestructive measurement of fruit and vegetable quality by means of NIR spectroscopy: A review. Postharvest. Biol. Technol. 2007, 46, 99–118. [Google Scholar] [CrossRef]
  17. Liu, Y.; Sun, X.; Zhou, J.; Zhang, H.; Yang, C. Linear and nonlinear multivariate regressions for determination sugar content of intact Gannan navel orange by Vis–NIR diffuse reflectance spectroscopy. Math. Comput. Model. 2010, 51, 1438–1443. [Google Scholar] [CrossRef]
  18. Çolak, A.B. Experimental analysis with specific heat of water-based zirconium oxide nanofluid on the effect of training algorithm on predictive performance of artificial neural network. Heat Transf. Res. 2021, 52, 67–93. [Google Scholar] [CrossRef]
  19. Esfandiari, D.F.; Hosseini, S.A.; Azadi, M.M.; Hejazizadeh, Z. Prediction of monthly average temperature through Artificial Neural Metwork multilayer perceptron (MLP). Geography 2011, 8, 45–65. [Google Scholar]
Figure 1. Test samples: (a) Red Delicious and (b) Golden Delicious.
Horticulturae 08 00598 g001
Figure 2. Hyperspectral imaging of samples.
Horticulturae 08 00598 g002
Figure 3. pH meter.
Figure 3. pH meter.
Horticulturae 08 00598 g003
Figure 4. Method of titration.
Horticulturae 08 00598 g004
Figure 5. Manual refractometer.
Horticulturae 08 00598 g005
Figure 6. Nano spectrophotometer (NanoDrop).
Horticulturae 08 00598 g006
Figure 7. Standard absorption curve of different concentrations of standard galic acid solution.
Horticulturae 08 00598 g007
Figure 8. ANN image structured to detect the quality properties of apples with hyperspectral imaging.
Horticulturae 08 00598 g008
Figure 9. Diagrams of the best ANN result for each hyperspectral imaging mode.
Horticulturae 08 00598 g009aHorticulturae 08 00598 g009b
Table 1. Statistical data of Red Delicious sample.
PropertyNumber of SamplesMinMaxMeanSDCV% 1
Diameter (mm)6060.2282.6269.854.947.07
Weight (gr)60114.99288.74167.2736.1221.59
pH603.383.713.520.072.21
TA (%)600.170.340.240.0417.55
SSC (° Brix)604.0014.009.841.7517.80
TP (mg/L)6043.05128.0584.3920.1923.93
1 Coefficient of variation.
Table 2. Statistical data of Golden Delicious sample.
PropertyNumber of SamplesMinMaxMeanSDCV%
Diameter (mm)6054.572.7363.123.816.03
Weight (gr)6089.15172.84121.2920.4316.85
pH603.063.733.390.1384.06
TA (%)600.100.300.190.03920.61
SSC (° Brix)606.0012.009.111.2914.21
TP (mg/L)6038.05153.0589.3732.9636.88
Table 3. Validation results of PLS models, based on different hyperspectral imaging pre-processing methods for pH of Red Delicious and Golden Delicious cultivars.
CultivarsPre-ProcessingOptimal LVsRcRMSECRcvRMSECVSDR
Red DeliciousNo Pre-Processing90.93690.01610.90090.02632.94
Gaussian Filter90.96290.01610.89180.02802.76
Smoothing S.G90.93690.02040.83880.03402.28
1st Derivatives80.99090.00760.96990.01443.36
2nd Derivatives90.97690.01270.91290.02553.04
Normalize90.97790.01270.92990.02213.51
SNV80.99190.00760.97990.01192.51
MSC90.98390.01100.94890.01871.10
MSC + SNV70.97790.00420.97390.00421.20
Golden DeliciousNo Pre-Processing90.99790.00680.99390.01192.73
Gaussian Filter90.99690.00850.98890.01531.12
Smoothing S.G90.97790.02120.93390.03743.73
1st Derivatives90.99890.00420.99690.00851.43
2nd Derivatives50.99790.00590.99690.00852.43
Normalize90.99890.00590.99590.01023.69
SNV80.99790.00760.99290.01271.95
MSC70.99890.05100.99790.00762.25
MSC + SNV80.99790.00460.99290.01271.95
Table 4. Validation results of PLS models based on different hyperspectral imaging pre-processing methods for TA of Red Delicious and Golden Delicious cultivars.
CultivarsPre-ProcessingOptimal LVsRcRMSECRcvRMSECVSDR
Red DeliciousNo pre-processing90.98590.00510.95390.01022.05
Gaussian Filter90.95890.37140.87280.66891.06
Smoothing S.G90.96490.00850.88480.01612.55
1st Derivatives80.99690.00250.98990.00422.72
2nd Derivatives90.99090.00420.97090.00762.40
Normalize90.99190.00420.97390.00762.40
SNV90.99390.00340.98090.00682.07
MSC90.99390.00340.97990.00682.07
MSC + SNV90.99090.00420.97090.0092.59
Golden DeliciousNo pre-processing90.99790.00170.99190.00342.97
Gaussian Filter90.99390.00220.97990.00592.84
Smoothing S.G80.99890.00080.99690.00172.94
1st Derivatives60.99890.00170.99690.00252.96
2nd Derivatives80.99890.00080.99690.00172.94
Normalize80.99790.00170.99290.00341.97
SNV90.95390.00850.86180.01532.66
MSC80.99790.00170.99490.00252.96
MSC + SNV50.99690.00250.99390.00341.97
Table 5. Validation results of PLS models based on different hyperspectral imaging pre-processing methods for the SSC of Red Delicious and Golden Delicious cultivars.
CultivarsPre-ProcessingOptimal LVsRcRMSECRcvRMSECVSRD
Red DeliciousNo pre-processing90.96790.33060.90090.58143.00
Gaussian Filter90.95890.37140.87280.66892.60
Smoothing S.G90.89280.58730.63861.09221.59
1st Derivatives80.98890.19380.97090.31452.55
2nd Derivatives90.98590.21670.96190.36042.84
Normalize90.98690.21080.95690.38502.53
SNV90.98490.22690.95090.40882.26
MSC80.99090.17760.97290.30602.70
MSC + SNV90.98490.22690.95090.40882.26
Golden DeliciousNo pre-processing90.99890.05520.99590.09942.82
Gaussian Filter90.99790.07560.99090.14282.93
Smoothing S.G90.98690.17510.95490.32041.98
1st Derivatives50.99790.07900.99490.11221.37
2nd Derivatives50.99890.06370.99690.09092.02
Normalize80.99990.04590.99790.07902.13
SNV80.99690.08750.99190.13682.32
MSC80.99790.07480.99390.12322.35
MSC + SNV80.99690.08750.99190.13681.32
Table 6. Validation results of PLS models based on different hyperspectral imaging pre-processing methods for phenol of Red Delicious and Golden Delicious cultivars.
CultivarsPre-ProcessingOptimal LVsRcRMSECRcvRMSECVSDR
Red DeliciousNo pre-processing90.97693.53680.92596.21523.19
Gaussian Filte90.97193.85730.91196.82292.91
Smoothing S.G90.94795.20110.84149.12732.17
1st Derivatives90.98892.43520.96594.22451.70
2nd Derivatives80.96594.26270.90497.09072.80
Normalized90.98992.33920.96694.19131.73
SNV90.98093.22740.92696.39623.10
MSC90.98592.78970.94995.29122.75
MSC + SNV90.98093.22740.92696.39623.10
Golden DeliciousNo pre-processing90.99791.75690.99393.01582.72
Gaussian Filte90.99592.45560.98794.20153.02
Smoothing S.G90.98195.07280.93899.38142.62
1st Derivatives50.99592.39020.99293.34981.35
2nd Derivatives50.99891.50190.99692.09272.18
Normalized90.99891.23840.99792.00602.66
SNV90.99891.23840.99792.00602.66
MSC90.99891.64980.99492.71832.31
MSC + SNV90.99891.47810.99492.76332.32
Table 7. Results of artificial neural network analysis for hyperspectral imaging.
Transfer FunctionNetwork TypeTraining AlgorithmSDRMSEPerformanceEpochTopologyR
purline-tan-tanfeed-forwadlm0.170.030.005115-10-10-3250.78
tansig-log-purelinefeed-forwadlm0.180.030.00565-20-20-3250.93
tansig-logsig-tansigfeed-forwadlm0.180.020.05065-10-20-3250.61
tansig-log-purelinefeed-forwadbr0.180.030.010365-20-15-3250.82
tan-tansig-purelinecasced forwardlm0.180.020.00265-8-8-3250.81
tansig-logsig-tansigcasced forwardlm0.180.020.00385-10-10-3250.85
tansig-log-tansigcasced forwardbr0.170.020.002265-10-8-3250.88
Publisher’s Note: MDPI stays neutral with regard to jurisdictional claims in published maps and institutional affiliations.