Article

Combining Ability and Heterosis for Market Yield in Green Asparagus

by
Lucía Dolores Amato
1,
Eugenia Alejandra Martin
2,* and
Fernando Sebastián López-Anido
3
1
Cátedra de Química General e Inorgánica, Facultad de Ciencias Agrarias, Universidad Nacional de Rosario, IICAR-CONICET, Zavalla S2125ZAA, Argentina
2
Cátedra de Mejoramiento Vegetal y Producción de Semillas, Facultad de Ciencias Agrarias, Universidad Nacional de Rosario, IICAR-CONICET, Zavalla S2125ZAA, Argentina
3
Cátedra de Genética, Facultad de Ciencias Agrarias, Universidad Nacional de Rosario, IICAR-CONICET, Zavalla S2125ZAA, Argentina
*
Author to whom correspondence should be addressed.
Horticulturae 2022, 8(6), 489; https://doi.org/10.3390/horticulturae8060489
Submission received: 6 April 2022 / Revised: 5 May 2022 / Accepted: 15 May 2022 / Published: 1 June 2022
(This article belongs to the Special Issue Advances in Asparagus Production, Genomics and Breeding)

Abstract

:
In asparagus, current cultivars are mostly hybrids (known as clonal hybrids) derived from crosses between two parents, female and male, with good combining ability. Despite the fact that clonal hybrids have been obtained for more than 40 years, studies of the heterosis and combining abilities involved are limited. Similarly, there are no published studies regarding the association between genetic divergence and heterosis. In this sense, we evaluated two sets of diallel crosses including 12 accessions from 11 different origins for marketable green asparagus production. Parentals were also included as a way to assess heterosis. The variation for market yield was highly significant for both sets. Best parent heterosis was over 100% in four cases. The best experimental hybrid did not significant differ from the Atticus F1 all-male check. The general combining ability (GCA) and specific combining ability (SCA) were significant, with a relative greater contribution of the SCA than the GCA to the variation among crosses. The association between genetic distances and heterosis failed to be significant. The best experimental hybrids were obtained when UC157 and KBF (origins from the USA and the UK) were crossed to Argenteuil, Limburgia and Espárrago de Navarra (origins from France, the Netherlands and Spain).

1. Introduction

The genus Asparagus belongs to the Liliaceae family and comprises around 150 species, some of them with ornamental value and only one with horticultural value: the asparagus Asparagus officinalis L. [1]. From the production point of view, marketable yield in green asparagus is the outcome of the combination of the number of shoots of a desirable diameter and quality, gathered in bundles for the fresh market and canned industry. The distribution of sizes according to the Quality Protocol for Fresh Asparagus in Argentina [2] classifies the shoots according to the diameter at 2.5 cm from the base: jumbo (J), with more than 18 mm; extra-large (XL), from 16 to 18 mm; large (L), from 12 to 16 mm; medium (M), from 9 to 12 mm and small (S), from 6 to 9 mm. Quality requirements vary from country to country: consumers in Europe prefer larger diameter shoots (L, XL and J), while in the United States smaller sizes (S and M) are also accepted; however, in all instances shoots heads should be tight [3]. In this sense, in asparagus, the terms total yield and marketable yield arise, referring the latter for the yield of shoots that reach a minimum stipulated diameter and also have a good quality asparagus tip.
In asparagus, as in most plant species where hybrid combinations are sought, the performance of progenies shows a low correlation with that of their parents, especially for the number of shoots or asparagus [4]. This is explained on the one hand by the effect of the microenvironment on the production of individual perennial plants, and on the other hand by the importance of non-additive effects in hybrid combinations. Nowadays, cultivars are mostly diploid hybrids (known as clonal hybrids) derived from crosses between two parents, female and male, with good combining ability [5]. Despite the fact that clonal hybrids have been obtained for more than 40 years, studies of the heterosis and genetic actions involved are limited [6,7]. Similarly, there are no published studies regarding the association between genetic divergence and heterosis.
The history of modern asparagus improvement is associated with two different origins. In the United States, France and Italy, cultivars were selected from the Argenteuil population, while in Germany and the Netherlands, cultivars were derived from the Braunschweiger population [8]. Although both populations have a common origin, which would be the asparagus cultivated in the 17th and 18th centuries in the Netherlands, they have been kept separately for more than 200 years. This divergence has been supported by the authors of [9], along morphological and isoenzymatic markers, in their study of 26 cultivars from eight different origins. Moreover, the authors of [10], studying the genetic diversity among 30 asparagus cultivars along EST–SSR, distinguished two main clusters: one comprised all American provenances plus some cultivars from Spain, Italy and Germany, whereas the second cluster included accessions from the Netherlands, Germany, Spain and New Zealand. They suggested that asparagus breeders in Europe and North America have developed and used somewhat different germplasm pools, but some cultivars may have more complex origins and include genes from both germplasm sources. In a recent study, the authors of [11] found that the genetic base of asparagus is not as narrow as previously thought and the relationships between different accessions was not clearly related to the country of origin and breeding status.
The degree of heterosis or hybrid vigor exhibited by a cross is commonly used as a measure of the genetic divergence of the parental stocks. Undoubtedly, genetic divergence (difference in gene frequency) in the parents is necessary for heterosis to be expressed.
The performance of a hybrid cross will depend on the general combining abilities (GCA) of the parents, and on the specific combining ability (SCA) of each combination. For this, and to achieve the best hybrid outputs, the highest general and specific combining abilities should be pursued.
After applying the model of analysis of [12] to the data of [4,13], the authors of [1] found that asparagus hybrid yield was explained (R2) in 56 and 64% by the general combining ability (gi) of the parents, and the relative importance of the general combining ability variance upon the variance due to crosses was 0.57 and 0.65, respectively. Similarly, it was found in [7] that the Baker coefficient [14], which expresses the relative importance of the general combining ability variance upon the total genetic variance, was of an intermediate nature for total and marketable yield. In all these reports so far, hybrids combinations were proven among selected plants derived from a given gene pool (Mary Washington, New Jersey stock and Argenteuil, respectively) and suggested that both general and specific combining ability effects are of equivalent importance in determining the yield output of hybrids [1]. Taking into account that the genetic base of the crop is derived from a population growth in the Netherlands two centuries ago, the development of new genetic base populations with the introgression of different germplasms such as landraces and wild populations might also be useful in the selection of new parents to be used in the development of new hybrids with higher heterotic potential [5]. In this sense, the objective of the present work is to broaden the study of hybrid combinations to a diverse panel of asparagus accessions, crossed in a diallel scheme, as a way to assess combining abilities, hybrid vigor and its relation to the genetic distances. We believe that this information will help asparagus breeders to delineate the best strategy in breeding programs aimed at generating base populations to maximize hybrid performances in their crosses.

2. Materials and Methods

2.1. Plant Material

The plant material involved 12 accessions of diploid A. officinalis used either as parents of experimental hybrids and in a per se evaluation (Table 1). The accessions belong to 11 different origins, and the genealogy of each accession and their relationships were recently described in our study [11]. The accessions were implanted at the Experimental Field of the Facultad de Ciencias Agrarias, Universidad Nacional de Rosario, at Zavalla (33°1′ S; 60°53′ W; 24 m.a.s.l.), Argentina, in plots of twenty plants each. During the 2017–2018 season, crosses were made between accessions from different origins (the United Kingdom, Denmark, the Netherlands, Spain, Turkey, the Czech Republic, Germany, Russia, Sweden, the USA and France) following a diallel scheme to advance a series of experimental hybrids. When possible, each cross was conducted in both directions (with reciprocals). In addition, crosses within each accession (sib-mating) were obtained and bulked to increase its seeds. The seeds of each accession were used to establish each one at field and determine its performance (per se evaluation) at the same conditions as the hybrids.
In autumn 2018, berries from each cross and sib-mated accession (bulk) were harvested and threshed separately. When reciprocal crosses were obtained, their seeds were mixed. Enough successful seeds were secured in 46 hybrids, which were grouped into two diallel sets without reciprocals, to make each set as complete as possible in terms of origins and number of seeds. Set 1 includes the crosses and bulks of accessions 4, 5, 6, 7, 8, 11, 13 and 20. In the case of the hybrids 6 × 8 and 8 × 13, crosses failed to secure seeds. Set 2 includes the crosses and bulks of accessions 1, 3, 6, 10, 12, 13 and 20. In the case of the hybrid 12 × 20, the cross failed to secure seeds. Accessions 6, 13 and 20 were included as parents in both sets.
The accession coded 13 corresponds to the advanced F2 of the well-known dioecious hybrid UC-157 F1 [15]. As it is no longer available as F1, commercial seed UC-157 F2 was used instead. UC-157 is a material used internationally by green asparagus growers for its precocity, yield and spear quality. Its large current production in Argentina and the world market allows it to be considered as a check commercial cultivar. An additional check was included, the all-male hybrid Atticus F1 (Bejo Zaden Bv, Warmenhuizen, The Netherlands).
In august 2018, experimental hybrids and parental bulked seeds were disinfected with sodium hypochlorite (39.5 g/L), and placed in Petri dishes, with water embedded blotting paper under controlled conditions (25 °C and darkness). Germination took place in between three and four weeks. When radicles emerged, seeds were transplanted to 72 cell trays with commercial substrate and placed in a greenhouse. After approximately one and a half months, plantlets reached the two emerged stalks stage and were ready for field transplant.

2.2. Field Design and Data Collected

In October 2018, the plant material was planted at the Experimental Field, described above, in a randomized complete block design with three replicates. Each experimental unit consisted of 14 plants per plot, arranged in rows 140 cm apart and with 20 cm between plants in the row. Border rows in each side of the assay and border plots at the beginning and end of each row were planted to secure an even plant stand competition. After transplanting, drip irrigation lines were laid, and watered when needed. During the first season, plants were allowed to grow freely, with weeds and ants controlled. At the end of the season, the plant stand in each plot was recounted, and after the first frost all the above ground stalks were cut and removed.
Two production seasons were considered: 2019 and 2020. Each plot was individually harvested for 30 and 40 consecutive days in the first and second season, respectively. It was previously proved in asparagus that the first two seasons of harvest are a reliable estimator of the yield of the rest of the productive years [16]. Harvests were conducted daily in the mornings; all shoots that reached at least 20 cm long were cut flush with the ground with a knife. Once day harvest finished, spears were trimmed to 20 cm long, individually weighed (g) and diameter measured at the lower third with a caliper (mm). Tip quality was evaluated along a 1–5 scale, 1 for the tight closed heads, 2 when small lateral buds were visible under the bracts, 3 when more prominent swollen lateral buds were present under the bracts, 4 when lateral shoots were elongated up to approximately 1 cm, rendering a loose tip, and 5 when tips were open and lateral branched (Figure 1).

2.3. Data Analysis

2.3.1. Analysis of Variance

For each set of crosses, an analysis of variance was carried out using the statistical program SAS GLM [17]. The source of variation materials was partitioned into crosses (experimental hybrids), parents and the contrast crosses vs. parents. The significance of this contrast is a test for heterosis, as proposed by [18]. Both harvest seasons’ data were merged and tested for the normal distribution of residuals prior to the analysis. Finally, a least significant difference mean test was conducted among all entries, including the Atticus control.

2.3.2. Heterosis

Heterosis was calculated following [19], as a percentage of the superiority of the hybrid with respect to the best parent.
Heterosis = (Hybrid mean − Best Parent mean) ÷ (Best Parent mean) × 100

2.3.3. General and Specific Combining Ability

For the general combining ability (GCA) and specific combining ability (SCA) quadratic component analysis in each set, the source of variation crosses was partitioned according to Griffing’s Method II, Model 1 [20]. Method II considers parents and a set of hybrids (without reciprocals). Model 1 (fixed effects) was preferred, since the experimental material is the population in which inferences should be made.
The model for the analysis according to Griffing’s Method II, Model 1 was
Yijk = μ+ gi+ gj+ Sij + bk + eijk
i, j = 1, 2, 3, …, n
k = 1, 2, 3
where:
  • Yijk = the observed phenotypic value of the experimental unit ijk;
  • μ = the general mean of all experimental units;
  • gi and gj = the effect of the GCA of each of the parents of the i × j cross;
  • Sij = the effect of the SCA for the i × j cross;
  • bk = the effect of repetition k;
  • eijk = the error term between genotype ij and repetition k.
For the Griffing analysis, the RStudio statistical program was used, along with the DiallelAnalysisR package [21].
For each set of crosses, the significance of the GCA and SCA sources of variation was tested against the error term. When these sources of variation were significant, the Baker [14] ratio 2Φg/(2Φg + Φs) was calculated as a measure of the relative importance of each of the quadratic components of variance, where Φg and Φs are the quadratic component of GCA and SCA, respectively. A ratio value close to unity indicates a greater importance of the GCA than the SCA effects and a ratio value close to 0.5 means an equivalent load; with a ratio below 0.5, the SCA effects are the ones with the greatest contribution to the variation among crosses.

2.3.4. SREG Analysis

A SREG (site regression model) multivariate analysis was carried out for each set of crosses with the mean values of market yield. The adaptation and interpretation of SREG for diallel data was proposed by [22]. In the biplot output, each accession is positioned as entry (variety) and as tester (environments of the typical SREG). The projection of the parents on the mean tester coordinate axis is related to the order of their GCA effects, while the SCA effects are related to the projection onto the average tester ordinate. Those combinations given high SCA effects are located closely to each other, acting as entry and as tester, and vice versa. Heterotic groups can be inferred if accessions with a high SCA are related to different origins or breeding programs. The SREG analysis was conducted along the GGE biplot [23].

2.3.5. Correlation Analysis

The correlation between the percentage of heterosis of the experimental hybrids and the genetic distances of their parents was estimated for each set. The genetic distance data were obtained from a previous contribution [11], in which 329 sequence-related amplified polymorphism (SRAP) bands from the genomic DNA of 24 entries were obtained, including the 12 accessions of the present study. The Pearson coefficient of correlation was estimated using the statistical program InfoGen [24].

3. Results

3.1. Harvest Data and Market Yield

Both production seasons (2019 and 2020) were satisfactory and a total of 16,737 shoots were harvested. In season 2019, 6728 shoots were obtained, whereas 10,009 shoots were collected in 2020, according to the duration of the season and the age of the plant. Market yield was estimated from the average weight of shoots and the number of spears harvested from each cultivar. For the statistical analysis, only the shoots that presented a market value (diameter measured at the lower third > 10 mm and a quality value of 1 or 2 at the scale) were considered.

3.2. Analysis of Variance

The output tables of the ANOVA for market yield are presented in Table 2 and Table 3 for Sets 1 and 2, respectively. For Set 1, the source of variation crosses and parents were highly significant (p < 0.002); however, the contrast crosses vs. parents was not significant (p = 0.37) (Table 2).
For Set 2, the source of variation crosses and contrast crosses vs. parents were highly significant (p < 0.001), while there was not a significant variation among parents (p = 0.53) (Table 3).

3.3. Hybrids Yield and Heterosis

The mean plot market yield (g/plot) for the parents and experimental hybrids of Sets 1 and 2 are presented in Table 4 and Table 5, respectively.
The commercial control Atticus yielded 1065.95 g/plot, not significantly different from the best yielding experimental hybrids (12 × 13) (Table 5). In Figure 2, plots at harvest of 12 × 13 and Atticus are shown.
The heterosis percentages in both sets of experimental hybrids for market yield are presented in Table 6.
For Set 1, only one cross (4 × 13) significantly exceeded a 100% heterosis, while three crosses (12 × 13, 1 × 12 and 3 × 13) presented significant heterosis over 100% in Set 2.

3.4. General and Specific Combining Ability

The GCA and SCA sources of variation for market yield were highly significant in both sets (Table 7).
The GCA and SCA quadratic components and their ratio are presented in Table 8. In both cases, the ratio was lower than 0.5, indicating a greater contribution of the SCA than the GCA effects to the variation among crosses.
In Supplementary Table S1, market yield GCA and SCA effects are presented for both sets. In Set 1, the highest GCA effects were obtained by the parents 13 (UC 157) and 11 (Arslev 136). In Set 2, the highest GCA values were presented by the parents 12 (Argenteüil) and 13. The crosses with the highest SCA were 8 × 11 and 4 × 13 in Set 1 and 12 × 13 and 1 × 12 in Set 2 (Table S1).

3.5. SREG Analysis

The SREG multivariate analysis biplots for Sets 1 and 2 are presented in Figure 3 and Figure 4, respectively. The first two components accounted for 76 and 89% of the variation in Sets 1 and 2, respectively.

3.6. Correlation between Heterosis and Genetic Distance

The genetic distance data obtained from SRAP markers analysis are presented in Supplementary Table S2. The correlations between heterosis and the genetic distances of the parents for both sets are presented in Table 9. There was not a significant association between them.

4. Discussion

The available land for commercial horticultural production is anticipated to decline globally; thus, the way to meet the growing demand of vegetables would be by increasing the produce in greenhouses, with the aid of new technologies and the use of improved cultivars. In asparagus, hybrid cultivars have been released for the last 40 years, mainly due to its dioecious nature and the possibility to micropropagate selected genotypes; however, information regarding combining abilities and heterosis among materials or genetics stocks is limited, and no heterotic pattern has been identified so far. In this sense, we advanced the study of hybrid performance among 12 accessions from 11 different origins as a way to reveal to what degree heterosis is prevalent, and to what extent it is associated to different origins or genetic distance. Overall, we found highly significant variation for market yield among materials (parents and experimental hybrids) in the two sets of crosses (Table 2 and Table 3). Two of the parents included were collected as growing wild (5 and 10, see Table 1), however the mean market yield did no significant vary from some cultivated accessions (Table 4 and Table 5), this may reflect either a lack of differentiation between some cultivated and wild populations or that the supposedly collected wild are really escapees from cultivation. Some experimental hybrids showed a very good performance: in Set 1, (4 × 13) significantly exceeded the parental 13 (UC157), considered a commercial check (Table 4). In Set 2, the hybrids (12 × 13), (1 × 12), and (3 × 13) significantly surpassed the UC157, and surprisingly (12 × 13) did not differ from the Atticus F1 all-male check (Table 5). The heterosis test (contrast crosses vs. parents) was highly significant for Set 2 (Table 3); and the best parent heteroses expressed for market yield were remarkably high, in one case being over 300% (12 × 13) and in two cases over 100%, (1 × 12) and (3 × 13) (Table 6). In an evaluation of 16 crosses between only an inbred used as the staminate parent (originating from the Netherlands) and a group of inbred and commercial open pollinated varieties used as pistillate parents, the inbreds mostly derived from the varieties KBF (UK) and Mary Washington (USA); in [6], for the first season’s total yield, a significantly higher parent heterosis over 200% was found in three cases, which is in concordance to the magnitude found in our study; in general, the best experimental hybrids were those derived from a Mary Washington pistillate origin, and they did not significantly differ from the best variety. In other vegetable crops, the percentage of heterosis reported for yield, in general, is lower than that present in asparagus (e.g., melon, 8%; squash, 44%; watermelon, 10%; broccoli, 65%; carrot, 28%; onion, 40%) [25]. Interestingly, in a recent review regarding heterosis in vegetable crops [26], the overdominance effects were involved in the largest proportion of the quantitative trait loci related to heterosis; and for many vegetable species (tomato, cabbage, eggplant, cucumber, etc.), heterotic groups were defined and associated to molecular markers.
In relation to the combining abilities, in our study both were highly significant for market yield; this means that the GCA of the parents (related to additive gene actions), and the SCA (related to non-additive gene actions) are important components of the hybrid output (Table 7). When comparing the relative contribution along the Baker´s ratio, the SCA tended to be of a greater importance than the GCA for both sets of crosses (Table 8). A similar contribution of the GCA and SCA to the total genetic variance was found in [
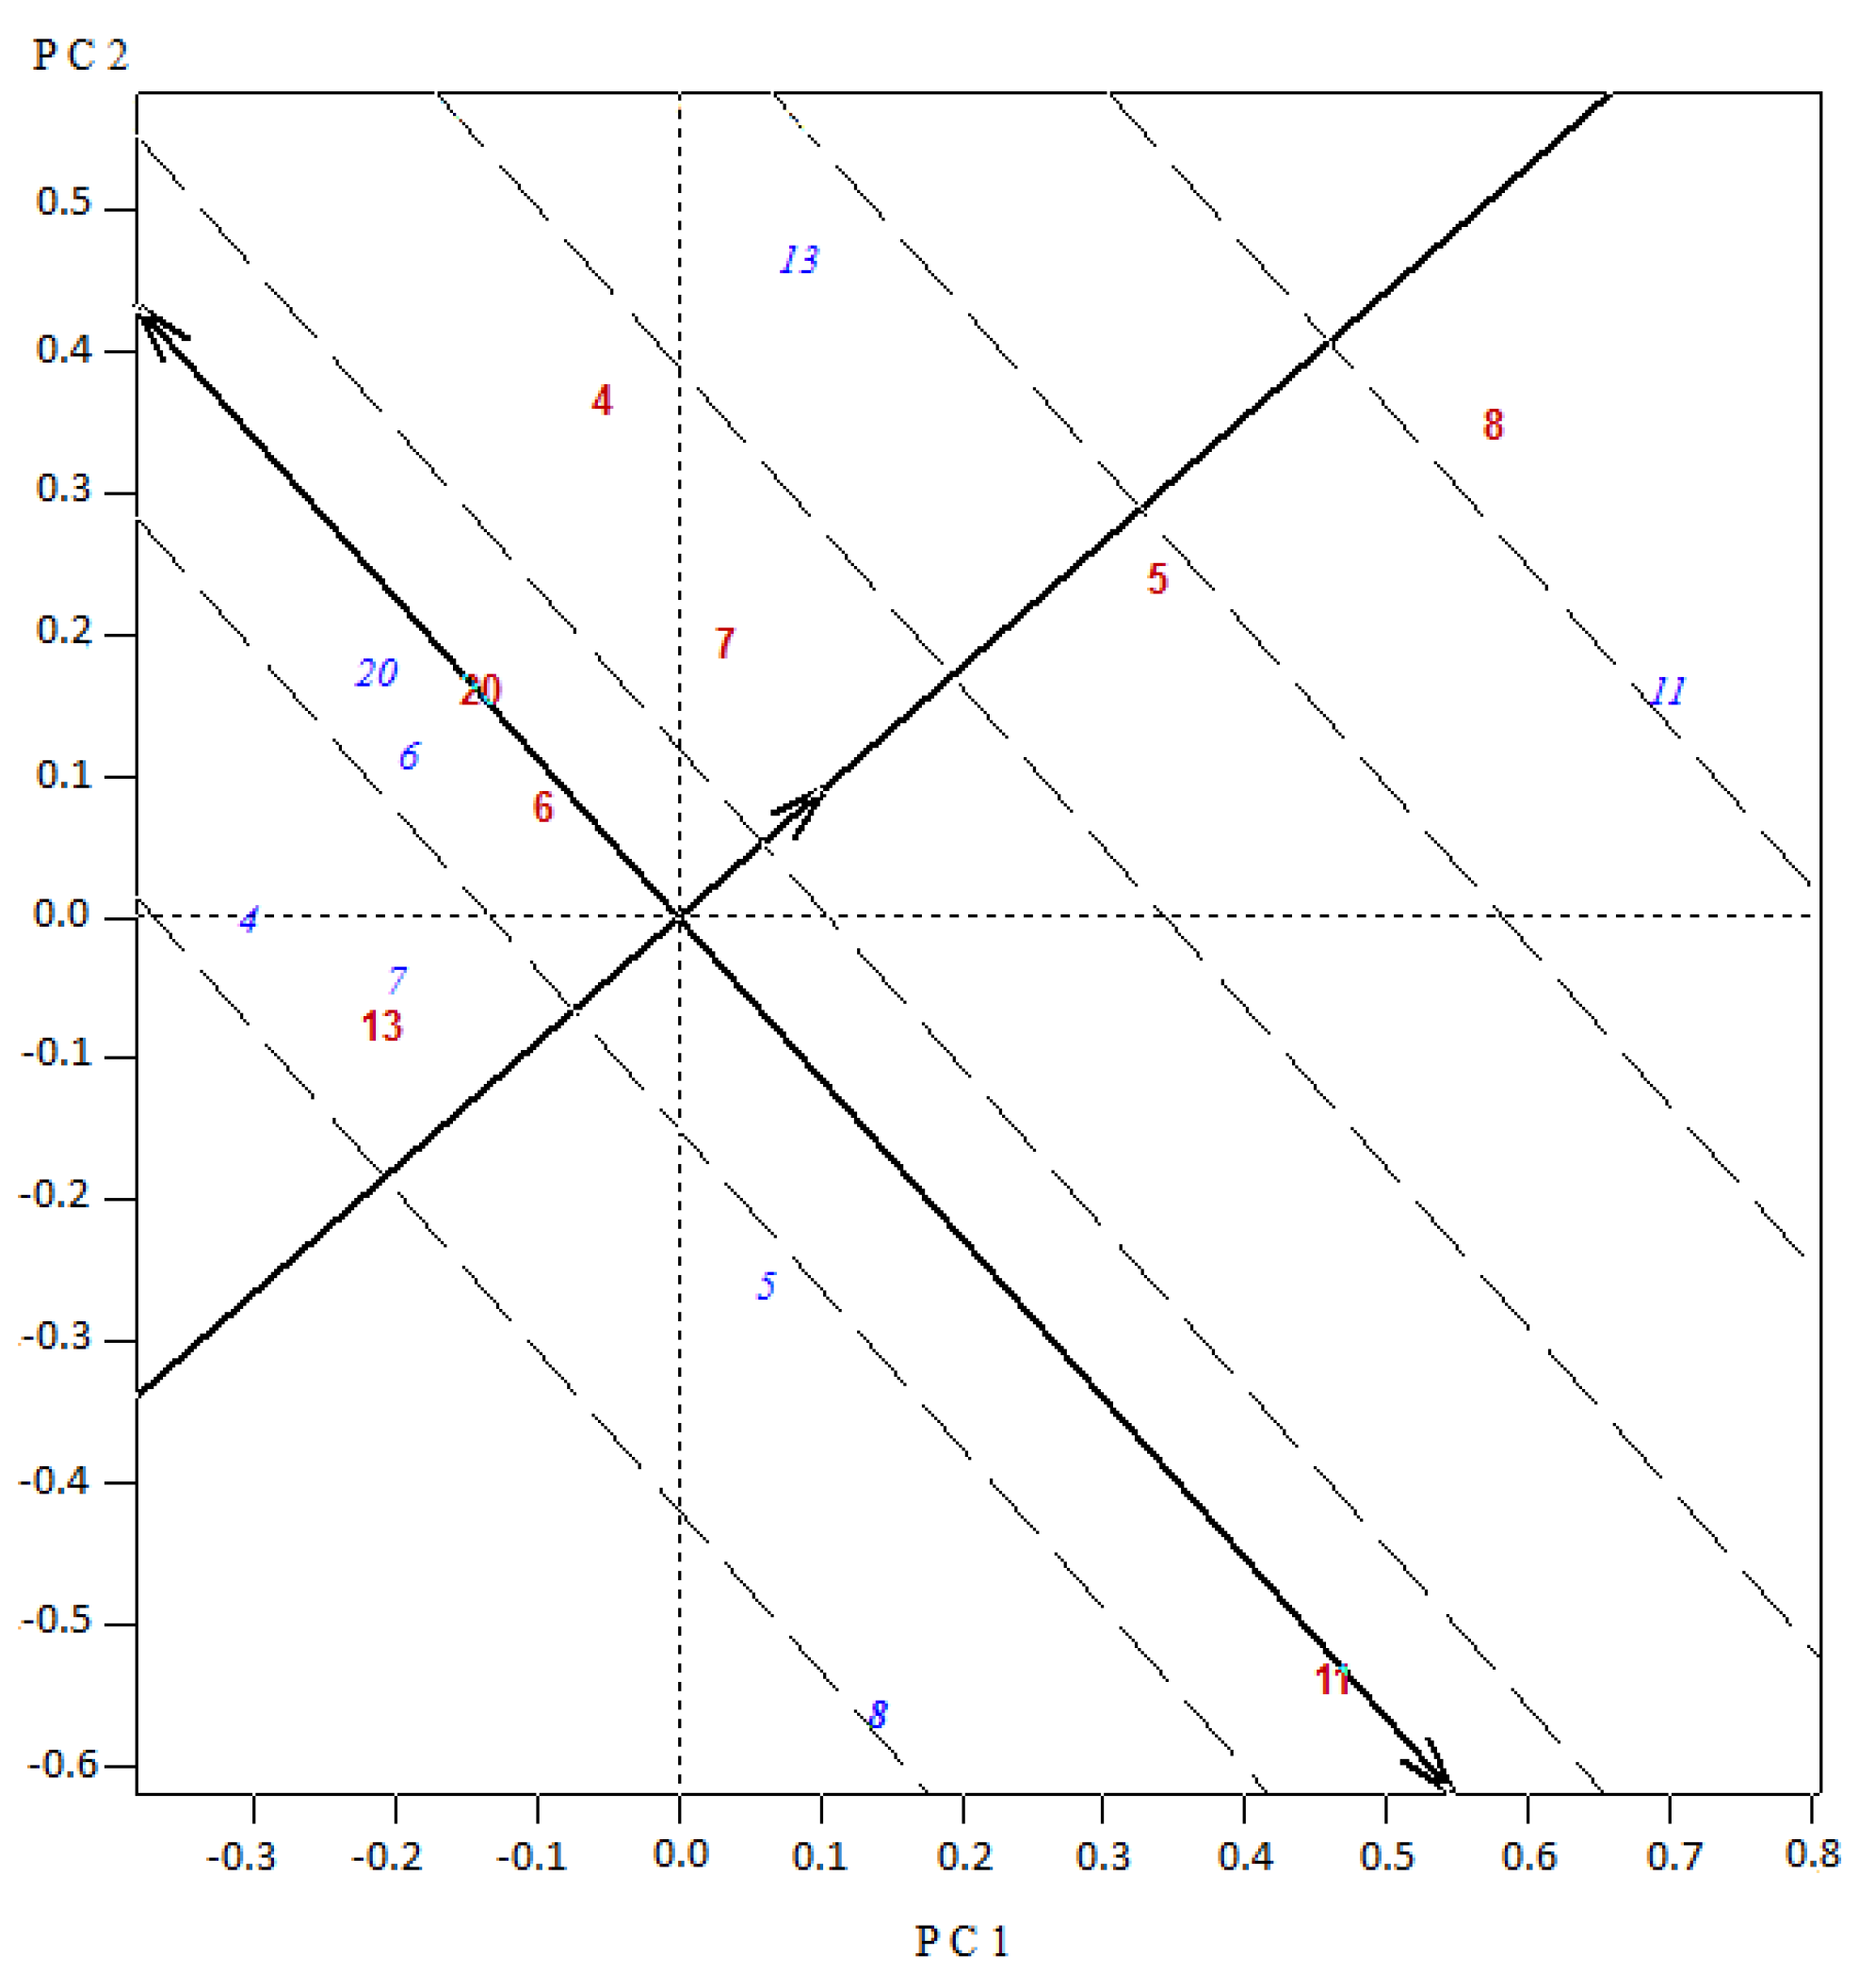
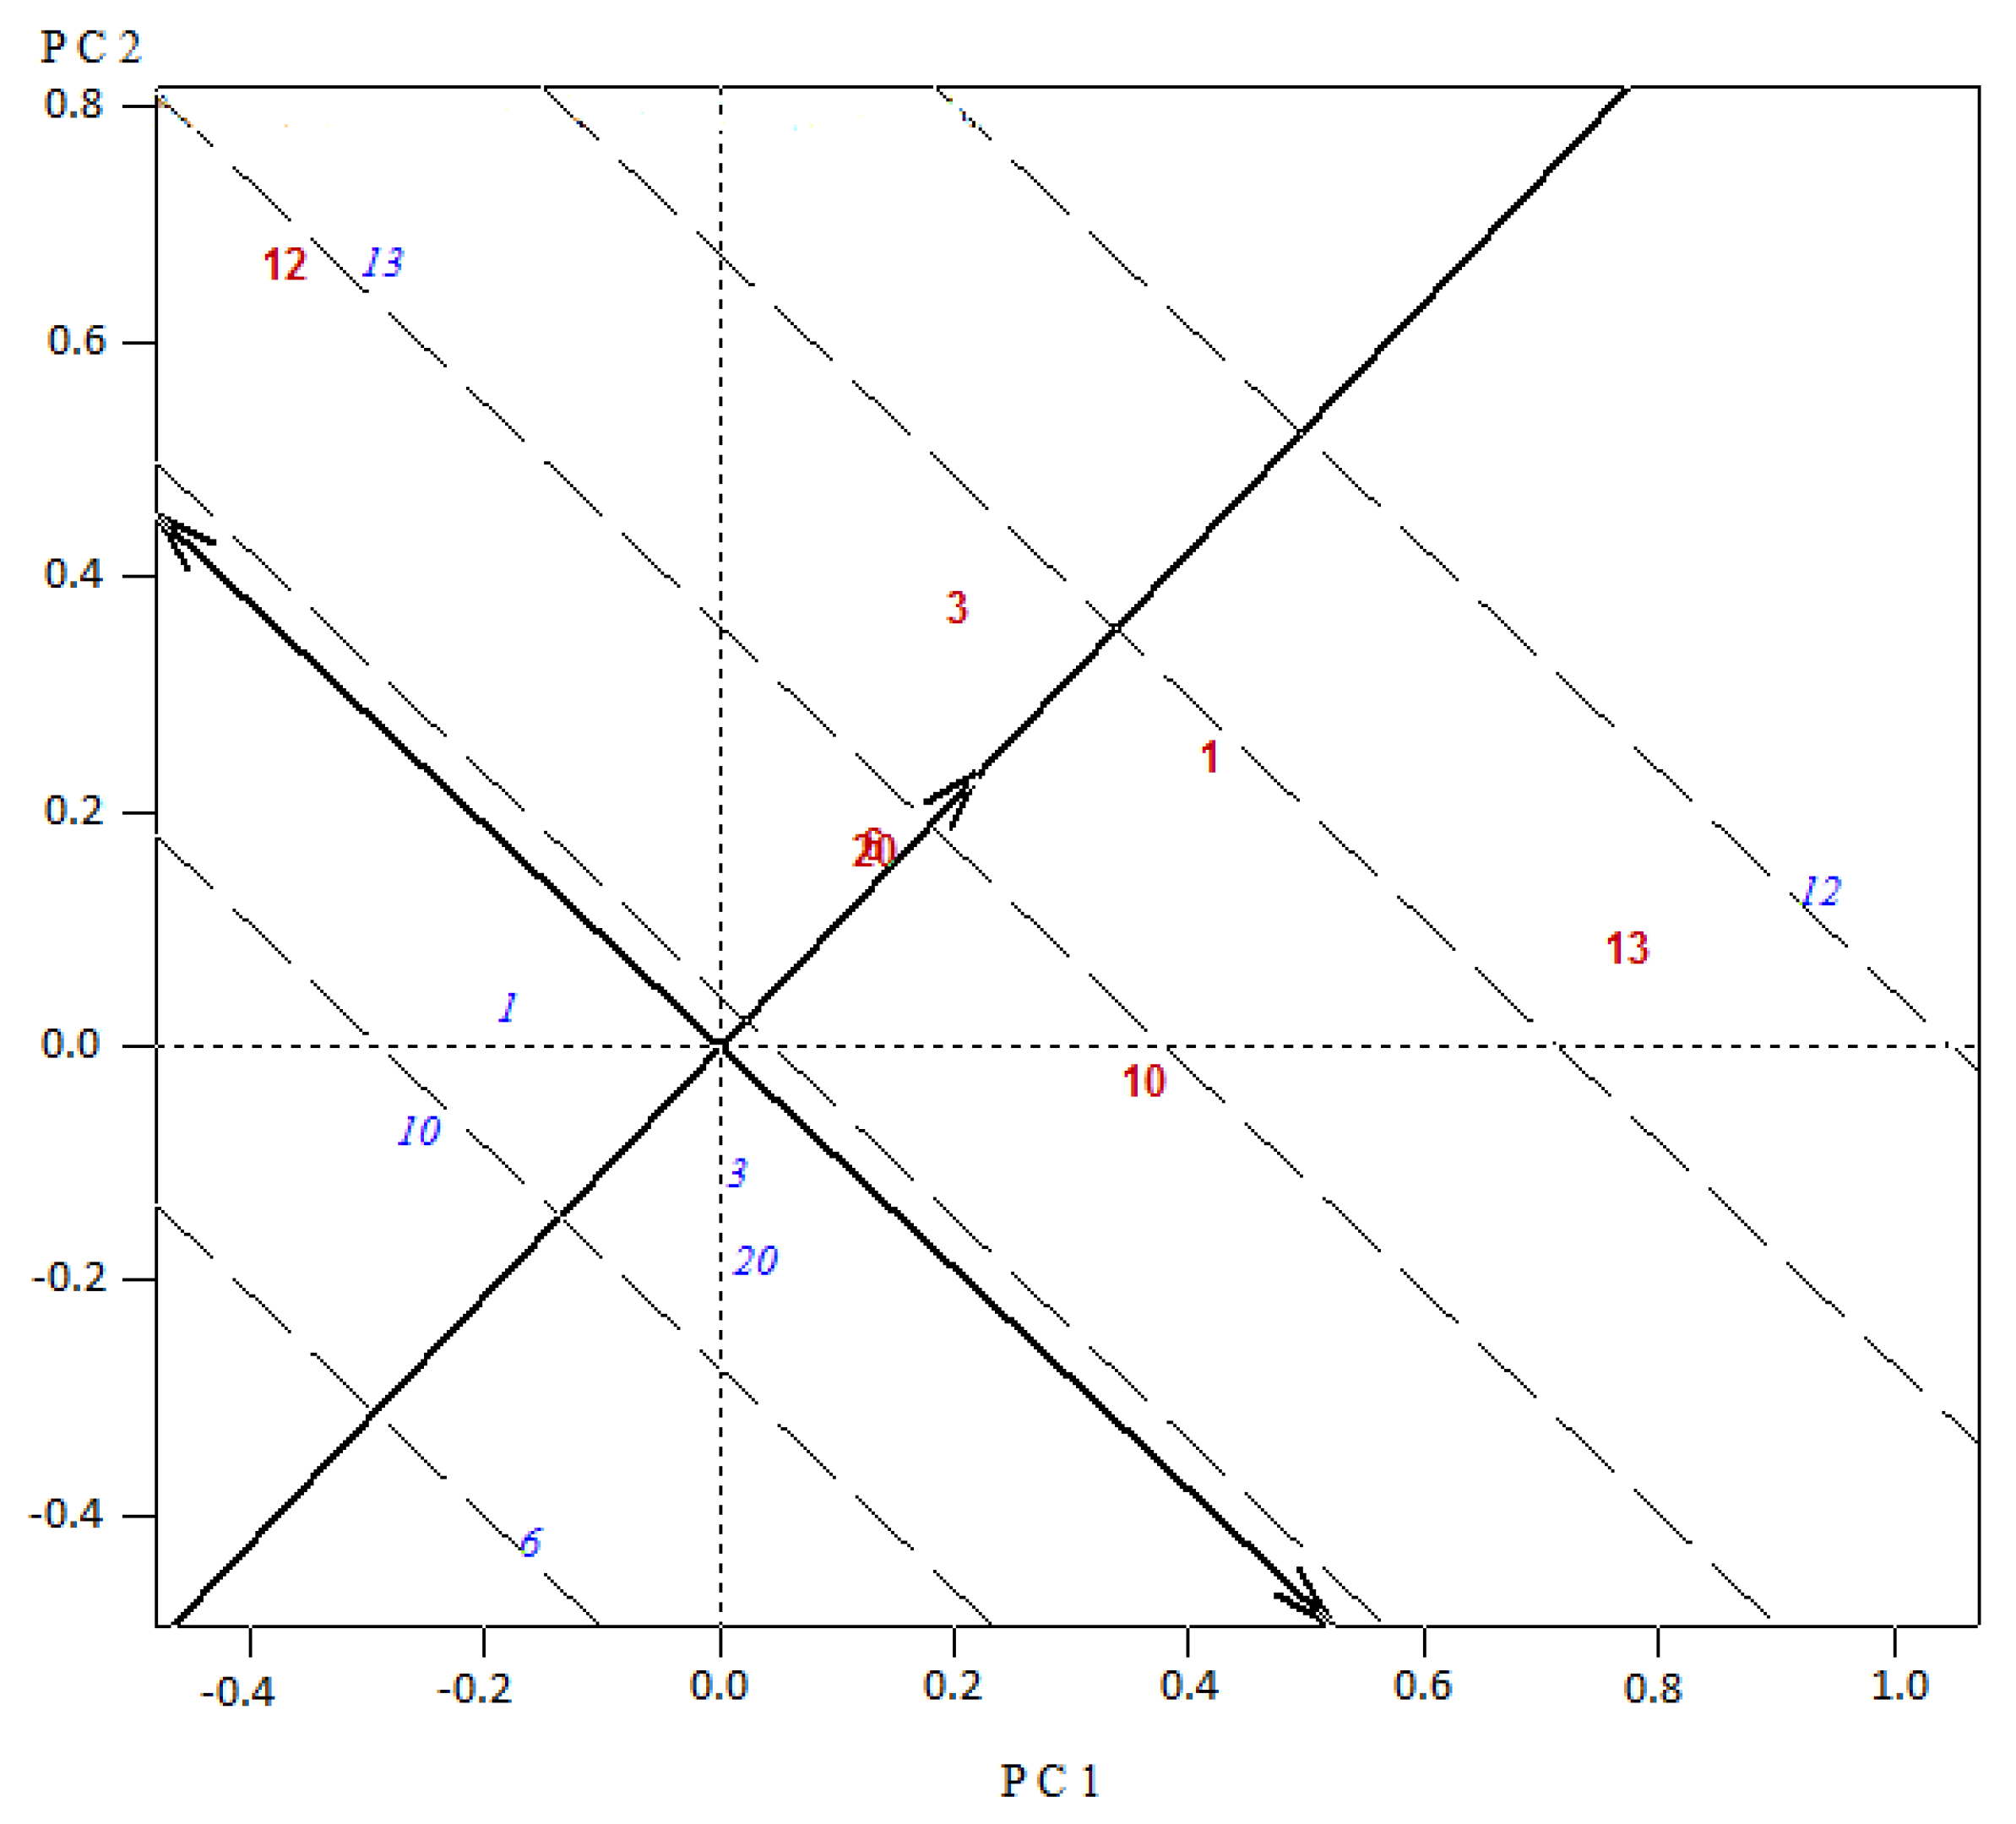
7]; however, the fact that they evaluated a set of diallel crosses of genotypes selected from an Argenteuil population could have reduced the contribution of the SCA, which is associated to dissimilar gene frequencies, most expected to be found in crosses derived from different populations. The SREG biplot applied to diallel crosses (Figure 3 and Figure 4) proved to be an appropriate tool for the graphical identification of the entries with the highest GCA effects (projections of the blue labeled codes onto the average tester abscissa) and the superior SCA combination effects, accessions as testers (red labeled, with a higher projection onto the average tester ordinate) placed close to entries (blue labeled). In this sense, in Set 1, for the experimental hybrid 4 × 13, the parental 4 as tester presented the highest ordinate projection and interacted with the parental 13 as variety (blue labeled) being closely positioned in the biplot (Figure 3). In the other hybrid (8 × 11) with a significant heterosis and best mean marketable yield for the set (Table 4), the accession 8 as tester interacted with material 11 as variety, which in turn had the highest GCA for Set 1. In Set 2, for the best experimental hybrid 12 × 13, both parents 12 and 13 contributed with the highest GCA effects (projections of the blue labeled codes onto the average tester abscissa) and interacted with each other with the highest SCA effect (higher projection onto the average tester ordinate) (Figure 4). In relation to origins and hybrid performance in asparagus, it was mentioned that there is no evidence of any clear heterotic pattern for yield, but some breeding programs intuitively included parents with some divergence [27]. In our study, the top four experimental hybrids included in three cases UC157 (13) and in one case KBF (1) as one of the parents. The opposite parents involved were in two cases Argenteuil (12), and in one case Limburgia (3) and Espárrago de Navarra (4). It appears that good combinations of crosses arise from UC157 and KBF (origins from the USA and the UK) crossed to Argenteuil, Limburgia and Espárrago de Navarra (origins from France, the Netherlands and Spain). These results may be valuable for asparagus breeders in order to select specific origins when choosing parents to develop experimental hybrids, and with the same resources increase the combinations assessed.
The correlations between genetic distances and heterosis for market yield failed to be significant for the two sets of crosses (Table 9). In maize, the authors of [28] found a positive correlation between genetic distances and geographical diversity and the degree of heterosis for grain yield in a set of 15 crosses. In sunflower, it was found that the genetic distance of the parents was significantly correlated to hybrid seed yield; however, the genetic distance per se was not a good predictor of the heterosis of a cross [29]. In this sense, we can recall the consideration in maize in [30], where the presence of divergence solely between parents is not a guarantee of heterosis in their crosses. Some degree of divergence is necessary to exploit heterosis, but for the asparagus accessions included in both sets the relation was not straightforward. Moreover, according to a previous work, the genetic distances and genealogy or relationship between different accessions was not clearly related to the country of origin and breeding status [11].

5. Conclusions

In conclusion, the study revealed that experimental hybrids with a mean market yield similar to standard hybrid checks can be advanced from current available accessions and that both GCA and SCA are important constituents of the hybrid output, but the genetic distance between parents is not a good predictor of the heterosis output of the cross.
The top experimental hybrids of this work were 12 × 13, 1 × 12, 3 × 13 and 4 × 13, and were obtained using five commercial accessions (UC157, KBF, Argenteuil, Limburgia and Espárrago de Navarra). These accessions should be considered appropriate base populations to attain introgression of new traits or to conduct new cycles of reciprocal selections to maximize hybrid performance in new cultivars. Since all the used accessions in this work are freely accessible from Genebanks, these results are suitable to be used for the asparagus breeding community.

Supplementary Materials

The following supporting information can be downloaded at: https://www.mdpi.com/article/10.3390/horticulturae8060489/s1, Table S1: Market yield GCA and SCA effects for Set 1 and 2, Table S2: Genetic distances (Dice) between parental accessions from SRAP markers analysis (see codes in Table 1).

Author Contributions

L.D.A., E.A.M. and F.S.L.-A. contributed equally to the design and implementation of the research, to the analysis of the results and to the writing of the manuscript. All authors have read and agreed to the published version of the manuscript.

Funding

This research was funded by Consejo Nacional de Investigaciones Científicas y Técnicas (CONICET, Argentina), grant PUE0043 and Universidad Nacional de Rosario grant 80020190300132UR.

Institutional Review Board Statement

Not applicable.

Data Availability Statement

Not applicable.

Acknowledgments

Special thanks are given to David Balaban for the support in the harvests.

Conflicts of Interest

The authors declare no conflict of interest.

References

  1. López Anido, F.; Cointry, E. Asparagus. In Vegetables II: Fabaceae, Liliaceae, Umbelliferae, and Solanaceae, Series: Handbook of Plant Breeding; Prohens, J.J., Nuez, F., Eds.; Springer: New York, NY, USA, 2008; pp. 87–119. [Google Scholar]
  2. SAGPyA. Secretaría de Agricultura, Ganadería Pesca y Alimentos. Protocolo de Calidad para Espárrago Fresco. Available online: http://www.alimentosargentinos.gob.ar/contenido/valorAr/sello/SAA010_Esparrago_v08.pdf (accessed on 28 March 2022).
  3. Kirschenbilder, E.; Castagnino, A.M.; Díaz, K.E.; Rosini, M.B.; Falavigna, A. Cadena espárrago: Producción de diferentes genotipos en su quinto año y comportamiento en poscosecha. Agron. Mesoam. 2015, 26, 99–109. [Google Scholar] [CrossRef] [Green Version]
  4. Currence, T.M. Progeny tests of asparagus plants. J. Agric. Res. 1947, 74, 65–76. [Google Scholar]
  5. Moreno-Pinel, R.; Castro-López, P.; Die-Ramón, J.N.; Gil-Ligero, J. Asparagus (Asparagus offcinalis L.) breeding. In Advances in Plant Breeding Strategies: Vegetable Crops; Al-Khayri, J.M., Jain, S.M., Jonson, D.V., Eds.; Springer Nature AG: Basel, Switzerland, 2021; pp. 425–469. [Google Scholar]
  6. Ito, P.J.; Currence, T.M. Inbreeding and heterosis in asparagus. Proc. Amer. Soc. Hort. Sci. 1965, 86, 338–346. [Google Scholar]
  7. Asprelli, P.D.; López-Anido, F.S.; Cointry, E.L. Estimates of genetic variance components in asparagus hybrids in two cultivation systems. Crop Breed. Appl. Biotech. 2005, 5, 134–141. [Google Scholar] [CrossRef]
  8. Knaflewski, M. Genealogy of asparagus cultivars. Acta Hortic. 1996, 415, 87–91. [Google Scholar] [CrossRef]
  9. Geoffriau, E.; Denoue, D.; Rameau, C. Assessment of genetic variation among asparagus (Asparagus officinalis L.) populations and cultivars: Agromorphological and isozymic data. Euphytica 1992, 61, 169–179. [Google Scholar] [CrossRef]
  10. Caruso, M.; Federici, C.T.; Roose, M.L. EST–SSR markers for asparagus genetic diversity evaluation and cultivar identification. Mol. Breed. 2008, 21, 195–204. [Google Scholar]
  11. Amato, L.D.; López-Anido, F.S.; Zayas, A.; Martin, E.A. Genetic resources in asparagus: Diversity and relationships in a collection from different origins and breeding status. N. Z. J. Crop Hortic. Sci. 2021, 1–12. [Google Scholar] [CrossRef]
  12. Viana, J.M.S. Teoría e Análise de Cruzamentos Dialélicos Parciais, com Aplicação no Melhoramento Genético de Feijoeiro (Phaseolus vulgaris L.). Ph.D. Thesis, Viçosa Federal University, Viçosa, Brazil, 1995. [Google Scholar]
  13. Price, H.C.; Baughan, R.A. A six year summary of yields with New Jersey hybrids in Michigan. Acta Hortic. 1990, 271, 159–162. [Google Scholar] [CrossRef]
  14. Baker, R.J. Issues in diallel analysis. Crop Sci. 1978, 18, 533–536. [Google Scholar] [CrossRef]
  15. Benson, B.L.; Takatori, F. Meet U.C. 157. Am. Veg. Grow. 1978, 26, 8–9. [Google Scholar]
  16. Bussell, W.T.; Falloon, P.G.; Nikoloff, A.S. Evaluation of Asparagus yield performance after two years’ harvesting. N. Z. J. Exper. Agric. 1987, 15, 205–208. [Google Scholar] [CrossRef]
  17. SAS, version 8.2 SAS 2001; Institute Inc.: Cary, NC, USA.
  18. Hallauer, A.R.; Miranda Filho, J.B. Quantitative Genetics in Maize Breeding, 2nd ed.; Iowa State University Press: Ames, IA, USA, 1998; 468p. [Google Scholar]
  19. Fehr, W.R. Principles of Cultivar Development. Theory and Technique; McGraw Hill Inc.: New York, NY, USA, 1987; 536p. [Google Scholar]
  20. Griffing, B. Concept of general and specific combining ability in relation to diallel crossing systems. Aust. J. Biol. Sci. 1956, 9, 463–493. [Google Scholar] [CrossRef]
  21. Yaseen, M.; Eskridge, K.M. DiallelAnalysisR: Diallel Analysis with R.R Package Version 0.3.0. Available online: https://cran.r-project.org/package=DiallelAnalysisR (accessed on 28 September 2021).
  22. Yan, W.; Hunt, A. Biplot analysis of diallel data. Crop Sci. 2002, 42, 21–30. [Google Scholar] [CrossRef]
  23. Yan, W. GGEbiplot—A Windows application for graphical analysis of multi-environment trial data and other types of twoway data. Agron. J. 2001, 93, 1111–1118. [Google Scholar] [CrossRef] [Green Version]
  24. Balzarini, M.G.; Di Rienzo, J.A. Infogen Version 2016. FCA, Universidad Nacional de Córdoba, Argentina. Available online: http://www.info-gen.com.ar (accessed on 20 March 2021).
  25. Wehner, T.C. Heterosis in vegetable crops. In The Genetics and Exploitation of Heterosis in Crops; ASA-CSSA-SSSA; Wiley: Madison, WI, USA, 1999; pp. 387–397. [Google Scholar]
  26. Yu, D.; Gu, X.; Zhang, S.; Dong, S.; Miao, H.; Gebretsadik, K.; Bo, K. Molecular basis of heterosis and related breeding strategies reveal its importance in vegetable breeding. Hortic. Res. 2021, 8, 120. [Google Scholar] [CrossRef]
  27. Benson, B.L.; Mullen, R.J.; Dean, B.B. Three new green asparagus cultivars; Apollo, Atlas and Grande and one purple cultivar, purple passion. Acta Hortic. 1996, 415, 59–66. [Google Scholar] [CrossRef]
  28. Moll, R.H.; Salhuana, W.S.; Robinson, H.F. Heterosis and genetic diversity in varieties of maize. Crop Sci. 1962, 40, 1588–1595. [Google Scholar]
  29. Cheres, M.T.; Miller, J.F.; Crane, J.M.; Knapp, S.J. Genetic distance as a predictor of heterosis and hybrid performance within and between heterotic groups in sunflower. Appl. Genet. 2000, 100, 889–894. [Google Scholar] [CrossRef]
  30. Cress, C.E. Heterosis of the hybrid related to gene frequency differences between two populations. Genetics 1966, 53, 269–274. [Google Scholar] [CrossRef] [PubMed]
Figure 1. Scale 1 to 5 according to tip quality of the spears: 1 for tight heads, no lateral buds visible; 2 when small lateral buds were visible under the bracts; 3 when swollen lateral buds not yet elongated were present; 4 when lateral shoots elongated up to 1 cm were visible and 5 for branched spears.
Horticulturae 08 00489 g001
Figure 2. (A) The 12 × 13 hybrid and (B) Atticus F1 plots at harvest.
Horticulturae 08 00489 g002
Figure 3. GGE biplot for market yield in Set 1. PC1 and PC 2 accounted for 41% and 35% of the variation, respectively. See codes in Table 1.
Horticulturae 08 00489 g003
Figure 4. GGE biplot for market yield in Set 2. PC1 and PC 2 accounted for 63% and 26% of the variation, respectively. See codes in Table 1.
Horticulturae 08 00489 g004
Table 1. List of asparagus accessions used as parents of experimental hybrids and in per se evaluation.
CodeAccession NameSourceGene Bank CodeOriginBreeding Status
1KBF, Ames 432GRIN NE9 1PI 277830UKCultivated
3Limburgia, F1 HybridGRIN NE9PI 386246NetherlandsCultivated
4Espárrago de NavarraGRIN NE9PI 262900SpainCultivated
57673GRIN NE9PI 174056TurkeyWild
6IvancickyIPK 2ASP 1Czech RepublicCultivated
7SpaganivaIPKASP 7GermanyCultivated
8Asp 6IPKASP 6RussiaCultivated
10AsmundtorpNorGen 3NGB8420SwedenWild
11Arslev 136NorGenNGB9970DenmarkCultivated
12ArgentuilVilmorin 4 FranceCultivated
13UC 157Walker 5 USACultivated
20StartIPKASP 3GermanyCultivated
1 Northeast Regional PI Station, Geneva, USA, http://www.ars.usda.gov/Main (accessed on 20 March 2021).; 2 IPK, Gatersleben, Germany, http://www.ipk-gatersleben.de/en/dept-genebank/genebank-documentation (accessed on 20 March 2021); 3 Nordic Gene Bank, Sweden, http://www.nordgen.org (accessed on 20 March 2021); 4 Vilmorin, France, http://www.vilmorin-semillas-de-arboles.com/semillas (accessed on 20 March 2021); 5 Walker Brothers Inc., USA, http://www.walkerseed.com (accessed on 20 March 2021).
Table 2. Analysis of variance for market yield in Set 1. DF = degrees of freedom. Pr = p-value. The model adjustment (R2) and error coefficient of variation are presented at the bottom of the table.
Source of VariationDFSum SquaresMean SquareF ValuePr > F
Blocks20.143085350.071542675.970.0046
Materials331.586288500.048069354.01<0.0001
      Crosses251.254951390.050198064.18<0.0001
      Parents70.330944820.047277833.940.002
      Crosses vs. Parents10.009409340.009409340.780.3796
Error540.647518280.01199108
R2 = 0.727578, error CV = 9.467951.
Table 3. Analysis of variance for market yield in Set 2. DF = degrees of freedom. Pr = p-value. The model adjustment (R2) and error coefficient of variation are presented at the bottom of the table.
Source of VariationDFSum SquaresMean SquareF ValuePr > F
Blocks20.128330490.064165252.550.0903
Materials263.652866410.140494865.58<0.0001
      Crosses193.098708320.163089916.47<0.0001
      Parents60.130579510.021763250.860.532
      Crosses vs. Parents10.369172930.3691729314.660.0004
Error421.057817220.02518612
R2 = 0.781398, error CV = 12.09416.
Table 4. Market yield (g/plot) of parents (on diagonal) and experimental hybrids (above diagonal) for Set 1. See Table 1 for parental codes. Least square differences between means = 209.4, p < 0.05.
45678111320
497.40126.67162.58103.9222.3373.11490.25236.78
5 128.5957.17141.4991.13434.00354.1792.67
6 84.6780.56136.510.00255.21127.20
7 15.0331.6667.52340.9550.17
8 9.33670.25262.15140.00
11 353.67167.0327.13
13 222.92320.69
20 289.68
Table 5. Market yield (g/plot) of parents (on diagonal) and experimental hybrids (above diagonal) for Set 2. See Table 1 for parental codes. Least square differences between means = 209.4, p < 0.05.
13610121320
1147.36214.90134.26221.16711.95356.02328.88
3 206.77198.74234.11545.50520.33185.03
6 84.67173.59321.05255.21127.20
10 62.99539.76147.00462.00
12 272.991115.12465.72
13 222.92320.69
20 289.68
Table 6. Best parent heterosis percentage of market yield for the experimental hybrids in Set 1 and Set 2. For each set, values are presented in decreasing order.
Set 1Set 2
CrossHeterosisCrossHeterosisCrossHeterosisCrossHeterosis
4 × 13119.21 *4 × 20−18.2612 × 13308.49 *6 × 1314.48
7 × 8110.675 × 8−29.131 × 12160.8 *1 × 2013.53
8 × 1189.51 *8 × 20−51.673 × 13133.41 *3 × 1013.22
4 × 666.9111 × 13−52.776 × 10105.0213 × 2010.7
5 × 1358.875 × 6−55.543 × 1299.83 *1 × 33.93
7 × 1352.956 × 20−56.0910 × 1297.72 *3 × 6−3.88
5 × 1122.715 × 20−68.011 × 1359.711 × 6−8.89
6 × 1314.484 × 8−77.0710 × 2059.48 *10 × 13−34.06
13 × 2010.74 × 11−79.33 *1 × 1050.083 × 20−36.13
5 × 710.037 × 11−80.91 *6 × 1217.616 × 20−56.09
4 × 76.77 × 20−82.68 *
4 × 5−1.511 × 20−92.33 *
6 × 7−4.856 × 11−100 *
* Corresponds to crosses in which the difference between hybrid and best parent is greater than the least significant difference (p < 0.05).
Table 7. Griffing’s analysis of variance of market yield for Set 1 and 2. DF = degrees of freedom. Pr = p-value.
Source of VariationDFSum of SquaresMean SquareF ValuePr > F
GCA70.219460.0313527.840.00001
Set 1SCA280.583120.0208265.210.00001
Error540.215840.003997
GCA60.522850.08714210.370.00001
Set 2SCA210.786640.0352614.460.00002
Error420.35261
Table 8. Quadratic components of GCA (Φg) and SCA (Φs) for market yield and the Baker’s ratio [14] for Set 1 and 2.
Quadratic ComponentsRatio
ΦgΦs2Φg/(2Φg + Φs)
Set 10.0027350.0168280.245313
Set 20.0087490.0290630.375808
Table 9. Correlations between heterosis of market yield and genetic distances of the parents for both sets of crosses.
Heterosisp-Value
Genetic distancesSet 1−0.220.10
Set 2−0.160.50
Publisher’s Note: MDPI stays neutral with regard to jurisdictional claims in published maps and institutional affiliations.

