
Temporal Recovery of Polymer-Coated Urea-N by Kentucky Bluegrass in the Field


Abstract
:1. Introduction
2. Materials and Methods
3. Results
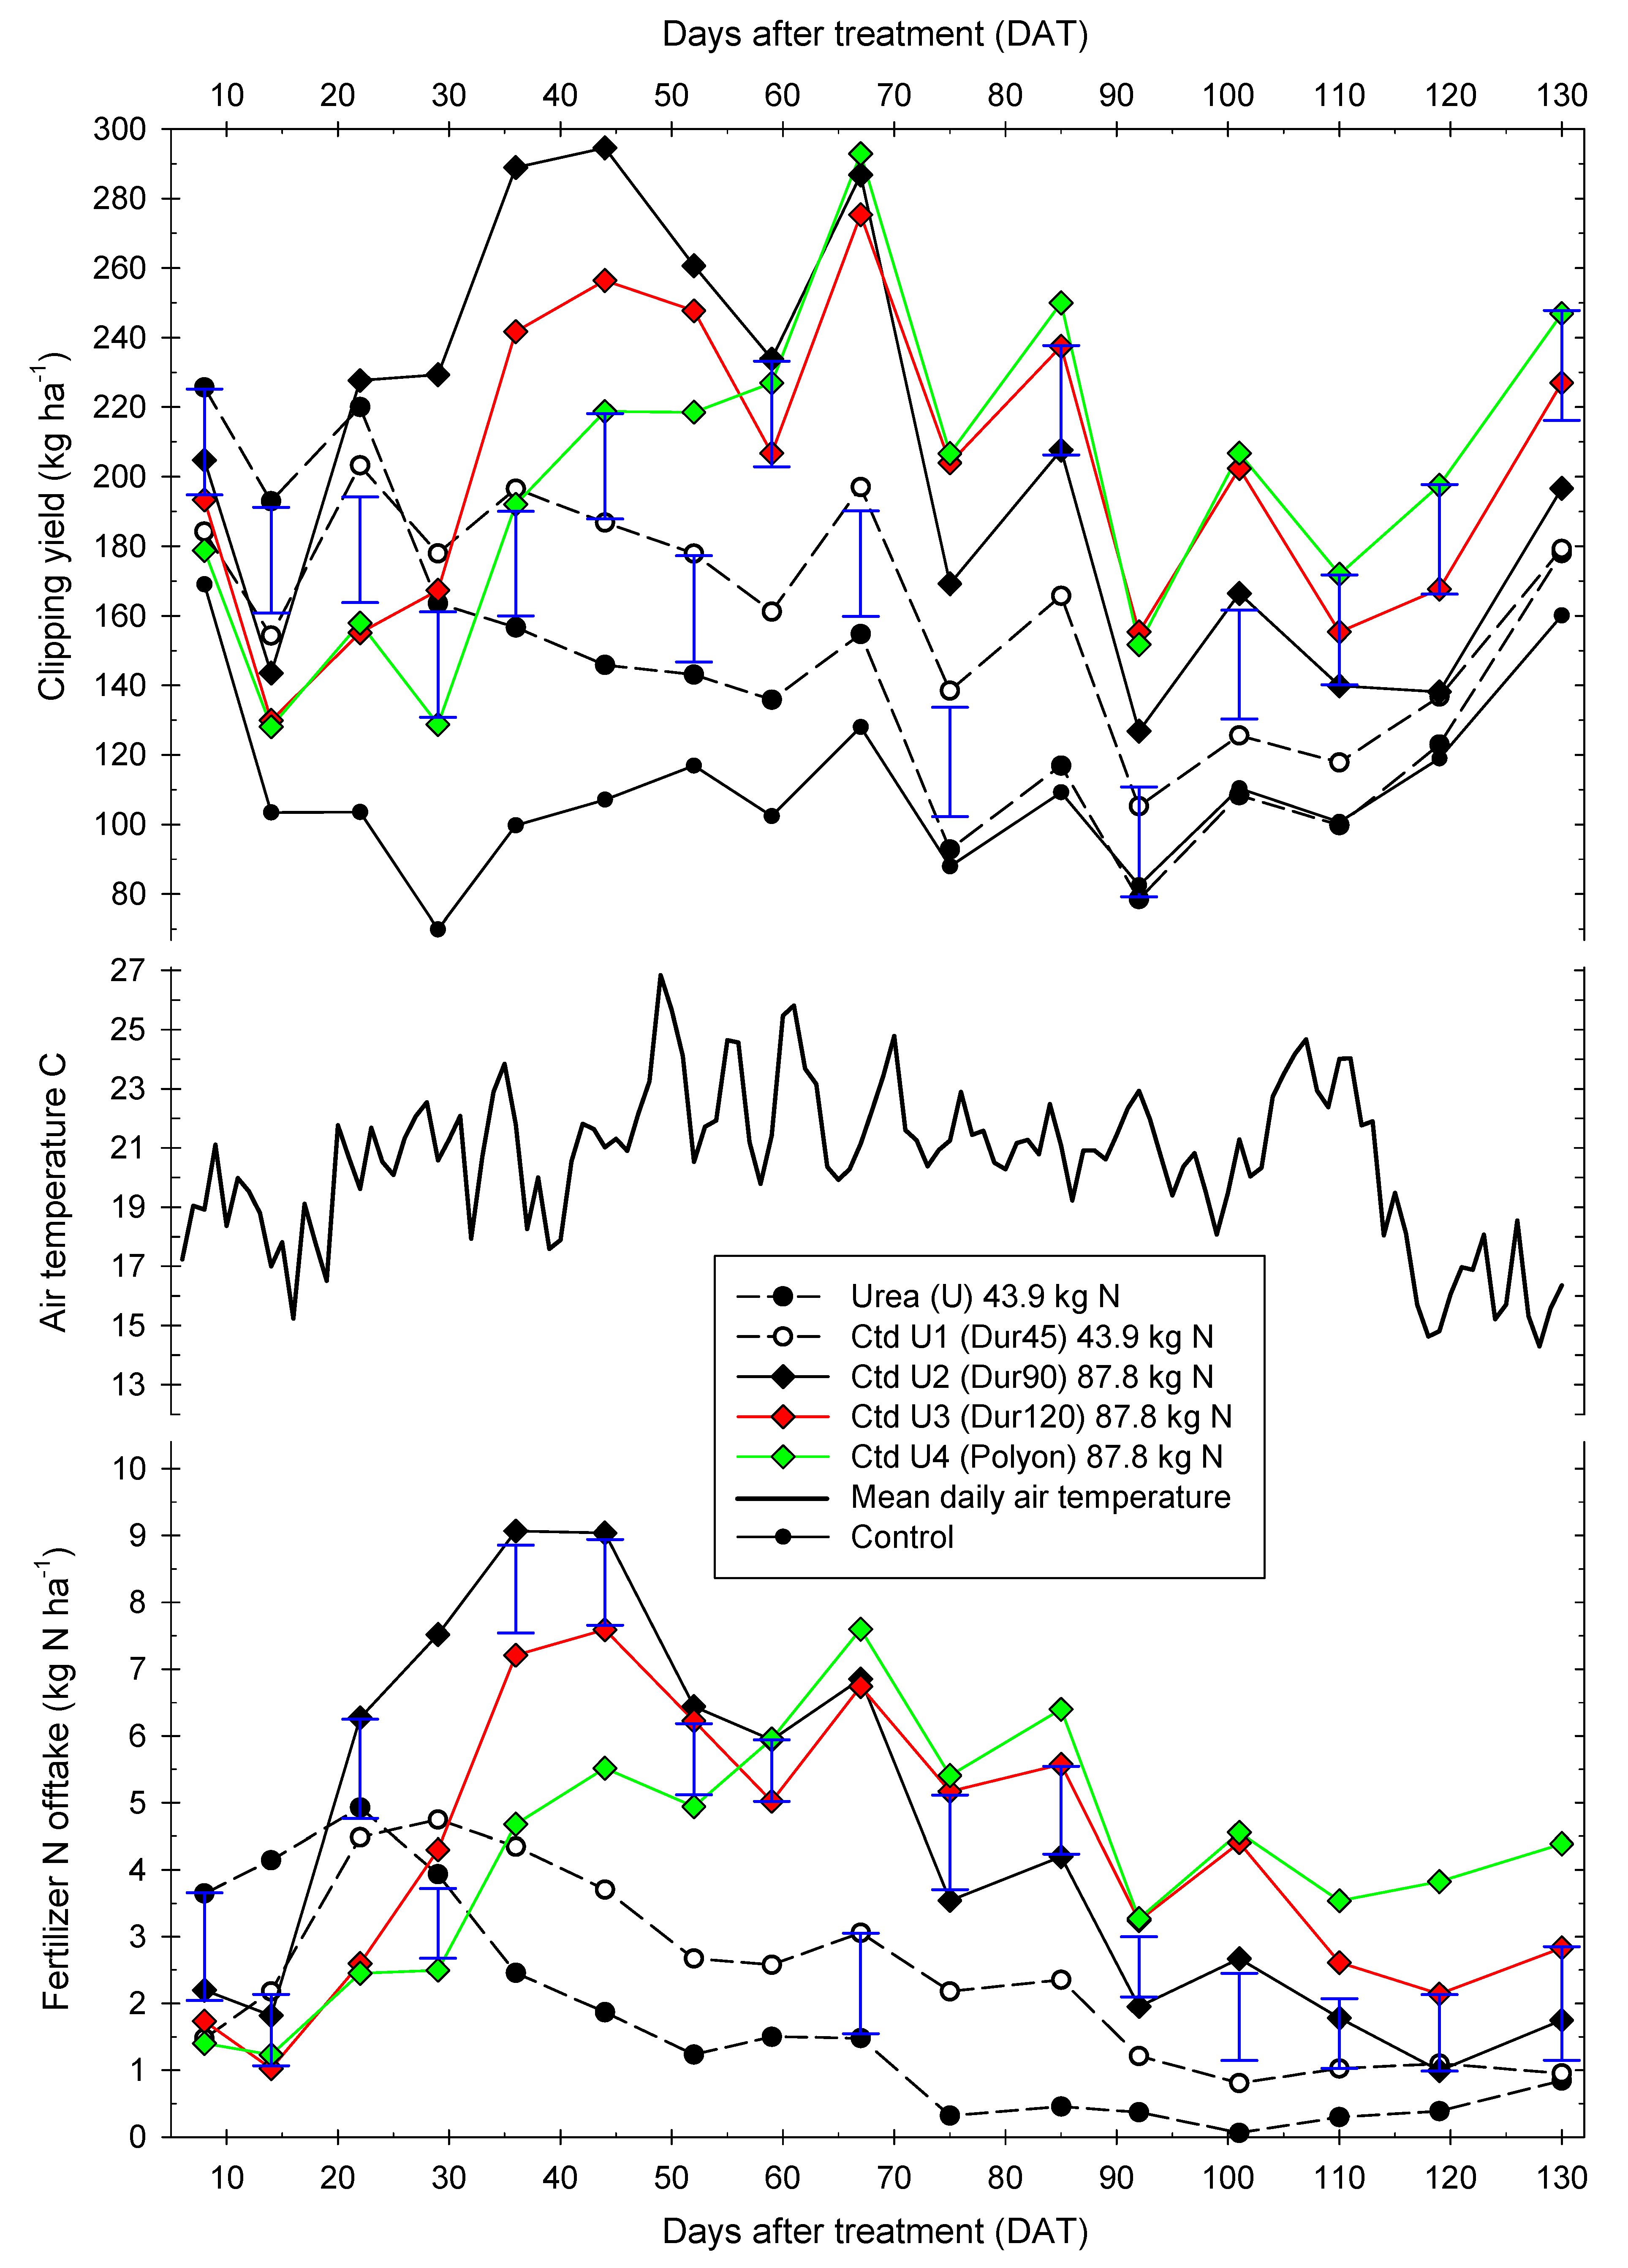
3.1. Clipping Yield
3.2. Fertilizer N Offtake
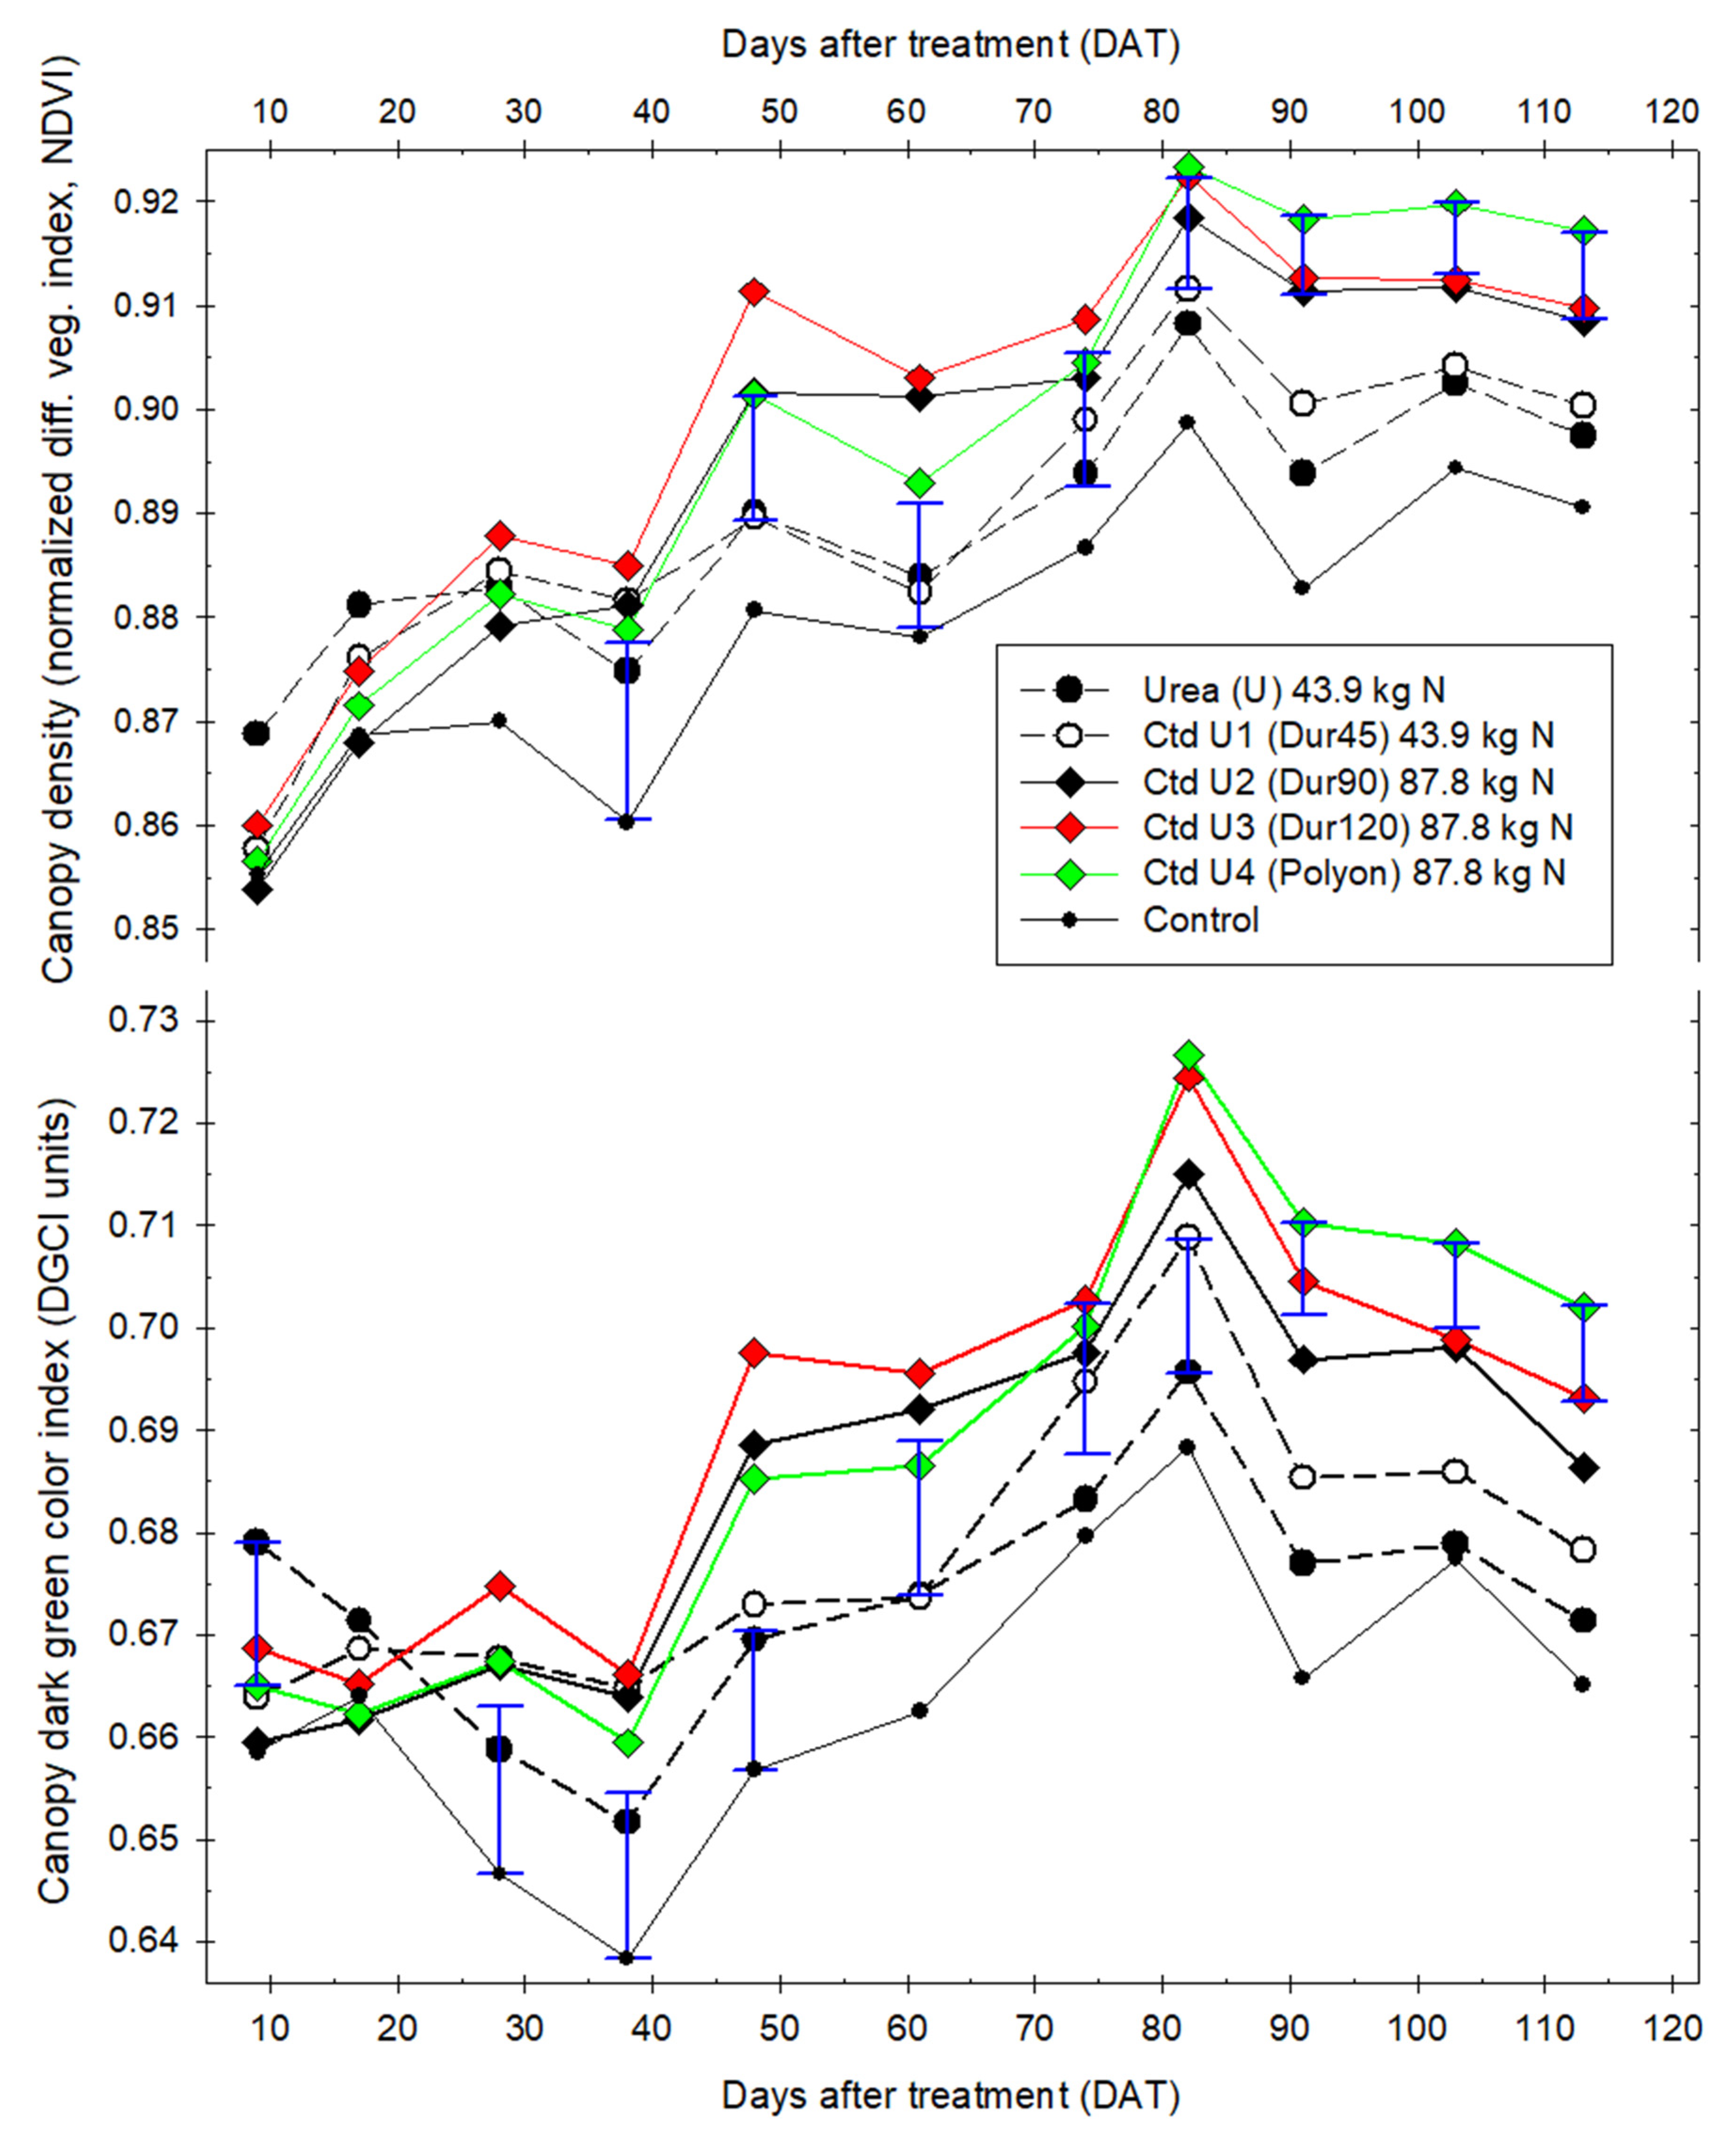
3.3. Canopy Characteristics
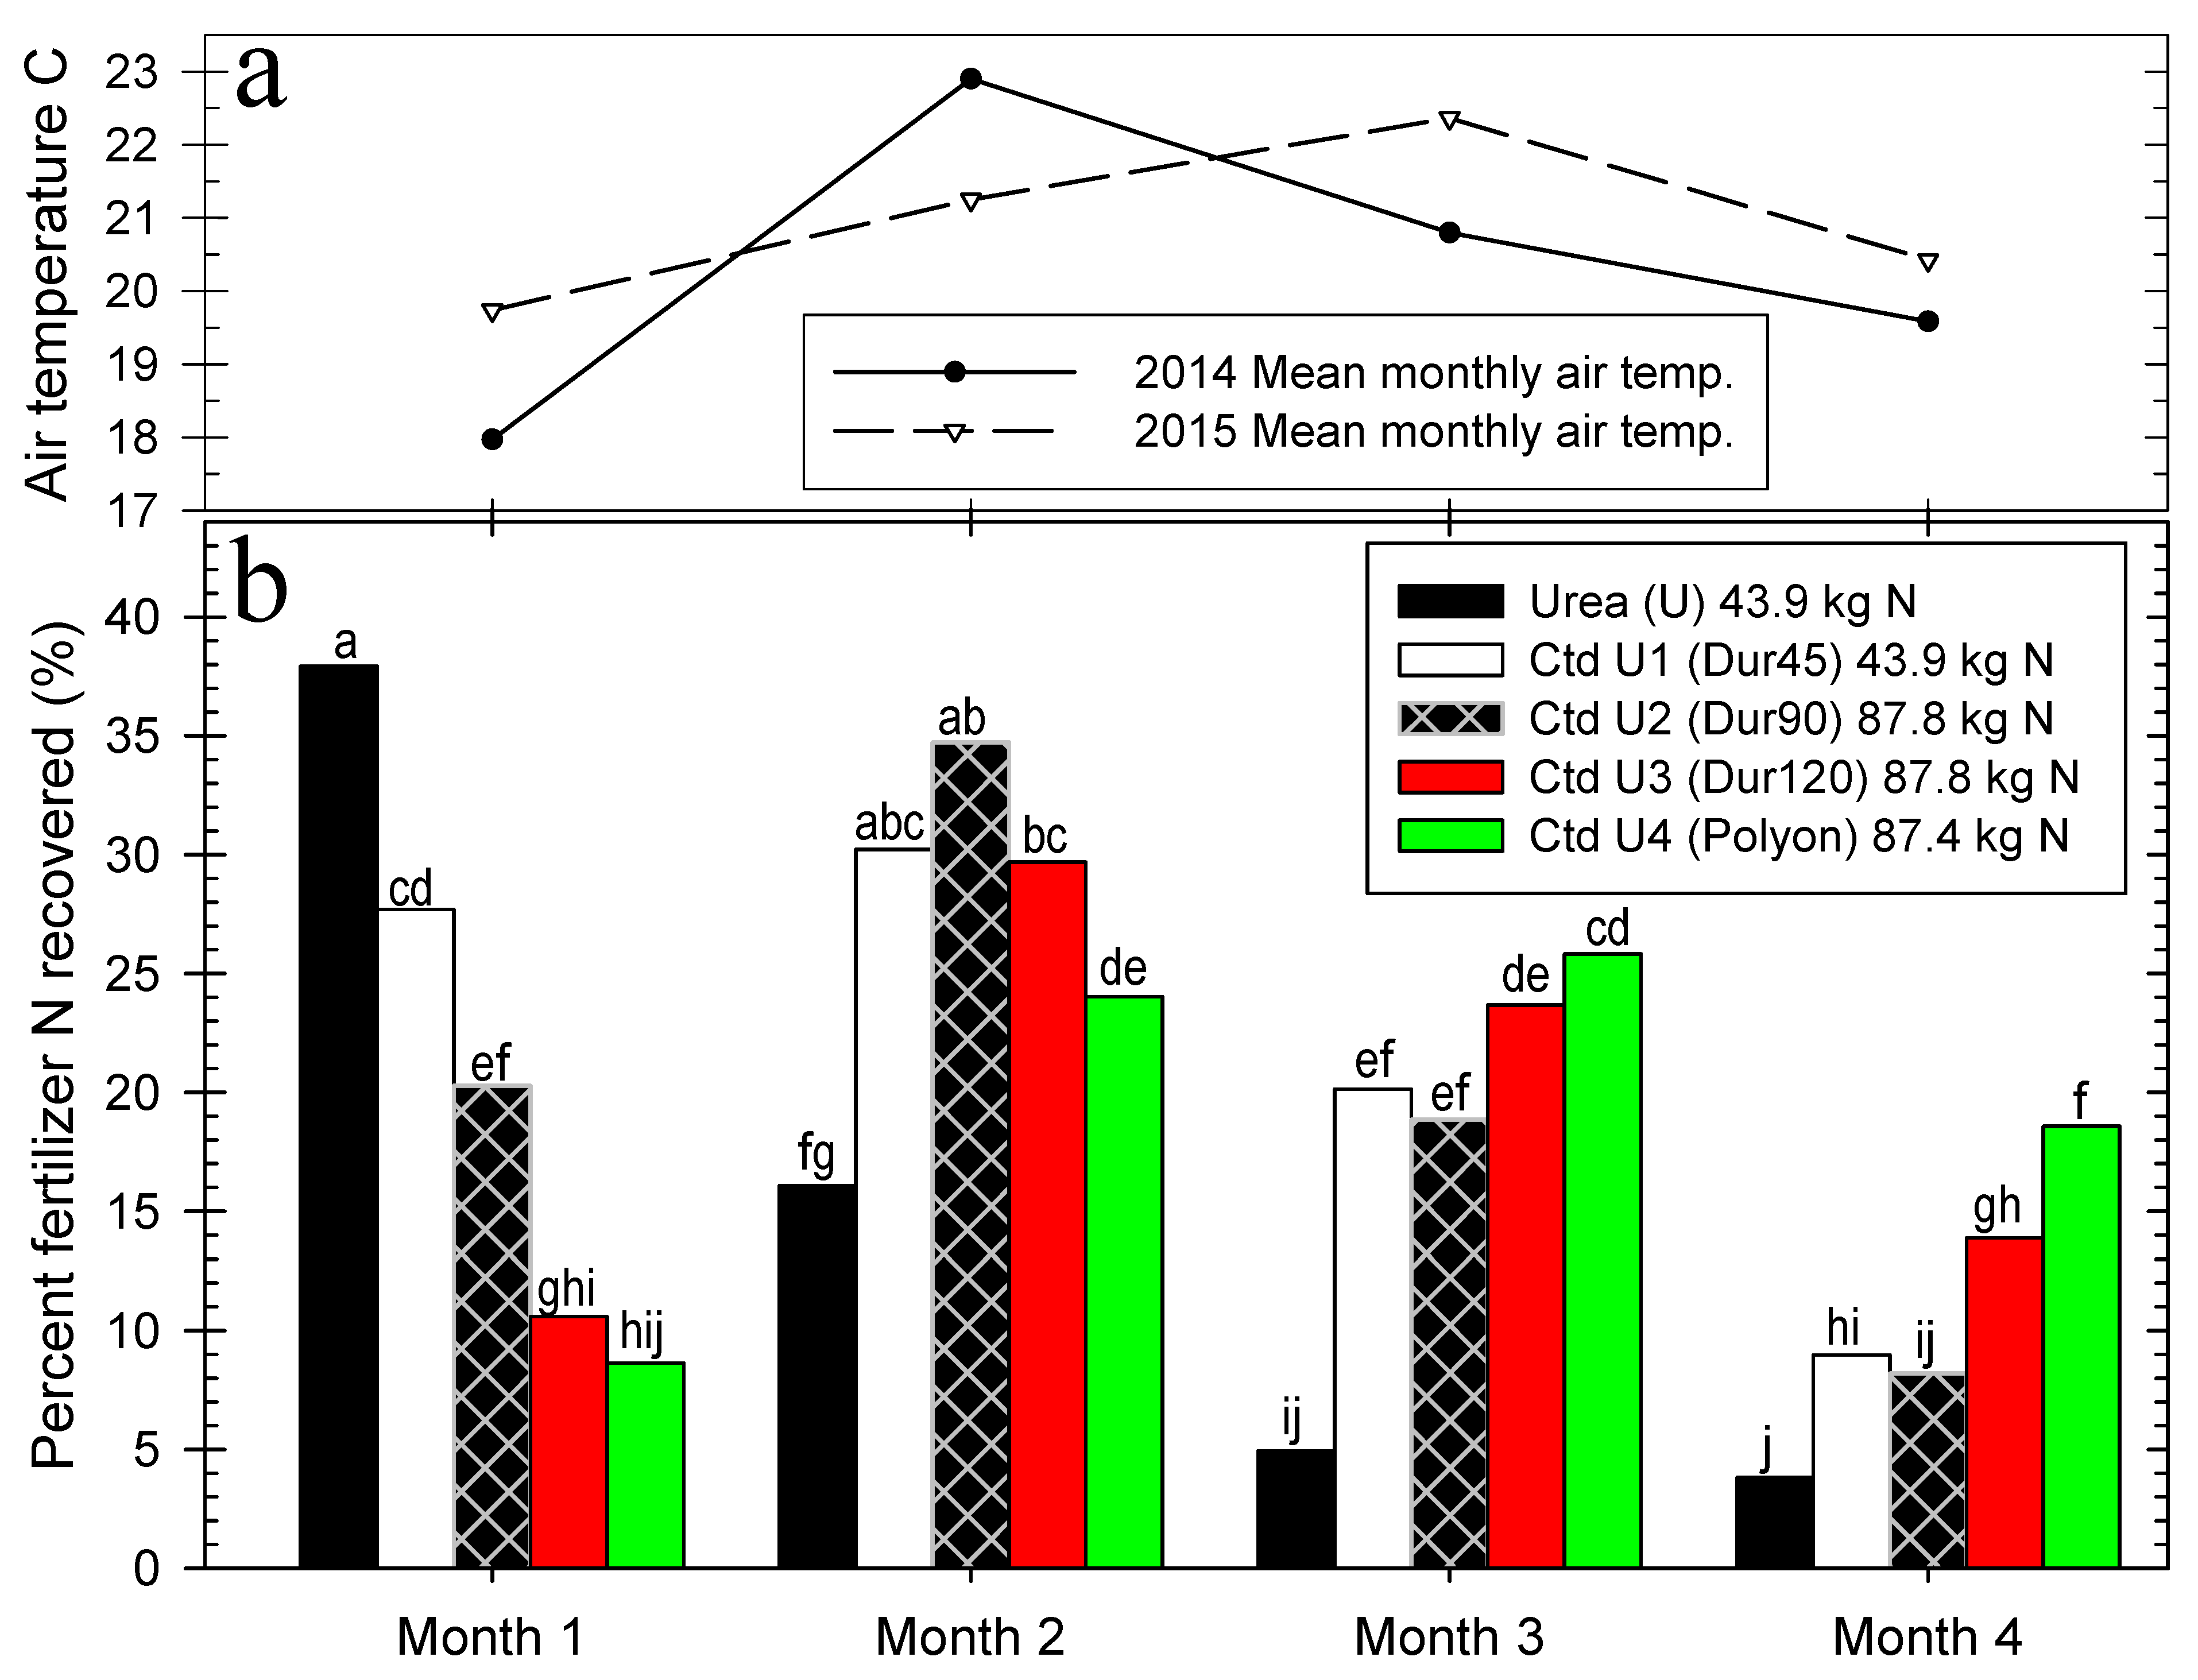
3.4. Monthly Percent Fertillizer N Recovery
3.5. Unaccounted Fertillizer N
4. Discussion
5. Conclusions
Funding
Institutional Review Board Statement
Informed Consent Statement
Data Availability Statement
Acknowledgments
Conflicts of Interest
References
- Carrow, R.N.; Waddington, D.V.; Rieke, P.E. Turfgrass Soil Fertility and Chemical Problems: Assessment and Management; John Wiley & Sons, Inc: Hoboken, NJ, USA, 2001. [Google Scholar]
- Skogley, C.R.; King, J.W. Controlled release nitrogen fertilization of turfgrass. Agron. J. 1968, 60, 61–64. [Google Scholar] [CrossRef]
- Boulin, G.M.; Rindt, D.W.; Moore, O.E. Sulfur-coated fertilizers for controlled release. Pilot-plant production. J. Agric. Food Chem. 1971, 19, 801–808. [Google Scholar] [CrossRef]
- Rindt, D.W.; Blouin, G.M.; Getsinger, J.G. Sulfur coating on nitrogen fertilizer to reduce dissolution rate. J. Agric. Food Chem. 1968, 16, 773–778. [Google Scholar] [CrossRef]
- Allen, S.E.; Hunt, C.M.; Terman, G.L. Nitrogen release from sulfur coated urea as affected by coating weight placement and temperature. Agron. J. 1971, 63, 529. [Google Scholar] [CrossRef]
- Volk, G.M.; Horn, G.C. Response curves of various turfgrasses to application of several controlled release nitrogen sources. Agron. J. 1975, 67, 201. [Google Scholar] [CrossRef]
- Detrick, J.H. Process for Producing Improved Sulfur-Coated Urea Slow Release Fertilizers. U.S. Patent No. 5,599,374, 2 February 1997. [Google Scholar]
- Carrow, R.N. Turfgrass response to slow-release nitrogen fertilizers. Agron. J. 1997, 89, 491–496. [Google Scholar] [CrossRef]
- Shaviv, A.; Raban, S.; Zaidel, E. Modeling controlled nutrient release from a population of polymer coated fertilizers: Statistically based model for diffusion release. Environ. Sci. Technol. 2003, 37, 2257–2261. [Google Scholar] [CrossRef]
- Medina, L.; Sartain, J.B.; Obreza, T.A.; Hall, W.L.; Thiex, N.J. Optimization and validation of an accelerated laboratory extraction method to estimate nitrogen release patterns of slow- and controlled-release fertilizers. J. AOAC Int. 2014, 97, 661–676. [Google Scholar] [CrossRef]
- Azeem, B.; KuShaari, K.; Man, Z.B.; Basit, A.; Tranh, T.H. Review on materials & methods to produce controlled release coated urea fertilizer. J. Con. Rel. 2014, 181, 11–21. [Google Scholar] [CrossRef]
- Davidson, D.; Gu, F.X. Materials for sustained and controlled release of nutrients and molecules to support plant growth. J. Agric. Food Chem. 2012, 60, 870–876. [Google Scholar] [CrossRef]
- Liu, M.; Liang, R.; Zhan, F.; Liu, Z.; Niu, A. Preparation of superabsorbent slow release nitrogen fertilizer by inverse suspension polymerization. Polym. Int. 2007, 56, 729–737. [Google Scholar] [CrossRef]
- Guo, M.; Liu, M.; Zan, F.; Wu, L. Preparation and properties of a slow-release membrane-encapsulated urea fertilizer with superabsorbent and moisture preservation. Ind. Eng. Chem. Res. 2005, 44, 4206–4211. [Google Scholar] [CrossRef]
- Liang, R.; Liu, M.; Wu, L. Controlled release NPK compound fertilizer with the function of water retention. React. Funct. Polym. 2007, 67, 769–779. [Google Scholar] [CrossRef]
- Wu, L.; Liu, M. Preparation and properties of chitosan-coated NPK compound fertilizer with controlled-release and water-retention. Carbohydr. Polym. 2008, 72, 240–247. [Google Scholar] [CrossRef]
- Adams, C.; Frantz, J.; Bugbee, B. Macro- and micronutrient-release characteristics of three polymer-coated fertilizers: Theory and measurements. J. Plant. Nutr. Soil Sci. 2013, 176, 76–88. [Google Scholar] [CrossRef]
- Guillard, K.; Kopp, K.L. Nitrogen fertilizer form and associated nitrate leaching from cool-season lawn turf. J. Environ. Qual. 2004, 33, 1822–1827. [Google Scholar] [CrossRef] [PubMed] [Green Version]
- Snyder, G.H.; Augustin, B.J.; Davison, J.M. Moisture sensor-controlled irrigation for reducing N leaching in bermudagrass turf. Agron. J. 1984, 76, 964. [Google Scholar] [CrossRef]
- Knight, E.C.; Guertal, E.A.; Wood, C.W. Mowing and nitrogen source effects on ammonia volatilization from turfgrass. Crop. Sci. 2007, 47, 1628–1634. [Google Scholar] [CrossRef]
- Schlossberg, M.J.; McGraw, B.A.; Sebring, R.L.; Hivner, K.R. Nitrogen recovery and loss from Kentucky bluegrass fertilized by conventional or enhanced-efficiency urea granules. Agronomy 2018, 8, 144. [Google Scholar] [CrossRef] [Green Version]
- Braun, R.C.; Bremer, D.J. Nitrous oxide emissions from turfgrass receiving different irrigation amounts and nitrogen fertilizer forms. Crop. Sci. 2018, 58, 1762. [Google Scholar] [CrossRef]
- Gillette, K.L.; Qian, Y.; Follett, R.F.; Del Grosso, S. Nitrous oxide emissions from a golf course fairway and rough after application of different nitrogen fertilizers. J. Environ. Qual. 2016, 45, 1788–1795. [Google Scholar] [CrossRef] [PubMed]
- Maggiotto, S.R.; Webb, J.A.; Wagner-Riddle, C.; Thurtell, G.W. Nitrous and nitrogen oxide emissions from turfgrass receiving different forms of nitrogen fertilizer. J. Environ. Qual. 2000, 29, 621–630. [Google Scholar] [CrossRef]
- LeMonte, J.J.; Jolley, V.D.; Summerhays, J.S.; Terry, R.E.; Hopkins, B.G. Polymer coated urea in turfgrass maintains vigor and mitigates nitrogen’s environmental impacts. PLoS ONE 2016, 11, e0146761. [Google Scholar] [CrossRef] [PubMed] [Green Version]
- Petrovic, A.M. The fate of nitrogenous fertilizers applied to turfgrass. J. Environ. Qual. 1990, 19, 1–14. [Google Scholar] [CrossRef] [Green Version]
- Lindsey, A.J.; Thoms, A.W.; McDaniel, M.D.; Christians, N.E. Evaluation of humic fertilizers applied at full and reduced nitrogen rates on Kentucky bluegrass quality and soil health. Agronomy 2021, 11, 395. [Google Scholar] [CrossRef]
- Bigelow, C.A.; Walker, K.S.; Hardebeck, G.A. Single fall applications of coated urea fertilizers produce a high quality Kentucky bluegrass turf. Online. Appl. Turfgrass Sci. 2007. [Google Scholar] [CrossRef]
- Gen. Assembly of Penn. Senate Bill No. 251, 2021 Session, The Fertilizer Act. Available online: https://www.legis.state.pa.us/cfdocs/legis/PN/Public/btCheck.cfm?txtType=PDF&sessYr=2021&sessInd=0&billBody=S&billTyp=B&billNbr=0251&pn=1183 (accessed on 14 February 2022).
- Holst, G.J.; Thygesen, M.; Pedersen, C.B.; Peel, R.G.; Barndt, J.; Christiensen, J.H.; Bonlokke, J.; Hertel, O.; Sigsgaard, T. Atmospheric ammonia, ammonium and incident asthma—A nationwide case-control study in Danish preschool children. Eur. Respir. J. 2017, 50, OA502. [Google Scholar] [CrossRef]
- Luchibia, A.O.; Suter, H.; Lam, S.K.; Menhenett, L.; He, J.Z. Temporal response of ureolytic and ammonia-oxidizing microbes and pasture yield to urea and NBPT at Leigh Creek of Victoria in Australia. Appl. Soil Ecol. 2021, 164, 103922. [Google Scholar] [CrossRef]
- Dennis, R.L.; Schwede, D.B.; Bash, J.O.; Pleim, J.E.; Walker, J.T.; Foley, K.M. Sensitivity of continental United States atmospheric budgets of oxidized and reduced nitrogen to dry deposition parametrizations. Philos. Trans. R. Soc. Lond. B Biol. Sci. 2013, 368, 1621. [Google Scholar] [CrossRef]
- Paulot, F.; Jacob, D.J. Hidden cost of U.S. agricultural exports: Particulate matter from ammonia emissions. Environ. Sci. Technol. 2014, 48, 903–908. [Google Scholar] [CrossRef]
- Smith, A.P.; Johnson, I.R.; Schwenke, G.; Lam, S.K.; Suter, H.C.; Eckard, R.J. Predicting ammonia volatilization from fertilized pastures used for grazing. Agric. For. Meteorol. 2020, 287, 14. [Google Scholar] [CrossRef]
- Stokstad, E. Ammonia pollution from farming may exact hefty health costs. Science 2014, 343, 238. [Google Scholar] [CrossRef] [PubMed]
- de Paula, B.V.; Vitto, B.B.; Sete, P.B.; Trapp, T.; Zalamena, J.; de Melo, G.W.B.; Baldi, E.; Toselli, M.; Rozane, D.E.; Brunetto, G. Annual and residual urea nitrogen contribution to the nutrition of peach trees (Prunus persica L.) grown under subtropical climate. Sci. Hortic. 2021, 284, 1–6. [Google Scholar] [CrossRef]
- Henning, S.W.; Branham, B.E.; Mulvaney, R.L. Response of turfgrass to urea-based fertilizers formulated to reduce ammonia volatilization and nitrate conversion. Biol. Fertil. Soils 2013, 49, 51–60. [Google Scholar] [CrossRef]
- Zhu, Q.; Schlossberg, M.J.; Bryant, R.B. Foliar fertilization–induced injury and recovery of a creeping bentgrass putting green. J. Plant Nutr. 2016, 39, 1589–1596. [Google Scholar] [CrossRef]
- Karcher, D.E.; Richardson, M.D. Quantifying turfgrass color using digital image analysis. Crop. Sci. 2003, 43, 943–951. [Google Scholar] [CrossRef]
- Baret, F.; Guyot, G. Potentials and limits of vegetation indices for LAI and APAR assessment. Remote Sens. Environ. 1991, 35, 161–173. [Google Scholar] [CrossRef]
- Zhu, Q.; Schlossberg, M.J.; Bryant, R.B.; Schmidt, J.P. Creeping bentgrass putting green response to foliar nitrogen fertilization. Agron. J. 2012, 104, 1589–1594. [Google Scholar] [CrossRef]
- McIntosh, M.S. Analysis of combined experiments. Agron. J. 1983, 75, 153–155. [Google Scholar] [CrossRef]
- DeKlerk, N.H. Repeated warnings re repeated measures. Aust. N. Z. J. Med. 1986, 16, 637–638. [Google Scholar] [CrossRef]
- Matthews, J.N.S.; Altman, D.G.; Campbell, M.J.; Royston, P. Analysis of serial measurements in medical research. Br. Med. J. 1990, 300, 230–235. [Google Scholar] [CrossRef] [Green Version]
- Piepho, H.P.; Eckl, T. Analysis of series of variety trials with perennial crops. Grass Forage. Sci. 2014, 69, 431–440. [Google Scholar] [CrossRef]
- Clewer, A.G.; Scarisbrick, D.H. Practical Statistics and Experimental Design for Plant and Crop Science; Wiley & Sons: Chichester, UK, 2000. [Google Scholar]
- Marschner, P. Mineral Nutrition of Higher Plants, 3rd ed.; Elsevier: San Diego, CA, USA, 2012. [Google Scholar]
- Lindsey, A.J.; Thoms, A.W.; McDaniel, M.D.; Christians, N.E. Plant-available soil nitrogen fluxes and turfgrass quality of Kentucky bluegrass fertilized with humic substances. Crop. Sci. 2021, 61, 4416–4424. [Google Scholar] [CrossRef]
- Miltner, E.D.; Branham, B.E.; Paul, E.A.; Rieke, P.E. Leaching and mass balance of 15N-labeled urea applied to Kentucky bluegrass turf. Crop. Sci. 1996, 36, 1427–1433. [Google Scholar] [CrossRef]
- Tassinari, A.; da Silva, L.O.S.; Drescher, G.L.; de Oliveira, R.A.; Baldi, E.; de Melo, G.W.B.; Zalamena, J.; Mayer, N.A.; Giacomini, S.J.; Carranca, C.L.D.F.; et al. Contribution of cover crop residue decomposition to peach tree nitrogen nutrition. J. Soil Sci. Plant Nutr. 2021, 21, 2124–2136. [Google Scholar] [CrossRef]
- Frank, K.W.; O’Reilly, K.M.; Crum, J.R.; Calhoun, R.N. The fate of nitrogen applied to a mature Kentucky bluegrass turf. Crop. Sci. 2006, 46, 209–215. [Google Scholar] [CrossRef]

| Nitrogen (N) Fertilizer Treatment | Rate ha−1 | Component(s) Description, % Inclusion | Manufacturer | |
|---|---|---|---|---|
| Name | Grade | |||
| Urea | 46–0–0 | 43.9 kg N | 100% water soluble urea-N | Alfa-Aesar, Ward Hill, MA, USA |
| Duration 45 | 44–0–0 | 43.9 kg N | 100% polymer-coated controlled release urea-N | Koch Agronomic Services, Wichita, KS, USA |
| Duration 90 | 44–0–0 | 87.8 kg N | ||
| Duration 120 | 43–0–0 | 87.8 kg N | ||
| Polyon | 43–0–0 | 87.8 kg N | Pursell Technologies, Sylacauga, AL, USA | |
| Source | df | Clipping Yield | df | Fertilizer N Offtake | df | Canopy | ||||
|---|---|---|---|---|---|---|---|---|---|---|
| Num | Den | Num | Den | Num | Den | DGCI | NDVI | |||
| p value | p value | p value | ||||||||
| Treatment (TRT) | 5 | 8 | <0.001 | 4 | 6 | <0.001 | 5 | 8 | 0.001 | 0.002 |
| Days after TRT (DAT) | 15 | 30 | ns | 15 | 30 | <0.001 | 10 | 20 | 0.006 | 0.004 |
| TRT × DAT | 75 | 113 | <0.001 | 60 | 83 | <0.001 | 50 | 76 | 0.001 | 0.001 |
| Fertilizer | kg N·ha−1 | Mean, kg·ha−1 | Mean, kg·ha−1 | Mean, index | ||||||
| Control | 0 | 111 | – | 0.664 | 0.879 | |||||
| Urea, U | 43.9 | 146 | 1.74 | 0.674 | 0.889 | |||||
| Ctd U1, Dur45 | 43.9 | 163 | 2.43 | 0.678 | 0.890 | |||||
| Ctd U2, Dur90 | 87.8 | 207 | 4.50 | 0.684 | 0.894 | |||||
| Ctd U3, Dur120 | 87.8 | 201 | 4.28 | 0.690 | 0.899 | |||||
| Ctd U4, Polyon | 87.8 | 198 | 4.23 | 0.688 | 0.897 | |||||
| LSD5% | 15 | 0.51 | 0.007 | 0.008 | ||||||
Publisher’s Note: MDPI stays neutral with regard to jurisdictional claims in published maps and institutional affiliations. |
© 2022 by the author. Licensee MDPI, Basel, Switzerland. This article is an open access article distributed under the terms and conditions of the Creative Commons Attribution (CC BY) license (https://creativecommons.org/licenses/by/4.0/).
Share and Cite
Schlossberg, M.J. Temporal Recovery of Polymer-Coated Urea-N by Kentucky Bluegrass in the Field. Horticulturae 2022, 8, 207. https://doi.org/10.3390/horticulturae8030207
Schlossberg MJ. Temporal Recovery of Polymer-Coated Urea-N by Kentucky Bluegrass in the Field. Horticulturae. 2022; 8(3):207. https://doi.org/10.3390/horticulturae8030207
Chicago/Turabian StyleSchlossberg, Maxim J. 2022. "Temporal Recovery of Polymer-Coated Urea-N by Kentucky Bluegrass in the Field" Horticulturae 8, no. 3: 207. https://doi.org/10.3390/horticulturae8030207
APA StyleSchlossberg, M. J. (2022). Temporal Recovery of Polymer-Coated Urea-N by Kentucky Bluegrass in the Field. Horticulturae, 8(3), 207. https://doi.org/10.3390/horticulturae8030207