Article

Prediction of the Potential Distribution of Vaccinium uliginosum in China Based on the Maxent Niche Model

1
College of Forestry, Guizhou University, Guiyang 550025, China
2
College of Agriculture, Guizhou University, Guiyang 550025, China
*
Author to whom correspondence should be addressed.
Horticulturae 2022, 8(12), 1202; https://doi.org/10.3390/horticulturae8121202
Submission received: 22 October 2022 / Revised: 1 December 2022 / Accepted: 13 December 2022 / Published: 15 December 2022

Abstract

:
Vaccinium uliginosum L. is a wild fruit tree, mainly distributed in the extremely cold climate region of China, such as the Greater Khingan Mountains, Lesser Khingan Mountains, and Changbai Mountains. Most fruit trees are largely unsustainable in these regions, but wild V. uliginosum thrives in the region. Therefore, it is necessary to protect the precious wild V. uliginosum resources. With the effect of global warming, the suitable habitat of V. uliginosum has also changed. A total of 287 pieces of data with 22 environmental variables were collected on the geographical distribution of wild V. uliginosum. The Maxent model was applied to predict the potential distribution of V. uliginosum in China under different climate scenarios (Socioeconomic Pathways 1-2.6 (SSP1-2.6), SSP2-4.5, SSP3-7.0 and SSP5-8.5) in the current and future two periods (the 2050s and 2070s). The predicted results show that the distribution and area of the suitable area-change range is small. The results show that the cumulative contribution rates of BIO07 (annual temperature range), BIO12 (annual precipitation), and BIO10 (mean temperature of warmest quarter) reach 74.1%, indicating that temperature and precipitation are the key factors affecting the distribution of V. uliginosum. This study can provide a reference for relevant departments to take conservation measures with respect to climate change and the adaptation of V. uliginosum to habitat changes.

1. Introduction

The geographic distribution of species is not static but rather constantly changes. Changes in the species distribution depend largely on climate changes [1,2,3,4,5]. Human activities directly or indirectly affect the global climate [6]. This influence has gradually intensified in the past century, resulting in rising global greenhouse gas emissions, a hole in the ozone layer, increasing temperatures, and frequent extreme weather events, which have greatly affected species distribution [7,8,9]. Studies have shown that climate warming will cause a significant increase in the optimal altitudes of species. Climate change is an issue that cannot be ignored [10,11]. In this context, under the influence of climate change, species distribution has been a hot research topic at home and abroad. On 26 October 2022, the World Meteorological Organization released its Greenhouse Gas Bulletin, which reported that the warming effect of greenhouse gases on the climate increased by nearly 50% between 1990 and 2021.
The Blue Book of Climate Change in China (2022) shows that, from 1961 to 2021, China’s average annual precipitation showed an increasing trend [12]. From 1951 to 2021, the average annual surface temperature in China showed a significant upward trend. From 1961 to 2021, China’s average annual precipitation increased by an average of 5.5 mm every 10 years. Since 2012, the annual precipitation has continued to be excessive. In 2021, the national average precipitation was 6.7% more than the usual value, of which the average precipitation in North China was the highest since 1961, and the average precipitation in South China was the lowest in the past 10 years. From 1951–2021, China’s surface temperature increased at a speed of 0.26 °C/10 years.
According to the distribution data and environmental factor variables of known species, the ecological niche model is constructed using mathematical theoretical relationships. The specific ecological needs of the species are deduced, the relationship between the environmental factor variables and the species distribution is quantitatively analyzed, and the critical environmental factors and habitat preferences influencing the distribution of the species are obtained. The calculation results are mapped to the geographical space to predict the actual distribution and potential species distribution [13]. The mainstream niche models are GARP (Genetic Algorithm for Rule-Set Prediction) [14], ENFA (ecological-niche factor analysis) [15], BIOCLIM (bioclimatic modeling) [16], and Maxent (Maximum Entropy) [17]. Among them, the results predicted by the Maxent model are more accurate. Even with few distribution points for the target species, the Maxent model can obtain more accurate predictions [18]. Since Phillips proposed the model, Maxent has been widely used in the study of invasive alien species [19,20], flora and fauna conservation [21], the effect of global climate change on species distribution [22], etc.
Vaccinium uliginosum, a plant of the genus Vaccinium, belongs to the Ericaceae family. China has abundant wild resources of V. uliginosum, and there are wild populations in Northeast, Southwest, and South China. The Greater Khingan Mountains region, the Lesser Khingan Mountains region, and the Changbai Mountains have the largest populations, accounting for about 90% of the country’s wild resources [23,24,25]. The Greater Khingan Mountains region is characterized by extreme cold, and fruit cultivars basically cannot be cultivated, but wild V. uliginosum can flourish in this region, so it is necessary to protect the precious resource of wild V. uliginosum.

2. Materials and Methods

2.1. Species Distribution

The distribution data comes from the China Virtual Herbarium (http://www.cvh.ac.cn/, last accessed on 30 August 2022), and the CNKI Chinese Database (http://www.cnki.net/, last accessed on 30 August 2022).
The obtained V. uliginosum sample points were strictly screened to assure the accuracy of the sample point information. First, the points with accurate Latin names and detailed latitudinal and longitudinal information were selected; the points with Latin name errors, incomplete latitudinal and longitudinal information, or duplicate points were excluded. Second, using Google Earth, further latitudinal and longitudinal positioning was performed for those points with exact place names, but which lacked latitudes and longitudes (Google Inc., Mountain View, CA, USA), 287 V. uliginosum sample points were finally obtained, and the distribution data of V. uliginosum were saved in a CSV format. Redundant filtering of raw data was performed using ENMTools 1.4 to avoid spatial autocorrelation resulting from geographic aggregation. Finally, 256 valid distribution points were obtained to establish the model.

2.2. Environmental Data

Geographic data were obtained from the National Basic Geographic Information System (http://nfgis.nsdi.gov.cn/, last accessed on 30 September 2022) as a base map of 1:4,000,000 Chinese administrative divisions. Current (1960–1990), future 2050s (2041–2060), and 2070s (2061–2080) BIOCLIM variable data were obtained from the World Climate Database (http://www.worldclim.org/, last accessed on 30 September 2022). Elevation (Ele) data were also obtained from the World Climate Database (http://www.worldclim.org/, last accessed on 30 November 2022). Land cover data (Land use) were taken from the Center for Resources and Environment Science and Data Center of China (https://www.resd.cn/, last accessed on 30 November 2022). Soil types (Sym90) were derived from the Food and Agriculture Organization of the United Nations Harmonized World Soil Database v1.2 dataset. A total of 22 environmental variables were used in this study (Table 1). The future climate scenarios selected were taken from the BCC-CSM2-MR climate system model developed by the National Climate Center, and four Shared Socioeconomic Pathway (SSP) scenarios from that model were adopted, which describe the quantitative relationship between the degree of climate change and the path of social and economic development. The spatial resolution of the above-mentioned data is 2.5 arc-minutes. The four climate scenarios are SSP1-2.6, SSP2-4.5, SSP3-7.0, and SSP5-8.5, respectively representing four greenhouse-gas-emission concentration scenarios, from low to high.
The predicted distributions were overfitted due to the multicollinearity between environmental variables. The correlation function in ENMTools 1.4 was applied to calculate the correlations between environmental variables, and 0.80 was used as a threshold to determine the significance of the correlation [22,26]. Environmental variables of the final selection model were BIO07, BIO12, BIO10, BIO19, Ele, Land use and Sym90 (Table 1).

2.3. Model Building and Data Processing

The feature classes and regularization multipliers were optimized via the R 3.6.2 program and its kuenm software package [27,28]. On the basis of the criteria for choosing the best model by Cobos et al. [29], statistical significance indicates that the deletion rate is below the threshold (0.05), and the AICC (Akaike information criterion with small-sample correction) value is lower than 2 [22]. Thus, the feature class was selected as PH (P: Product features, H: Hinge features) with a regularization multiplier of 0.4 as V. uliginosum’s final Maxent model. The processed distribution data and environmental data were imported into the Maxent model software, and 70% of the distribution points were set as training data while 30% were set as random test percentages [22]. The maximum number of iterations was set to 5000, the thread was set to 10, and the number of repetitions was also set to 10. Other parameters were set to the default values [22].
A forecast map of the applicable region and the low-impact region for the current (1960–1990) and future periods (the 2050s and 2070s) was created using ArcGIS 10.3 [30,31] software, and the applicable region was calculated. The production results of Maxent were imported into ArcGIS 10.3 and analyzed with the map of China as the underlying layer. The threshold was selected based on the research object and the needs. Previous studies have proved that a larger threshold should be selected for model prediction when invasive or potentially harmful species are studied as the object. This approach allows confined resources to be allocated to the regions where they are most necessary, while a smaller threshold should be chosen to protect endangered species when they are the research subject [32,33,34]. Referring to the Fourth Assessment Report of the Intergovernmental Panel on Climate Change (IPCC) report’s methodology for assessing likelihood, a relatively small threshold (0.2) was selected as the criterion for appropriate regional classification. There are four grades of suitability scaling: unsuitable habitats (p < 0.2), minimally suitable habitats (0.2 ≤ p < 0.4), moderately suitable habitats (0.4 ≤ p < 0.6), and highly suitable habitats (p ≥ 0.6).

3. Results

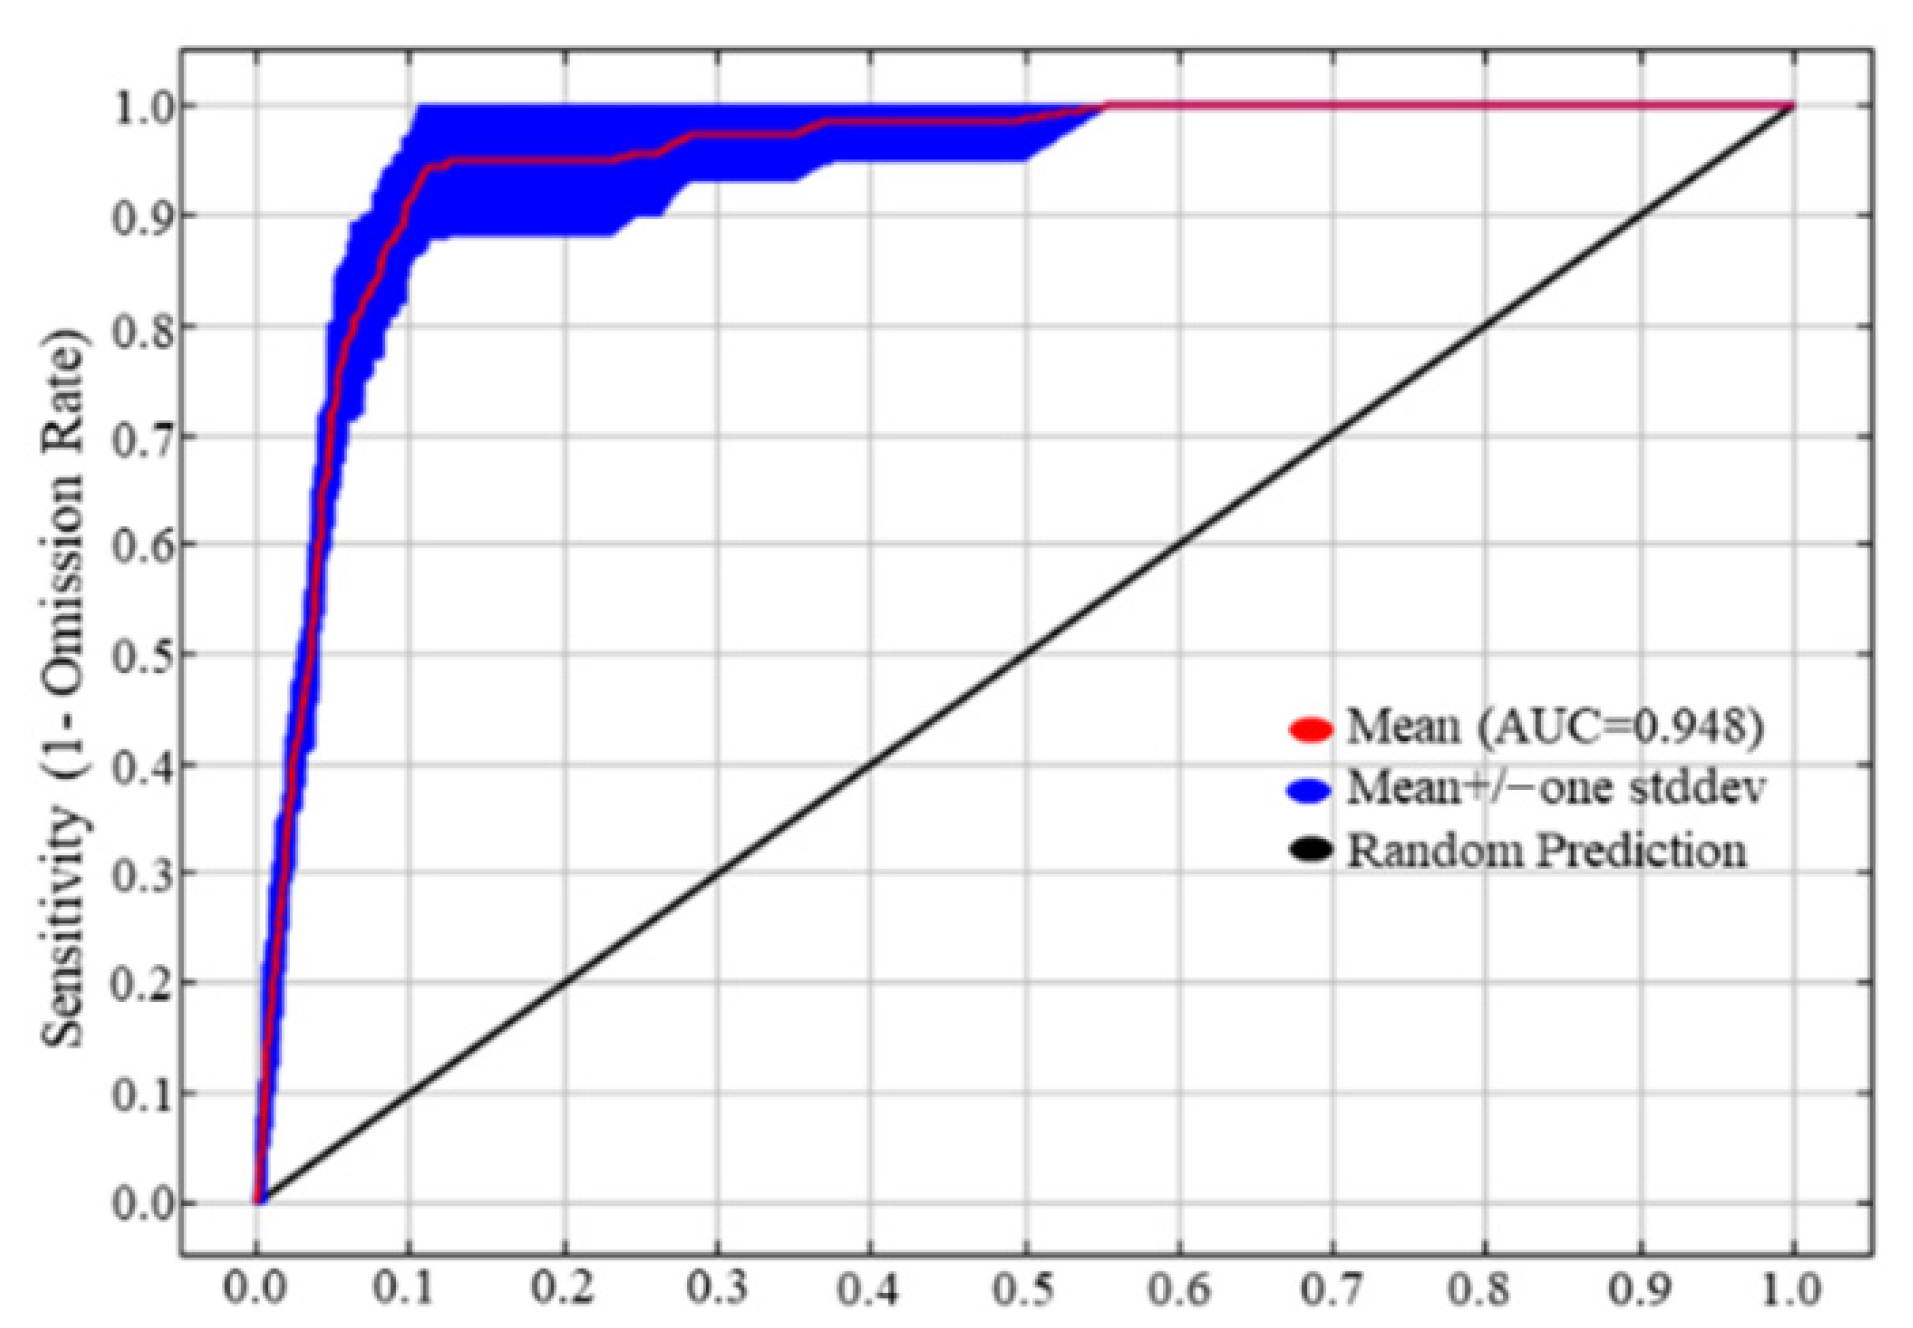
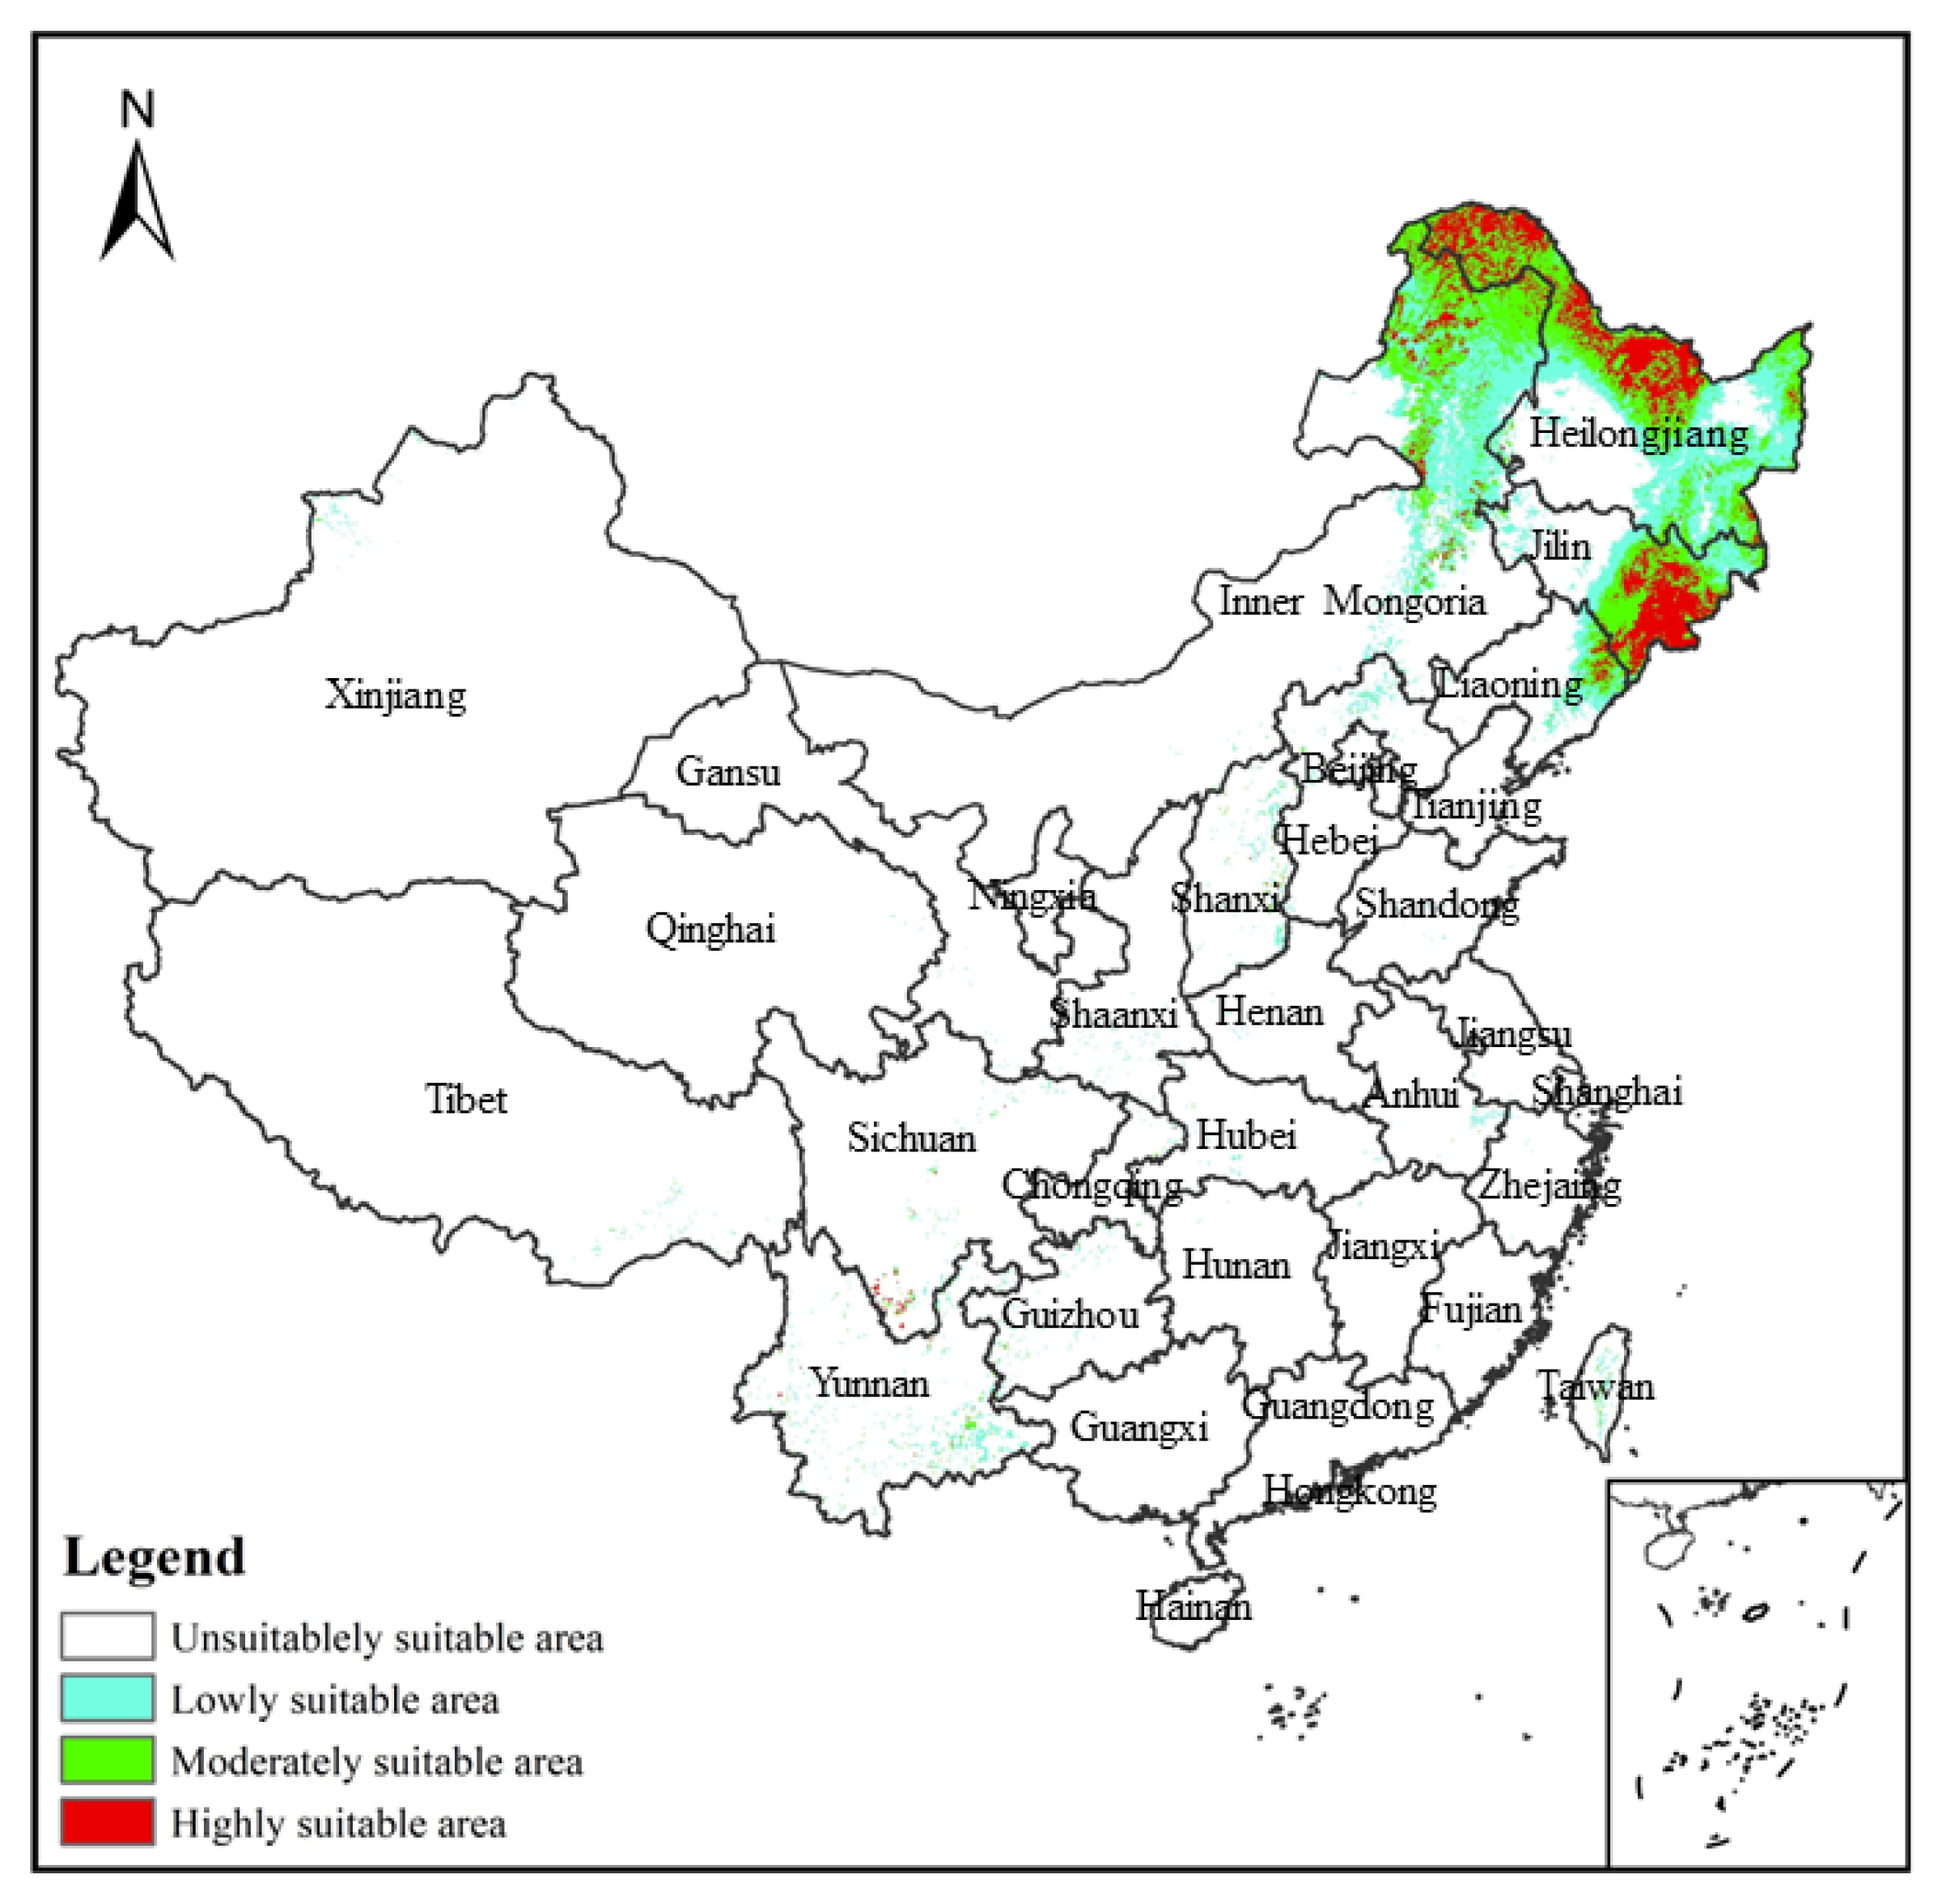
3.1. Model Prediction Accuracy Test and Its Prediction of the Potential Distribution Region of V. uliginosum in the Contemporary Region

Receiver operating characteristic (ROC) curve analysis has generally been applied in the evaluation of potential species distribution as predicted by models and is currently a highly recognized diagnostic test evaluation index [30,31,32]. The region under the ROC curve is the area under the curve (AUC) [32,34]. ROC and AUC were used to evaluate the accuracy of the model’s prediction results. AUC values are scored between 0–1: 0.5–0.6 is a failure, 0.6–0.7 is poor, 0.7–0.8 is average, 0.8–0.9 is good, and 0.9–1 is excellent. The closer the value is to 1, the higher the accuracy of the model’s prediction. The ROC curve of the simulation output of the Maxent model is presented in Figure 1, in which the average AUC value is 0.948, indicating that the prediction of the model is accurate and reliable.
The distribution of V. uliginosum under the contemporary climatic conditions predicted by the Maxent model is presented in Figure 2. The highly suitable habitats for V. uliginosum are the Greater Khingan Mountains and the Lesser Khingan Mountains regions; the moderately suitable habitats are northeastern Inner Mongolia, central Heilongjiang and southeastern Jilin; the minimally suitable habitats are Sichuan Province, Guizhou Province, eastern Yunnan Province, Shanxi Province, Hebei Province, Beijing Province, and Taiwan Province. The total suitable habitat for life is predicted under contemporary climatic conditions to be 83.80 × 10⁴ km2; the area of the minimally suitable habitats is 36.48 × 10⁴ km2; the area of the moderately suitable habitats is 31.43 × 10⁴ km2; the area of the highly suitable habitats is 15.89 × 10⁴ km2. The distribution predicted by the Maxent model is wider than the actual geographical distribution of V. uliginosum (Table 2).

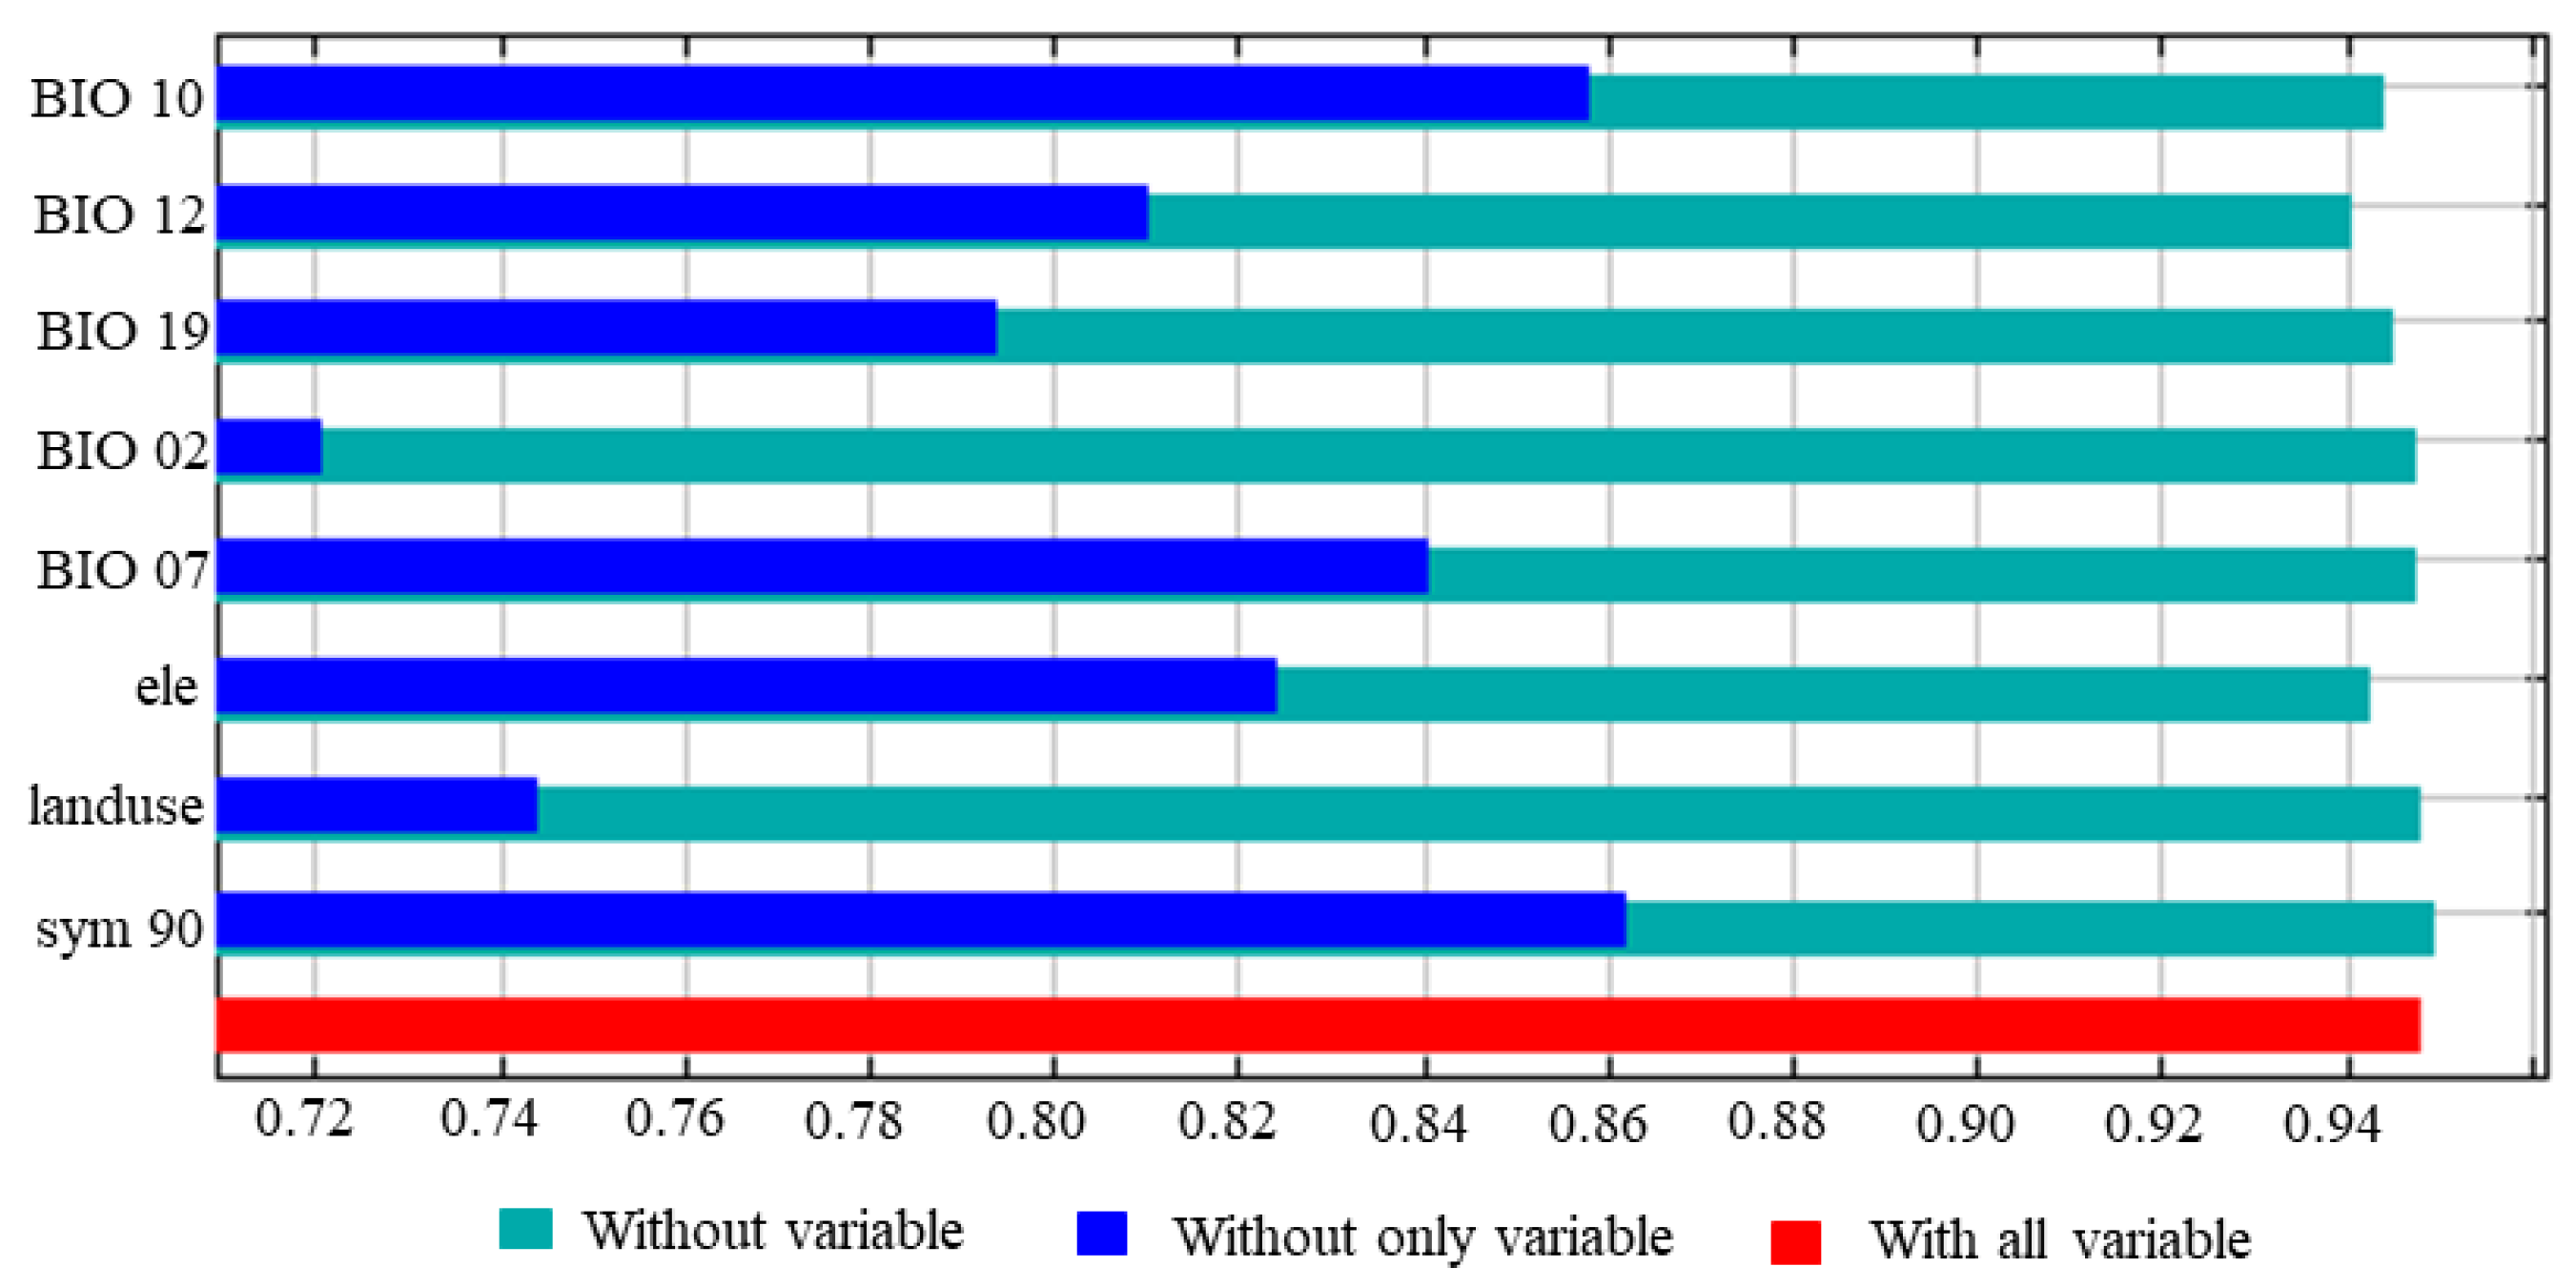
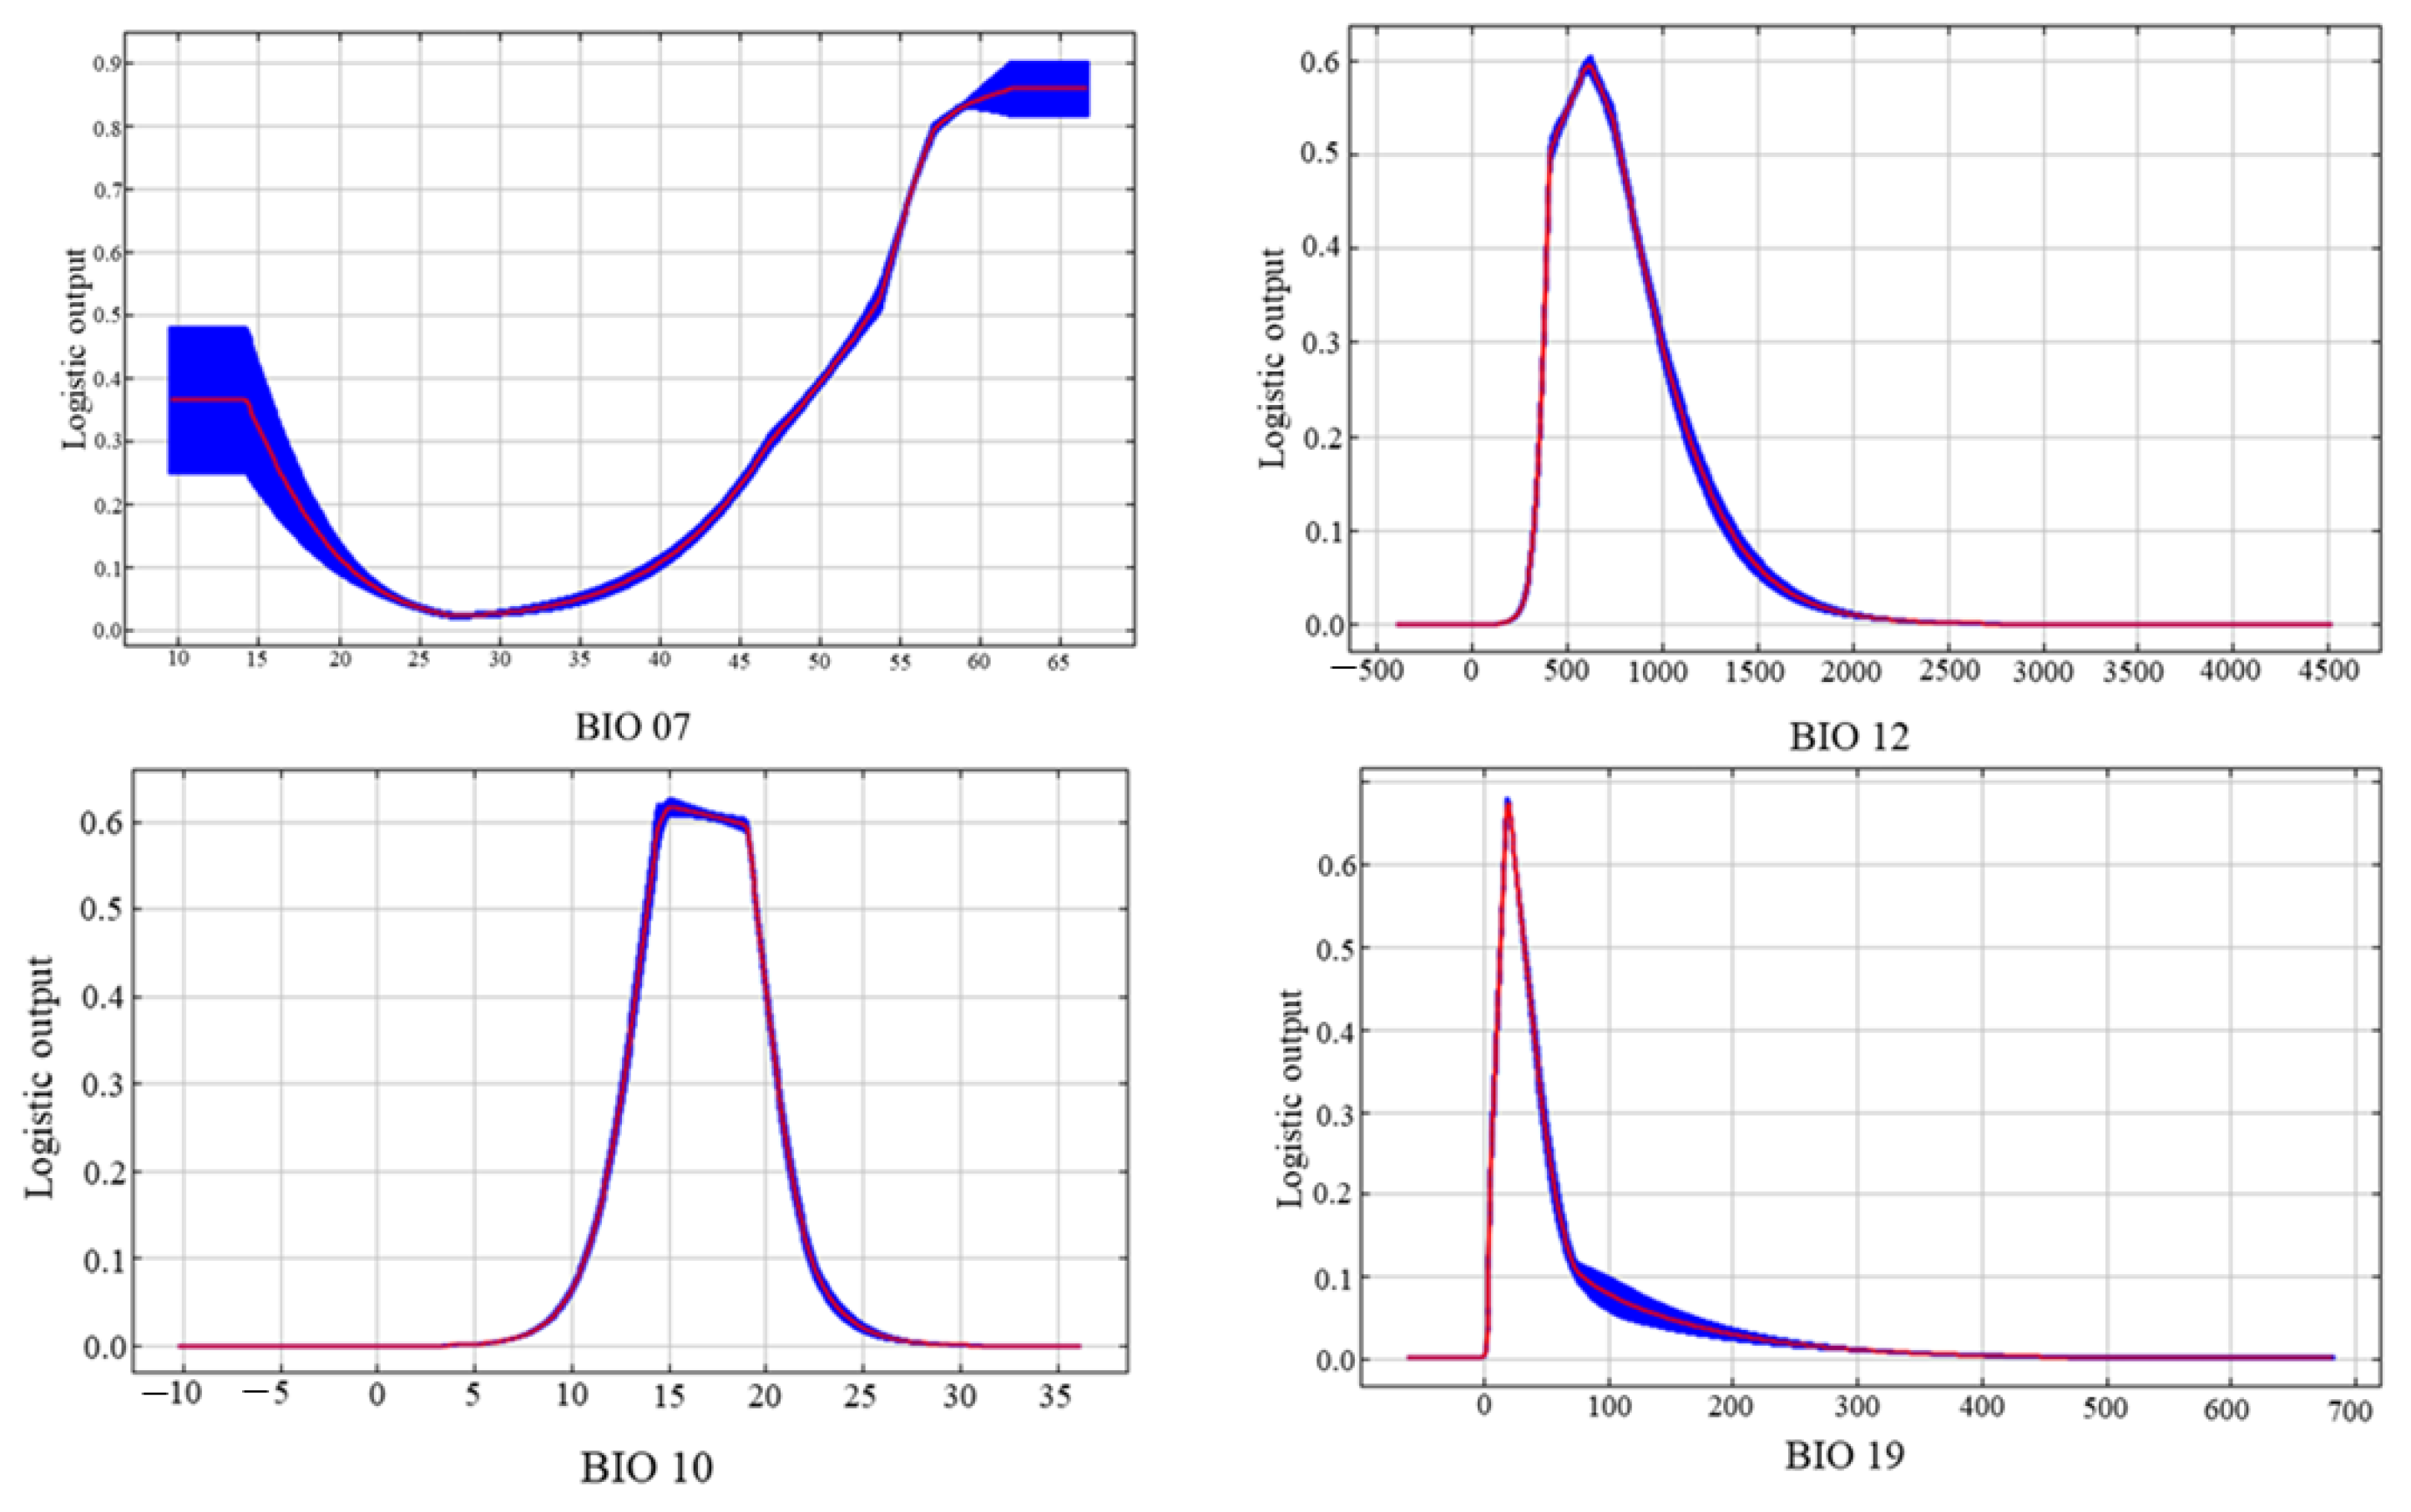
3.2. Analysis of the Influence of Environmental Variables on the Prediction of V. uliginosum Distribution

The results of the jackknife test reflect the contribution of different environmental variables to the distribution gain. The analysis of the suitability of each environmental variable to the distribution of V. uliginosum via the jackknife method, combined with the contribution rate of each environmental variable to the distribution of V. uliginosum, shows that temperature and precipitation are the main factors affecting the distribution of V. uliginosum. The order of the eight environmental variables contributing to the prediction results of V. uliginosum suitable habitats is as follows: BIO07 (35.1%), BIO12 (24.5%), BIO10 (14.5%), BIO19 (7.6%), Ele (7.3%), Land use (6%), Sym90 (4.9%) and BIO02 (0.1) (Table 1). The cumulative contribution rate of BIO07, BIO12, and BIO10 reached 74.1%. The findings demonstrated that BIO07, BIO12, and BIO10 are key factors influencing the distribution of V. uliginosum (Figure 3).
The influence of the top four bioclimatic factors on the distribution probability of V. uliginosum is shown in Figure 4. The climate factor with the highest weight is BIO07. As can be seen from Figure 4, except for annual temperature range (BIO07), all climate and environmental variables present an approximate normal distribution pattern. When BIO07 is about 60° C–65 °C, the distribution probability of V. uliginosum is the highest, which gradually decreases when BIO07 is about 15 °C–30 °C, and gradually increases when BIO07 is about 30 °C–60 °C. The probability of V. uliginosum distribution increases rapidly when the BIO12 is around 250 mm–700 mm, reaching its highest at 700 mm, and then it gradually decreases. The results show that V. uliginosum has a low probability of distribution in ecological regions with an annual precipitation below 250 mm or above 2000 mm. The probability of V. uliginosum distribution increases rapidly when BIO10 is around 5 °C–15 °C, reaching its highest at 15 °C, and then it gradually decreases, reaching stability at 30 °C. The results show that V. uliginosum has a low probability of distribution in an ecological region with a mean temperature of warmest quarter below 5 °C or above 25 °C. The probability of V. uliginosum distribution increases rapidly when BIO19 is around 0 mm–25 mm, reaching its highest at 25 mm, and then it gradually decreases. The results show that V. uliginosum has a low probability of distribution in an ecological region with the precipitation of coldest quarter below 0 mm or above 300 mm.

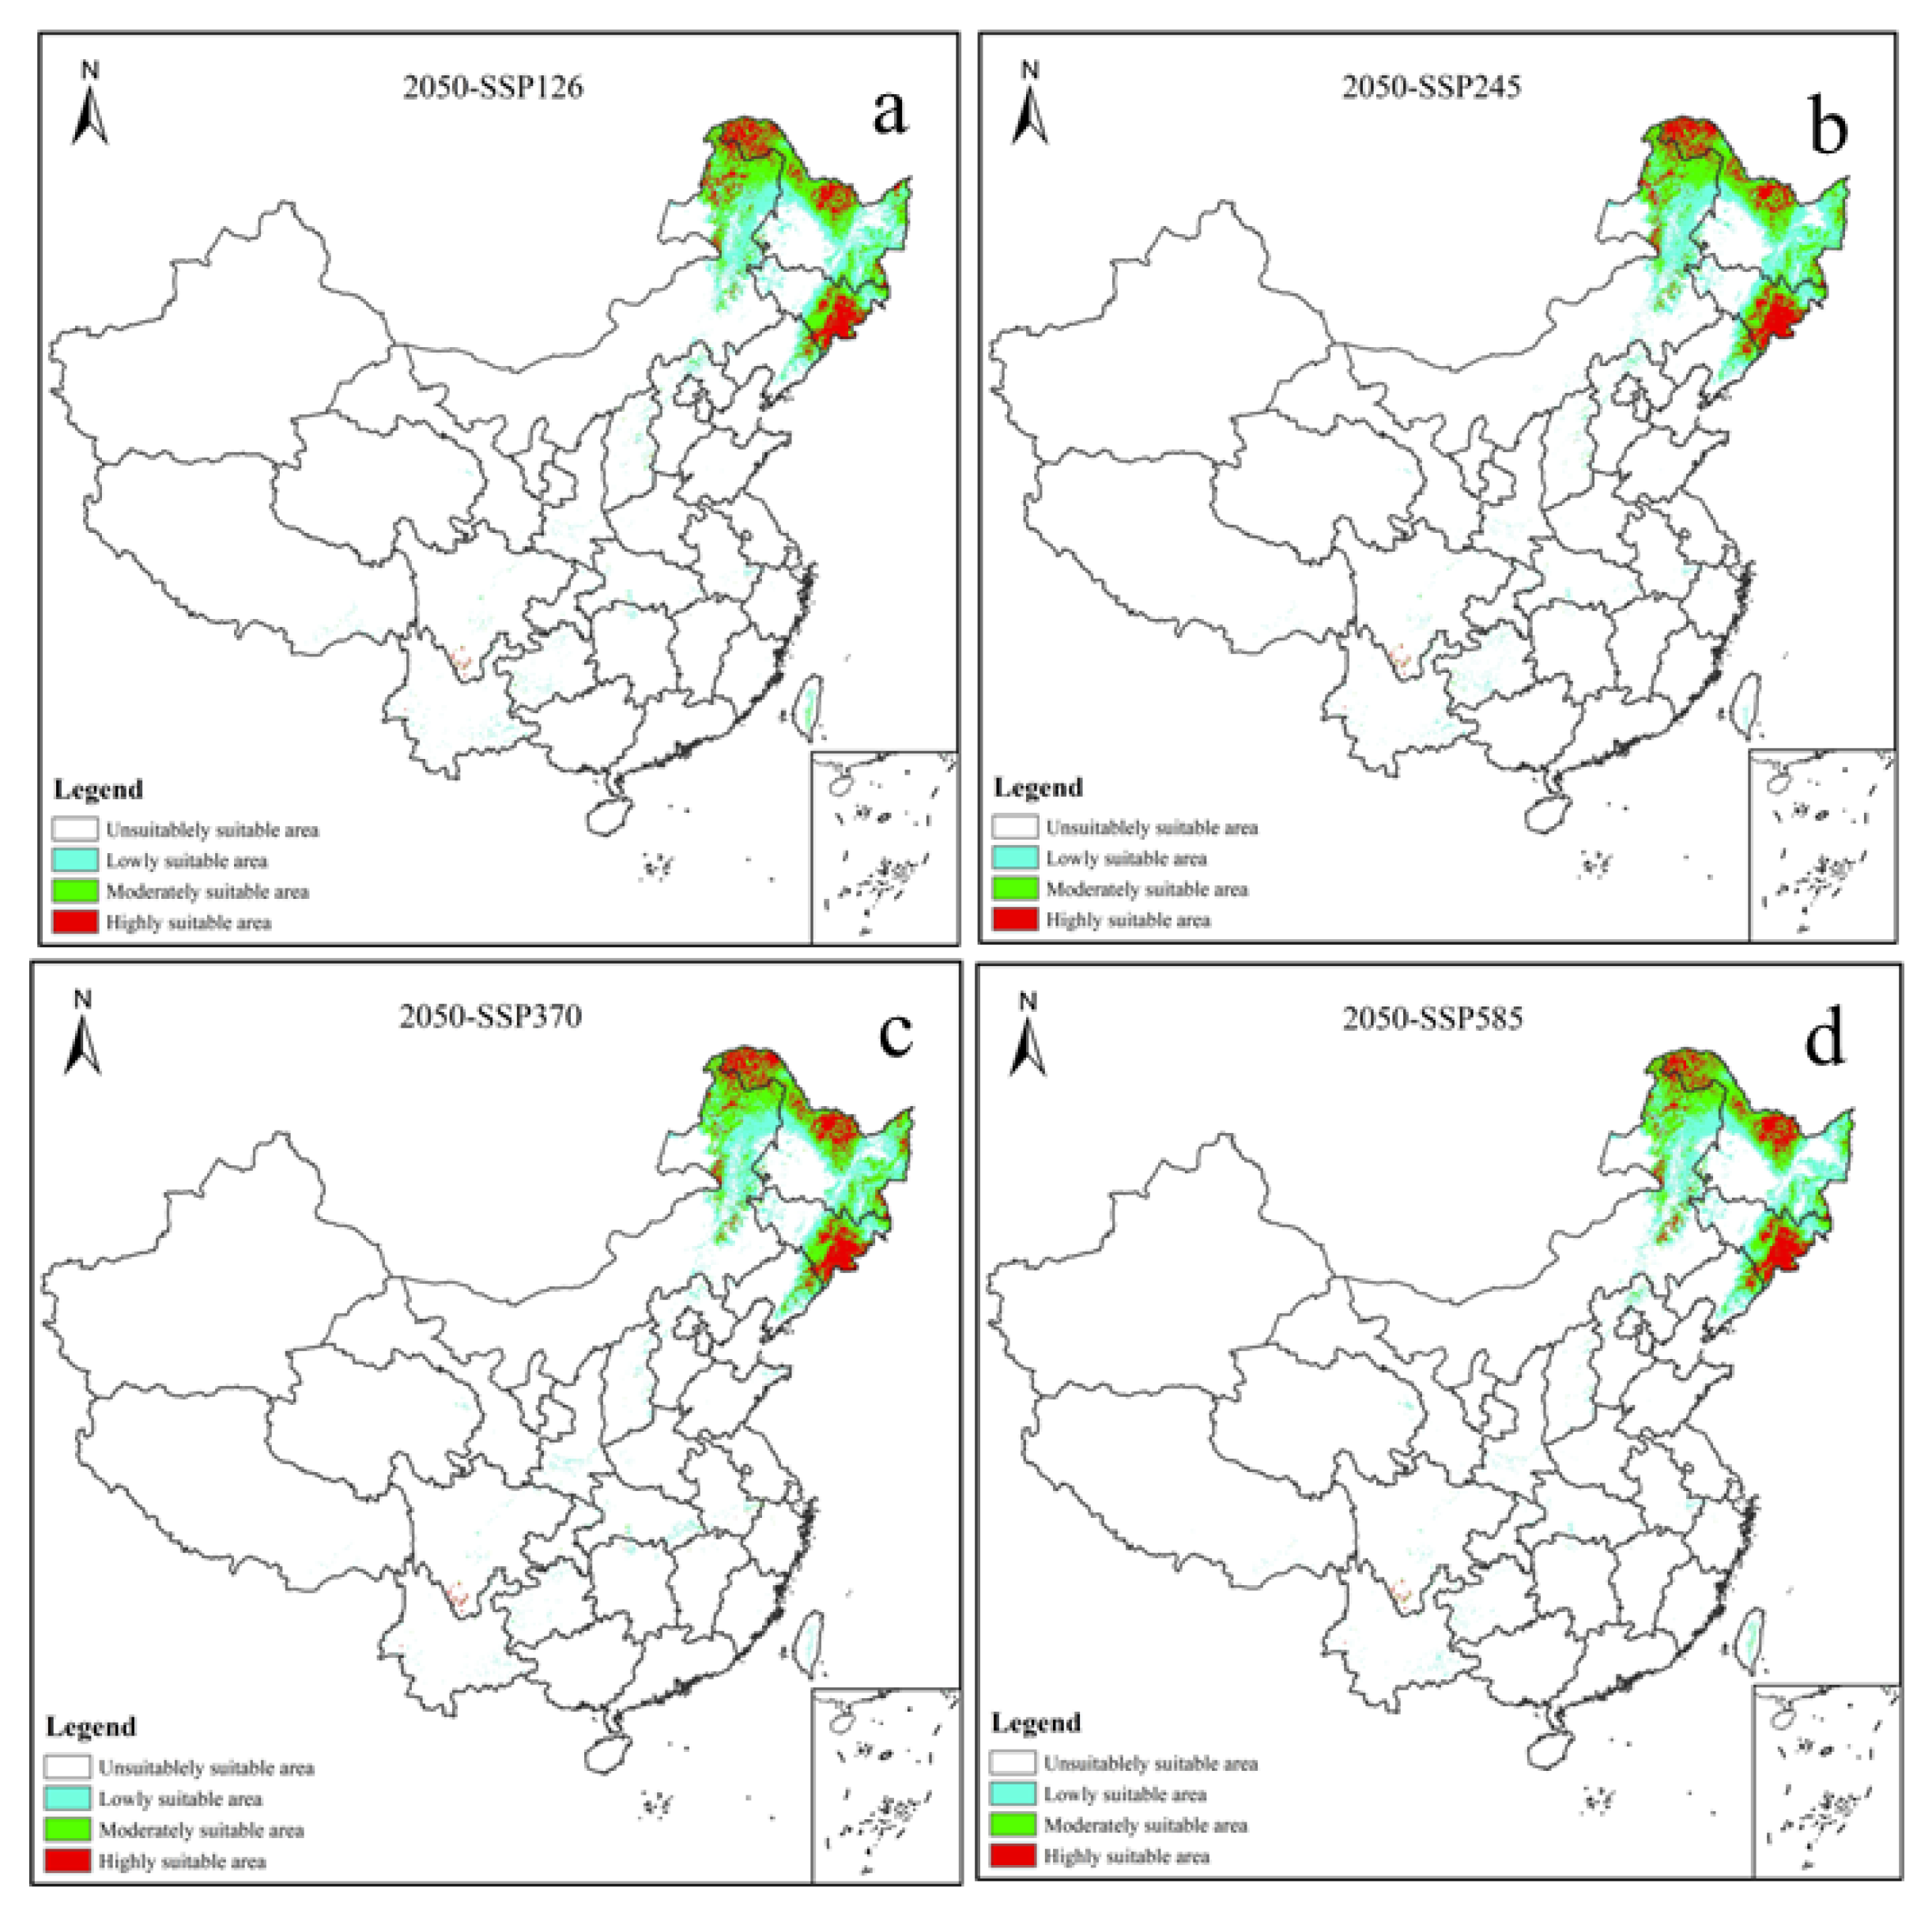
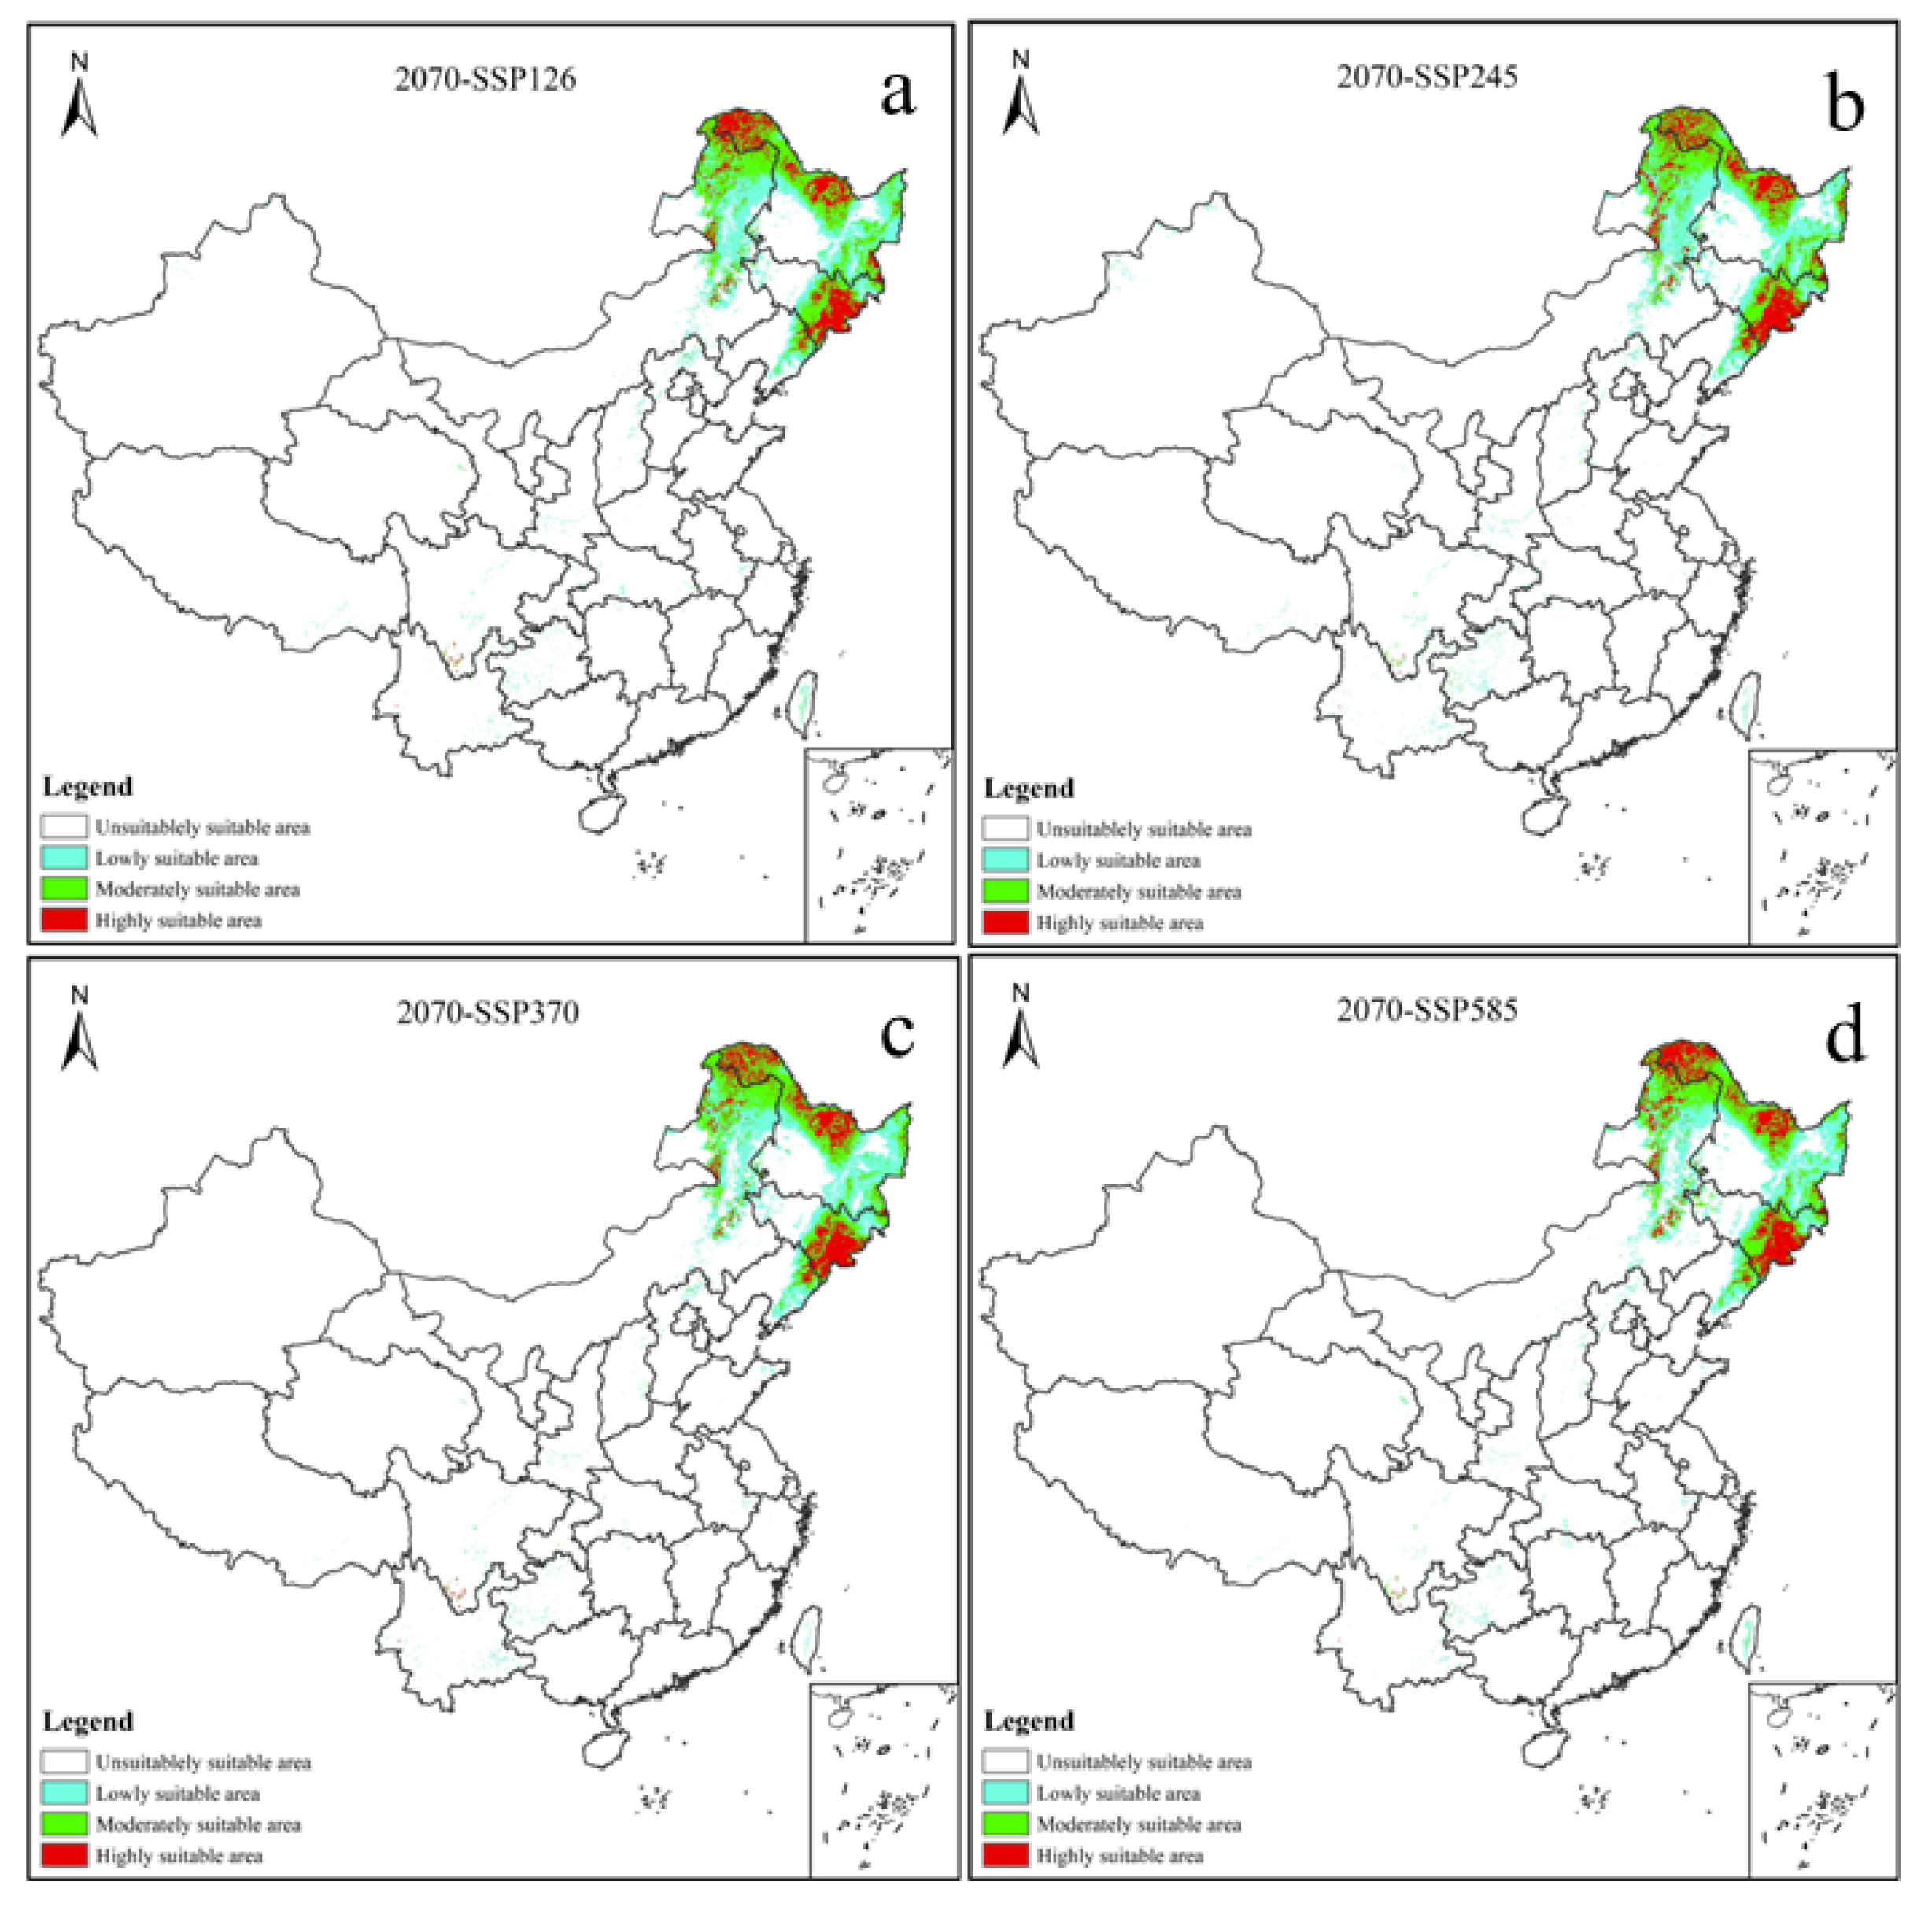
3.3. Potential Distribution of V. uliginosum under Future Climatic Scenario

The Maxent model was applied to predict the potential distribution of V. uliginosum in China in two future periods (the 2050s and the 2070s) and four greenhouse gas scenarios (SSP1-2.6, SSP2-4.5, SSP3-7.0, and SSP5-8.5). The calculation method of the suitable area is as follows: The total grid of China’s land area is 554,081 according to ArcGIS software. The total suitable area is calculated by multiplying the land area of China by the total number of grids in the suitable area and dividing by the total number of grids (554,081). The calculation method of the minimally suitable area is as follows: Multiply the land area of China by the total number of grids in the minimally suitable area and divide by the total number of grids (554,081). The calculation method of the moderately suitable area is as follows: Multiply the land area of China by the total number of grids in the moderately suitable area and divide by the total number of grids (554,081). The calculation method of the area of highly suitable area is as follows: Multiply the land area of China by the total number of grids in the highly suitable area and divide by the total number of grids (554,081).
The potential distribution of V. uliginosum will vary under different climatic scenarios in the future (the 2050s; Figure 5). Under the SSP2-4.5 scenario, the total suitable habitat will increase by 1.40%. Under the scenarios of SSP1-2.6, SSP3-7.0, and SSP5-8.5, it will be reduced by 2.21%, 1.67%, and 5.63%, respectively. The minimally suitable habitat will decrease by 4.19%, 0.03%, 5.18%, and 4.11%, respectively. The moderately suitable habitat will increase by 0.32% and 4.01% under SSP1-2.6 and SSP2-4.5, and it will decrease by 0.32% and 6.78% under SSP3-7.0 and SSP5-8.5. The highly suitable area will increase by 3.71% under SSP3-7.0, and it will decrease by 2.64%, 1.76%, and 6.86% under SSP1-2.6, SSP2-4.5, and SSP5-8.5, respectively (Table 2).
The potential distribution of V. uliginosum will vary under different climatic scenarios in the future (the 2070s; Figure 6). Under the SSP2-4.5 scenario, the total suitable habitat will increase by 2.16%. Under the scenarios of SSP1-2.6, SSP3-7.0, and SSP5-8.5, it will be reduced by 0.04%, 2.16%, and 2.90%, respectively; the minimally suitable habitat will decrease by 3.45%, 0.79%, 1.03%, and 6.97%, respectively. The moderately suitable habitat will increase by 4.14% and 3.69% under SSP1-2.6 and SSP2-4.5, and it will decrease by 4.55% and 4.52% under SSP3-7.0 and SSP5-8.5. The highly suitable area will increase by 3.71% under SSP3-7.0, and it will decrease by 2.64%, 1.76%, and 6.86% under SSP1-2.6, SSP2-4.5, and SSP5-8.5, respectively. The highly suitable area will increase by 5.85%, 0.31%, and 9.50% under SSP2-4.5, SSP3-7.0, and SSP5-8.5, and it will decrease by 0.5% under SSP1-2.6 (Table 2).

4. Discussion

With the sharing of global species distribution data and the rapid development of spatial analysis techniques, ecological niche modeling has been developed and applied in many fields of biodiversity conservation. Ecological niche modeling establishes, via known distribution data and relevant environmental variables of species, models that, according to certain algorithmic operations, judge the ecological needs of a species and project the results of the operation onto various times and spaces so as to predict actual and potential species distributions. The model has been increasingly used in the study of invasion biology, conservation biology, the effect of global climate change on species distribution, and the biogeography and spatial spread of infectious diseases [30,31,32,33,35,36,37,38,39]. However, since the beginning of the Industrial Revolution, the impact of drastic changes in the global climate has attracted attention [40,41]. From the beginning of the 20th century to the present, the global average temperature has increased significantly. Warming has been a clear trend in global climate change during this period, and this trend has become increasingly intense since the beginning of the 21st century. Studies have shown that the negative effects of climate warming are higher than the positive effects [22,42].
V. uliginosum often grows in the larch forests on the slopes, at the edges of the forest, in alpine grasslands, in swampy wetlands, and at altitudes of about 900–2300 m. V. uliginosum is extremely hardy and can safely overwinter in −45 °C to 50 °C environments, and it requires a cool environment below 20 °C in summer [43]. The marshlands in which bilberries live can inhibit their transpiration, which causes them to have strong water-retention properties. Snow cover can keep plants warm in the winter, inhibiting the transpiration of plants, reducing and alleviating frost damage caused by soil freezing, as well as accumulating water, and condensing dust in the air to form fine and fertile soil. Therefore, snow cover is essential for the growth of V. uliginosum trees. Dead branches and leaves provide sufficient water for V. uliginosum because they can prevent evaporation and the loss of water and ensure a relatively stable soil temperature.
In this research, the suitable areas of V. uliginosum are mainly concentrated in the Greater Khingan Mountains and Lesser Khingan Mountains. From the geographical environment of the distribution area, the suitable growth area of V. uliginosum has some common characteristics: It is located in the northernmost part of China, with long winters and short summers, and with very few sunshine hours. The Greater Khingan Mountains is also an important climatic zone. The summer marine monsoon is blocked by the eastern slopes of the mountains, with more precipitation on the eastern slope and drought on the western slope. There is an obvious contrast between the two, but the climate of the whole mountain area is relatively humid, with annual precipitation of more than 500 mm. The northern section of the mountain range is the coldest place in eastern China, with severe winters (with an average temperature −28 °C) and a large area of permafrost [44].
The contribution rates of climate factors to the prediction results of the model are as follows: BIO07, 35.1%; BIO12, 24.5%; BIO10, 14.5%; BIO19, 7.6%; Ele, 7.3%; Land use, 6%; Sym90, 4.9%; and BIO02, 0.1%. The cumulative contribution rates of BIO07, BIO12, and BIO10 reach 74.1%, suggesting that temperature and precipitation are key factors affecting the distribution of V. uliginosum. Studies show that climate change can influence the distribution of most species [45,46,47]. In this research, the potential distribution of V. uliginosum in China in the predictions of the next two periods (the 2050s and the 2070s) and four greenhouse gas scenarios (SSP1-2.6, SSP2-4.5, SSP3-7.0, and SSP5-8.5) show that the suitable areas for bilberry growth are mainly concentrated in the Greater Khingan Mountains, Lesser Khingan Mountains, and the Changbai Mountains, differing only slightly from contemporarily suitable areas. In this study, under the climate scenario SSP2-4.5 in the 2050s, the area of suitable habitats will increase to varying degrees. The reason for this result may be that the temperature of the extremely cold region, such as the Greater Khingan Mountains, Lesser Khingan Mountains, and Changbai Mountains, has risen due to the warming climate, reaching the adaptation temperature of V. uliginosum. The average temperature in China has risen by 1.1 °C in the past 100 years, which is higher than the global temperature rise. Since the 1980s, the temperature in our country has risen at an increasing rate.
In this research, the suitability distribution of V. uliginosum in China was simulated using the Maxent model. Good simulation results were obtained, but there are still some limitations. First, the climate factors used in this study span 1960–1990 and thus lack more than 30 years of recent climate data, which may bias the predictions regarding suitable habitats for V. uliginosum. Second, interspecific competition, species reproductive pressure, human interference, climate change, etc., will influence the potential distribution of predicted species in the actual species living environment. In future work, the missing data and impact factors should be supplemented, and the interaction between global warming and the distribution of V. uliginosum should also be explored in depth to make the prediction results more accurate and reliable.

5. Conclusions

In this paper, the Maxent model was applied to simulate the suitability distribution area of V. uliginosum in China. The results showed that, under different climate scenarios in the future, the suitable areas for V. uliginosum will always be focused in the Greater Khingan Mountains, Lesser Khingan Mountains, and other regions. The predicted results show that the distribution and area of the suitable area change range is small. The results display that the cumulative contribution rates of BIO07, BIO12, and BIO10 reach 74.1%, indicating that temperature and precipitation are the key factors affecting the distribution of V. uliginosum. This study can provide a reference for relevant departments to take conservation measures in the face of climate change and for the adaptation of V. uliginosum to habitat changes.

Author Contributions

Conceptualization, Q.L. and Y.Q.; methodology, Y.Q.; software, Q.L.; validation, Q.L., and Q.W.; formal analysis, Q.W.; investigation, Q.W.; resources, Q.L.; data curation, Q.L.; writing—original draft preparation, Q.L.; writing—review and editing, Y.Q.; visualization, Y.Q.; supervision, Y.Q.; project administration, D.W.; funding acquisition, D.W. All authors have read and agreed to the published version of the manuscript.

Funding

This work was financially supported by the National Natural Science Foundation of China. [Grant No. 31760205].

Data Availability Statement

Data are contained within the article.

Acknowledgments

We thank Huie Li for assistance in the experiments.

Conflicts of Interest

The authors declare no conflict of interest.

References

  1. Kozak, K.H.; Graham, C.H.; Wiens, J.J. Integrating GIS-based environmental data into evolutionary biology. Trends Ecol. Evol. 2008, 23, 141–148. [Google Scholar] [CrossRef]
  2. Chen, J.; Brissette, F.P.; Lucas-Picher, P. Assessing the limits of bias-correcting climate model outputs for climate change impact studies. J. Geophys. Res. Atmos. 2015, 120, 1123–1136. [Google Scholar] [CrossRef]
  3. Jewitt, D.; Erasmus, B.F.N.; Goodman, P.S.; O’Connor, T.G.; Hargrove, W.W.; Maddalena, D.M.; Witkowski, E.T.F. Climate-induced change of environmentally defined floristic domains: A conservation-based vulnerability framework. Appl. Geogr. 2015, 63, 33–42. [Google Scholar] [CrossRef]
  4. Mantyka-Pringle, C.S.; Visconti, P.; Di Marco, M.; Martin, T.G.; Rondinini, C.; Rhodes, J.R. Climate change modifies risk of global biodiversity loss due to land-cover change. Biol. Conserv. 2015, 187, 103–111. [Google Scholar] [CrossRef] [Green Version]
  5. Trumbore, S.; Brando, P.; Hartmann, H. Forest health and global change. Science 2015, 349, 814–818. [Google Scholar] [CrossRef] [PubMed] [Green Version]
  6. Taylor, K.E.; Stouffer, R.J.; Meehl, G.A. An overview of CMIP5 and the experiment design. Am. Meteorol. Soc. 2012, 93, 485–498. [Google Scholar] [CrossRef] [Green Version]
  7. Thuiller, W.; Vayreda, J.; Pino, J. Large-scale environmental correlates of forest tree distributions in Catalonia (NE Spain). Glob. Ecol. Biogeogr. 2003, 12, 313–325. [Google Scholar] [CrossRef] [Green Version]
  8. Jeffree, E.P.; Jeffree, C.E. Temperature and the bio-geographical distribution of species. Funct. Ecol. 1994, 8, 640–650. [Google Scholar] [CrossRef]
  9. Ohsawa, M. The montane cloud forest and its gradational changes in southeast Asia. In Tropical Montane Cloud Forests; Springer: New York, NY, USA, 1993; pp. 163–170. [Google Scholar]
  10. Chen, I.C.; Hill, J.K.; Ohlemuller, R.; Roy, D.B.; Thomas, C.D. Rapid Range Shifts of Species Associated with High Levels of Climate Warming. Science 2011, 333, 1024–1026. [Google Scholar] [CrossRef] [PubMed]
  11. Pauli, H.; Gottfried, M.; Dullinger, S.; Abdaladze, O.; Akhalkatsi, M.; Alonso, J.L.B.; Coldea, G.; Dick, J.; Erschbamer, B.; Calzado, R.F.; et al. Recent Plant Diversity Changes on Europe’s Mountain Summits. Science 2012, 336, 353–355. [Google Scholar] [CrossRef]
  12. CMA Climate Change Centre. Blue Book on Climate Change in China (2022); Science Press: Beijing, China, 2022. [Google Scholar]
  13. Phillips, S.J.; Anderson, R.P.; Schapire, R.E. Maximum entropy modeling of species geographic distributions. Ecol. Model. 2006, 190, 231–259. [Google Scholar] [CrossRef] [Green Version]
  14. Duan, Y.Z.; Wang, H.T.; Wang, C.; Du, Z.Y. Potential distribution of endangered plant Helianthemum songaricum in China under climate change. J. Plant. Resour. Environ. 2020, 29, 55–68. [Google Scholar]
  15. Hirzel, A.H.; Hausser, J.; Chessel, D.; Perrin, N. Ecological-niche factor analysis: How to compute habitat-suitability maps without absence data? Ecology 2002, 83, 2027–2036. [Google Scholar] [CrossRef]
  16. Booth, T.H.; Nix, H.A.; Busby, J.R.; Hutchinson, M.F. BIOCLIM: The first species distribution modelling package, its early applications and relevance to most current MaxEnt studies. Divers. Distrib. 2014, 20, 1–9. [Google Scholar] [CrossRef]
  17. Papes, M.; Gaubert, P. Modelling ecological niches from low number of occurrences: Assessment of the conservation status of poorly known viverrids (Mammalia, Carnivora) across two continents. Divers. Distrib. 2007, 13, 890–902. [Google Scholar] [CrossRef]
  18. Elith, J.; Graham, C.H.; Anderson, R.P. Novel methods improve prediction of species’distributions from occurrence data. Ecography 2010, 29, 129–151. [Google Scholar] [CrossRef] [Green Version]
  19. Cabra-Rivas, I.; Saldaña, A.; Castro-Díez, P.; Gallien, L. A multi-scale approach to identify invasion drivers and invader future dynamics. Biol. Invasions 2016, 18, 411–426. [Google Scholar] [CrossRef]
  20. Liu, H.; Gong, H.; Qi, X.; Li, Y.; Lin, Z. Relative importance of environmental variables for the distribution of the invasive marsh species Spartina altenrniflora across different spatial scales. Mar. Freshw. Res. 2018, 69, 790–801. [Google Scholar] [CrossRef]
  21. Vu, T.T.; Tran, D.V.; Tran, H.T.P.; Nguyen, M.D.; Do, T.A.; Ta, N.T.; Cao, H.T.; Pham, N.T.; Phan, D.V. An assessment of the impact of climate change on the distribution of the grey-shanked douc Pygathrix cinerea using an ecological niche model. Primates 2020, 61, 267–275. [Google Scholar] [CrossRef]
  22. Pan, J.; Fan, X.; Luo, S.; Zhang, Y.; Yao, S.; Guo, Q.; Qian, Z. Predicting the Potential Distribution of Two Varieties of Litsea coreana (Leopard-Skin Camphor) in China under Climate Change. Forests 2020, 11, 1159. [Google Scholar] [CrossRef]
  23. Gao, Z.Y. Distribution of wild Dusky lingonberry resources in Wenshan region, Yunnan. Pract. Rural. Technol. 2010, 4, 39–41. [Google Scholar]
  24. Lu, L. Wild Dusky orange in the Daxingan Mountains. North. Fruits 2004, 5, 42. [Google Scholar] [CrossRef]
  25. Fang, J.Y.; Song, Y.C.; Liu, H.Y.; Piao, S.L. Vegetation-climate relationship and its application in the division of vegetation zone in China. Acta Bot. Sin. 2002, 44, 1105–1122. [Google Scholar]
  26. Chakraborty, A.; Joshi, P.K.; Sachdeva, K. Predicting distribution of major forest tree species to potential impacts of climate change in the central Himalayan region. Ecol. Eng. 2016, 97, 593–609. [Google Scholar] [CrossRef]
  27. Zuo, J.; Tang, X.; Zhang, H.; Zu, M.; Zhang, X.; Yuan, Y. Analysis of niche shift and potential suitable distributions of Dendrobium under the impact of global climate change. Environ. Sci. Pollut. Res. 2022. [Google Scholar] [CrossRef]
  28. Di Cola, V.; Broennimann, O.; Petitpierre, B.; Breiner, F.T.; D’Amen, M.; Randin, C.; Engler, R.; Pottier, J.; Pio, D.; Dubuis, A.; et al. ecospat: An R package to support spatial analyses and modeling of species niches and distributions. Ecograph 2017, 40, 774–787. [Google Scholar] [CrossRef]
  29. Cobos MEPeterson, A.T.; Barve, N.; Osorio-Olvera, L. kuenm: An R package for detailed development of ecological niche models using Maxent. PeerJ 2019, 7, e6281. [Google Scholar] [CrossRef] [Green Version]
  30. Kong, F.; Tang, L.; He, H.; Yang, F.; Tao, J.; Wang, W. Assessing the impact of climate change on the distribution of Osmanthus fragrans using Maxent. Environ. Sci. Pollut. 2021, 28, 34655–34663. [Google Scholar] [CrossRef]
  31. Yan, H.; Feng, L.; Zhao, Y.; Feng, L.; Wu, D.; Zhu, C. Prediction of the spatial distribution of Alternanthera philoxeroides in China based on ArcGIS and MaxEnt. Glob. Ecol. Conserv. 2020, 21, e00856. [Google Scholar] [CrossRef]
  32. Jackson, C.R.; Robertson, M.P. Predicting the potential distribution of an endangered cryptic subterranean mammal from few occurrence records. J. Nat. Conserv. 2011, 19, 87–94. [Google Scholar] [CrossRef] [Green Version]
  33. Clark, J.T.; Fei, S.; Liang, L.; Rieske, L.K. Mapping eastern hemlock: Comparing classification techniques to evaluate susceptibility of a fragmented and valued resource to an exotic invader, the hemlock woolly adelgid. For. Ecol. Manag. 2012, 266, 216–222. [Google Scholar] [CrossRef]
  34. Slater, H.; Michael, E. Predicting the Current and Future Potential Distributions of Lymphatic Filariasis in Africa Using Maximum Entropy Ecological Niche Modelling. PLoS ONE 2012, 7, e32202. [Google Scholar] [CrossRef] [PubMed]
  35. Jin, Z.; Yu, W.; Zhao, H.; Xian, X.; Jing, K.; Yang, N.; Lu, X.; Liu, W. Potential Global Distribution of Invasive Alien Species, Anthonomus grandis Boheman, under Current and Future Climate Using Optimal MaxEnt Model. Agriculture 2022, 12, 1759. [Google Scholar] [CrossRef]
  36. Gong, L.; Li, X.; Wu, S.; Jiang, L. Prediction of potential distribution of soybean in the frigid region in China with MaxEnt modeling. Ecol. Inform. 2022, 72, 101834. [Google Scholar] [CrossRef]
  37. Wang, J.; Qian, Q.; Zhang, F.; Jia, X.; He, J. The possible future changes in potential suitable habitats of Tetrastigma hemsleyanum (Vitaceae) in China predicted by an ensemble mode. Glob. Ecol. Conserv. 2022, 35, e02083. [Google Scholar] [CrossRef]
  38. Vega, R.; Fløjgaard, C.; Lira-Noriega, A.; Nakazawa, Y.; Svenning, J.C.; Searle, J.B. Northern glacial refugia for the pygmy shrew Sorex minutus in Europe revealed by phylogeographic analyses and species distribution modelling. Ecography 2010, 33, 260–271. [Google Scholar] [CrossRef] [Green Version]
  39. Kantar, M.B.; Sosa, C.C.; Khoury, C.K.; Castañeda-Álvarez, N.P.; Achicanoy, H.A.; Bernau, V.; Kane, N.C.; Marek, L.; Seiler, G.; Rieseberg, L.H. Ecogeography and utility to plant breeding of the crop wild relatives of sunflower (Helianthus annuus L.). Front. Plant Sci. 2015, 6, 841. [Google Scholar] [CrossRef] [Green Version]
  40. Root, T.L.; Price, J.T.; Hall, K.R.; Schneider, S.H.; Rosenzweig, C.; Pounds, J.A. Fingerprints of global warming on wild animals and plants. Nature 2003, 421, 57–60. [Google Scholar] [CrossRef]
  41. Chardon, N.I.; Cornwell, W.K.; Flint, L.E.; Flint, A.L.; Ackerly, D.D. Topographic, latitudinal and climatic distribution of Pinus coulteri:geographic range limits are not at the edge of the climate envelope. Ecography 2015, 38, 590–601. [Google Scholar] [CrossRef]
  42. Runting, R.K.; Bryan, B.A.; Dee, L.E.; Maseyk, F.J.F.; Mandle, L.; Hamel, P.; Wilson, K.A.; Yetka, K.; Possingham, H.P.; Rhodes, J.R. Incorporating climate change into ecosystem service assessments and decisions: A review. Glob. Chang. Biol. 2016, 23, 28–29. [Google Scholar] [CrossRef] [Green Version]
  43. Ning, X.Z.; Geng, Q.C.; Zhong, G.Y. Investigation on Wild Resources of Vaccinium uliginosum and V. vitisidaea in The Greater Xing’an Mountains, Inner Mongolia. J. Inn. Mong. For. Sci. Technol. 2016, 42, 17–20. [Google Scholar]
  44. Bian, J.J.; Hao, Z.X.; Zheng, J.Y.; Ge, Q.S.; Yi, Y.H. The shift on boundary of climate regionalization in China from 1951 to 2010. Geogr. Res. 2013, 32, 1179–1187. [Google Scholar]
  45. Wang, J.; Wang, Y.; Feng, J.; Chen, C.; Chen, J.; Long, T.; Li, J.; Zang, R.; Li, J. Differential responses to climate and land-use changes in threatened chinese taxus species. Forests 2019, 10, 766. [Google Scholar] [CrossRef] [Green Version]
  46. Qin, A.; Liu, B.; Guo, Q.; Bussmann, R.W.; Ma, F.; Jian, Z.; Xu, G.; Pei, S. Maxent modeling for predicting impacts of climate change on the potential distribution of Thuja sutchuenensis Franch., an extremely endangered conifer from southwestern China. Glob. Ecol. Conserv. 2017, 10, 139–146. [Google Scholar] [CrossRef]
  47. Kumar, S.; Stohlgren, T. Maxent modeling for predicting suitable habitat for threatened and endangered tree Canacomyrica monticola in New Caledonia. J. Ecol. Nat. Environ. 2009, 1, 94–98. [Google Scholar]
Figure 1. ROC curve of Maxent model.
Horticulturae 08 01202 g001
Figure 2. The distribution of V. uliginosum in China.
Horticulturae 08 01202 g002
Figure 3. Jackknife test for evaluating the relative importance of major environmental variables for V. uliginosum.
Horticulturae 08 01202 g003
Figure 4. Response curves between the occurrence probability of V. uliginosum and environmental variables.
Horticulturae 08 01202 g004
Figure 5. Prediction of the potential distribution of V. uliginosum in China under future climatic scenarios (2050s). (a) Potential distribution of V. uliginosum in China under the 2050s-SSP1-2.6 scenario; (b) Potential distribution of V. uliginosum in China under the 2050s-SSP2-4.5 scenario; (c) Potential distribution of V. uliginosum in China under the 2050s-SSP3-7.0 scenario; (d) Potential distribution of V. uliginosum in China under the 2050s-SSP5-8.5 scenario.
Horticulturae 08 01202 g005
Figure 6. Prediction of the potential distribution of V. uliginosum in China under future climatic scenarios (2070s). (a) Potential distribution of V. uliginosum in China under the 2070s-SSP1-2.6 scenario; (b) Potential distribution of V. uliginosum in China under the 2070s-SSP2-4.5 scenario; (c) Potential distribution of V. uliginosum in China under the 2070s-SSP3-7.0 scenario; (d) Potential distribution of V. uliginosum in China under the 2070s-SSP5-8.5 scenario.
Horticulturae 08 01202 g006
Table 1. Environmental variables and contribution rates (%) to V. uliginosum.
CodeEnvironmental VariableUnitV. uliginosum
BIO01Annual mean temperature°C
BIO02Mean diurnal range°C0.1
BIO03Isothermality (BIO02/BIO07)%
BIO04Temperature seasonality-
BIO05Max. temperature of warmest month°C
BIO06Min. temperature of coldest month°C
BIO07Annual temperature range°C35.1
BIO08Mean temperature of wettest quarter°C
BIO09Mean temperature of driest quarter°C
BIO10Mean temperature of warmest quarter°C14.5
BIO11Mean temperature of coldest quarter°C
BIO12Annual precipitationmm24.5
BIO13Precipitation of wettest monthmm
BIO14Precipitation of driest monthmm
BIO15Precipitation seasonalitymm
BIO16Precipitation of wettest quartermm
BIO17Precipitation of driest quartermm
BIO18Precipitation of warmest quartermm
BIO19Precipitation of coldest quartermm7.6
EleElevationm7.3
Land useLand use 6
Sym90Soil names in the FAO90 soil classification system 4.9
Table 2. Predicted region and percentage of contemporary predicted region.
DecadesTotal Suitable HabitatsMinimally Suitable HabitatsModerately Suitable HabitatsHighly Suitable Habitats
AreaAreaAreaAreaAreaAreaAreaArea
(104 km2)(%)(104 km2)(%)(104 km2)(%)(104 km2)(%)
1960–199083.8-36.48-31.43-15.89-
SSP1-2.6205081.9597.7934.9595.8131.53100.3215.4797.36
207083.7799.9635.2296.5532.73104.1415.8199.50
SSP2-4.5205084.97101.4036.4799.9732.69104.0115.6198.24
207085.61102.1636.1999.2132.59103.6916.82105.85
SSP3-7.0205082.4098.3334.5994.8231.3399.6816.48103.71
207081.9997.8436.0498.9730.0095.4515.94100.31
SSP5-8.5205079.0894.3734.9895.8929.3093.2214.8093.14
207081.3797.1033.9593.0630.0195.4817.40109.50
Publisher’s Note: MDPI stays neutral with regard to jurisdictional claims in published maps and institutional affiliations.

