Article

Transcriptomic Analysis of Salt Stress Response in Pleurotus ostreatus

Department of Plant Resource, Kongju National University, Gongju-si 32439, Republic of Korea
*
Author to whom correspondence should be addressed.
Horticulturae 2022, 8(12), 1147; https://doi.org/10.3390/horticulturae8121147
Submission received: 8 November 2022 / Revised: 28 November 2022 / Accepted: 1 December 2022 / Published: 5 December 2022
(This article belongs to the Section Biotic and Abiotic Stress)

Abstract

:
This study was conducted to confirm the expression patterns of genes involved in stress resistance by comparing the expression patterns of genes expressed after sodium chloride (NaCl) treatment in Pleurotus ostreatus (PO) cultivation. To confirm this, as a result of checking different gene expressions for the untreated group and the NaCl 1% and 2% treated group, a total of 12,460 gene expression differences were confirmed. There were 275 and 397 genes with increased expression in the 2.0% and 1.0% NaCl treated group and 400 and 247 genes with reduced expression in the 1.0% and 2.0% NaCl treated group, respectively. Among the genes whose expression was confirmed in DEG, qRT-PCR was performed on six genes to confirm the expression pattern of the genes affecting the mycelium structure. The DEG results showed that a putative aldo-keto reductase of akor3, Alpha-1,4 glucan phosphorylase of PLEOSDRAFT_1058949, and heme-thiolate peroxidase of HTP1 were up-regulated and that glycoside hydrolase family 92 protein of PLEOSDRAFT_1063499 were down-regulated, and the qRT-PCR showed the same results. However, hydrophobin of Hydph16 and pleurotolysin B of plyB were up-regulated in the qRT-PCR results while down-regulated in the DEG results. From the above results, it is judged that NaCl ultimately inhibits growth by inhibiting the formation of the skeleton constituting the mycelium and the physiological activity within the cell.

1. Introduction

Mushrooms are affected by various environmental factors during the growth process which can be broadly divided into biotic stress and abiotic stress. Among them, abiotic stress includes high salt, drought, cold, high temperature, and UV (ultraviolet), and biotic stress is caused by various parasitic pathogens. It is known as generated stress [1,2].
In mushroom cultivation, light, temperature, and humidity are very important factors for the shape and growth of mushrooms, but they also act as environmental stresses that induce mushroom productivity and morphological changes. They induce physiological changes and responses [3,4,5,6,7].
Salinity stress, one of the major environmental stresses, is a major factor in agriculture around the world [8] and has a great effect on the growth, development, and yield of plants [9,10]. Alternatively, it may affect the cell membrane, resulting in growth retardation [11]. Fungi belonging to Basidiomycetes are known to be the most sensitive to sodium chloride (NaCl) [12], and when Pleurotus ostreatus (PO), belonging to Basidiomycete, is exposed to NaCl, the yield decreases and quality deteriorates at a concentration of 3% or more, and normal growth becomes impossible at 10% or more [13]. In the case of mushrooms, when mushrooms are grown using salty plant by-products, research results have confirmed that salt inhibits the growth of mycelium [14] and reduces mushroom spore germination and growth [15]. Among research on the high salinity of soil, studies are being actively conducted on substitute materials for sawdust medium using various agricultural and food by-products to deal with the unstable wood supply and demand [16,17,18].
Therefore, studies on salinity in Pleurotus ostreatus (PO) to date have focused on the growth changes of the hyphae and fruiting bodies, but studies on their genes and gene expression patterns affected by salt have not received much attention. Therefore, in this study, the change in the growth amount of oyster mushroom mycelium grown in a medium with and without NaCl and its gene expression pattern were compared.

2. Materials and Methods

2.1. Pleurotus Ostreatus (PO) Mycelia

The mycelium used in this experiment was the ‘Heuktari’ variety sold by the Eco-Friendly Microbiology Research Center at Gyeonggi Agricultural Research and Extension Services, and the plate medium used for the experiment was PDA (potato dextrose agar, Difco, Detroit, MI, USA) medium with and without NaCl (DAEJUNG, Seoul, Republic of Korea). The test strain cultured on solid medium prepared by adjusting the concentration of NaCl to 0.5, 1.0, 1.5, and 2.0% was inoculated onto the center of the Petri dish and cultured in an incubator (Panasonic, MIR-154, Gunma, Japan) at 25 °C. To investigate the mycelial growth characteristics of the mycelium cultured on the PDA plate medium, the mycelial diameter was measured every 3 days from the inoculation day, and the mycelial growth amount according to the NaCl concentration was measured for 9 days.

2.2. Mycelium Total RNA Extraction

For the RNA extraction, an RNA purification kit (GeneAll Biotechnology, Ribospin II, Seoul, Republic of Korea) was used, and the RNA extraction process was as follows.
First, 100 mg of mycelium pulverized with liquid nitrogen was placed into a 2 mL tube, and 700 μL of RNA lysis buffer was added. The tube was centrifuged (15 °C at 10,000× g for 2 min), and then, 600 μL of the supernatant and 600 μL of 70% ethanol were transferred to a mini spin column and centrifuged (15 °C at 10,000× g for 1 min). After removing the supernatant, 600 μL of RNA wash buffer was added and centrifuged (15 °C at 10,000× g for 30 s). After removing the supernatant, 72 μL of DNase1 reaction mixture was mixed with 2 μL of DNase1, and 70 μL of DRB buffer was applied to the center of the column and then incubated at room temperature for 10 min. To purify the RNA attached to the column, 600 μL of RNA wash buffer was added and then centrifuged (15 °C at 10,000× g for 30 s), and the solution passing through the column was removed. The column was washed with 600 μL of RSW buffer and centrifuged (15 °C at 10,000× g for 30 s), which was repeated two more times.
The treated mini spin column was centrifuged at 14,000× g for 2 min, and then, the column in the mini spin column was separated and placed into a new 1.5 mL tube. Then, 50 μL of nuclease-free water was added to the center of the column and incubated for 10 min to extract the RNA followed by centrifugation.

2.3. cDNA (Complementary DNA) Library Production

After confirming the extracted RNA concentration with a spectrophotometer (Nanodrop 2000, Thermo Fisher Scientific, Waltham, MA, USA), it was quantified at 1000 ng, and cDNA was synthesized using the Power cDNA synthesis kit (First-strand cDNA Synthesis, iNtRON, Seoul, Republic of Korea).

2.4. Transcriptome Analysis

RNA basic data preparation for the transcript analysis of mycelium Pleurotus ostreatus was performed at e-biogene (Seoul, Republic of Korea). The RNA library used in this study was prepared with the SMARTer Stranded RNA-Seq Kit (Clontech Laboratories, Inc., Palo Alto, CA, USA). For the experimental procedure, 2 µg total RNA were prepared and incubated on magnetic beads with Oligo-dT attached, and other RNA except for mRNA was removed with a washing solution.
High-throughput sequencing was performed with paired-end 100 sequencing through HiSeq 2500 (Illumina, Inc., San Diego, CA, USA), and the TopHat software (Trapnell et al., 2009) tool was used to map the mRNA-Seq sequence. Differences in gene expression patterns were confirmed based on unique and multiple alignments using the coverage area in Bedtools (Quinlan AR, 2010). RT (read count) data were processed using a bioconductor (Gentlemanet et al., 2004) using the quantile normalization method and EdgeR in R (Rdevelopment Core Team, 2016).
Alignment files were used to estimate the amount of assembled transcripts and abundances and to recognize the differential expression of genes or isoforms using cufflinks. The fragments per kilobase of exon per million fragments (FPKM) method was used to determine the expression level of the gene region, and the gene classification was searched by DAVID (http://david.abcc.ncifcrf.gov, accessed on 10 Octorber 2022).

2.5. DEG (Difference Expressed Gene) Analysis

ExDEGA (e-biogene, Seoul, Korea) was used for the expression analysis of the genes whose transcriptome analysis was completed. Genes with increased and decreased expression among all genes were set as a 4-fold change, and DEG scatter plot analysis was performed with a normalized RC (log2) value of 2 and a p-value of 0.050.

2.6. qRT-PCR (Quantitative Real Time Polymerase Chain Reaction)

qRT-PCR was performed using a BioRad CFX Connect Real-Time system (CFX Connect; Bio-Rad, Hercules, CA, USA) and an iTaq Universal SYBR Green Supermix (CFX Connect; Bio-Rad, Hercules, CA, USA). For the qRT-PCR, a total of 6 genes for which the general PCR conditions were confirmed were selected among the genes with increased expression of a 4-fold change and genes with a decreased expression. Based on the design shown in Table 1, PCR cycle conditions were performed as shown in Table 2. In addition, the relative expression value of each gene was confirmed using the 2−ΔΔCt method for the calculated Ct value and the Ct average value as a result of the qRT-PCR.

3. Results

3.1. Mycelial Growth Characteristics According to the NaCl Concentration

As a result of culturing PO mycelia in PDA medium with added NaCl concentration, there was no significant difference in mycelial growth between untreated and NaCl 0.5% treated groups. However, from the 1.0% treatment, the mycelial growth began to decrease, and as the NaCl concentration increased, the mycelial growth decreased (Figure 1, Table 3). Through this experiment, the growth inhibitory effect of PO mycelium was confirmed as the concentration of NaCl increased.

3.2. Gene Expression Pattern by NaCl Treatment

For comparison of the gene expression by the NaCl treatment, the 1% and 2% NaCl concentrations, which showed a significant difference in growth on the PDA medium compared to the control, were selected as the treatment groups. A total of 12,460 transcripts were identified as a result of the DEG in the PO mycelium for the control and 1.0% and 2.0% NaCl treatment groups.
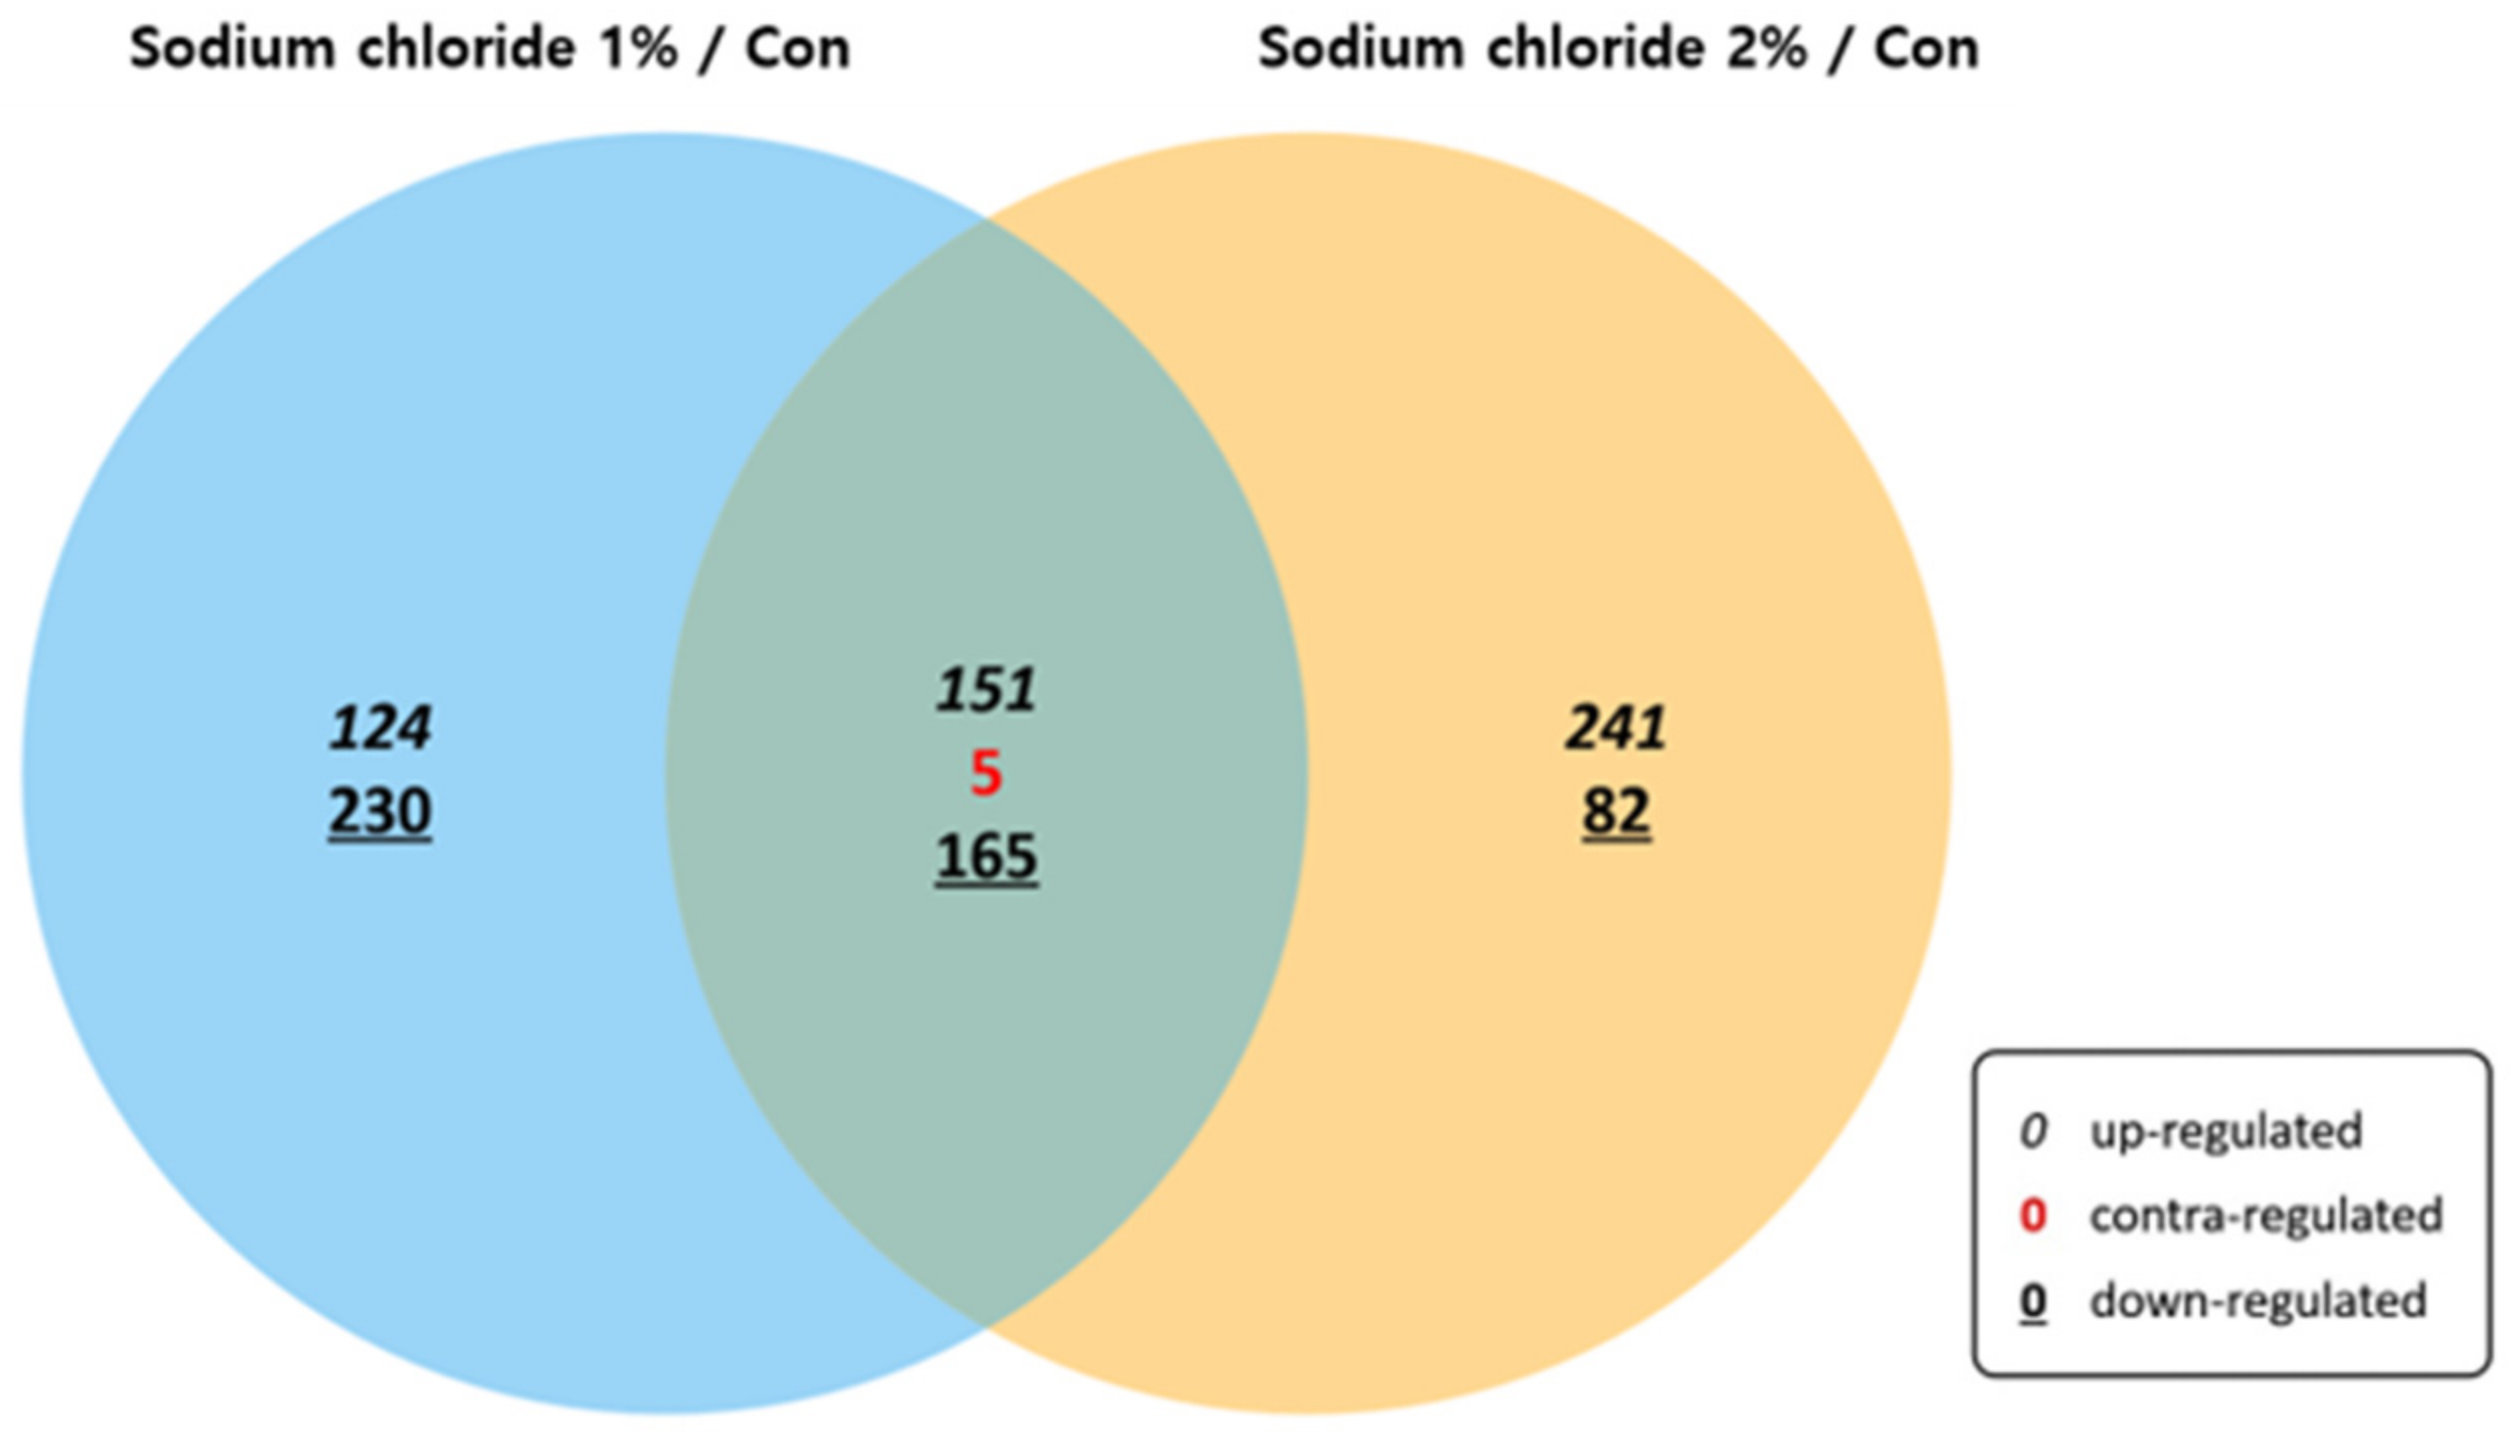
As a result, 275 genes with increased expression in 4-fold change and 397 genes with 2.0% NaCl 1.0%, and 400 genes with reduced expression were 247 genes with 2.0% NaCl 1.0% (Figure 2).
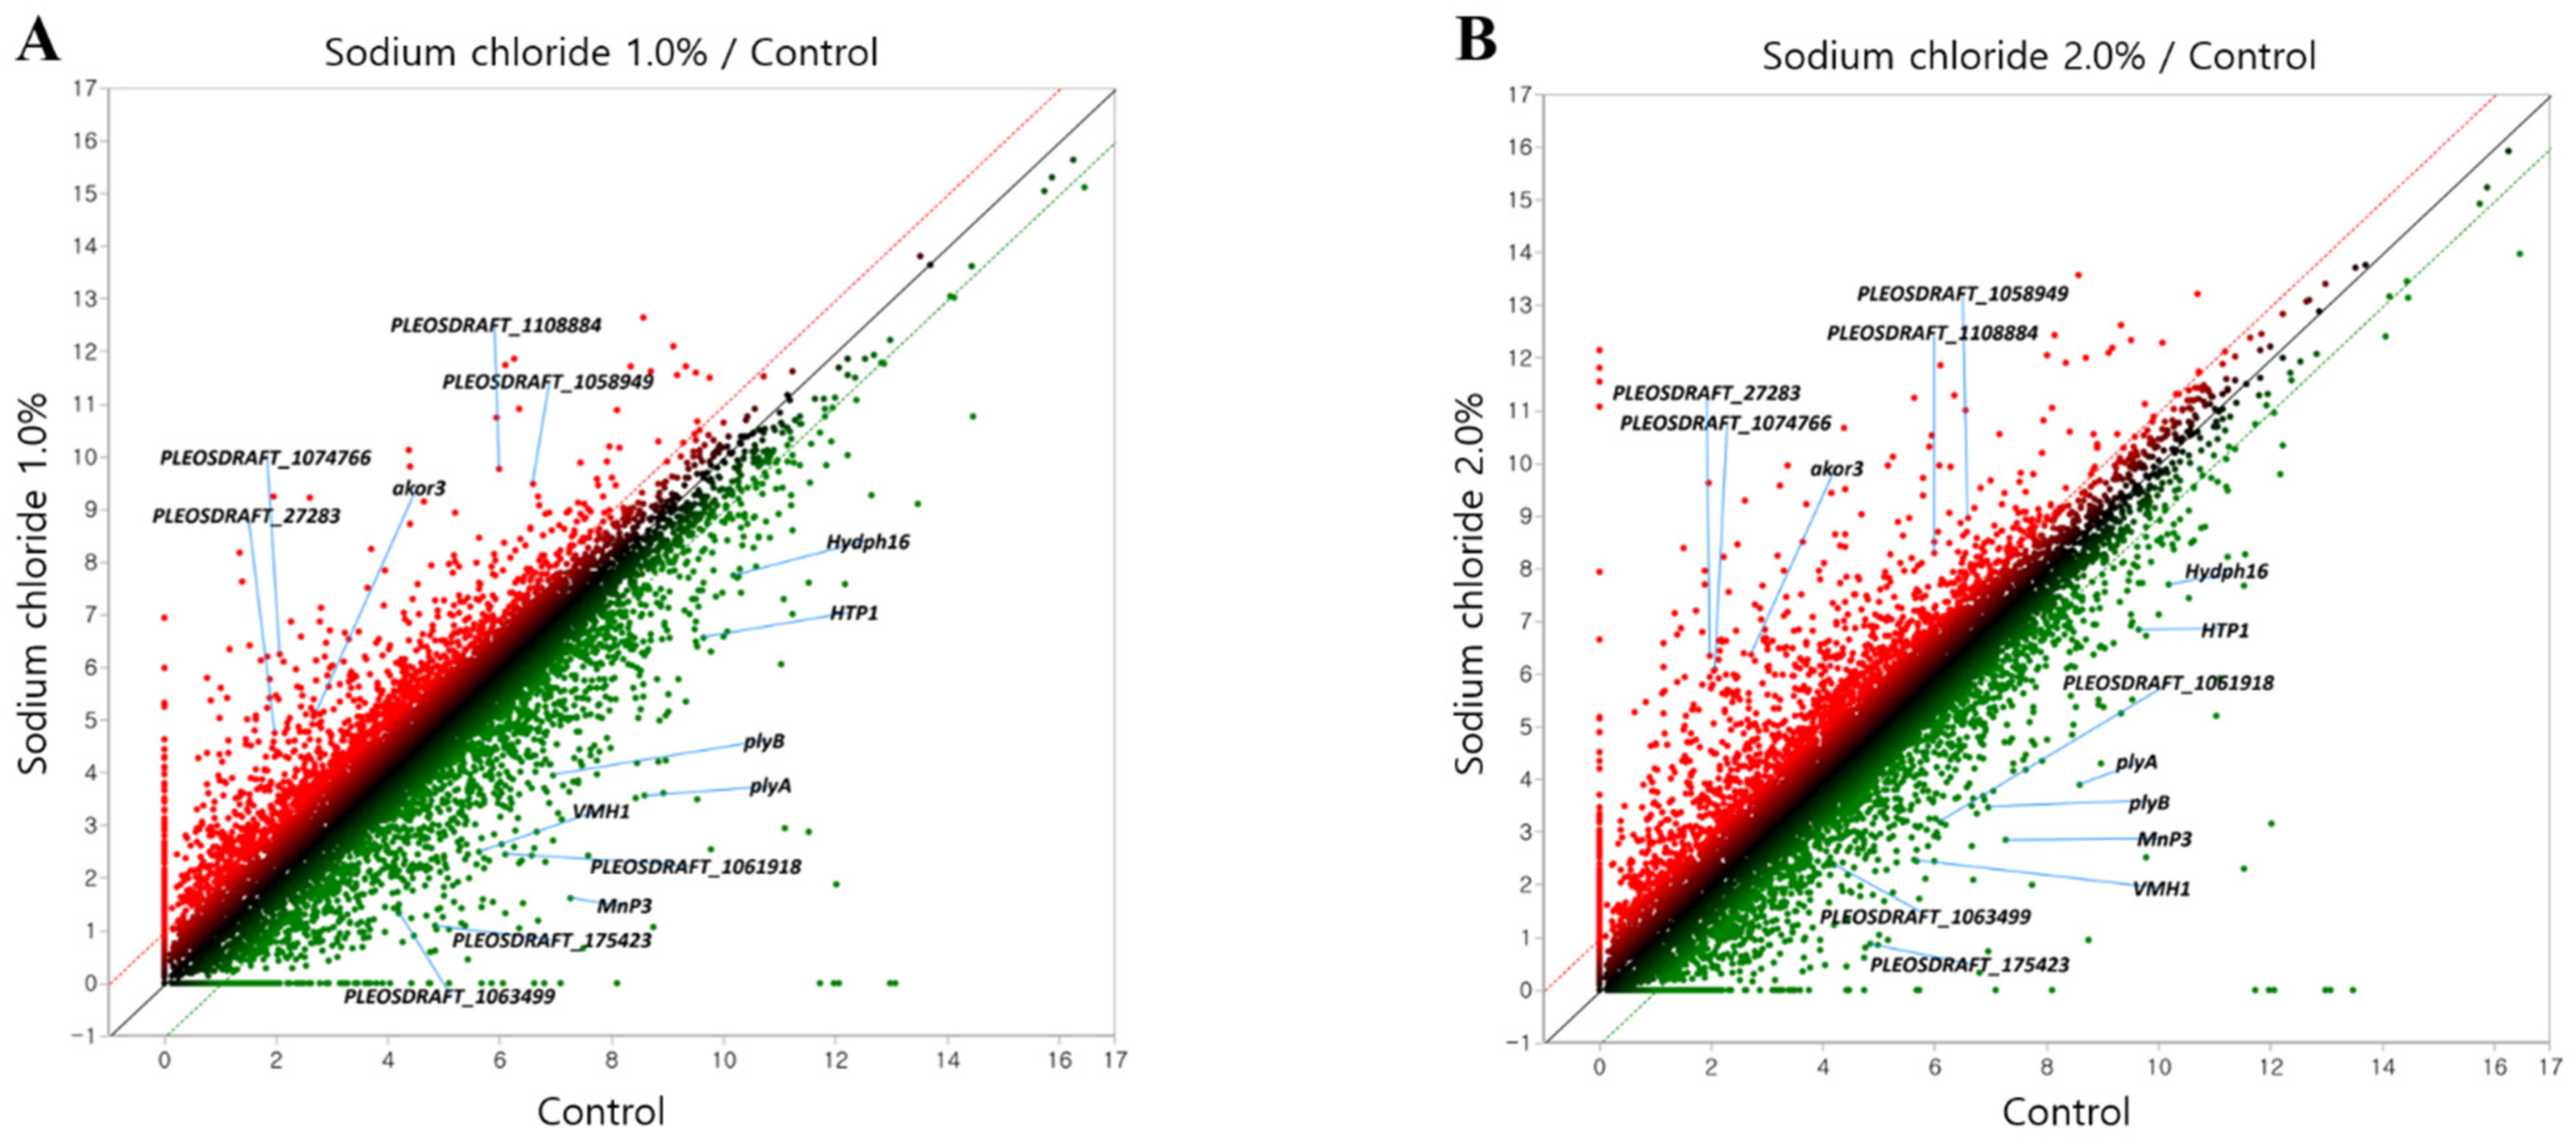
Among them, 14 genes affecting the structure of mycelium were selected. Five genes with increased expression and 9 genes with decreased expression were identified (Table 4), and the results are shown on a DEG scatter plot. The red color denotes the increased gene expression, and the green color denotes the decreased gene expression (Figure 3).

3.3. Comparison of Gene Expression Profiles

Among the genes from the DEG results, qRT-PCR was performed on 6 selected genes whose general PCR conditions were confirmed.
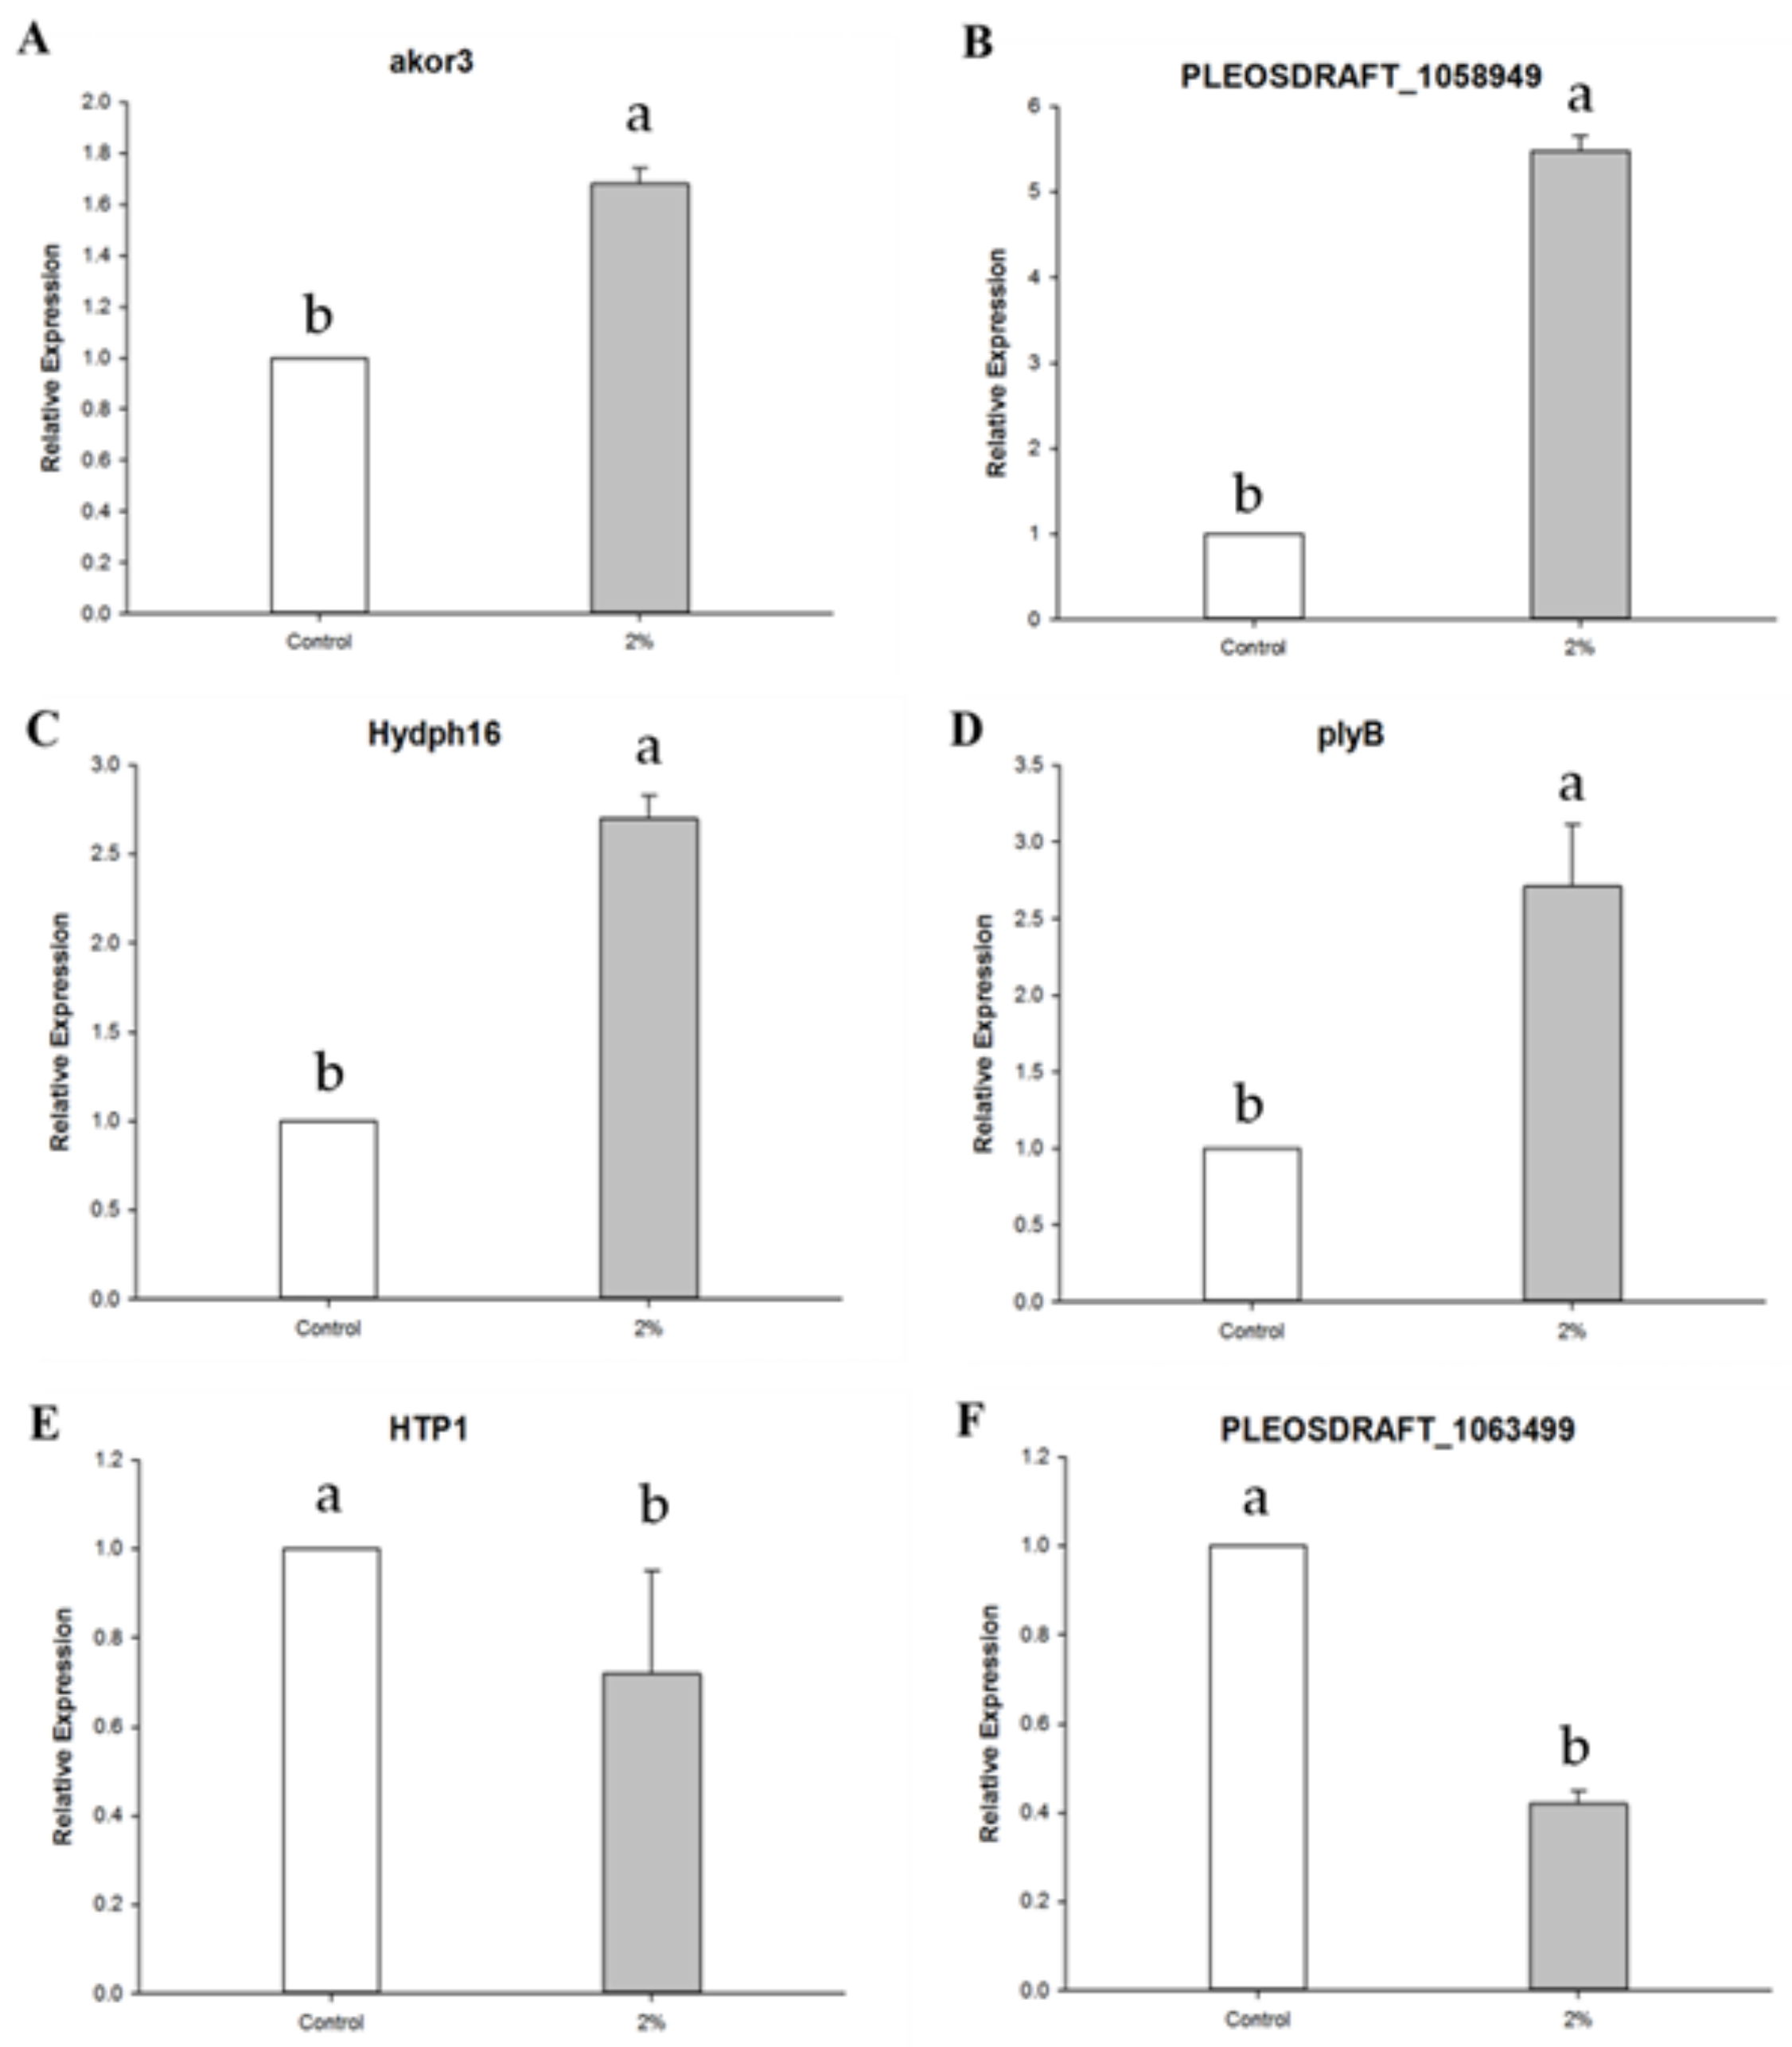
qRT-PCR was performed using samples from the 2% treatment medium, which showed a high reduction in mycelial growth compared to the control (Figure 4). The six selected genes were akor3 (putative aldo-keto reductase), PLEOSDRAFT_1058949, Hydph16 (hydrophobin), plyB (pleurotolysin B), HTP1 (heme-thiolate peroxidase), and PLEOSDRAFT_1063499.
As shown in Figure 4, two genes that were up-regulated in the DEG results were also up-regulated in the qRT-PCR results. At this time, the two up-regulated genes are the putative aldo-keto reductase and alpha-1,4 glucan phosphorylase. In addition, among the four genes, hydrophobin, pleurotolysin B, heme-thiolate peroxidase, and glycoside hydrolase family 92 protein that were shown to be down-regulated in the DEG results, the qRT-PCR results showed that only two genes, heme-thiolate peroxidase and glycoside hydrolase family 92 protein, were down-regulated the same as in the DEG results. Four gene functions with identical DEG and qRT-PCR results were identified using the protein database UniProtKB and NCBI PubMed.

4. Discussion

Research thus far has mainly focused on mycelial growth and fruiting body growth caused by PO salt stress. However, through this experiment, the genes presumed to be involved in growth inhibition were identified through the expression of the entire PO mycelium gene.
Akor3, whose sensitization pattern was confirmed through this study, is a putative aldo-keto reductase (AKR) and catalyzes the NADPH-dependent conversion of various carbonyl compounds into the corresponding alcohol products. In addition, it affects the activity of reductase using NADP⁺ and is produced in response to various environmental stresses. [19,20] Through this, when gene up-regulation in the 1.0% and 2.0% NaCl treatment group was confirmed in this study, it was judged that the addition of NaCl was a stress factor and the activity of aldo-keto reductase increased.
In addition, it affects the activity of reductase using NADP⁺ and is produced in response to various environmental stresses. There are also reports that some AKRs increase the resistance to various abiotic stresses by removing cytotoxic aldehydes from plants [21].
Alpha-1,4 glucan phosphorylase (GP, EC 2.4.1.1) of PLEOSDRAFT_1058949 is widely distributed in microorganisms, plants, and animals [22], catalyzes the reversible degradation of polysaccharides into α-d-glucose-1-phosphate, and has a central role in the mobilization of storage polysaccharides [23]. It catalyzes the rate-limiting step of glycogen catabolism and has an important role in maintaining cellular and biological glucose homeostasis [24]. When it was confirmed that gene up-regulation occurred in the 1.0% and 2.0% NaCl treatment groups, it was thought that the glycogen phosphorylase activity was increased due to the addition of NaCl.
Heme-thiolate peroxidase of HTP1 has been identified as an enzyme that transfers oxygen atoms from hydrogen peroxide to aromatics, heterocycles, linear and cyclic alkanes/alkenes, and fatty acids in mushrooms [25]. It was confirmed that the expression of HTP1 was down-regulated in the 1.0% and 2.0% NaCl treatment group, which is thought to cause the accumulation of hydrogen peroxide by inhibiting NaCl in delivering oxygen atoms in the mushroom.
Glycoside degrading enzyme is a biocatalyst involved in the cleavage of glycosidic bonds connecting individual monosaccharides, and the glycoside hydrolase family 92 protein of PLEOSDRAFT_1063499 catalyzes the degradation of N-glycan. Regulation of N-glycan modification is important for protein quality control and maintenance of functional development of glycoproteins in the endoplasmic reticulum and Golgi apparatus [26], and glycoside hydrolase 35 is known to have an important role, including modification of plant cell wall components [27]. Through our research results, it was confirmed that the expression of PLEOSDRAFT_1063499 was down-regulated in the NaCl 1.0 and 2.0% treatment groups, and it is judged that this will affect the surface constituent proteins of the PO mycelium. According to these results, when NaCl is added to the mycelium of oyster mushroom the following occur: the activity of reductase increases due to salt stress; phosphorylation of glycogen increases; inhibition of cell wall formation and decomposition activity increase, and the production of proteins constituting the mycelium surface and the accumulation of hydrogen peroxide are inhibited. It is thought that NaCl ultimately inhibits the growth by inhibiting the formation of the skeleton constituting the mycelium and the physiological activity within the cell.
In this experiment, using cDNA microarray technology, the expression of the salt stress response gene was confirmed in the mRNA of the mycelium of PO mycelium; however, the final product could not be confirmed. In accordance with the report that protein level studies are required, we plan to check various expression patterns of the PO mycelium protein through fruiting body experiments in the future [28].
In addition, it was judged necessary to conduct a gene expression study through a comparison experiment of fruiting body stress response after NaCl treatment by PO fruiting stage and number of harvests, and a comparison experiment between NaCl, CaCl2, and MgCl2 treatments [29].
Salt stress causes an ion imbalance and nutrient deficiency due to a moisture deficiency from a decrease in osmotic potential around the plant roots because of the increased salt concentration in the soil, toxic effects from ions due to excessive absorption of Na+ and Cl− ions, and the accumulation of a large amount of salt in the plant. Ultimately, salt stress affects the chlorophyll content of plant leaves and inhibits photosynthesis by interfering with the photophosphorylation reaction of chloroplasts, and a large number of electrons that are not used for photosynthesis are transferred to oxygen molecules to generate harmful active oxygen radicals and limiting growth [30,31].
Because soil is continuously becoming higher in salinity due to drought, environmental stress, reclaimed land projects, etc. around the world, demand is increasing for salinity tolerant crops for stable cultivation [32,33] as well as stable crops for growth in environmental stress conditions. Transformation disaster tolerant crops are being developed using transformation technology and genomic information for growth [34].
Unlike general crops, mushrooms are not cultivated in soil but are grown using logs or sawdust media; thus, it is thought that there will be no damage caused by the high salinity of the soil. However, to deal with the instability of the supply for wood used as sawdust medium, which may be caused by the high salinity in soil due to various environmental stressors, research is actively being conducted to use various agricultural products and food by-products as substitute materials for mushroom cultivation. There will be an advantage to using discarded by-products as resources, but in order to use them as stable raw materials in mushroom cultivation media, it is necessary to consider the salt contained in these by-products [35].
Therefore, this study was conducted to confirm the effect of salt on mushroom growth by comparing the gene expression patterns. The results of this study could contribute to breeding research.

Author Contributions

H.-Y.P. and Y.-J.P. contributed equally to this work and share first authorship; S.-C.L. drafted the work and prepared the figures; project administration, funding acquisition was performed by M.-J.J. All authors have read and agreed to the published version of the manuscript.

Funding

This work was carried out with the support of “Development of standard medium and safety research for export mushroom farming cost reduction (Project No. PJ016110032022)” Rural Development Administration (RDA), Republic of Korea.

Data Availability Statement

No applicable.

Conflicts of Interest

The authors declare no conflict of interest.

References

  1. Gull, A.; Lone, A.A.; Wani, N.U.I. Biotic and Abiotic Stresses in Plants; IntechOpen: London, UK, 2019; pp. 1–19. [Google Scholar] [CrossRef] [Green Version]
  2. Dhanya Thomas, T.T.; Jos, T.P. UV radiation priming: A means of amplifying the inherent potential for abiotic stress tolerance in crop plants. Environ. Exp. Bot. 2017, 138, 57–66. [Google Scholar] [CrossRef]
  3. Jang, M.J.; Lee, Y.H.; Cho, Y.K.; Koo, H.M.; Oh, T.S. Growth properties of Neolentinus lepideus according to the light environment. J. Mushroom 2015, 13, 125–128. [Google Scholar] [CrossRef] [Green Version]
  4. Won, S.Y.; Jang, M.J.; Ju, Y.C.; Lee, Y.B. Optimum CO2 Concentration for Fruit-body Formation and Yieldof Pleurotus ferulae Mushroom in the Growing Facilitiyfor Bottle Cultivation. J. Bio-Environ. Control 2010, 19, 77–81. [Google Scholar]
  5. Qin, F.; Shinozaki, K.; Yamaguchi-Shinozaki, K. Achievements and challenges in understanding plant abiotic stress responses and tolerance. Plant Cell Physiol. 2011, 52, 1569–1582. [Google Scholar] [CrossRef] [PubMed] [Green Version]
  6. Tuteja, N. Abscisic acid and abiotic stress signaling. Plant Signal. Behav. 2007, 2, 135–138. [Google Scholar] [CrossRef] [Green Version]
  7. Wu, X.; Yuan, J.; Luo, A.; Chen, Y.; Fan, Y. Drought stress and re-watering increase secondary metabolites and enzyme activity in dendrobium moniliforme. Ind. Crops Prod. 2016, 94, 385–393. [Google Scholar] [CrossRef]
  8. Wang, W.; Vinocur, B.; Altman, A. Plant responses to drought, salinity and extreme temperatures: Towards genetic engineering for stress tolerance. Planta 2003, 218, 1–14. [Google Scholar] [CrossRef]
  9. Ma, L.; Li, Y.; Yu, C.; Wang, Y.; Li, X.; Li, N.; Bu, N. Alleviation of exogenous oligochitosan on wheat seedlings growth under salt stress. Protoplasma 2012, 249, 393–399. [Google Scholar] [CrossRef]
  10. Rivero, R.M.; Mestre, T.C.; Mittler, R.O.N.; Rubio, F.; Garcia-Sanchez, F.R.A.N.C.I.S.C.O.; Martinez, V. The combined effect of salinity and heat reveals a specific physiological, biochemical and molecular response in tomato plants. Plant Cell Environ. 2014, 37, 1059–1073. [Google Scholar] [CrossRef]
  11. Chokshi, K.; Pancha, I.; Ghosh, A.; Mishra, S. Salinity induced oxidative stress alters the physiological responses and improves the biofuel potential of green microalgae Acutodesmus dimorphus. Bioresour. Technol. 2017, 244, 1376–1383. [Google Scholar] [CrossRef]
  12. Tresner, H.D.; Hayes, J.A. Sodium chloride tolerance of terrestrial fungi. Appl. Microbiol. 1971, 22, 210–213. [Google Scholar] [CrossRef]
  13. Jhune, C.S.; Sul, H.J.; Kong, W.S.; You, Y.B.; Kim, J.H.; Cheong, J.C.; Lee, C.J. Effects of NaCl Concentration on Mycelial Growth and Fruiting Body Yields of Oyster Mushrooms, Pleurotus spp. J. Mushroom 2009, 7, 173–181. [Google Scholar]
  14. Muthangya, M.; Hashim, S.O.; Amana, J.M.; Mshandete, A.M.; Kivaisi, A.K. Optimization of Pleurotus mushroom cultivation on saline sisal solid waste. World Appl. Sci. J. 2013, 23, 1146–1150. [Google Scholar]
  15. Boumaaza, B.; Benkhelifa, M.; Belkhoudja, M. Effects of two salts compounds on mycelial growth, sporulation, and spore germination of six isolates of Botrytis cinerea in the western north of Algeria. Int. J. Microbiol. 2015, 2015, 572626. [Google Scholar] [CrossRef] [Green Version]
  16. Livak, K.J.; Schmittgen, T.D. Analysis of relative gene expression data using real-time quantitative PCR and the 2− ΔΔCT method. Methods 2011, 25, 402–408. [Google Scholar] [CrossRef] [PubMed]
  17. Lee, H.D.; Kim, Y.G.; Kim, H.G.; Han, G.H.; Moon, C.S.; Hur, I.B. Bottle Cultivation of Pleurotus ostreatus and Agrocybe aegerita using agricultural by-product. Korean J. Mycol. 1998, 26, 47–50. [Google Scholar]
  18. Chang, H.Y.; Park, H.S.; Yoon, J.S. Substitute cheap supplements development for Pleurotus ostreatus cultivation usiug food by-product dried wastes. J. Mushroom 2008, 6, 126–130. [Google Scholar]
  19. Chang, Q.; Griest, T.A.; Harter, T.M.; Petrash, J.M. Functional studies of aldo-keto reductases in Saccharomyces cerevisiae. Biochim. Biophys. Acta (BBA) Mol. Cell Res. 2007, 1773, 321–329. [Google Scholar] [CrossRef] [PubMed] [Green Version]
  20. Petrash, J.M.; Murthy BS, N.; Young, M.; Morris, K.; Rikimaru, L.; Griest, T.A.; Harter, T. Functional genomic studies of aldo–keto reductases. Chem. Biol. Interact. 2001, 130, 673–683. [Google Scholar] [CrossRef]
  21. Yu, J.; Sun, H.; Zhang, J.; Hou, Y.; Zhang, T.; Kang, J.; Long, R. Analysis of Aldo-Keto Reductase Gene Family and Their Responses to Salt, Drought, and Abscisic Acid Stresses in Medicago truncatula. Int. J. Mol. Sci. 2020, 21, 754. [Google Scholar] [CrossRef] [Green Version]
  22. Chen, S.; Liu, J.; Pei, H.; Li, J.; Zhou, J.; Xiang, H. Molecular investigation of a novel thermostable glucan phosphorylase from Thermoanaerobacter tengcongensis. Enzym. Microb. Technol. 2007, 41, 390–396. [Google Scholar] [CrossRef]
  23. Schinzel, R.; Nidetzky, B. Bacterial α-glucan phosphorylases. FEMS Microbiol. Lett. 1999, 171, 73–79. [Google Scholar] [CrossRef] [PubMed]
  24. Zhang, T.; Wang, S.; Lin, Y.; Xu, W.; Ye, D.; Xiong, Y.; Guan, K.L. Acetylation negatively regulates glycogen phosphorylase by recruiting protein phosphatase 1. Cell Metab. 2012, 15, 75–87. [Google Scholar] [CrossRef] [PubMed] [Green Version]
  25. Hofrichter, M.; Kellner, H.; Pecyna, M.J.; Ullrich, R. Fungal unspecific peroxygenases: Heme-thiolate proteins that combine peroxidase and cytochrome P450 properties. Monooxygenase Peroxidase Peroxygenase Prop. Mech. Cytochrome 2015, 450, 341–368. [Google Scholar]
  26. Alonso-Gil, S.; Parkan, K.; Kaminský, J.; Pohl, R.; Miyazaki, T. Unlocking the Hydrolytic Mechanism of GH92 α-1, 2-Mannosidases: Computation Inspires the use of C-Glycosides as Michaelis Complex Mimics. Chem. A Eur. J. 2022, 28, e202200148. [Google Scholar] [CrossRef] [PubMed]
  27. Ahn, Y.O.; Zheng, M.; Bevan, D.R.; Esen, A.; Shiu, S.H.; Benson, J.; Shih, M.C. Functional genomic analysis of Arabidopsis thaliana glycoside hydrolase family 35. Phytochemistry 2007, 68, 1510–1520. [Google Scholar] [CrossRef]
  28. Yan, S.; Tang, Z.; Su, W.; Sun, W. Proteomic analysis of salt stress-responsive proteins in rice root. Proteomics 2005, 5, 235–244. [Google Scholar] [CrossRef]
  29. Munns, R.; Tester, M. Mechanisms of salinity tolerance. Annu. Rev. Plant Biol. 2008, 59, 651. [Google Scholar] [CrossRef] [Green Version]
  30. Marschner, H. Minernal Nutirition of Higher Plant; Academic Press: London, UK, 1995; pp. 662–663. [Google Scholar]
  31. Lee, B.M.; Shim, S.I.; Lee, S.G.; Kang, B.H.; Chung, I.M.; Kim, K.H. Physiological response on saline tolerance between halophytes and glycophytes. Korean J. Environ. Agric. 1999, 18, 61–65. [Google Scholar]
  32. Choi, S.C.; Kim, J.G.; Choo, Y.S. Effects of Salt Stress on Inorganic Ions and Glycine Betaine Contents in Leaves of Beta vulgaris var. cicla L. Korean J. Ecol. Environ. 2013, 46, 388–394. [Google Scholar] [CrossRef]
  33. Lee, S.B.; Cho, K.M.; Shin, P.; Yang, C.H.; Back, N.H.; Lee, K.B.; Chung, D.Y. Effect of soil salinity on growth, yield and nutrients uptake of whole crop barley in newly reclaimed land. Korean J. Environ. Agric. 2013, 32, 332–337. [Google Scholar] [CrossRef] [Green Version]
  34. Park, S.C.; Kim, M.D.; Kim, S.H.; Kim, Y.H.; Jeong, J.C.; Lee, H.S.; Kwak, S.S. Enhanced drought and oxidative stress tolerance in transgenic sweetpotato expressing a codA gene. J. Plant Biotechnol. 2015, 42, 19–24. [Google Scholar] [CrossRef]
  35. Phae, C.G.; Chu, Y.S.; Park, J.S. Investigation of Affect on Composting process and plant growth of Salt concetration in food waste. J. Korea Org. Resour. Recycl. Assoc. 2002, 10, 103–111. [Google Scholar]
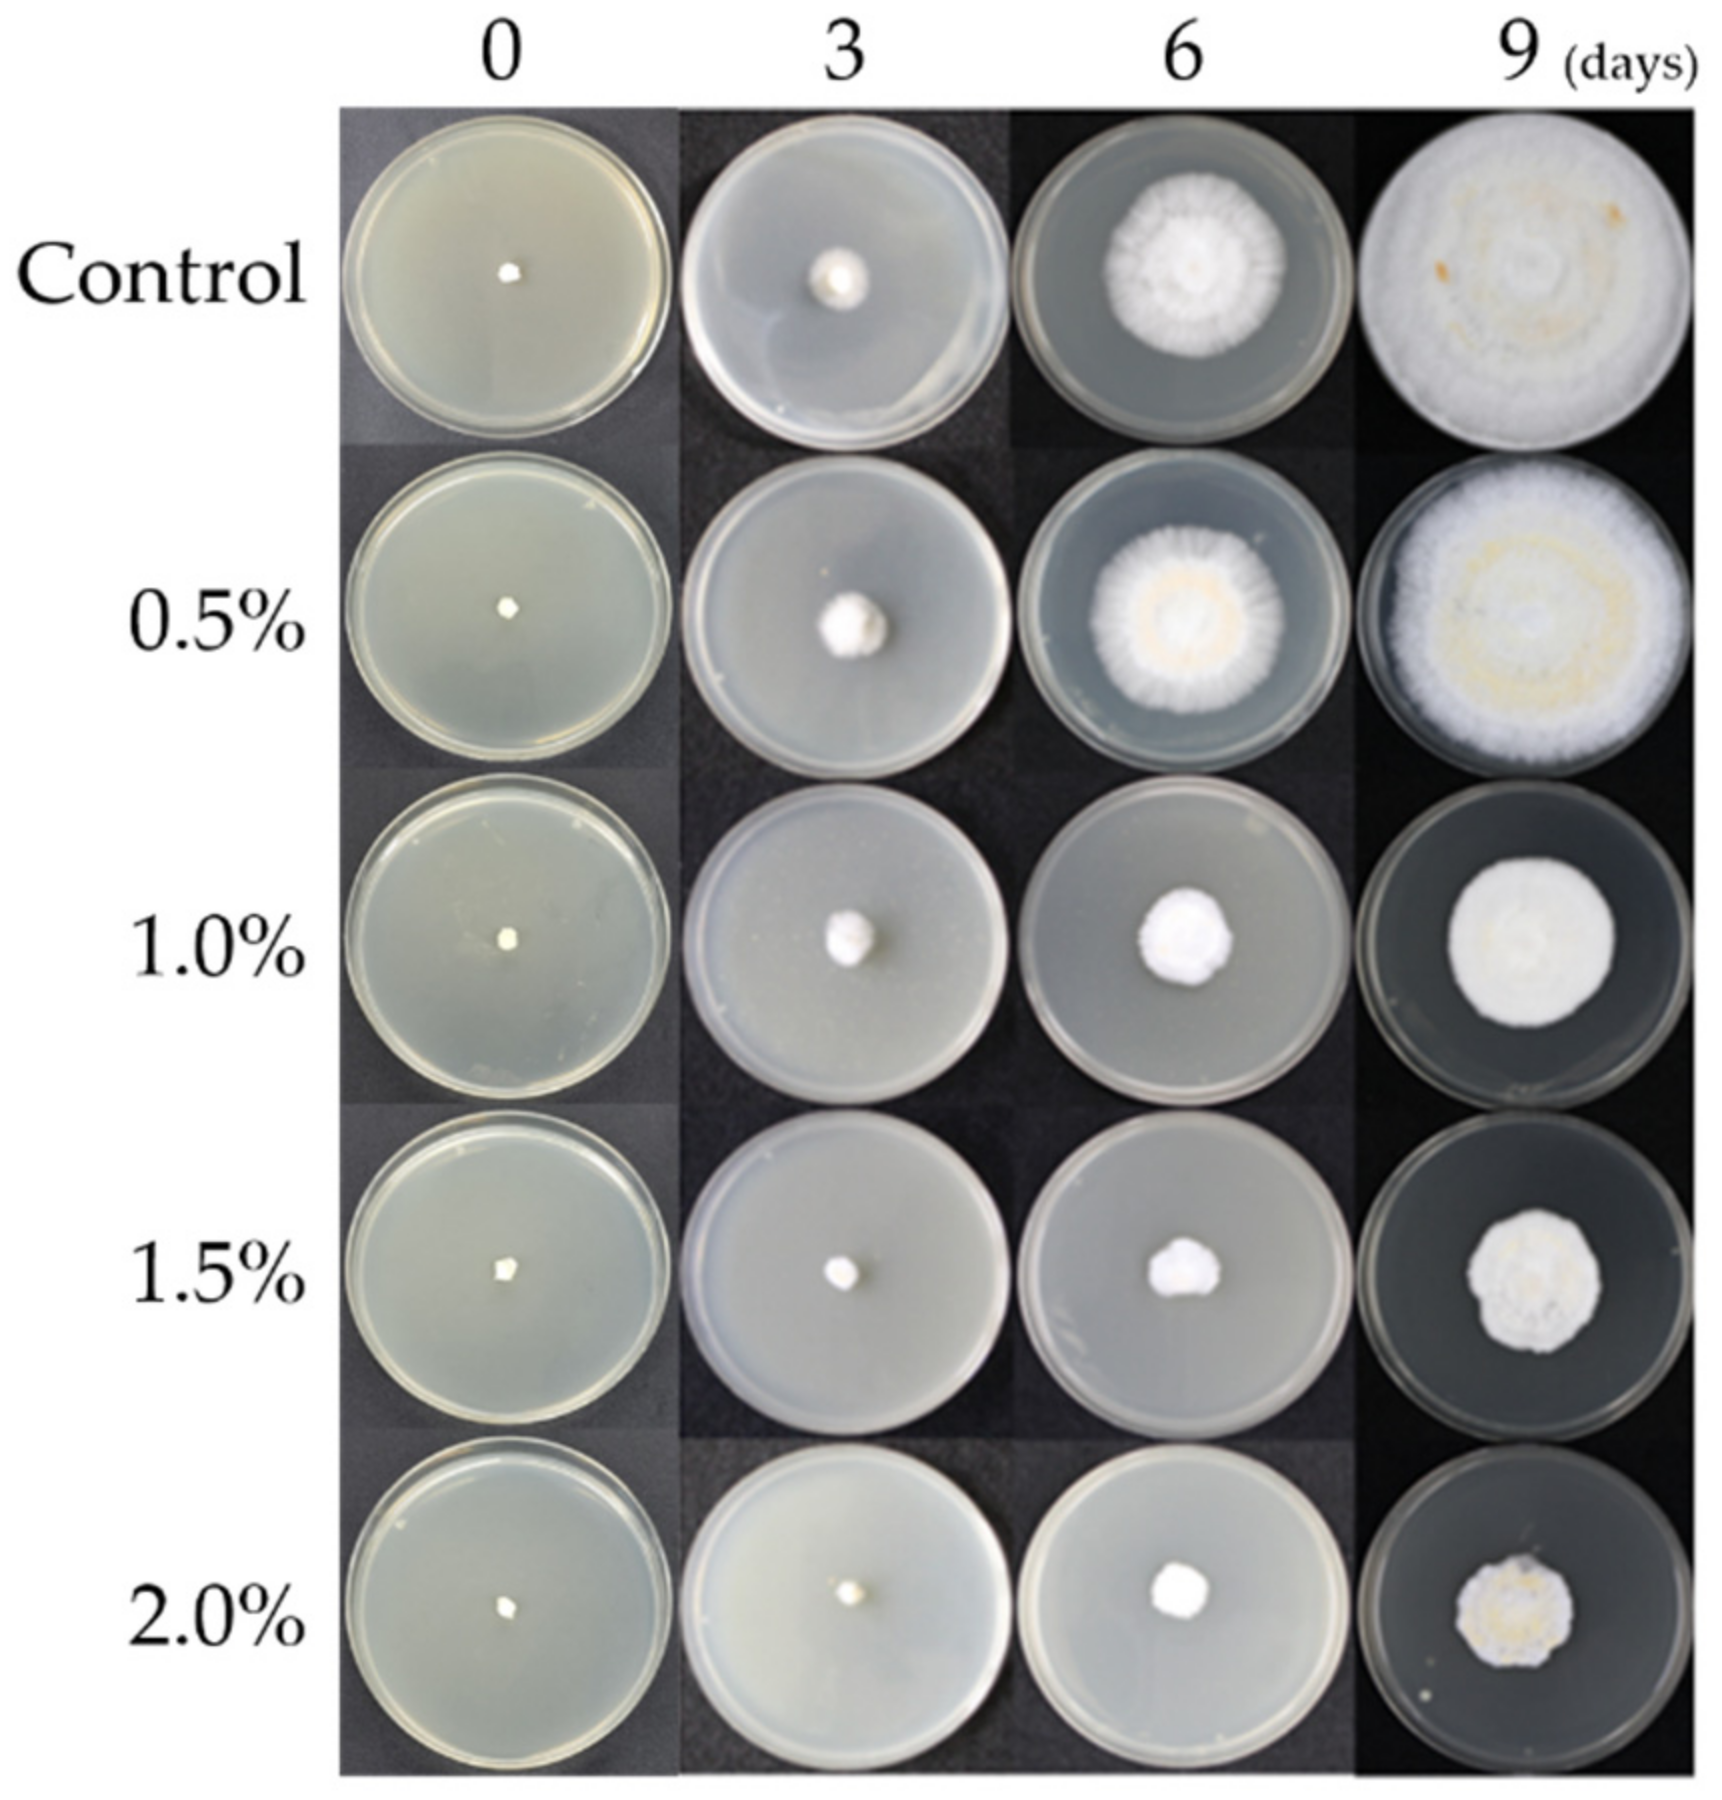
Figure 1. Comparison of growth of control and NaCl-treated group (0.5%, 1%, 1.5%, 2%) medium (culture).
Horticulturae 08 01147 g001
Figure 2. Venn diagram analysis of Pleurotus ostreatus by NaCl concentration.
Horticulturae 08 01147 g002
Figure 3. (A) DEG scatter plot analysis of control and NaCl 1.0% condition of Pleurotus ostreatus, red, 4-fold change over; green, 4-fold change lower. (B) DEG scatter plot analysis of control and NaCl 2.0% condition of Pleurotus ostreatus, red, 4-fold change over; green, 4-fold change lower.
Horticulturae 08 01147 g003
Figure 4. qRT-PCR results normalized using delta-delta ct method. Means with different letters within a row are significantly different from each other at p <0.05 as determined by Duncan’s multiple range test.
Horticulturae 08 01147 g004
Table 1. List of qRT-PCR primers used in this study.
Gene SymbolSequenceTm (°C)Product Size
akor3F: TTACGGCTCTCGACAGAGGA
R: TTACCACCCAAGGACCTCCA
F: 59.3
R: 59.3
92 bp
PLEOSDRAFT
_1058949
F: TCATGGGCAGAACCCTTGAC
R: ACCACCATTACCAAGAGCGG
F: 59.3
R: 59.3
137 bp
Hydph16F: ACATCCGTCATTGCTCTCGT
R: GCTTCAACACCAGATGCACG
F: 57.3
R: 59.3
131 bp
plyBF: GGAGGCCGTTCTCTCAAGAC
R: TTACCACCCAAGGACCTCCA
F: 61.4
R: 59.3
91 bp
HTP1F: TCACCACCACCAAGTTCCAC
R: ATGGTGCTCTGATTCGGGAC
F: 59.3
R: 59.3
147 bp
PLEOSDRAFT
_1063499
F: CTCGCCAGAACTACGTCTCC
R: CTATAACCTGCCCGCTCTCG
F: 61.4
R: 61.4
114 bp
18s rRNAF: GCATGTGCACGCTTCACTAG
R: CGTAGTCACACCGAGACGTT
F: 59.3
R: 59.3
117 bp
Table 2. qRT-PCR cycle conditions.
StepTimeTemperature (°C)
Denaturation10 s95
Combined
Annealing/extension
30 s54–56
Number of cycles39 cycles-
Table 3. Mycelium growth in PDA medium (culture) (unit: mm).
TreatmentsIncubation Period (Days)
369
Control14.8 ± 0.8 a40.7 ± 1.5 a80.0 ± 1.8 a
NaCl 0.5%14.7 ± 0.5 a40.3 ± 0.8 a78.7 ± 0.9 a
NaCl 1.0%8.5 ± 0.4 b22.7 ± 1.0 b45.4 ± 1.2 b
NaCl 1.5%7.6 ± 0.5 b18.2 ± 1.8 c32.3 ± 2.4 c
NaCl 2.0%6.3 ± 0.8 c8.2 ± 1.2 d25.5 ± 2.1 d
Means with different letters within a row are significantly different from each other at p <0.05 as determined by Duncan’s multiple range test.
Table 4. Gene list of Pleurotus ostreatus by different NaCl concentrations.
Gene Symbol4-Fold Change *Annotation
Control1.0%/Con2.0%/ConProduct
PLEOSDRAFT_10747661025.3421.30Glycoside hydrolase family 43 protein
PLEOSDRAFT_110888416813.614.77Hypothetical protein
akor3410.2322.52Putative aldo-keto reductase
PLEOSDRAFT_27283108.4524.12Chitin deacetylase
PLEOSDRAFT_10589497647.705.31Alpha-1,4 glucan phosphorylase
(EC 2.4.1.1)
Hydph169430.1950.172Hydrophobin
plyB6260.1270.094Pleurotolysin B
HTP120770.1160.141Heme-thiolate peroxidase
VMH1670.1160.094Hydrophobin
PLEOSDRAFT_10634991050.0850.211Glycoside hydrolase family 92 protein
PLEOSDRAFT_10619182050.0710.135Pectinesterase
PLEOSDRAFT_175423170.0570.139Small secreted protein with six-cysteine repeat motif-containing protein
plyA9220.0360.042Ostreolysin-like protein
MnP37880.0160.041Peroxidase
* The values in this table represent the relative expression level compared to the control. A value of 1.0 or more means an increase in gene expression, and a value of 1.0 or less means a decrease in gene expression.
Publisher’s Note: MDPI stays neutral with regard to jurisdictional claims in published maps and institutional affiliations.