Article

Full-Length Transcriptome and Transcriptome Sequencing Unveil Potential Mechanisms of Brassinosteroid-Induced Flowering Delay in Tree Peony

1
College of Agriculture/Tree Peony, Henan University of Science and Technology, Luoyang 471023, China
2
College of Biological Sciences and Biotechnology, Beijing Forestry University, Beijing 100083, China
3
College of Horticulture and Plant Protection, Henan University of Science and Technology, Luoyang 471023, China
*
Authors to whom correspondence should be addressed.
These authors contributed equally to this work.
Horticulturae 2022, 8(12), 1136; https://doi.org/10.3390/horticulturae8121136
Submission received: 21 October 2022 / Revised: 19 November 2022 / Accepted: 30 November 2022 / Published: 2 December 2022

Abstract

:
Tree peony (Paoenia ostii) is a famous Chinese traditional flower well-known in many countries of the world. However, the short and concentrated flowering period of tree peony greatly affects the ornamental and economic value of the flowers. Exogenous brassinosteroid (BR) treatment can delay the flowering period of ostii T. Hong et J. X. Zhang var. lishizhenenii B. A. Shen for 3 days, but the underlying regulatory mechanism remains elusive. Here, full-length transcriptome and transcriptome sequencing were used to mine key genes related to BR-induced delayed flowering in tree peony. The transcriptome sequencing of the petals yielded 21.27 G clean data and 62,229 isoforms. Among them, 58,218 isoforms were annotated in NR, NT, SwissProt, KEGG, KOG, InterPro and GO databases. GO and KEGG analyses showed that 2460 DEGs were related to delayed flowering in response to BR. Additionally, a total of seven genes affecting flowering were annotated from 11 isoforms, which responded to BR through three pathways to delay the flowering of P. ostii var. lishizhenii. BR treatment increased the expression of BRASSINOSTEROID-SIGNALING KINASE3 (BSK3), potentially by promoting BRI1 ASSOCIATED KINASE RECEPTOR 1 (BAK1). Moreover, BR treatment suppressed the expression of SQUAMOSA-PROMOTER BINDING PROTEIN-LIKE 1 (SPL1), possibly to inhibit the expressions of downstream WRKY genes and APETALA 2 (AP2). Meanwhile, BR treatment promoted the expression of DELLA, which might inhibit the expressions of CONSTANS (CO) and SPL. These results suggest a theoretical basis for further analyses of the molecular mechanism of flowering regulation in tree peony.

1. Introduction

Tree peony (Paeonia suffruticosa Andrews.) is a perennial deciduous shrub belonging to the genus Paeonia [1]. It is one of the earliest known horticultural and medicinal plants in the world [2]. Tree peony is loved by most people in the world because of its dignified and elegant flowers [3]. It is a traditional famous flower in China and has a reputation of being the “king of flower” [4]. The flowering period is an important factor that directly affects the ornamental value and industrial use of flowers [5]. However, the tree peony natural flowering period is short and concentrated, and it only lasts about 10 days [6,7,8]. This is far from meeting people’s needs for tourism and ornamental purposes. Therefore, it is necessary to explore the flowering regulation mechanism in tree peony.
In recent years, the regulation of the flowering time in tree peony has been a key research topic. Many studies on the regulation of the flowering period have been carried out by using second-generation sequencing technology. In a study relating to chilling fulfillment, 23,652 contigs and singletons were produced by the de novo assembly of flower buds using pyrosequencing on the Roche 454 GS FLX platform, which provided genetic information for mining genes related to the endo-dormancy of tree peony [9]. Using the bulked segregant RNA-seq (BSR-seq) on the Illumina sequencing platform, 291 unigenes related to flowering time were screened from tree peony petals [10]. A high-density genetic map was constructed using genotyping-by-sequencing (GBS) from the interspecific F1 population of P. ostii “Fengdan Bai” and P. suffruticosa “Xin Riyuejin” [11]. Based on this map, one QTL of the flowering period was detected that explained 20.4% of the phenotypic variance. However, these data were mainly based on next-generation sequencing (NGS) technologies. NGS has obvious disadvantages, especially for polyploid genomes, which consist of short-read and amplification biases [12,13].
With the development of molecular biology technology, full-length transcripts can be obtained using third-generation sequencing [14]. Compared with the transcription tags assembled using second-generation sequencing platforms, third-generation sequencing has the advantages of a longer read length, a lower splicing cost and the saving of memory and computing time [15,16]. Through full-length transcriptome sequencing, a full-length transcript database of jasmine flower containing 366,081 non-redundant isoforms was constructed. Among them, 280,326 (76.57%) isoforms were annotated in NT, NR, SwissProt, KEGG, KOG, Pfam and GO databases. Combined with a second-generation transcriptome analysis, 52 differentially expressed transcripts involving terpene metabolic pathways and 28 differentially expressed transcripts involving phenylpropane/benzene metabolic pathways were identified, including 31 β-glucosidase transcripts that may be related to the formation of aroma in jasmine flower after harvest [17]. The full-length transcripts of flowering and non-flowering saffron were obtained using third-generation sequencing technology. A total of 22.85 G data and 75,351 full-length saffron unigenes were generated, and 79,028 SSRs, 72,603 IncRNAs and 25,400 alternative splicing (AS) events were further obtained. At the same time, the Illumina RNA-seq platform was used to sequence another 15 corms with different flower numbers, and a total of 62 corms were identified in vernalization-induced flowering-related genes in the gibberellin pathway, photoperiod pathway, autonomous pathway and age pathway, and a schematic diagram was drawn [18]. A total of 346,270 full-length non-chimeric reads were generated from the full-length transcriptome of Rhododendron alpine using single-molecule real-time sequencing technology, from which 75,002 high-quality full-length transcripts were obtained, 55,255 complete open reading frames, 7140 alternative splicing events, 2011 long non-coding RNAs and 3150 transcription factors were identified, and it was found through a KEGG pathway analysis that 96 transcripts encode enzymes related to anthocyanin synthesis [19]. Subsequently, a total of 833,137 full-length non-chimeric reads were obtained from Rhododendron using PacBio sequencing technology, and 726,846 high-quality full-length transcripts were found. Most of the genes were enriched in the flavonoid biosynthesis pathway. Eight key genes of the anthocyanin biosynthesis pathway were further screened and analyzed using qRT-PCR [20].
Brassinosteroids (BRs) are a group of steroid hormones that regulate plant growth and development, including flowering. In a previous study, the leaves of P. ostii var. lishizhenii were sprayed with different concentrations of BR 25 μg/L, 50 μg/L, 100 μg/L and 200 μg/L, and it was found that 50 μg/L BR (BR50) treatment had the best effect on the delay of flowering, which lasted for three days [21]. In this study, full-length transcriptome and transcriptome sequencing were used to mine differentially expressed genes in response to BR treatment. BR treatment can delay the flowering of P. stia var. lishizhenii by promoting the expression of BAK1, BSK3, DELLA and AP2 and by reducing the expression of CO and SPL in multiple pathways. These results are helpful to better understand the regulation of the flowering period and to provide valuable genetic information for the further study of flowering regulation using BRs in tree peony.

2. Materials and Methods

2.1. Plant Materials

The plant materials used in this study were the same as those described previously by Zhang et al. [21]. Routine management was implemented in the field. The plants with consistent growth, robust and plump scales and no disease or insect pests were selected as test materials.

2.2. BR Treatment

At the flowering bud stage, the leaves of tree peony were treated with BR at a concentration of 50 μg/L. The control (CK) group was sprayed at the same time with double-distilled water. The petals of the CK and treatment groups were sampled when they were in the following four stages: The first stage was bud burst. The second stage was flower opening. The third stage was full bloom. The fourth stage was post-bloom. The CK samples in the four stages were named CK1, CK2, CK3 and CK4, respectively. The BR treatment samples in the four stages were named BR1, BR2, BR3 and BR4, respectively. The petals of each sample were collected from more than 5 plants at the same growth and development stages. Three biological replicates were performed for each developmental stage for the CK and BR treatment samples. The samples were immediately frozen with liquid nitrogen after collection, and they were taken back to the laboratory for storage at −80 °C.

2.3. RNA Preparation

The total RNA of 24 samples was extracted using RNAprep Pure Plant Kit (Tiangen, Beijing, China). RNA purity (OD260/280 and OD260/230), concentration and integrity (RIN value and 28S/18S) were detected using a NanoDrop 2000 UV–Vis spectrophotometer and an Agilent 2100 Bioanalyzer.

2.4. PacBio Iso-Seq Library Preparation and Sequencing

An equal amount of RNA from every sample in the CK group was mixed as instructed by Pacific Biosciences. The first strand of cDNA was synthesized using a Clontech SMARTer PCR cDNA Kit. The Coding DNA Sequence (CDS) Primer IIA was first annealed to the polyA+ tail of the transcripts. The products of the first strand were diluted using Elution Buffer (EB) and then subjected to large-scale PCR. Then, the cycle number was used to generate ds cDNA. The size selection of the transcripts, which were >4 kb, was carried out using the BluePippin system. The full-length cDNA ends were repaired, and a SMRTBell template library was constructed. Sequencing was implemented using the Pacific Biosciences Sequel platform.

2.5. Analysis of the Full-Length Transcriptome

According to the subread data, each Read of Insert (ROI) was identified, and then the consensus form of each ROI was integrated. The full-length non-chimeric reads and the non-full-length reads of the ROIs were used for the next analysis. The full-length non-chimeric reads were gathered for consensus. If there were sufficient full-length (FL) coverage and non-FL coverage, Quiver was used to improve the consensus. This module uses the Iterative Clustering for Error Correction (ICE) algorithm to predict new consistent subtypes from classification ROIs, and then it uses Quiver to polish the predicted consistent subtypes. The script divides the Quiver optimization output into “low QV (LQ)” or “high QV (HQ)” according to the Quiver output QV (indicating confidence in the consensus call). For libraries below 3 K, the default minimum Quiver precision required to classify the same type as high quality was 0.99. For libraries between 3 and 6 K, the minimum Quiver accuracy was set to 0.98. For libraries between 5~10 K, the minimum Quiver accuracy was set to 0.95. The high QV consensus was performed in next analysis. Because no reference genome was available, cd-hit-est was used to remove redundancy according to sequence similarity. We used Blast to align the transcripts with NT, NR, KOG, KEGG and SwissProt in order to obtain the annotation; Blast2GO with NR annotation to obtain the GO annotation; InterProScan5 to obtain the InterPro annotation; and TransDecoder (v 3.0.1, Brian Haas, San Francisco, CA, America) to identify the candidate coding area. The longest open reading frame (ORF) was extracted, and then the coding region was predicted using Blast on SwissProt and Hmmscan. Finally, MISA was used to find the SSR in transcripts.

2.6. BGISEQ-500 RNA-Seq

The total RNA of eight samples with three biological replications was prepared for transcriptome sequencing. Firstly, the total RNA was purified to enrich mRNA with poly A. Secondly, the obtained RNA was fragmented using the interrupting buffer. The random hexamer (N6) primer was subjected to reverse transcription and then to form double-stranded cDNA (dscDNA). The dscDNA strand was linked to a primer with a sticky “T” at the 3′ end. Then, the ligation products were amplified. The PCR product was used to construct a circular DNA library and then sequenced on the BGISEQ-500 RS platform at BGI (Shenzhen, China).

2.7. BGISEQ-500 Data Analysis

After qualified quality control, high-quality clean reads were compared to the full-length transcriptome using Bowtie2 software (V2.2.5, Be Langmead, Baltimore, MD, America). Gene expression levels were quantified using RNA-seq from the expectation maximization (RSEM) package (V1.2.8, Bo Li and Colin N Dewey, Berkeley, CA, America) and normalized using the fragments per kilobase million (FPKM) method. Significantly differentially expressed genes (DEGs) were detected in each treatment using the DEGseq method described previously [22]. The genes with a fold change of ≥2 and a Q-value of ≤ 0.001 were screened as having significant differential expressions. According to the results of differential gene detection, the pheatmap package in R software (V3.6.1, Ross Ihaka and Robert Gentleman, Auckland, New Zealand) was used for a hierarchical clustering analysis. According to the annotation results, GO functional classification and KEGG biological pathway classification were carried out for the differentially expressed genes. The phyper function in R software calculated the p-value for an enrichment analysis. The p-value was subjected to FDR correction. Normally, FDR <= 0.01 function is considered significant. The genes were aligned to the Plant Resistance Gene Database (PRGdb). Genes with the ability to encode transcription factors (TFs) were predicted. At the same time, the TF family to which the gene belonged was classified and counted.

2.8. qRT-PCR Analysis

The total RNA of eight samples with three biological replications was isolated, reverse-transcribed to cDNA and prepared for a qRT-PCR assay. A FastQuant RT Kit (with gDNase) and 2xSG Fast qPCR Master Mix were used to generate cDNA and to subsequently perform qRT-PCR, respectively. The internal control gene was actin because its expression is relatively stable in tree peony. Gene-specific primers were designed via DNAMAN software (V5.2.9, LynnonBiosoft, San Ramon, CA, America) (Tables S1 and S2). The qRT-PCR of each sample was repeated three times. The 22−ΔΔCt method was used to calculate the expression level of the gene in each sample.

3. Results and Discussion

3.1. The Full-Length Transcriptome Sequencing and Functional Annotation

The pooled total RNA of all 12 CK samples at different development stages was used to generate an informative reference transcriptome database. A total of 22.25 GB polymerase reads (711,498 reads) were produced (Table 1). After filtration, a total of 13,978,732 subreads (21.27 Gb of clean data) were obtained. Then, 694,572 ROIs were generated. The mean read length of the ROIs was 1951 bp. The mean number of passes was 14. The ROIs were classified into four categories: short reads, chimeric reads, non-full-length reads and full-length non-chimeric reads. There were 441,069 full-length non-chimeric reads accounting for 63.5%, based on the presence of bar-coded primers and poly A tails. A total of 37.6% of all ROIs were non-full-length reads (Figure 1a). A total of 267,616 isoforms were obtained, comprising 135,541 HQ transcripts and 132,075 LQ transcripts (Table 2). The mean quality of the HQ isoforms was 0.9988. The high-quality consensus isoforms of each library were merged into a final result, and redundancy was removed. A final total of 62,229 isoforms was obtained after redundancy was removed. The mean length of the final consensus isoforms was 1636 bp. N50 was 1835 bp. The total base was 101,830,583 bp.
After clustering and polishing, Blast, Blast2GO and InterProScan5 were carried out to perform functional annotation with transcripts against seven public databases (NR, NT, GO, KOG, KEGG, SwissProt and InterPro). A total of 58,218 (93.55%) transcripts were annotated with at least one functional database. A total of 25,090 (40.32%) transcripts were annotated using all seven functional databases. The number of transcripts annotated in these seven databases ranged from 35,643 (57.28%, GO) to 57,193 (91.91%, NR) (Table 3). In total, 51,080 (82.08%), 46,622 (74.92%), 47,429 (76.22%), 48,398 (77.77%) and 51,967 (83.51%) transcripts were annotated using NT, SwissProt, KEGG, KOG and InterPro, respectively.
Of the species that harbored the best Blast hits for the isoforms in the NR database, the top four species were Vitis vinifera (30.36%), Juglans regia (6.42%), Nelumbo nucifera (3.85%) and Ziziphus jujuba (3.62%) (Figure 1b). There were only 951 protein sequence hits found for Paeonia suffruticosa, 837 were found for Paeonia lactiflora, 352 were found for Paeonia delavayi, 248 were found for Paeonia ludlowii, 240 were found for Paeonia veitchii, 226 were fond for Paeonia obovate, 192 were found for Paeonia sp. Sd 0052, 56 were found for Paeonia ostii, 28 were found for Paeonia brownie, 1 was found for Paeonia coriacea, and 1 was found for Paeonia broteri (Table S3).
The full-length transcript was annotated for GO function, and 54 items were mainly enriched, which were divided into three categories: molecular functions, cellular components and biological processes. A high percentage of the genes fell under “cellular process” and “metabolic process” in the biological processes category; a high percentage of the genes fell under “cells”, “cell parts”, “membrane”, “membrane part” and “organelles” in the cellular components category; and “catalytic activity” and “binding” dominated in the molecular functions category (Figure 2a). For the isoforms, various biological pathways, including cellular processes, environmental information processing, genetic information processing, metabolism and organismal systems, were identified using the KEGG pathway analysis. A total of 20 pathways were evaluated (Figure 2b). Among them, one pathway (transport and catabolism) belonged to cellular processes. Two pathways (signal transduction and membrane transport) belonged to environmental information processing. Four pathways belonged to genetic information processing. Eleven pathways belonged to metabolism. More isoforms pertained to global and overview maps (12,024 isoforms) and carbohydrate metabolism (5238 isoforms).
Genes can generate different isoforms by using alternative splicing to encode different proteins [21]. After clustering and error correction, TransDecoder software was used to identify candidate coding regions in the transcripts. The predicted CDS length distribution is shown in Figure 3. A total of 53,760 coding sequences were obtained. The total length was 61,903,650 bp. Among these, the maximum length was 6375 bp, and the minimum length was 297 bp. N50 was 1362 bp. The CDS length mostly ranged from 400 bp to 1900 bp. Of these CDSs, 563 (1.05%) were longer than 3000 bp, 49,255 (91.62%) ranged from 500 bp to 3000 bp, and 4212 (7.83%) were shorter than 500 bp (Figure 3).
Third-generation sequencing technology can produce full-length transcripts without assembly or transcriptome splicing using inference algorithms [23]. Compared with other sequencing technologies, PacBio can provide longer read lengths than next-generation sequencing platforms, with the advantages of longer read lengths, higher accuracy, less bias and epigenetic characterization [24,25]. Therefore, this technology has been widely used in the study of acquiring new genes and alternative splicing isoforms in plants [26,27]. At present, the application of the tree peony transcriptome mainly focuses on the study of second-generation transcriptome sequencing [28]. However, there are few applications of full-length transcriptome sequencing in peony. Therefore, in this study, third-generation full-length transcriptome sequencing was performed on the petals of P. ostii var. lishizhenii at the bud burst stage, the initial blooming stage, the blooming stage and the initial declining stage. A total of 711,498 full-length reads using PacBio Iso-Seq full-length sequencing technology were generated, and 22.25 Gb of polymerase reads and 21.27 Gb of clean data were obtained after filtering. A total of 694,572 ROIs were obtained by identifying the inserts, with an average ROI length of 1951 bp. Through clustering, 135,541 isoforms were obtained with high-quality transcripts. After removing redundancy, 62,229 isoforms were finally obtained with an average length of 1636 bp. Of these, 58,218 (93.55%) isoforms were annotated in at least one public database. In a previous study of tree peony, a total of 230,736 ROIs and 36,767 high-quality transcripts were obtained by sequencing the full-length transcriptome of the roots, stems, leaves, flowers, seeds and fruit pods mixed into one sample [29]. Compared with previous studies, this study has a large amount of sequencing data and a large number of full-length transcripts. In addition, the experimental materials in this study were mixed samples from different developmental stages of peony petals (bud burst stage, initial blooming stage, blooming stage, and the beginning of decline stage), while the petals in previous studies were samples from one stage. In this study, 58,218 transcripts were annotated in at least one database, while 28,850 transcripts were annotated in a previous study [29]. The number of transcripts annotated in this study is more than twice that of the previous study. At the same time, there were only 951 protein sequence hits found for Paeonia suffruticosa. This result indicates that the NR database contains limited information on the genus Paeonia. Therefore, compared with previous studies, the results of this study have more comprehensive full-length transcript information on the flower development process, which can provide reliable and rich genetic information resources for further research on the molecular mechanism of tree peony flowering regulation and petal senescence.

3.2. Differentially Expressed Genes (DEGs) Analysis from Transcriptome Sequencing

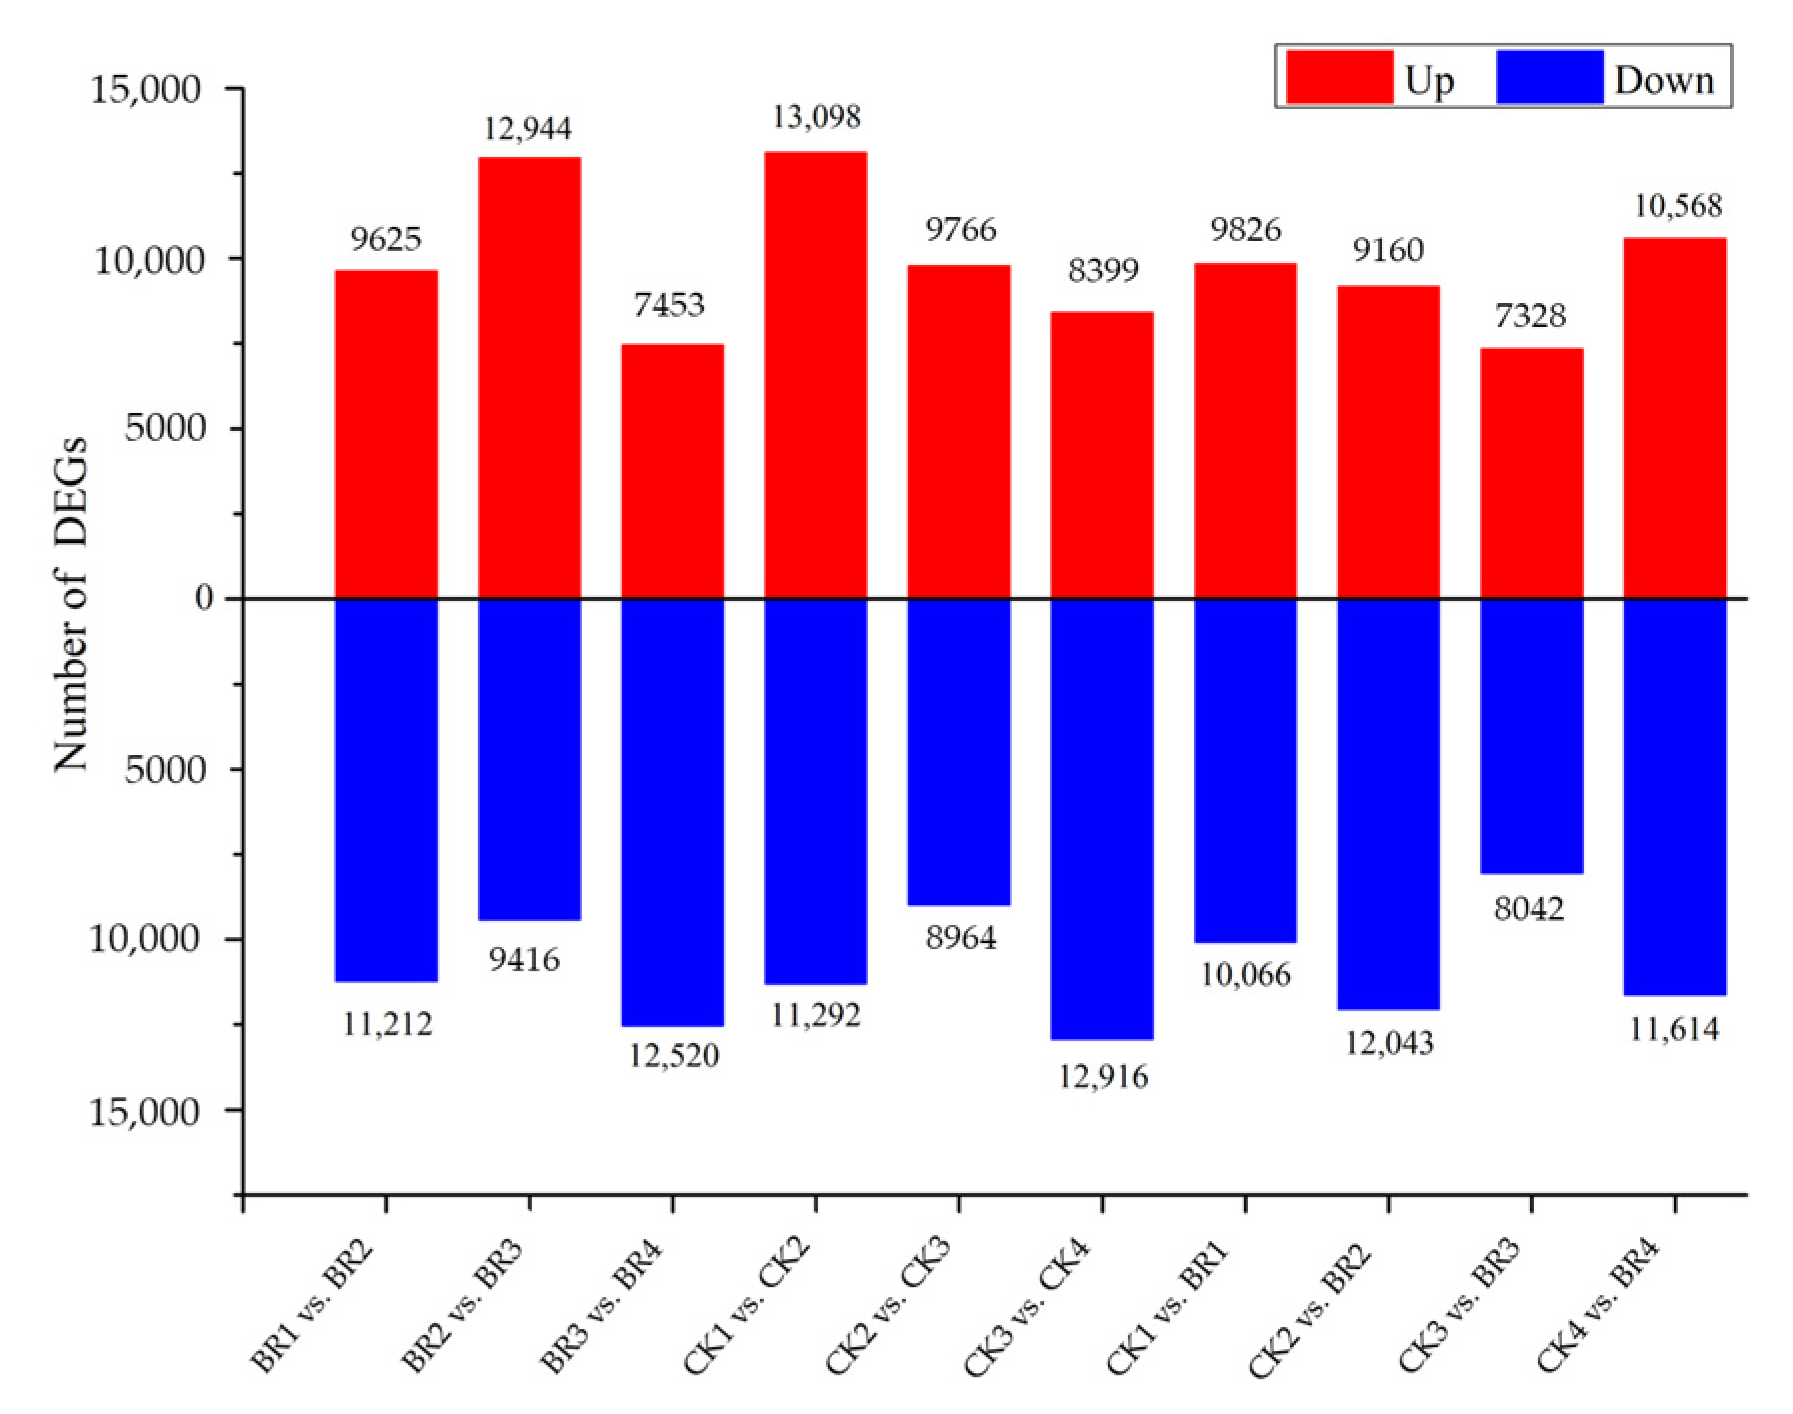
According to the results of Zhang et al. [21], transcriptome data were analyzed for differentially expressed genes. The results of the significantly differentially expressed genes detected are shown in Figure 4 based on the gene expression levels of the individual samples. The number of DEGs for the comparison group ranged from 15,370 to 24,390 (Table S4). There were 24,390 DEGs (13,098 up-regulated and 11,292 down-regulated) in the CK1 vs. CK2 comparison groups, and there were 15,370 DEGs (7328 up-regulated and 8042 down-regulated) in the CK3 vs. BR3 comparison groups. The number of up-regulated DEGs ranged from 7328 (CK3 vs. BR3) to 13,098 (CK1 vs. CK2). The number of down-regulated DEGs ranged from 8042 (CK3 vs. BR3) to 12,916 (CK3 vs. CK4).
As can be seen in Figure 5a, a total of 36,337 DEGs were detected in all the CK comparison groups (CK1 vs. CK2, CK2 vs. CK3 and CK3 vs. CK4). Among these DEGs, 7651 DGEs were detected in every CK comparison group (Figure 5a). A total of 15,890 DEGs were detected in at least one CK comparison group. Moreover, a total of 35,948 DEGs were detected in all of the BR comparison groups (BR1 vs. BR2, BR2 vs. BR3 and BR3 vs. BR4). Among these DEGs, 6960 DEGs were detected in every BR comparison group. A total of 15,686 DEGs were detected in at least one BR comparison group. There were 1903 DEGs detected in every CK comparison group and BR comparison group. Figure 5b shows that a total of 39,570 DEGs were detected in the four CK vs. BR comparison groups (CK1 vs. BR1, CK2 vs. BR2, CK3 vs. BR3 and CK4 vs. BR4). There were 2881 DEGs detected in each of the CK vs. BR comparison groups. A total of 14,915 DEGs were detected in at least one CK vs. BR comparison group.
To screen the DEGs that respond to the BR-induced delayed flowering time of tree peony more accurately, we combined all the comparison groups and found a total of 2460 DEGs in CK vs. BR comparison groups that were not found in any CK comparison group or in any BR comparison group (Figure 5c).
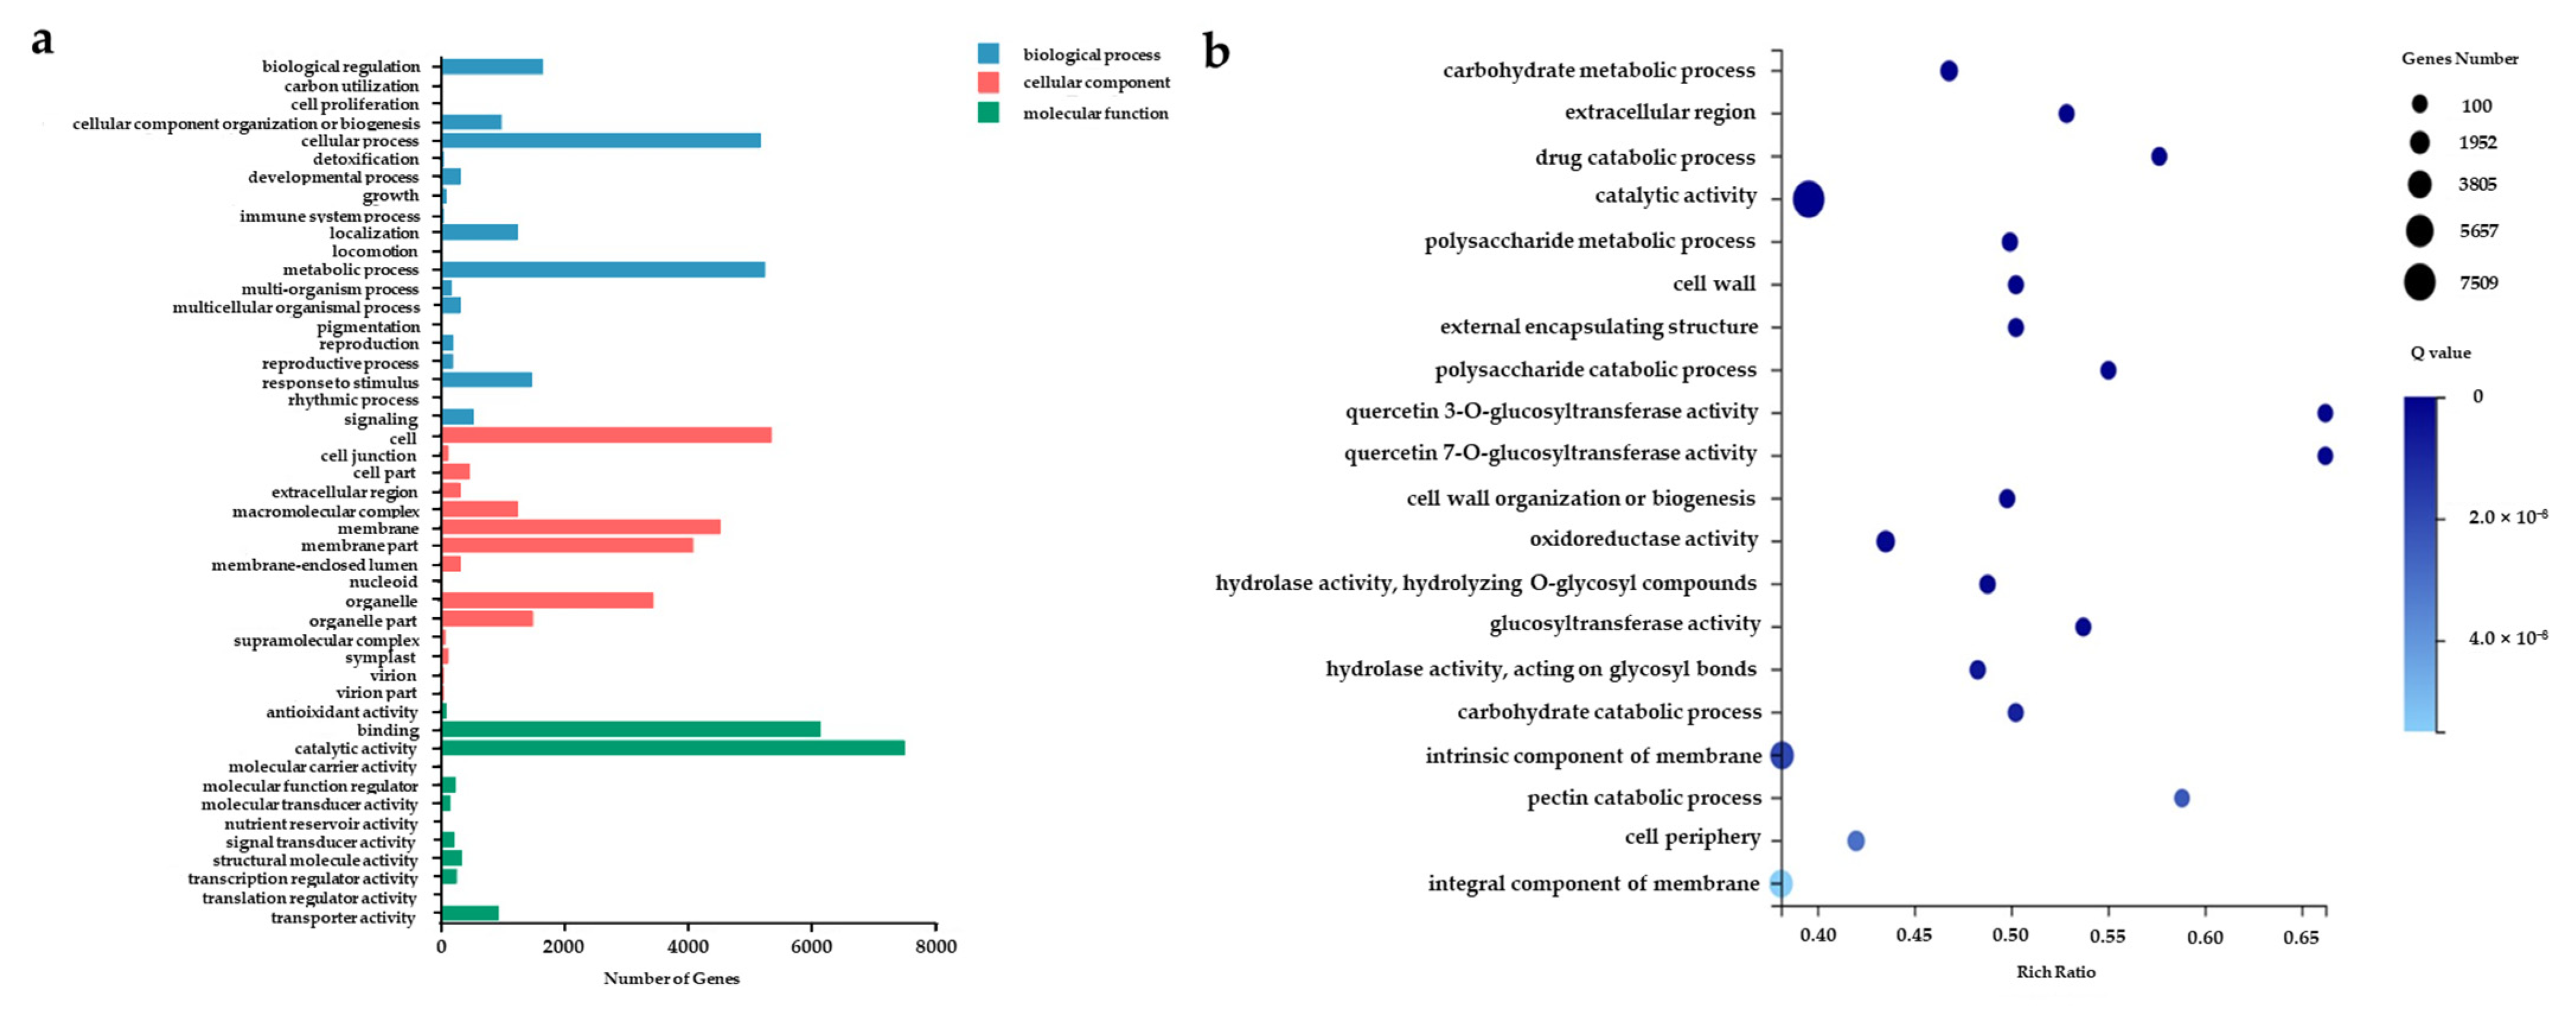
GO functional annotation was carried out on the 2460 DEGs. The GO annotations of the DEGs were classified into 48 functional groups within the categories of biological processes, cellular components and molecular functions (Figure 6a). Within the 21 functional groups in the biological processes category, most DEGs were cataloged under metabolic processes and cellular process, followed by biological regulation, response to stimulus, localization and cellular component organization or biogenesis. Among the 15 functional groups in the cellular components category, cell, membrane, membrane part and organelle accounted for a large proportion, followed by organelle part and macromolecular complex. Within the 21 functional groups in the molecular functions category, catalytic activity and binding were relatively dominant, followed by transporter activity. The GO enrichment analysis showed that there were 10 significantly enriched GO functional groups in the cellular components category, namely, apoplast, cell periphery, cell wall, external encapsulating structure, extracellular region, integral component of membrane, intrinsic component of membrane, membrane, membrane part and vacuole (Figure 6b). In terms of the biological processes category, 26 significantly enriched GO functional groups were identified, which were mainly related to the carbohydrate metabolic process, catabolic process and organic substance catabolic process. In terms of molecular function, the 21 significantly enriched GO functional groups were mainly associated with catalytic activity. In the natural state, DEGs related to carbohydrate metabolism and catalysis were significantly enriched from the initial opening stage. After spraying BR, these DEGs were significantly enriched from the full-bloom stage.
The KEGG pathway enrichment analysis was performed with the 2460 DEGs to understand the characteristics of the complex biological behavior observed in the flowering process. The DEGs annotated using the pathways were divided into 22 KEGG functional groups comprising six aspects: cellular processes, environmental information processing, genetic information processing, human diseases, metabolism and organism systems (Figure 7a). Most of the functional groups were clustered into metabolism. The global and overview maps contained the largest number of DEGs in all comparison groups, followed by carbohydrate metabolism, translation, folding, sorting and degradation, amino acid metabolism and lipid metabolism.
According to the KEGG pathway annotation classification, the “phyper” function in R software was used for the enrichment analysis. The p-value was calculated, and then the p-value was corrected using FDR. Usually, the function of FDR ≤ 0.01 is regarded as significant enrichment. Accordingly, 20 pathways were enriched. Among them, starch and sucrose metabolism, pentose and glucuronate interconversions, cysteine and methionine metabolism and phenylpropanoid biosynthesis pathways had more isoforms (Figure 7b).
Transcriptome sequencing is one of the most important means to study gene transcription and the regulation of transcription in cells [30]. Therefore, transcriptome analyses are fundamental to the study of gene function and to elucidate the molecular mechanisms underlying specific biological processes. In this study, the transcriptome sequencing of tree peony petals was performed using the BGISEQ-500 platform. A total of 60,442 genes were identified over 24 samples, with more than 40,000 genes identified in each sample, indicating that the expressions of most genes in the tree peony petals were stable, while the time-specific expressions of genes were few. At present, although extensive studies have been conducted on the flower development process of tree peony, the molecular regulatory mechanisms are still unclear [6]. In this study, a total of 2460 DEGs were found in the CK vs. BR comparison groups that were not found in any CK comparison group or in any BR comparison group, indicating that these DEGs jointly responded to BR through a complex network regulation system to delay the flowering of P. ostii var. lishizhenii. In addition, the GO analysis showed a significant enrichment in the carbohydrate metabolism process, across membrane transport protein activity and REDOX enzyme activity, while the KEGG analysis significantly enriched the phosphatidyl inositol signal system, plant hormone signal transduction, peroxidase body, starch and sugar and metabolism. These results suggest that, through a variety of hormones (such as ABA and ethylene) and secondary messengers (such as ROS and Ca2+), the carbohydrate metabolism process is accelerated, and the antioxidant defense system is activated. These findings are consistent with those of previous studies in Arabidopsis [31]. In this study, there were 7651 and 6960 DEGs in the CK and BR comparison groups, respectively, which indicated that the expression of some genes involved in the flowering process changed after the spraying of BR, thus delaying the flowering time of P. ostii var. lishizhenii. In addition, the DEGs that were significantly enriched in catalytic activity, binding, antitransporter activity metabolic process and carbohydrate metabolism process under BR treatment indicate that carbohydrate is an important substance in the process of petal senescence.

3.3. The Molecular Pathway of BR Regulating Tree Peony Flower Opening

In order to determine the expression patterns of the genes that responded to BR treatment during the four continuous developmental stages, the expressions of some genes related to flowering were analyzed using qRT-PCR. As expected, the qRT-PCR results of 11 isoforms were basically similar to those obtained using transcriptome sequencing in terms of expression patterns, thus confirming the changes in gene expression in response to BR treatment. After BR treatment, the expressions of Isoform_31506, Isoform_51326, Isoform_41518 and Isoform_37647 decreased, while the expressions of Isoform_15295, Isoform_26209, Isoform_18146, Isoform_22154, Isoform_11650, Isoform_34000 and Isoform_11866 increased (Figure 8).
The annotation results of the isoforms show that Isoform_22154 was annotated as the homologous gene of BAK1. Isoform_26209 and Isoform_34000 were annotated as the homologous genes of BSK3. Isoform_11866 and Isoform_18146 were annotated as the homologous genes of DELLA. Isoform_31506, Isoform_37647 and Isoform_41518 were annotated as the homologous genes of CO. Isoform_51326 was annotated as the homologous gene of SPL1. Isoform_11650 was annotated as the homologous gene of WRKY. Isoform_15295 was annotated as the homologous gene of AP.
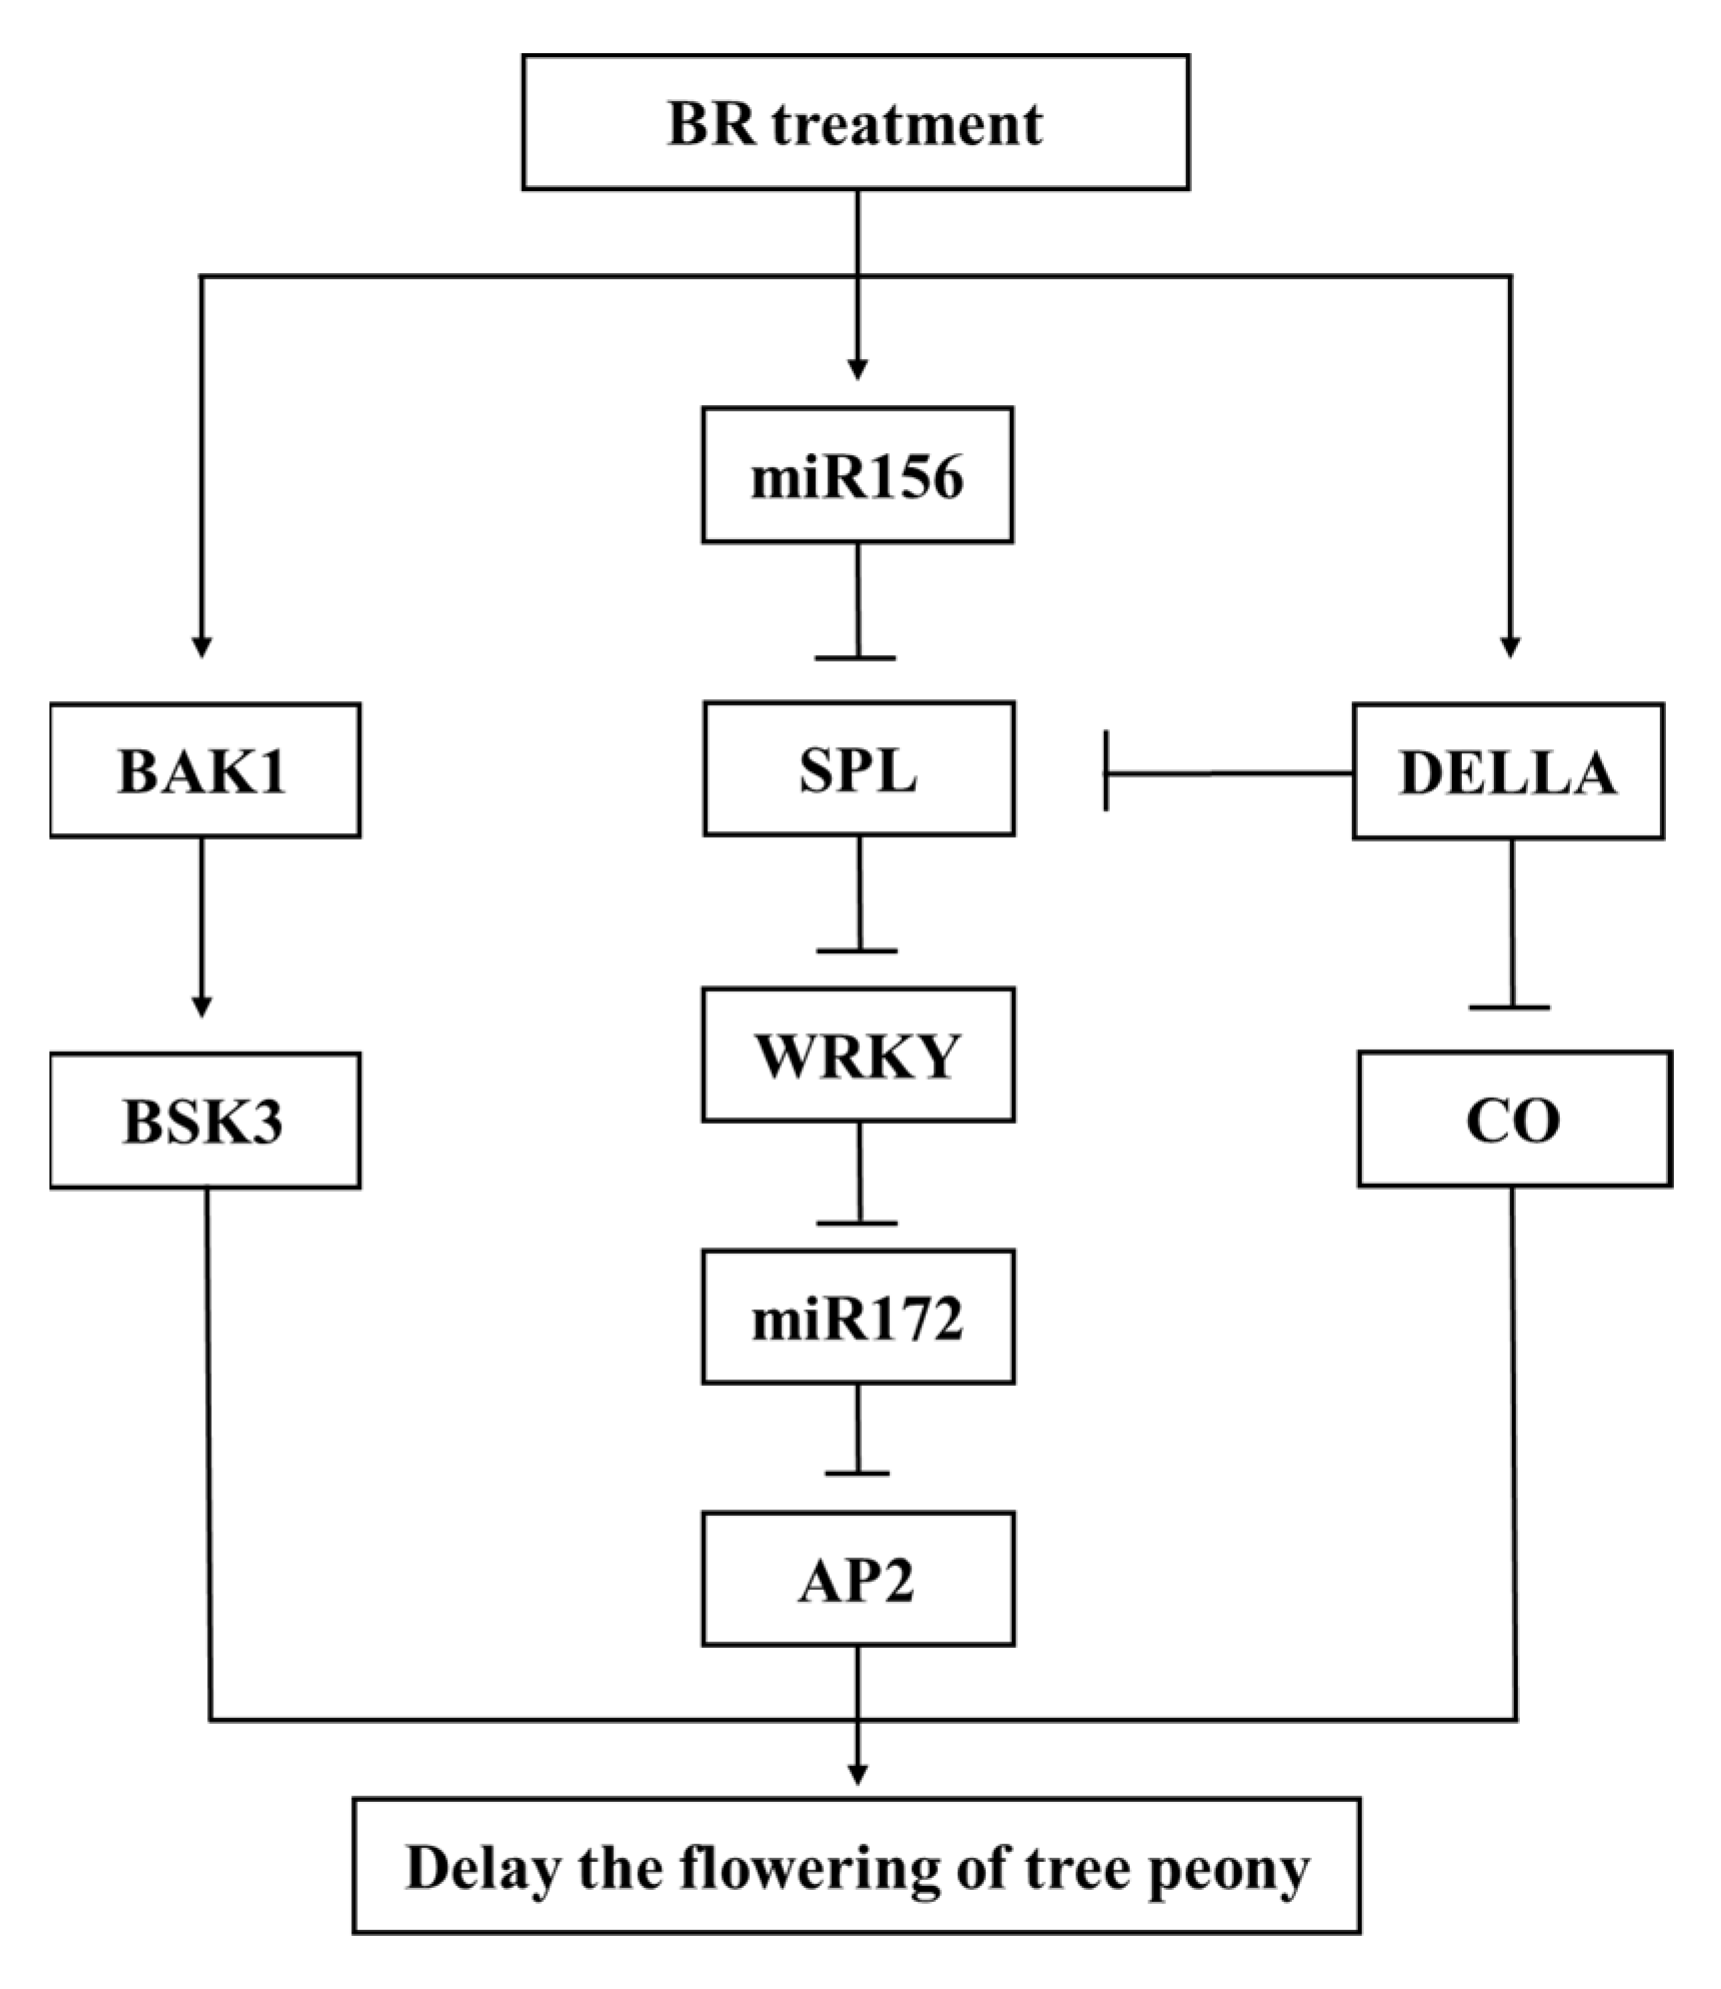
After spraying BR, the expression of BAK1 was up-regulated, and then BSK3 was up-regulated (Figure 9). In addition, combined with previous studies, it was found that BR spraying promoted the expression of miR156, thereby inhibiting the expression of SPL, down-regulating the expression of WRKY and inhibiting the expression of miR172 and its downstream AP2. In addition, spraying BR promoted the expression of DELLA and then inhibited the expressions of SPL and CO.
In this study, a total of seven genes for 11 isoforms were selected in three pathways in response to BR delaying the flowering of P. ostii var. lishizhenii. The first pathway is the activation of BR signaling via BR treatment, thereby promoting the expression of BKA1 and BSK3. BR is a steroid hormone that acts on the growth and development of plants [32]. The role of BSK3 as a receptor is similar to cytoplasmic kinase in BR signal transduction and plant growth and development [33]. Some studies have found that BSK3 is anchored to the plasma membrane through myristylation, which is necessary for BSK3 to play a role in BR signal transduction [34]. Interestingly, the effect of BSK3 on the BR response is dependent on the effect of the BSK3 protein level [35]. In addition, it was also found that BSK3 could up-regulate the transcription and protein level of the BSU1 gene, thereby activating the signal transduction of BR [36]. The second and third pathways belong to the GA pathway. The second one regulates peony flowering by regulating WRKY. WRKY is another key transcription factor of the GA pathway [31]. In this study, combined with the previous results [21], we found that BR treatment can increase the expression of miR156, thereby inhibiting the expression of SPL; SPL inhibits the accumulation of WRKY, and WRKY inhibits the expression of miR172b by directly binding to its promoter. Previous studies have shown that, in young Arabidopsis thaliana, an excessive accumulation of miR156 inhibits the expression of SPL10, resulting in a large accumulation of WRKY13, while WRKY12 maintains a low level [31]. WRKY13 directly binds to the promoter of miR172b in order to inhibit its expression so that the plant can maintain normal vegetative growth. This study is consistent with the finding that WRKY transcriptional regulators control flowering time in Arabidopsis [31]. It has been shown that the DELLA protein, an inhibitor of the GA pathway, can interact with CO to form a protein complex and inhibit its transcriptional activation function [37]. Further genetic studies have shown that the inhibition of the DELLA protein on flowering induction was partially dependent on the CO/FT-mediated photoperiodic signaling pathway [38]. This confirms that DELLA proteins can directly inhibit CO, a key transcription factor in the photoperiod pathway [39]. The third pathway in this study mainly inhibits the expression of CO by promoting DELLA in the GA signaling pathway. This is consistent with previous studies [39]. In conclusion, this study found that spraying BR could delay the flowering of P. ostii var. lishizhenii by regulating the expression of seven genes via three pathways.

4. Conclusions

In this study, 21.27 G clean data were obtained using the full-length transcriptome sequencing of petals at four flower development stages in P. ostii var. lishizhenii, and 62,229 isoforms were obtained after cluster correction and redundancy removal. An analysis of DEGs using transcriptome sequencing with full-length transcripts as the reference genome showed that 2460 DEGs might be related to delayed flowering in response to BR-induced delayed flowering. We analyzed a relatively complete molecular pathway of P. ostii var. lishizhenii in response to BR prolonging the flowering period, including seven genes annotated from 11 isoforms of three pathways. Firstly, BR treatment promoted the expression of BSK3 by promoting BAK1. Secondly, BR treatment inhibited the expression of SPL to inhibit the expression of downstream WRKY, finally inhibiting the expression of AP2. Thirdly, BR treatment promoted the expression of DELLA to inhibit the expression of CO. Meanwhile, DELLA inhibited the expression of SPL. This study provides a theoretical basis for further studies on the molecular mechanism of peony flowering regulation.

Supplementary Materials

The following supporting information can be downloaded at: https://www.mdpi.com/article/10.3390/horticulturae8121136/s1, Table S1: The primers of qRT-PCR for 11 Isoforms; Table S2: Sequences of 11 Isoforms for qRT-PCR; Table S3: Annotation results of isoforms related to the genus Paeonia; Table S4: Differentially expressed genes in every comparison group.

Author Contributions

L.Z.: Investigation, Formal Analysis, Data Curation, Writing—Original Draft. C.S.: Investigation, Formal Analysis, Data Curation, Writing—Original Draft. L.G.: Investigation. D.G.: Investigation. X.X.: Investigation. H.W.: Conceptualization, Writing—Review and Editing. X.H.: Conceptualization, Writing—Review and Editing. All authors have read and agreed to the published version of the manuscript.

Funding

This research was funded by the National Natural Science Foundation of China (U1804233), Central Plains Scholars Fund of Henan Province (202101510003) and Technical System of Traditional Chinese Medicine Industry in Henan Province (Henan Finance Department (2022) No. 24).

Data Availability Statement

The datasets generated in this study are available on request to the corresponding author.

Acknowledgments

We thank Golam Jalal Ahammed for linguistic assistance during the preparation of this manuscript.

Conflicts of Interest

The authors declare no conflict of interest.

References

  1. Guo, D.; Hou, X.; Jia, T. Reverse transcriptase domain sequences from tree peony (Paeonia suffruticosa) long terminal repeat retrotransposons: Sequence characterization and phylogenetic analysis. Biotechnol. Biotechnol. Equip. 2014, 28, 438–446. [Google Scholar] [CrossRef] [PubMed] [Green Version]
  2. Han, J.; Liu, Z.; Li, X.; Li, J.; Hu, Y. Diversity in seed oil content and fatty acid composition in three tree peony species with potential as sources of omega-3 fatty acids. J. Pomol. Hortic. Sci. 2016, 91, 175–179. [Google Scholar] [CrossRef]
  3. Li, J.; Han, J.; Hu, Y.; Yang, J. Selection of reference genes for quantitative real-time PCR during flower development in tree peony (Paeonia suffruticosa Andr.). Front. Plant Sci. 2016, 7, 516–524. [Google Scholar] [CrossRef] [PubMed] [Green Version]
  4. Guo, L.; Guo, D.; Zhao, W.; Hou, X. Newly developed SSR markers reveal genetic diversity and geographical clustering in Paeonia suffruticosa based on flower colour. J. Hortic. Sci. Biotechnol. 2017, 292, 847–855. [Google Scholar] [CrossRef]
  5. Yu, H.; Cheng, F.; Zhong, Y.; Cai, C.; Wu, J.; Cui, H. Development of simple sequence repeat (SSR) markers from Paeonia ostii to study the genetic relationships among tree peonies (Paeoniaceae). Sci. Hortic. 2013, 164, 58–64. [Google Scholar] [CrossRef]
  6. Wang, S.; Xue, J.; Ahmadi, N.; Holloway, P.; Zhu, F.; Ren, X.; Zhang, X. Molecular characterization and expression patterns of PsSVP genes reveal distinct roles in flower bud abortion and flowering in tree peony (Paeonia suffruticosa). Can. J. Plant Sci. 2017, 94, 1181–1193. [Google Scholar] [CrossRef] [Green Version]
  7. Zhu, F.; Wang, S.; Xue, J.; Li, D.; Ren, X. Morphological and physiological changes, and the functional analysis of PdSPL9 in the juvenile-to-adult phase transition of Paeonia delavayi. Plant Cell Tissue Organ Cult. 2018, 133, 325–337. [Google Scholar] [CrossRef]
  8. Zhou, H.; Cheng, F.; Wang, R.; Zhong, Y.; He, C. Transcriptome comparison reveals key candidate genes responsible for the unusual reblooming trait in tree peonies. PLoS ONE 2013, 8, e79996. [Google Scholar] [CrossRef] [Green Version]
  9. Gai, S.; Zhang, Y.; Mu, P.; Liu, C.; Dong, L.; Zheng, G. Transcriptome analysis of tree peony during chilling requirement fulfillment: Assembling, annotation and markers discovering. Gene 2012, 497, 250–262. [Google Scholar] [CrossRef]
  10. Hou, X.; Guo, Q.; Wei, W.; Guo, L.; Guo, D.; Zhang, L. Screening of genes related to early and late flowering in tree peony based on bulked segregant RNA sequencing and verification by quantitative real-time PCR. Molecules 2018, 23, 689–707. [Google Scholar] [CrossRef]
  11. Zhang, L.; Guo, D.; Guo, L.; Guo, Q.; Wang, H.; Hou, X. Construction of a high-density genetic map and QTLs mapping with GBS from the interspecific F1 population of P. ostii ‘Fengdan Bai’ and P. suffruticosa ‘Xin Riyuejin’. Sci. Hortic. 2019, 246, 190–200. [Google Scholar] [CrossRef]
  12. Chao, Y.; Yuan, J.; Guo, T.; Xu, L.; Mu, Z.; Han, L. Analysis of transcripts and splice isoforms in Medicago sativa L. by single-molecule long-read sequencing. Plant Mol. Biol. 2019, 99, 219–235. [Google Scholar] [CrossRef] [PubMed]
  13. Makita, Y.; Kawashima, M.; Lau, N.S.; Othman, A.S.; Matsui, M. Construction of Pará rubber tree genome and multi-transcriptome database accelerates rubber researches. BMC Genom. 2018, 19, 922–928. [Google Scholar] [CrossRef] [PubMed] [Green Version]
  14. Ferrarini, M.; Moretto, M.; Ward, J.A.; Šurbanovski, N.; Stevanovićet, V.; Giongo, L.; Viola, R.; Cavalieri, D.; Velasco, R.; Cestaro, A. An evaluation of the PacBio RS platform for sequencing and de novo assembly of a chloroplast genome. BMC Genom. 2013, 14, 670–681. [Google Scholar] [CrossRef] [PubMed] [Green Version]
  15. Jiang, C.; Tang, X.; Ren, C.; Wei, B.; Wu, Y.; Wu, Q.; Jin, P. Full-length transcriptome sequences and the identification of putative genes for flavonoid biosynthesis in safflower. BMC Genom. 2018, 19, 548–560. [Google Scholar]
  16. An, D.; Cao, H.; Li, C.; Humbeck, K.; Wang, W. Isoform sequencing and state-of-art applications for unravelling complexity of plant transcriptomes. Genes 2018, 9, 43–57. [Google Scholar] [CrossRef] [Green Version]
  17. Zhou, C.; Zhu, C.; Tian, C.; Xu, K.; Huang, L.; Shi, B.; Lai, Z.; Lin, Y.; Guo, Y. Integrated volatile metabolome, multi-flux full-length sequencing, and transcriptome analyses provide insights into the aroma formation of postharvest jasmine (Jasminum sambac) during flowering. Postharvest Biol. Technol. 2022, 183, 111726–111740. [Google Scholar] [CrossRef]
  18. Qian, X.; Sun, Y.; Zhou, G.; Yuan, Y.; Li, J.; Huang, H.; Xu, L.; Li, L. Single-molecule real-time transcript sequencing identified flowering regulatory genes in Crocus sativus. BMC Genom. 2019, 20, 857–874. [Google Scholar] [CrossRef]
  19. Jia, X.; Tang, L.; Mei, X.; Liu, H.; Luo, H.; Deng, Y.; Su, J. Single-molecule long-read sequencing of the full-length transcriptome of Rhododendron lapponicum L. Sci. Rep. 2020, 10, 6755–6765. [Google Scholar] [CrossRef] [Green Version]
  20. Liu, Q.; Liaquat, F.; He, Y.; Munis, M.F.H.; Zhang, C. Functional annotation of a full-length transcriptome and identification of genes associated with flower development in Rhododendronsimsii (Ericaceae). Plants 2021, 10, 649–661. [Google Scholar] [CrossRef]
  21. Zhang, L.; Song, C.; Guo, D.; Guo, L.; Hou, X.; Wang, H. Identification of differentially expressed miRNAs and their target genes in response to brassinolide treatment on flowering of tree peony (Paeonia ostii). Plant Signal. Behav. 2022, 17, 2056364. [Google Scholar] [CrossRef]
  22. Wang, L.; Feng, Z.; Wang, X.; Wang, X. DEGseq: An R package for identifying differentially expressed genes from RNA-seq data. Bioinformatics 2010, 26, 136–138. [Google Scholar] [CrossRef] [PubMed] [Green Version]
  23. Rhoads, A.; Au, K.F. PacBio sequencing and its applications. Genom. Proteom. Bioinform. 2015, 13, 278–289. [Google Scholar] [CrossRef] [PubMed] [Green Version]
  24. Zhang, H.; Wang, H.; Zhu, Q.; Gao, Y.; Wang, H.; Zhao, L.; Wang, Y.; Xi, F.; Wang, W.; Yang, Y.; et al. Transcriptome characterization of moso bamboo (Phyllostachys edulis) seedlings in response to exogenous gibberellin applications. BMC Plant Biol. 2018, 18, 125–139. [Google Scholar] [CrossRef] [PubMed]
  25. Wang, M.; Wang, P.; Liang, F.; Ye, Z.; Li, J.; Shen, C.; Pei, L.; Wang, F.; Hu, J.; Tu, L.; et al. A global survey of alternative splicing in allopolyploid cotton: Landscape, complexity and regulation. New Phytol. 2017, 217, 163–178. [Google Scholar] [CrossRef] [Green Version]
  26. Zuo, C.; Blow, M.; Sreedasyam, A.; Kuo, R.C.; Ramamoorthy, G.K.; Torres-Jerez, I.; Li, G.; Wang, M.; Dilworth, D.; Barry, K.; et al. Revealing the transcriptomic complexity of switchgrass by PacBio long-read sequencing. Biotechnol. Biofuels 2018, 11, 170–184. [Google Scholar] [CrossRef] [Green Version]
  27. Luo, D.; Zhou, Q.; Wu, Y.; Chai, X.; Liu, W.; Wang, Y.; Yang, Q.; Wang, Z.; Liu, Z. Full-length transcript sequencing and comparative transcriptomic analysis to evaluate the contribution of osmotic and ionic stress components towards salinity tolerance in the roots of cultivated alfalfa (Medicago sativa L.). BMC Plant Biol. 2019, 19, 32–51. [Google Scholar] [CrossRef] [Green Version]
  28. Li, J.; Harata-Lee, Y.; Denton, M.D.; Feng, Q.; Rathjen, J.R. Long read reference genome-free reconstruction of a full-length transcriptome from Astragalus membranaceus reveals transcript variants involved in bioactive compound biosynthesis. Cell Discov. 2017, 3, 17031–17043. [Google Scholar] [CrossRef] [Green Version]
  29. Sun, J.; Chen, T.; Tao, J. Single molecule, full-length transcript sequencing provides insight into the TPS gene family in Paeonia ostii. PeerJ 2021, 9, e11808. [Google Scholar] [CrossRef]
  30. Hyun, T.K.; Rim, Y.; Jiang, H.J.; Kim, C.H.; Park, J.; Kumar, R.; Lee, S.; Kim, B.C.; Bhak, J.; Nguyen-Quoc, B. De novo transcriptome sequencing of Momordica cochinchinensis to identify genes involved in the carotenoid biosynthesis. Plant Mol. Biol. 2012, 79, 413–427. [Google Scholar] [CrossRef]
  31. Ma, Z.; Li, W.; Wang, H.; Yu, D. WRKY transcription factors WRKY12 and WRKY13 interact with SPL10 to modulate age-mediated flowering. J. Integr. Plant Biol. 2020, 62, 1659–1673. [Google Scholar] [CrossRef] [PubMed]
  32. Fujioka, S.; Sakurai, A. Biosynthesis and metabolism of brassinosteroids. Physiol. Plant. 1997, 100, 710–715. [Google Scholar] [CrossRef]
  33. Jia, Z.; Giehl, R.F.H.; Meyer, R.C.; Altmann, T.; Wiren, N. Natural variation of BSK3 tunes brassinosteroid signaling to regulate root foraging under low nitrogen. Nat. Commun. 2019, 10, 2378–2390. [Google Scholar] [CrossRef] [PubMed] [Green Version]
  34. Su, B.; Zhang, X.; Li, L.; Abbas, S.; Lin, J. Dynamic spatial reorganization of BSK1 complexes in the plasma membrane underpins signal-specific activation for growth and immunity. Mol. Plant 2021, 14, 588–603. [Google Scholar] [CrossRef] [PubMed]
  35. Ren, H.; Willige, B.C.; Jaillais, Y.; Geng, S.; Park, M.Y.; Gray, W.M.; Chory, J.; Copenhaver, G.P. BRASSINOSTEROID-SIGNALING KINASE 3, a plasma membrane-associated scaffold protein involved in early brassinosteroid signaling. PLoS Genet. 2019, 15, e1007904. [Google Scholar] [CrossRef] [Green Version]
  36. Nolan, T.M.; Nemanja, V.; Liu, D.; Eugenia, R.; Yin, Y. Brassinosteroids: Multidimensional regulators of plant growth, development, and stress responses. Plant Cell 2020, 32, 295–318. [Google Scholar] [CrossRef] [Green Version]
  37. Wang, H.; Pan, J.; Li, Y.; Lou, D.; Hu, Y.; Yu, D. The DELLA-CONSTANS transcription factor cascade integrates gibberellic acid and photoperiod signaling to regulate flowering. Plant Physiol. 2016, 172, 479–488. [Google Scholar] [CrossRef] [Green Version]
  38. Galvão, V.C.; Horrer, D.; Küttner, F.; Schmid, M. Spatial control of flowering by DELLA proteins in Arabidopsis thaliana. Development 2012, 139, 4072–4082. [Google Scholar] [CrossRef] [Green Version]
  39. Xu, F.; Li, T.; Xu, P.; Li, L.; Du, S.; Lian, H.; Yang, H. DELLA proteins physically interact with CONSTANS to regulate flowering under long days in Arabidopsis. FEBS Lett. 2016, 590, 541–549. [Google Scholar] [CrossRef]
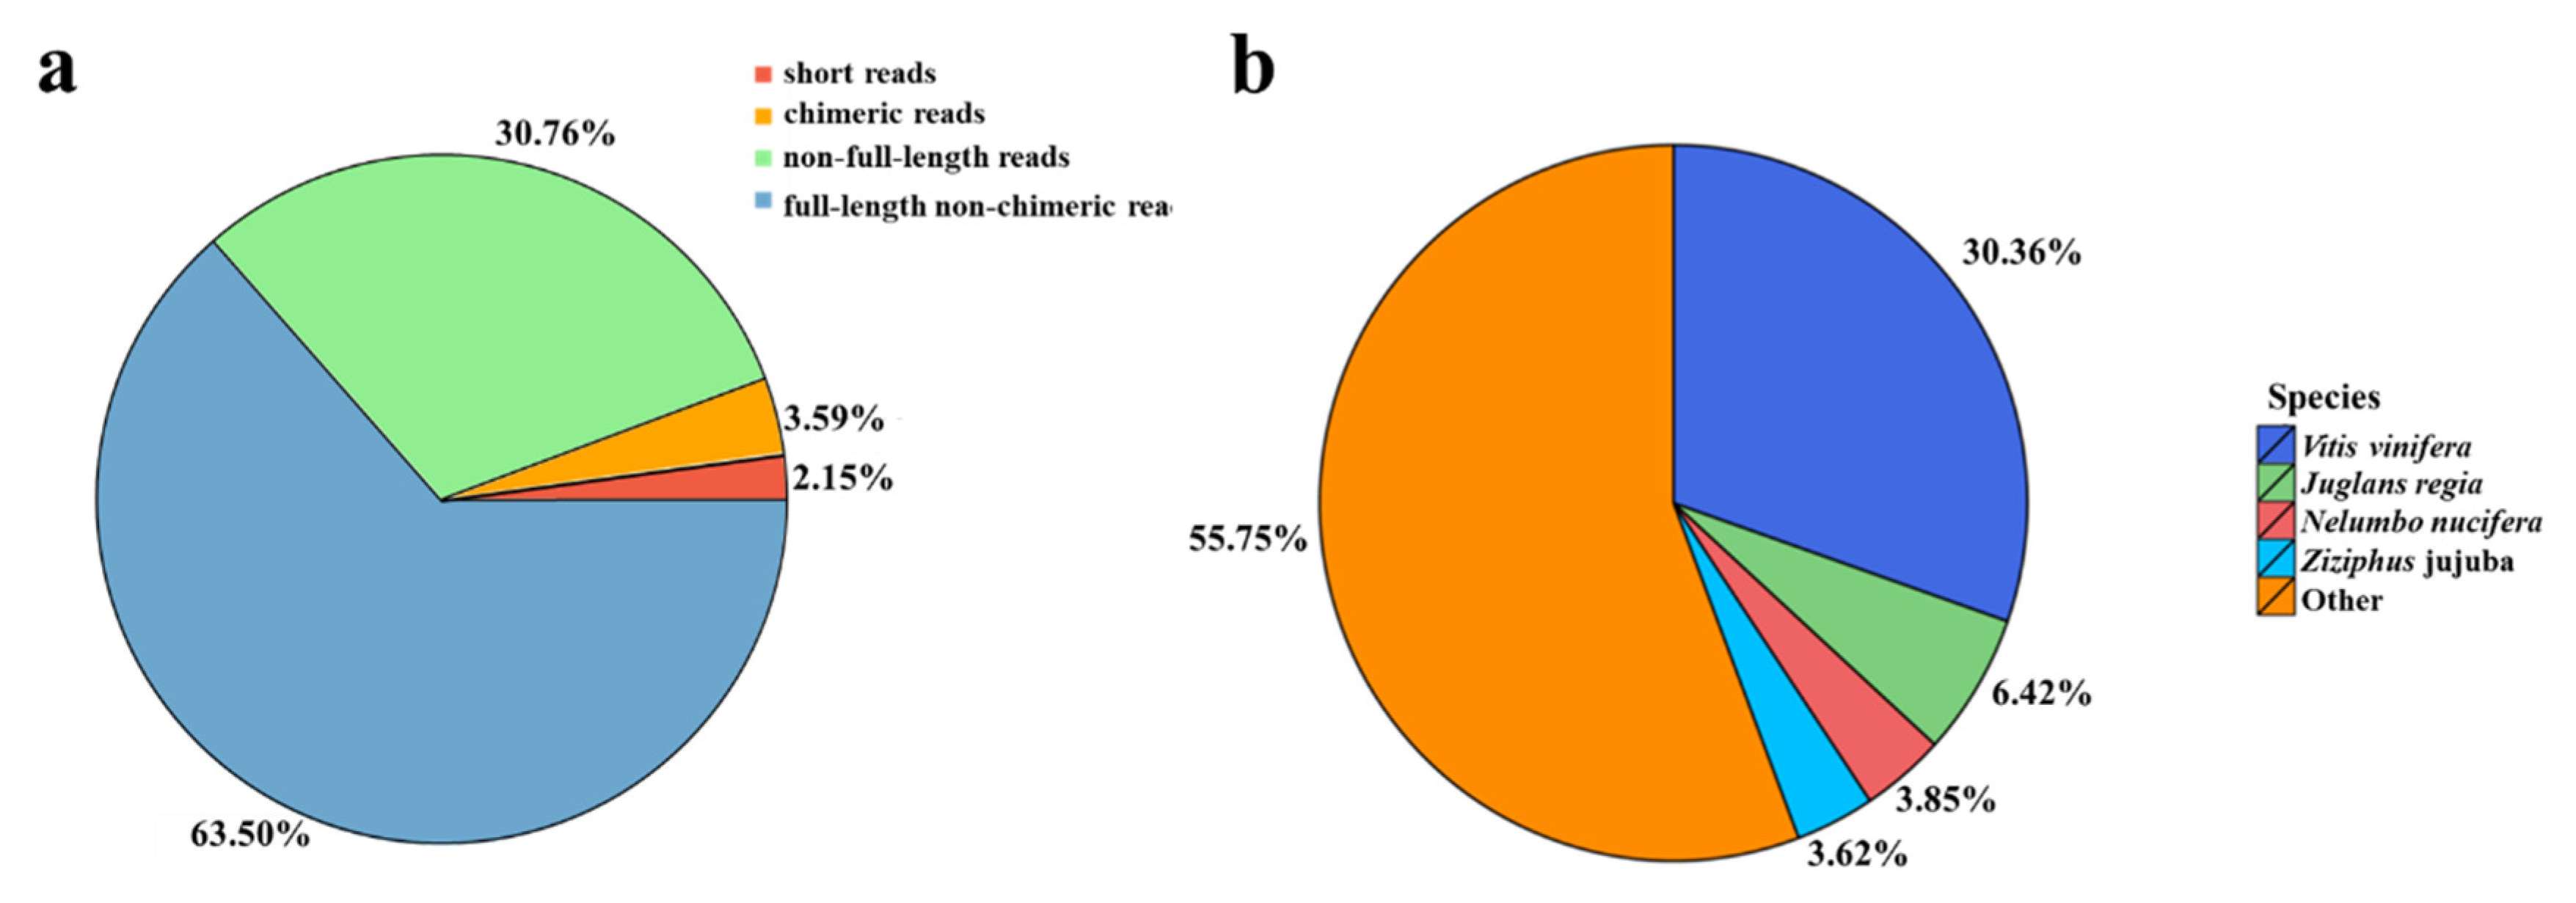
Figure 1. The Read of Insert (ROI) classification and homologous species distribution of full-length transcripts using PacBio Iso-seq. (a) ROI classification. (b) Homologous species distribution in the NR database.
Horticulturae 08 01136 g001
Figure 2. Functional annotation of all isoforms. (a) Functional distribution of GO annotation. (b) Functional distribution of KEGG annotation. Note: X axis represents the number of transcripts. Y axis represents the Gene Ontology or the KEGG function category.
Horticulturae 08 01136 g002
Figure 3. CDS length distribution. Note: X axis represents the length of CDSs. Y axis represents the number of CDSs.
Horticulturae 08 01136 g003
Figure 4. Number of differentially expressed genes. The red columns represent the up-regulated genes. The blue columns represent the down-regulated genes.
Horticulturae 08 01136 g004
Figure 5. Venn diagrams of differentially expressed genes: (a) Venn diagram of differentially expressed genes at different flowering periods in CK group and BR group; (b) Venn diagram of differentially expressed genes in CK group vs. BR group; (c) Venn diagram of differentially expressed genes, combining analyses from (a,b).
Horticulturae 08 01136 g005
Figure 6. GO analysis of DEGs. (a) GO classification of DEGs. (b) GO enrichment of DEGs.
Horticulturae 08 01136 g006
Figure 7. KEGG analysis of DEGs. (a) KEGG pathway classification of DEGs. (b) KEGG pathway enrichment of DEGs.
Horticulturae 08 01136 g007
Figure 8. Validation of 11 isoforms using qRT-PCR. (a) Heatmap and relative expression levels of isoforms from transcriptome sequencing data; (b) qRT-PCR expression profile of isoforms.
Horticulturae 08 01136 g008
Figure 9. Putative gene molecular pathway of flowering in tree peony. The lines indicate correlation. The arrows indicate facilitation. Bars indicate inhibition.
Horticulturae 08 01136 g009
Table 1. Statistics of full-length transcriptome sequencing data.
DataTotal ReadsTotal Base (GB)Max Length (bp)Mean Length (bp)N50 Length (bp)
Polymerase reads711,49822.25233,10131,275.8859,732
Subreads13,978,73221.27149,1971521.251764
Table 2. Summary of Read of Insert (ROI) clustering information.
Cluster TypeTotal IsoformsTotal Base (bp)Mean QualityMean Isoform Length (bp)Mean full-Length CoverageMean Non-Full-Length Coverage
HQ135,541218,900,4530.998816152.1816.18
LQ132,075212,109,9680.304916061.115.34
Table 3. Summary of functional annotation results for all isoforms in the seven databases.
TotalNRNTSwissProtKEGGKOGInterProGOIntersectionOverall
62,22957,19351,08046,62247,42948,39851,96735,64325,09058,218
100%91.91%82.08%74.92%76.22%77.77%83.51%57.28%40.32%93.55%
Publisher’s Note: MDPI stays neutral with regard to jurisdictional claims in published maps and institutional affiliations.