Abstract
Flower thinning for fruit trees in time is an important operation to keep a suitable quantity of fruits and guarantee the quality of fruits. Accurate detection of flower density is the premise of precise flower thinning, and machine vision provides an effective approach to achieving the accurate identification of flower density. To detect the flower density on the proximal side of Y-shaped densely planted peach trees accurately, this study proposed a method based on an RGBD camera and a convolutional neural network that incorporated an attention mechanism and multi-scale feature fusion. Firstly, image acquisition and preprocessing were performed with the RGBD camera, and the complex background and distal flowers were filtered out through depth information. Then, a convolutional neural network for flower density detection based on an attention mechanism and multi-scale feature fusion, named the flower counting network (FC-Net), was constructed and tested. Results showed that the coefficient of determination (R2) between the estimated number of flowers by the FC-Net and the real values reached 0.95, the mean absolute error (MAE) was 4.3, the root mean square error (RMSE) was 5.65, the counting error rate (Er) was 0.02%, and the processing time of one image was 0.12 s. The proposed FC-Net can provide visual support for intelligent mechanical flower thinning operations.
1. Introduction
China has a big fruit industry, among which its peach production accounts for 57.82% of the world’s total peach production. In recent years, the traditional way of planting fruit trees has been gradually replaced by a new and efficient model called dwarf and close planting [1]. The dwarf and close planting mode are beneficial for trees to form flowers and fruits. However, due to the lack of scientific and reasonable planning and management, too many young fruits will consume too many nutrients, resulting in the phenomenon of small and large fruiting years [2,3]. Therefore, the yield and quality of fruits are closely related to the number of flowers remaining on the trees under the dwarf and close planting mode [4]; farmers need to perform flower thinning operations in time to keep a suitable quantity of flowers. Flower thinning is one of the labor-intensive operations in orchard management. Mechanical flower thinning is a fast and efficient approach and has been becoming popular in recent years, but existing mechanical flower thinning machines cannot change the thinning speed in real-time according to the flower density, which may cause uneven thinning results and further has a negative effect on the quality and quantity of fruits.
In recent years, with the rapid development of computer vision and image processing technology, extensive research has been conducted on flower detection, mainly using conventional image processing, machine learning and deep learning techniques. Flower detection with conventional image processing techniques is mainly based on the color information of flowers, which is easy to implement; however, it is susceptible to factors, such as lighting conditions, occlusion, and background interference. Target detection based on deep learning methods relies on the powerful feature extraction ability and stability of the convolutional neural network and has achieved good detection results, providing an efficient and promising approach for flower detection. Davis et al. [5] used a Mask R-CNN model with ResNet-50 as the backbone network for flower detection, resulting in a flower detection accuracy greater than 87% with an average absolute error of 0.51. Wu et al. [6] proposed a real-time apple flower detection method based on the YOLOv4 network. Results showed that the detection precision of this model reached 89.43%, the mean average precision reached 97.31%, and the detection speed reached 72.33 frames per second (FPS). Xiong et al. [7] proposed a pixel-level lychee flower recognition and segmentation model based on a deep semantic segmentation network. They added a dense feature transfer and a convolutional block attention module (CBAM) to the ResNet_34 backbone network, so as to improve the effectiveness of lychee flower and leaf features. Test results showed that the MIoU and pixel recognition accuracy of the litchi flower segmentation model were 0.734 and 87%, respectively. These deep learning-based object detection methods can realize the recognition and segmentation of flowers more intuitively, but there may be overlapping of candidate anchor boxes when flower density is large, increasing the processing time and affecting the real-time application of the developed models [8].
In recent years, deep learning methods based on density maps [9] have been applied to the problem of dense, multi-overlapping object counting. The density map-based counting method is a new supervised learning framework, which incorporates the spatial information of images in the counting process by learning the mapping relation between local features of images and their corresponding density maps. Density map-based counting methods have been validated to provide good prediction accuracy and robustness in crowd-counting tasks in complex environments [10,11,12,13], and have been applied to agricultural fields to estimate the number of wheat ears [14], fish [15] and flowers, etc. Tian et al. [16] proposed an improved apple flower instance segmentation model Mask R-CNN based on the U-Net network. The instance segmentation model showed strong ability in the apple flower segmentation task with budding, semi-open and fully open apple flowers in complex orchard environments, with a prediction accuracy of 96.43% and an MIoU of 91.55%. The density map-based method trains the regression density map to estimate the target density in the image and then integrates it to obtain the number of targets, which provides more possibilities for dense flower density detection in complex environments. However, there has been no research to detect the flower density on unilateral branches of Y-shaped densely planted peach trees that are widely planted in China.
Therefore, the overall goal of this research was to use the RGB and depth information captured by an RGBD camera combined with an improved deep neural network to detect peach flower density on the proximal side of Y-shaped densely planted peach trees in real-time. Specific objectives were to (1) use an RGBD camera to obtain peach flower information of the Y-shaped peach trees and filter out complex background and distant peach flowers based on depth information, (2) propose a flower density detection network based on the attention mechanism and multi-scale feature fusion technique, and (3) test the performance of the proposed network.
2. Materials and Methods
2.1. Overall Workflow of the Proposed Method
As shown in Figure 1, in order to detect peach flower density on the proximal side of Y-shaped peach trees, an RGBD camera was deployed to acquire RGB and depth information. The complex background and peach flowers on the distal side of the Y-shaped tree in the images were segmented and removed based on the depth information. The number of peach flowers on the proximal side of peach trees is then estimated by the trained peach flower density detection model.
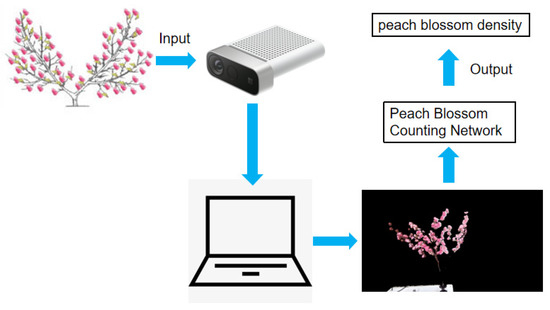
Figure 1.
Overall workflow of the proposed method.
2.2. Data Acquisition and Preprocessing Based on RGBD Camera
The Azure Kinect DK RGBD camera from Microsoft was deployed to acquire RGB and depth information from peach flowers. The Azure Kinect DK is equipped with a one 1-MP time of flight (TOF) depth sensor and a 12-MP RGB camera. According to the shooting requirements, the mode of the Kinect depth sensor used in this study was selected as WFOV with 2 × 2 boxing, the resolution was selected as 512 × 512, and the frame rate was selected as 30. Meanwhile, the resolution of the RGB camera was selected as 1920 × 1080, the format option was MJPEG, and the frame rate was selected as 30. The acquired RGB image and depth information by the Azure Kinect DK camera were mapped together using the open3d [17] and Numpy library [18] by a Python script. The RGB images were then segmented according to corresponding depth information. Namely, pixels within the distance between the RGBD camera and the main stem of the Y-shaped peach trees remained so that the complex environmental background and the flowers on the distal side of the Y-shaped trees were removed. After the depth-based segmentation, the remaining flowers in the resulting images were all on the near side of the RGBD camera, as shown in Figure 2.
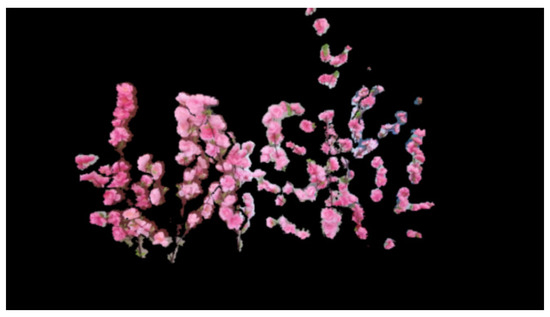
Figure 2.
Image after segmentation based on depth information.
2.3. Convolutional Neural Network for Peach Flower Counting
2.3.1. Overall Architecture of the Proposed Network
The proposed peach flower counting network (FC-Net) was based on a dilated convolutional neural network CSRNet for crowd counting [14] and consisted of three main parts, a backbone network for feature extraction, a multi-scale feature fusion module to fuse the extracted features of different scales, and an atrous convolutional network to increase the network perceptual field (Figure 3). When performing peach flower density detection, the stamen and pistil of the flowers are distinct from the other parts in terms of color and texture, which may affect the counting performance of the network. In order to extract the deep features of flowers, the first 10 layers of the VGG16 [19] network were selected as the backbone network. The three maximum pooling layers of the VGG16 remained and the fully connected layers were removed. A five-layer atrous convolutional network that only used sparse kernels to alternately merge convolutional layers was added. Under the same network volume, it had a wider range of receptive fields of view, and the resolution of the feature map remained unchanged. The last layer was a convolutional layer with a convolution kernel size of 1 × 1, which was used to output a high-quality peach flower density map. A multi-scale feature fusion module was added to fuse multi-scale features extracted by the backbone network to keep more contextual features. In addition, a light-weighted channel attention module, efficient channel attention (ECA) [20], was incorporated in the feature extraction and fusion stages, enabling cross-channel information interaction without reducing the channel dimensionality.
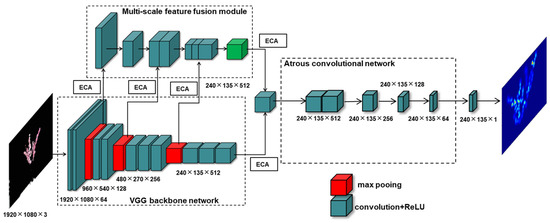
Figure 3.
Architecture of the proposed FC-Net.
2.3.2. Multi-Scale Feature Fusion (MSFF) Module
Peach flowers in the blossom period are diverse and different in shape and color. During the model training process, the backbone network extracted the features of the target through layer-by-layer convolution, and the fixed-size convolution kernel is not effective in perceiving peach flowers of different shapes. In addition, with the deepening of the layers of the convolutional neural network, the receptive field of the network gradually becomes larger and the characterizing ability for semantic information becomes stronger; however, the resolution of deeper feature maps becomes lower and the perception ability of detailed information becomes poorer, causing information loss of small targets [21]. Therefore, it is difficult to detect immature flower buds using deep features alone. Compared with deep layers, the shallow layers of feature extraction networks have a relatively small receptive field, higher resolution, and stronger perception ability of detailed information, making shallow feature maps suitable for detecting small targets. Therefore, the fusion of multi-scale features provides an effective way for flower target detection and segmentation. In this work, a multi-scale feature fusion module (Figure 4) was introduced to retain more information about the location, edge, and texture of peach flowers so as to improve the detection accuracy for small flower buds.
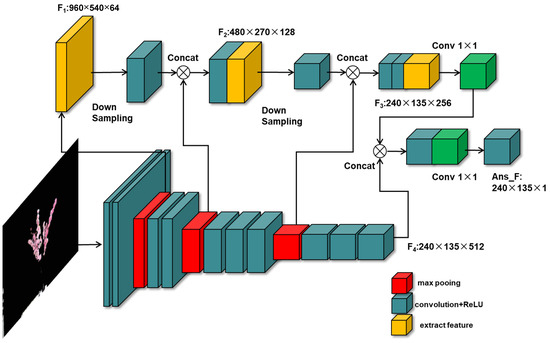
Figure 4.
Architecture of multi-scale feature fusion module.
As shown in Figure 4, a shallow feature map was extracted after layer-3 of the backbone network as the first feature fusion branch F1, the intermediate feature map after layer-6 was extracted as the second feature fusion branch F2, the deep feature map after layer-10 was extracted as the third feature fusion branch F3, and the output feature map of the backbone network was marked as the fourth feature fusion branch F4. The size of feature maps F1, F2, F3 and F4 were 960 × 540 × 64, 480 × 270 × 128, 240 × 135 × 256 and 240 × 135 × 512, respectively. The shallow feature map F1 was downsampled by a 2 × 2 average pooling layer to ensure that the fused feature map was consistent in scale with the middle layer feature map F2. The down-sampled shallow feature map F1 was then concatenated with the feature map F2 to obtain a fused feature map F1_2. The feature map F1_2 was downsampled by a 2 × 2 Max pooling layer and concatenated with feature map F3 to obtain feature map F1_2_3. The two concat operations increased the number of channels of feature maps and the receptive field became large. Then, the number of channels of F1_2_3 was reduced to 512 by a convolution kernel of size 1 × 1. The resulting F1_2_3 map was then concatenated with F4, followed by a convolution with a kernel size of 1 × 1 to reduce feature dimensionality, and the final fused feature map Ans_F was obtained. After feature fusion, the feature map Ans_F contained multiple local features under different receptive fields, and the semantic and location information of the extracted features were enhanced. The formulae for the above operations were defined as follows:
F1_2 = Concat[AP(F1), F2]
F1_2_3 = Concat[MP(F1_2), F3]
Ans_F = Conv{Concat[Conv(F1_2_3), F4]}
2.3.3. ECA Module
In the multi-scale feature fusion module, the weights of features of each scale were the same due to the feature fusion by the direct concat operation. The semantic information levels of different feature maps had different perception capabilities for peach flowers of different sizes. Moreover, the fused features of different levels also contain interference information, such as background noise, which could negatively affect the model performance and reduce the detection accuracy of the model as the number of network layers increased [22]. Therefore, the light-weight channel attention module ECA (Figure 5) was introduced on the transfer path of feature extraction and fusion, to enable the model to selectively focus on key detail features of flowers while suppressing unimportant features, such as leaves and branches to improve the detection accuracy of peach flowers [23].
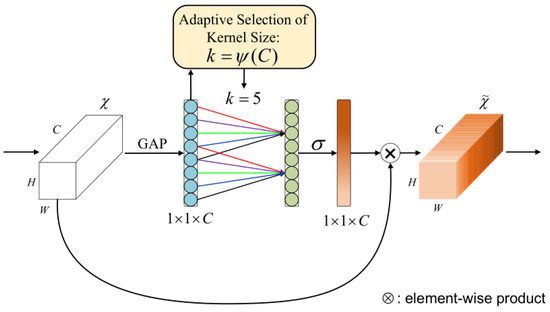
Figure 5.
Diagram of ECA module [20]. X denotes output of the convolution layer, H, W and C denote the height, width and channel dimension of the convolution block, GAP denotes the global average pooling, k is the adaptively selected convolution kernel size, and σ is the Sigmoid activation function.
The ECA module first adaptively determines the kernel size k of one-dimensional convolution through nonlinear mapping of the channel dimension. After a global average pooling operation to the input features without dimensionality reduction, the ECA captured local cross-channel interaction by considering every channel and its k neighbors. Then, ECA generates channel weights by performing a fast one-dimensional convolution of size k and a Sigmoid activation function. Finally, the weights are multiplied with corresponding elements of the original input feature map to obtain the output feature map. ECANet effectively avoided the effect of dimensionality reduction on the learning effect of channel attention, and appropriate cross-channel interactions significantly reduced the complexity of the model while maintaining its performance.
2.4. Dataset Preparation
2.4.1. Data Acquisition
In order to ensure the diversity of samples, four cultivars of peach trees were selected with flower colors involving pink, light pink and white. The peach branches with flowers were arranged in a Y shape in a laboratory to simulate Y-shaped peach trees in an orchard. The number of flowers in the field of view of the RGBD camera ranged from 20 to 300. As shown in Figure 6, the Azure Kinect DK RGBD camera was fixed on a tripod with a height of 2000 mm. The distance between the camera lens and the main stem of the Y-shaped tree was 2500 mm. A total of 500 images with corresponding depth information were collected.
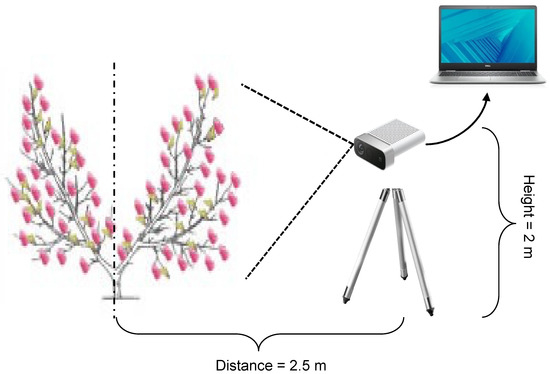
Figure 6.
Schematic diagram of data acquisition system.
2.4.2. Dataset Augmentation and Labeling
Training a deep network requires a large amount of data to learn the parameters in the network. Sufficient training data can improve the generalization ability of the trained model and avoid overfitting. In this work, the Python-based Imgaug library [24] was used for data augmentation. Specifically, the mirror flip, left and right flip, Gaussian noise, sharpen, and affine variation method was applied. After data augmentation, 500 extra images were obtained. Therefore, the final dataset contained 1000 images.
For data labeling, point labeling method [25] was used with a key point of three pixels in size. After point labeling, a density map generation method based on the nearest neighbor distance [26] was used to generate the ground-truth peach flower density map (Figure 7). Finally, the 1000 images and their corresponding ground-truth density maps were divided into a training set, a validation set and a test set with the ratio of 7.5:1:1.5.
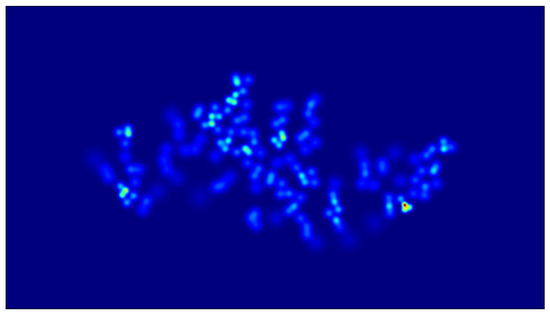
Figure 7.
Ground-truth of peach flower density map.
2.5. Model Training
A high-performance GPU platform was used to accelerate the training of deep learning tasks. The configuration of the training environment is shown in Table 1. Before training, the pretrained weights of the first 10 layers of the VGG16 network on the ImageNet dataset were loaded as initial weights, and the mean and standard deviation values of the ImageNet dataset were used for image normalization. The initial learning rate was set as 1 × 10⁻⁵, the momentum was set as 0.95, the number of iterations was set as 500, and the batch size was set as 1. The mean square error between the ground-truth and the predicted flower density map was used as a loss function (Equation (4)).
where L is the loss function, N denotes the batch size, i denotes the image fed to the network, Z denotes the predicted flower density map by the proposed network, and denotes the ground-truth of the density map. The Stochastic Gradient Descent (SGD) optimizer was used for model training.

Table 1.
Configurations of the model training environment.
2.6. Evaluation Metrics
The root mean square error (RMSE), mean absolute error (MAE), coefficient of determination (R2) and overall error rate (Er) were used to evaluate model performance. RMSE could reflect the robustness of the counting method and was often used to quantify the counting performance [27]. MAE could reflect the error between the true and predicted values. The smaller the MAE and RMSE, the better the counting performance [28]. R2 measures how well the predicted number of flowers fits the true values. The closer the R2 value to 1, the closer the predicted number of flowers is to the true values. Er represented the error rate of the model predicting the peach blossom density detection results on the overall test set. The smaller the Er value, the smaller the overall error. The formulas of the above indicators were defined as follows.
where N denotes the number of images in the test dataset, denotes the ground-truth of flower density map, denotes the predicted flower density map, and denotes the average number of predicted flowers.
3. Results and Discussion
3.1. Ablation Study
In order to verify the robustness and accuracy of the proposed FC-Net for detecting the number of peach flowers, an ablation study was conducted. The number of flowers was calculated by integration according to corresponding density maps. The regression relation between the predicted number of flowers and true values is shown in Figure 8. Moreover, the performance of different models with different modules is listed in Table 2.
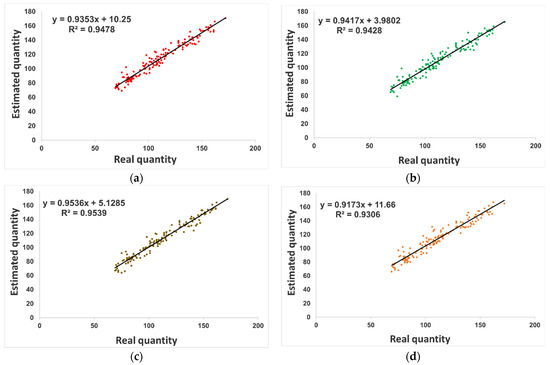
Figure 8.
Regression results between predicted number of peach flowers by different models and corresponding true values. (a) CSRNet; (b) CSRNet-MSFF; (c) FC-Net (CSRNet-ECA-MSFF, 5_Dilation = 2); (d) FC-Net (Part_Dilation = 1).

Table 2.
Peach flower counting performance of different networks based on CSRNet.
Since the proposed FC-Net was improved based on the CSRNet, the CSRNet was compared as the baseline network. The CSRNet was designed for crowd counting scenarios in which nearly circular heads were recognized and counted. For the peach flower counting task in this work, flowers are also irregularly circular objects so the CSRNet should work. The results validated the performance of the CSRNet which yielded MAE, RMSE, R2 and Er of 5.45, 7.14, 0.95 and 2.77%, respectively. Compared with CSRNet, the CSRNet-MSFF added a multi-scale feature fusion module that could fuse features from different layers of the feature extraction network; the results confirmed the effectiveness of the MSFF module, with the MAE reduced to 5.08, the RMSE reduced to 6.38, and the Er reduced to 2.25%. Based on the CSRNet-MSFF network, the proposed FC-Net (Model 2) added several ECA modules to the extracted feature maps at different layers to enable the network to selectively focus on key detail features of flowers. In addition, a five-layer atrous convolutional network with a fixed dilation rate of 2 was added as a neck to expand the perceptual field and maintain the detection accuracy of the network. The proposed FC-Net (Model 2) network achieved the best results among the five compared networks, yielding MAE, RMSE, R2 and Er of 4.30, 5.65, 0.95 and 0.02%, respectively. Furthermore, the average processing time for one single image by Model 2 was 0.12 s, which can meet the requirement of real-time flower density detection. Based on Model 2, different configurations were also tested for the FC-Net. Model 3 (FC-Net, Part_Dilation rate = 1) reduced the dilated rate of the last three layers from 2 to 1 in the back-end atrous convolutional layers, which could improve processing speed while guaranteeing detection accuracy. From Table 3 it can be seen that the time to process a single image by Model 3 was reduced by 0.02 s compared with Model 2, while the MAE value increased to 5.76, the RMSE value increased to 7.65, the R2 decreased to 0.93 and the Er value increased to 2.23%.

Table 3.
Comparison with state-of-the-art networks for peach flower counting.
3.2. Comparison with State-of-the-Art Networks
To further validate the performance of the proposed FC-Net, five state-of-the-art counting networks were compared, including the Multi-column Convolutional Neural Network (MCNN) [26], Simplifying and Improving Crowd Counting with Transformer (CCTrans) [29], Focal Inverse Distance Transform Maps (FIDTM) [30], Distribution Matching for Counting Network (DM-Count) [31] and Context-Aware Crowd Counting Network (CAN) [32]. The training, validation and test datasets were used for model training and test. Moreover, the MAE and RMSE were used to evaluate the performance of these models. The comparison results are shown in Table 3. Among the networks compared, the CCTrans performed the best with an MAE and RMSE of 3.73 and 4.62, followed by our proposed FC-Net with an MAE and RMSE of 4.30 and 5.65, respectively. The FIDTM and CAN provided very close performance, and the MCNN performed the worst. The CCTrans utilized Twins [33] as the backbone network and more advantageously used the self-attention mechanism to capture global features of objects in the counting scenario, allowing CCTrans to achieve top performance on several crowd counting datasets. However, the CCTrans had the largest model size up to 368.78 MB among the six compared networks; the average processing time for one single image was 0.28 s, which was the longest among the compared networks. By comparison, the model size of our proposed FC-Net was only 54.92 MB, and the average processing time for one image was 0.12 s, making this model easy to implement on an edge computing platform in the field.
4. Conclusions
In this work, a peach blossom density detection method based on an RGBD camera and a deep learning network, FC-Net, was proposed and tested for Y-shaped densely planted peach trees. Images were acquired by the RGBD camera and complex background and distal peach flowers were filtered out through depth information, obtaining a peach flower density detection dataset containing 500 images. The FC-Net was established based on the CSRNet, by incorporating an MSFF module to fuse features of different scales, an ECA module to enable the FC-Net to selectively focus on key detail features of flowers, and an atrous convolutional network to increase the perceptual field of FC-Net. Results showed that the coefficient of determination (R2) between the estimated number of flowers by the FC-Net and the real values reached 0.95, the mean absolute error (MAE) was 4.3, the root mean square error (RMSE) was 5.65, the counting error rate (Er) was 0.02%, and the processing time of one image was 0.12 s. Overall, the proposed FC-Net could meet the requirements of real-time flower density detection for Y-shaped densely planted peach trees in the field and provide visual support for intelligent mechanical flower thinning operations.
Author Contributions
Conceptualization, K.T. and A.W.; methodology, K.T. and A.W.; software: K.T. and Y.S.; validation, A.W. and Z.L.; formal analysis, K.T., Y.S. and A.W.; investigation, A.W. and X.W.; resources, A.W., X.W. and F.P.; data curation, K.T. and Y.S.; writing—original draft preparation, K.T.; writing—review and editing, A.W.; visualization, K.T.; supervision, A.W.; project administration, A.W. and F.P.; funding acquisition, X.W and F.P. All authors have read and agreed to the published version of the manuscript.
Funding
This research was funded by the National Natural Science Foundation of China (Grant No. 32001417), National Key R&D Program of China (Grant No. 2020YFD1000203), China Postdoctoral Science Foundation (Grant No. 2020M681508, 2022T150276), Open Funding from Jiangsu Province and Education Ministry Co-sponsored Synergistic Innovation Center of Modern Agricultural Equipment (XTCX2010), and Open Funding from the Key Laboratory of Modern Agricultural Equipment and Technology (Jiangsu University), Ministry of Education (MAET202112, MAET202105).
Data Availability Statement
The data presented in this study are available on request from the corresponding author.
Conflicts of Interest
The authors declare no conflict of interest.
References
- Sobierajski, G.d.R.; Silva, T.S.; Hernandes, J.L.; Pedro, M.J. Y-Shaped and Fruiting Wall Peach Orchard Training System in Subtropical Brazil. Bragantia 2019, 78, 229–235. [Google Scholar] [CrossRef]
- Costa, G.; Vizzotto, G. Fruit Thinning of Peach Trees. Plant Growth Regul. 2000, 31, 113–119. [Google Scholar] [CrossRef]
- Link, H. Significance of Flower and Fruit Thinning on Fruit Quality. Plant Growth Regul. 2000, 31, 17–26. [Google Scholar] [CrossRef]
- Tromp, J. Lower-Bud Formation in Pome Fruits as Affected by Fruit Thinning. Plant Growth Regul. 2000, 31, 27–34. [Google Scholar] [CrossRef]
- Davis, C.C.; Champ, J.; Park, D.S.; Breckheimer, I.; Lyra, G.M.; Xie, J.; Joly, A.; Tarapore, D.; Ellison, A.M.; Bonnet, P. A New Method for Counting Reproductive Structures in Digitized Herbarium Specimens Using Mask R-CNN. Front. Plant Sci. 2020, 11, 1129. [Google Scholar] [CrossRef] [PubMed]
- Wu, D.; Lv, S.; Jiang, M.; Song, H. Using Channel Pruning-Based YOLO v4 Deep Learning Algorithm for the Real-Time and Accurate Detection of Apple Flowers in Natural Environments. Comput. Electron. Agric. 2020, 178, 105742. [Google Scholar] [CrossRef]
- Juntao, X.; Bolin, L.; Zhuo, Z.; Shumian, C.; Zhenhui, Z. Segmentation and Recognition of Litchi Mosaic and Leaf Based on Deep Semantic Segmentation Network. J. Agric. Mach. 2021, 52, 252–258. [Google Scholar]
- Lin, P.; Chen, Y. Detection of Strawberry Flowers in Outdoor Field by Deep Neural Network. In Proceedings of the 2018 IEEE 3rd International Conference on Image, Vision and Computing (ICIVC), Chongqing, China, 27–29 June 2018; pp. 482–486. [Google Scholar]
- Lempitsky, V.; Zisserman, A. Learning to Count Objects in Images. Adv. Neural Inf. Process. Syst. 2010, 23, 1324–1332. [Google Scholar]
- Guo, D.; Li, K.; Zha, Z.-J.; Wang, M. Dadnet: Dilated-Attention-Deformable Convnet for Crowd Counting. In Proceedings of the 27th ACM International Conference on Multimedia, Nice, France, 21–25 October 2019; pp. 1823–1832. [Google Scholar]
- Cao, X.; Wang, Z.; Zhao, Y.; Su, F. Scale Aggregation Network for Accurate and Efficient Crowd Counting. In Proceedings of the European Conference on Computer Vision (ECCV), Munich, Germany, 8–14 September 2018; pp. 734–750. [Google Scholar]
- Bai, S.; He, Z.; Qiao, Y.; Hu, H.; Wu, W.; Yan, J. Adaptive Dilated Network with Self-Correction Supervision for Counting. In Proceedings of the IEEE/CVF Conference on Computer Vision and Pattern Recognition, Seattle, WA, USA, 13–19 June 2020; pp. 4594–4603. [Google Scholar]
- Li, Y.; Zhang, X.; Chen, D. CSRNet: Dilated Convolutional Neural Networks for Understanding the Highly Congested Scenes. In Proceedings of the IEEE Conference on Computer Vision and Pattern Recognition, Salt Lake City, UT, USA, 18–23 June 2018; pp. 1091–1100. [Google Scholar]
- Wenxia, B.; Xin, Z.; Gensheng, H.; Linsheng, H.; Dong, L.; Ze, L. Field wheat ear density estimation and counting based on deep convolutional neural network. Chin. J. Agric. Eng. 2020, 36, 186–193, 323. [Google Scholar]
- Jinfeng, W.; Kai, H.; Fan, J.; Gengqian, W.; Donglin, L.; Zifeng, Z. Experimental Research on Fish Density Detection Based on Improved Deep Learning Model. Fish. Mod. 2021, 48, 77–82. [Google Scholar]
- Tian, Y.; Yang, G.; Wang, Z.; Li, E.; Liang, Z. Instance Segmentation of Apple Flowers Using the Improved Mask R–CNN Model. Biosyst. Eng. 2020, 193, 264–278. [Google Scholar] [CrossRef]
- Zhou, Q.-Y.; Park, J.; Koltun, V. Open3D: A Modern Library for 3D Data Processing. arXiv 2018, arXiv:1801.09847. [Google Scholar]
- Van Der Walt, S.; Colbert, S.C.; Varoquaux, G. The NumPy Array: A Structure for Efficient Numerical Computation. Comput. Sci. Eng. 2011, 13, 22–30. [Google Scholar] [CrossRef]
- Simonyan, K.; Zisserman, A. Very Deep Convolutional Networks for Large-Scale Image Recognition. arXiv 2014, arXiv:1409.1556. [Google Scholar]
- Wang, Q.; Wu, B.; Zhu, P.F.; Li, P.; Zuo, W.; Hu, Q. ECA-Net: Efficient Channel Attention for Deep Convolutional Neural Networks. In Proceedings of the 2020 IEEE/CVF Conference on Computer Vision and Pattern Recognition (CVPR), Seattle, WA, USA, 13–19 June 2020; pp. 11531–11539. [Google Scholar]
- Du, Y.; Song, W.; He, Q.; Huang, D.; Liotta, A.; Su, C. Deep Learning with Multi-Scale Feature Fusion in Remote Sensing for Automatic Oceanic Eddy Detection. Inf. Fusion 2019, 49, 89–99. [Google Scholar] [CrossRef]
- Niu, Z.; Zhong, G.; Yu, H. A Review on the Attention Mechanism of Deep Learning. Neurocomputing 2021, 452, 48–62. [Google Scholar] [CrossRef]
- Zhu, H.; Xie, C.; Fei, Y.; Tao, H. Attention Mechanisms in CNN-Based Single Image Super-Resolution: A Brief Review and a New Perspective. Electronics 2021, 10, 1187. [Google Scholar] [CrossRef]
- Jung, A. Imgaug Documentation, Release 0.4.0. 2020. Available online: https://imgaug.readthedocs.io/en/latest/ (accessed on 11 August 2022).
- Lu, H.; Cao, Z.; Xiao, Y.; Zhuang, B.; Shen, C. TasselNet: Counting Maize Tassels in the Wild via Local Counts Regression Network. Plant Methods 2017, 13, 79. [Google Scholar] [CrossRef]
- Zhang, Y.; Zhou, D.; Chen, S.; Gao, S.; Ma, Y. Single-Image Crowd Counting via Multi-Column Convolutional Neural Network. In Proceedings of the IEEE Conference on Computer Vision and Pattern Recognition, Las Vegas, NV, USA, 27–30 June 2016; pp. 589–597. [Google Scholar]
- Wu, J.; Yang, G.; Yang, X.; Xu, B.; Han, L.; Zhu, Y. Automatic Counting of in Situ Rice Seedlings from UAV Images Based on a Deep Fully Convolutional Neural Network. Remote Sens. 2019, 11, 691. [Google Scholar] [CrossRef]
- Willmott, C.J.; Matsuura, K. Advantages of the Mean Absolute Error (MAE) over the Root Mean Square Error (RMSE) in Assessing Average Model Performance. Clim. Res. 2005, 30, 79–82. [Google Scholar] [CrossRef]
- Tian, Y.; Chu, X.; Wang, H. Cctrans: Simplifying and Improving Crowd Counting with Transformer. arXiv 2021, arXiv:2109.14483. [Google Scholar]
- Liang, D.; Xu, W.; Zhu, Y.; Zhou, Y. Focal Inverse Distance Transform Maps for Crowd Localization and Counting in Dense Crowd. arXiv 2021, arXiv:2102.07925. [Google Scholar]
- Wang, B.; Liu, H.; Samaras, D.; Nguyen, M.H. Distribution Matching for Crowd Counting. Adv. Neural Inf. Process. Syst. 2020, 33, 1595–1607. [Google Scholar]
- Liu, W.; Salzmann, M.; Fua, P. Context-Aware Crowd Counting. In Proceedings of the IEEE/CVF Conference on Computer Vision and Pattern Recognition, Long Beach, CA, USA, 15–20 June 2019; pp. 5099–5108. [Google Scholar]
- Chu, X.; Tian, Z.; Wang, Y.; Zhang, B.; Ren, H.; Wei, X.; Xia, H.; Shen, C. Twins: Revisiting the Design of Spatial Attention in Vision Transformers. Adv. Neural Inf. Process. Syst. 2021, 34, 9355–9366. [Google Scholar]
Publisher’s Note: MDPI stays neutral with regard to jurisdictional claims in published maps and institutional affiliations. |
© 2022 by the authors. Licensee MDPI, Basel, Switzerland. This article is an open access article distributed under the terms and conditions of the Creative Commons Attribution (CC BY) license (https://creativecommons.org/licenses/by/4.0/).