Article

Profiling of Phenolic Compounds of Fruit Peels of Different Ecotype Bananas Derived from Domestic and Imported Cultivars with Different Maturity

1
Yunnan Key Laboratory of Green Prevention and Control of Agricultural Transboundary Pests, Agricultural Environment and Resources Institute, Yunnan Academy of Agricultural Sciences, 2238 Beijing Road, Kunming 650205, China
2
School of Agriculture/Institute of Plant Resources, Yunnan University, Kunming 650500, China
3
Institute of Tropical and Subtropical Industry Crops, Yunnan Academy of Agricultural Sciences, Baoshan 678000, China
4
Institute of Food Safety, Chinese Academy of Inspection & Quarantine, Beijing 100176, China
5
Bioversity International, 2238 Beijing Road, Kunming 650205, China
*
Authors to whom correspondence should be addressed.
Horticulturae 2022, 8(1), 70; https://doi.org/10.3390/horticulturae8010070
Submission received: 15 November 2021 / Revised: 4 January 2022 / Accepted: 5 January 2022 / Published: 12 January 2022

Abstract

:
Banana is one of the most produced and consumed fruits in the world and its fruit peel accounts for about 40% of the total fresh quantity of ripe fruit, which is usually regarded as waste and poses serious environmental hazards. However, it is a promising source of natural bioactive compounds including phenolic compounds. Determination of the phenolic compounds in fruit peel from different cultivars and subgroups over a range of maturities provides convincing information for making full use of them. This study developed a sensitive and reliable analytical method—ultra-high performance liquid chromatography—coupled with electrospray ionization tandem mass spectrometry (UPLC-MS/MS) for measuring phenolic compounds in fruit peel from different ecotype cultivars and subgroups with different maturity. The results showed that quinic acid had the highest concentration ratio among the main phenolic compounds in the green/ripe peel of all banana cultivars; among all banana cultivars, the total phenolic compound contents of green banana peel were significantly higher than that of ripe banana peel; the total phenolic compound contents in the green/ripe fruit peel of non-dessert bananas were significantly higher than that of dessert bananas (green: non-dessert banana 1.48 ± 0.44 mg/g vs. dessert banana 0.97 ± 0.12 mg/g; ripe: non-dessert banana 0.26 ± 0.13 mg/g vs. dessert banana 0.19 ± 0.06 mg/g). These data provide a basis for the rational utilization of phenolic compound extractions from banana peel with huge biomass in the next step.

1. Introduction

Banana is an important tropical and subtropical fruit crop [1], and is one of the most produced and consumed fruits in the world [2,3]. According to the latest data of Food and Agriculture Organization (FAO) in 2020, India was the world’s largest banana producer, followed by China, with annual production reaching 30.46 and 12 million tons, respectively [4]. Banana peel accounts for about 40% of the total fresh quantity of ripe fruit [5], which is largely discarded in nature and becomes household and industrial food waste [5]. Usually, banana peel waste is indiscriminately dumped into the rivers, lakes, or low-lying landfills where it degrades slowly until it decays and forms methane and carbon dioxide, and other noxious gases such as hydrogen sulfide and ammonia that spread unpleasant odors, affect the nearby ecosystems [6], and cause serious environmental damage [6,7,8]. Thus, banana peel waste is needed to recycle or reuse instead of discarding anyway or incinerating.
Banana peel, as agricultural waste, contains a large number of oligosaccharides, cellulose, and mineral elements [9], which is an ideal material for adsorbents and is widely used to reduce environmental pollutants, such as heavy metals, dyes, organic pollutants, nitrate, and arsenate in groundwater, pesticides, and various other gaseous pollutants [7,8]. Banana peel has recently been increasingly reported as a rich source of phenolic compounds [10], with total phenolic content ranging from 4.95 to 47 mg garlic acid equivalent/g dry matter (mg GAE/g DM). This level was 1.5–3 times higher than that recorded in the pulp [11]. These confer a wide range of biological and pharmacological properties with potential as antimutagenic, antiviral antithrombotic, hepatoprotective agents, as well as a food additive and signaling molecules because of strong natural antioxidant properties [12,13]. Many fruit peels’ phenolic compounds have now been studied [
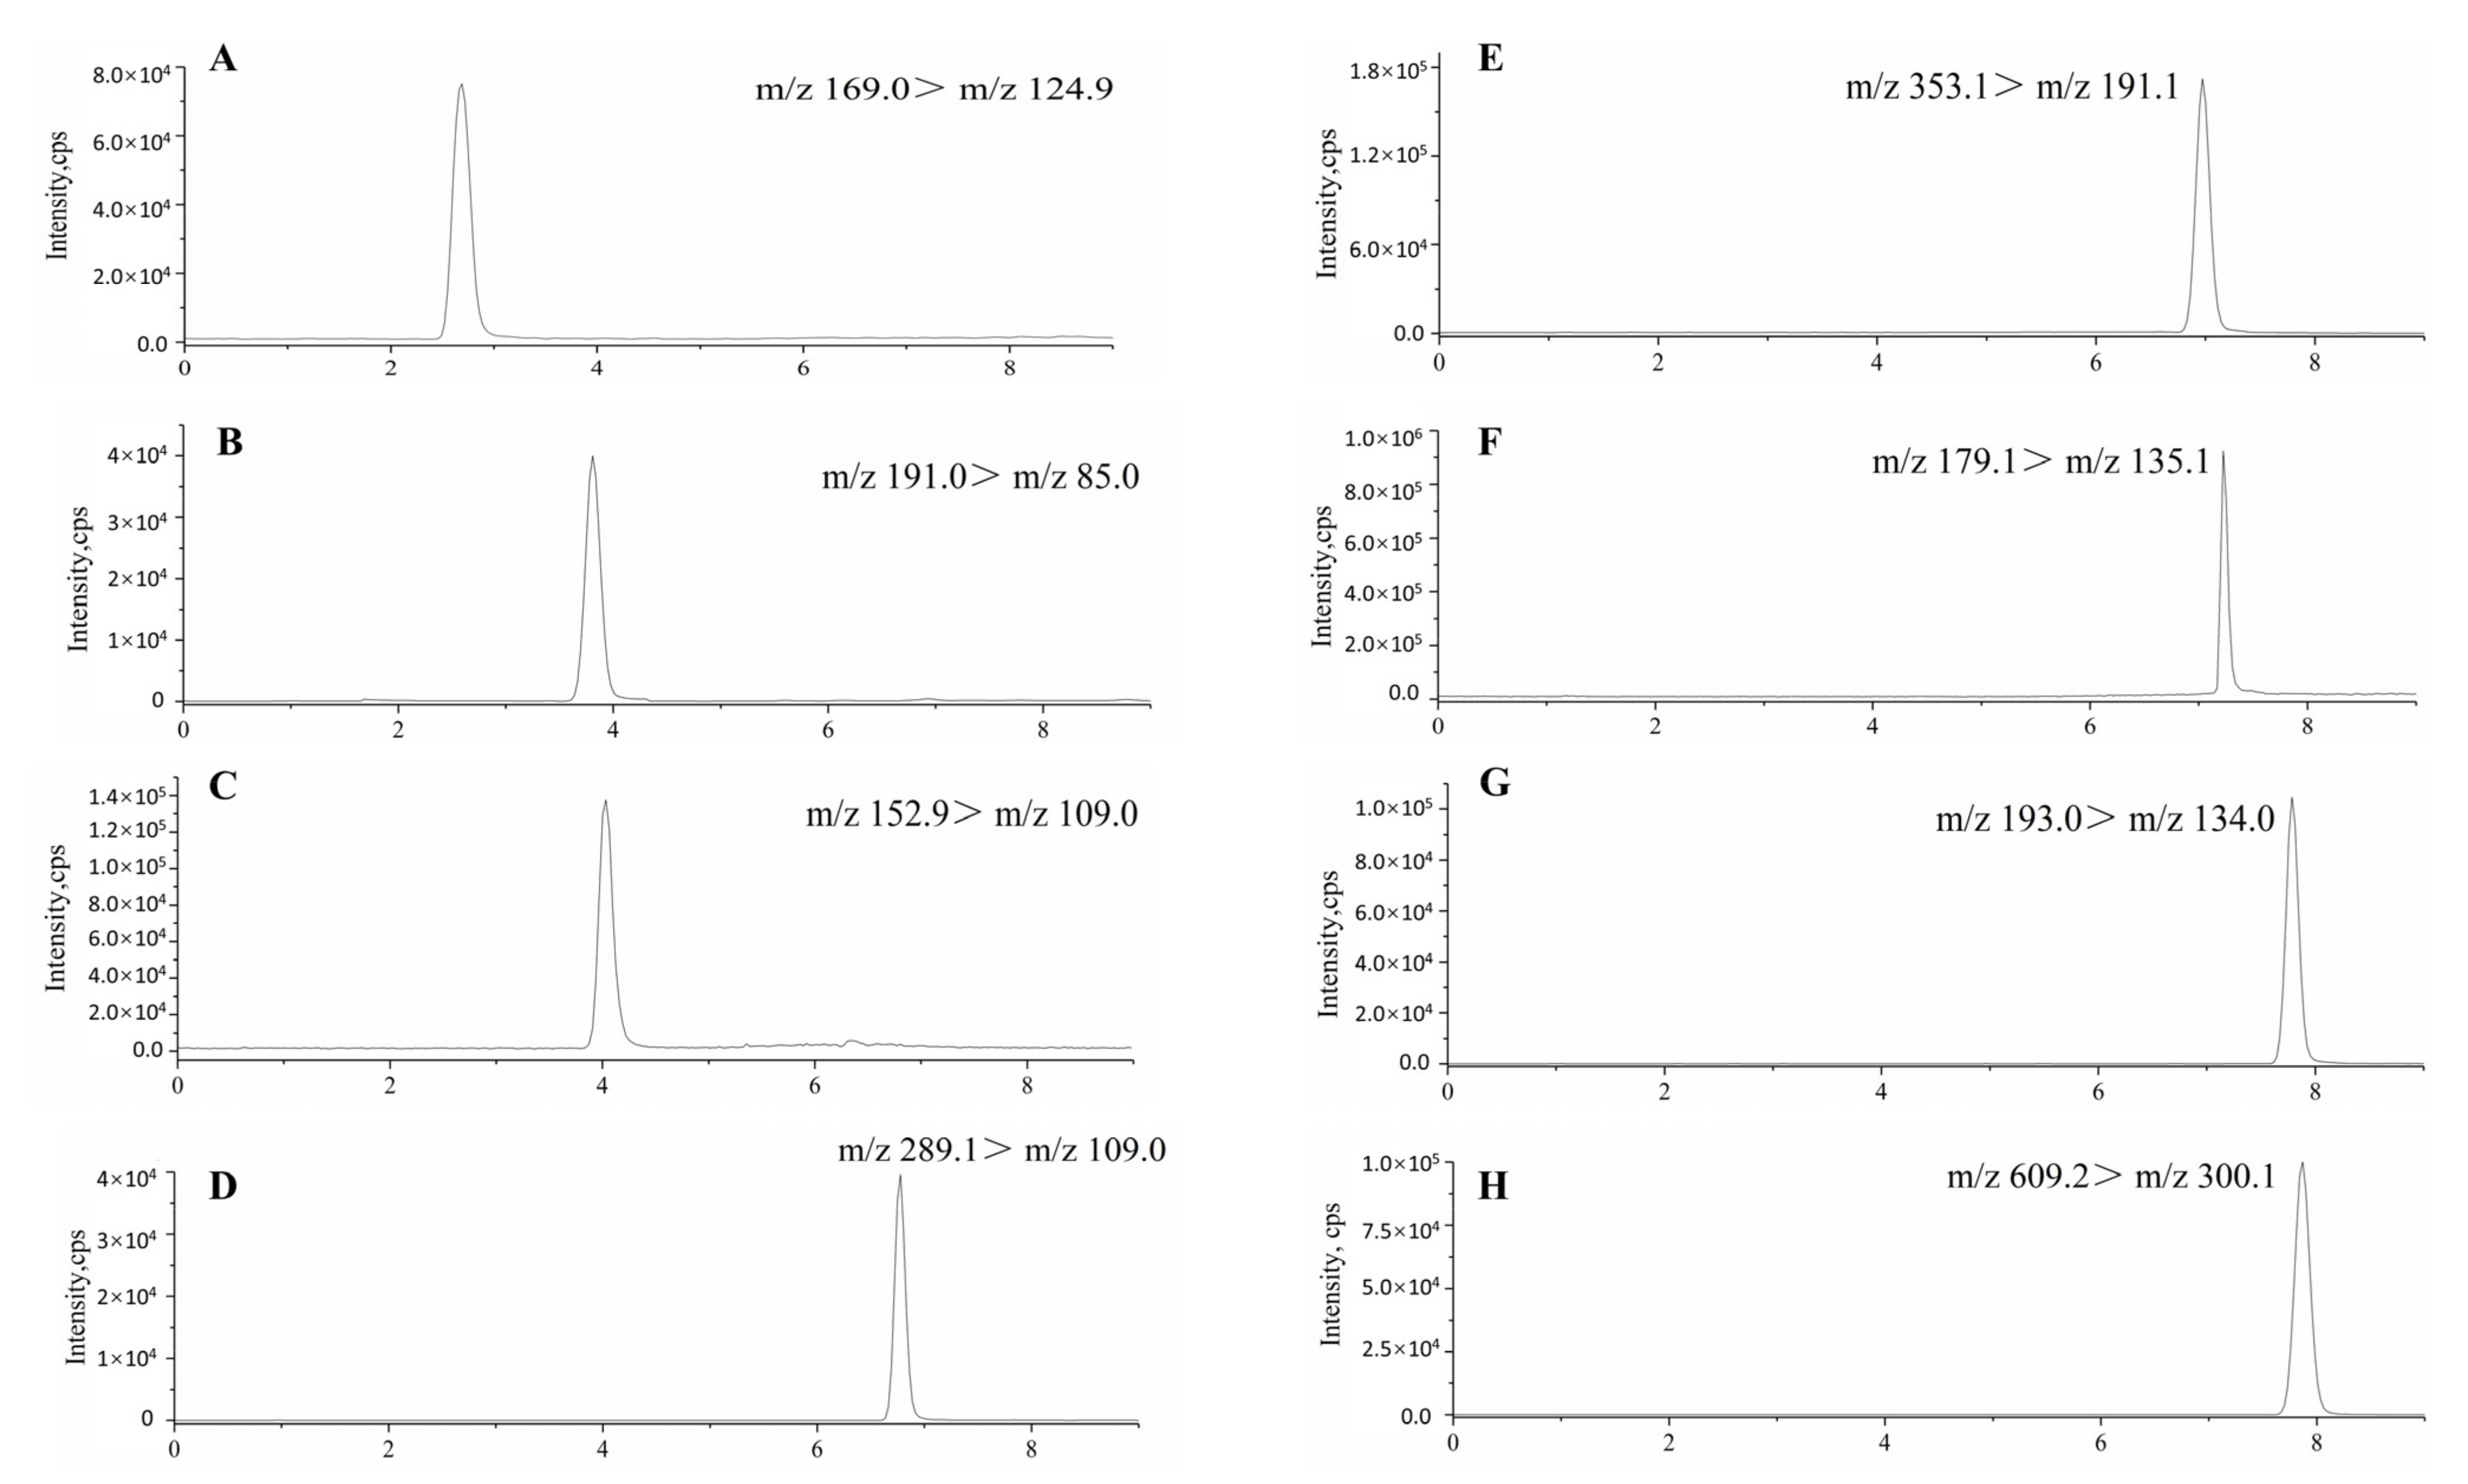
14]. It is noted that gallic acid, quinic acid, protocatechuic acid, catechin, chlorogenic acid, caffeic acid, ferulic acid, and rutin are their main phenolic compounds [15], which are mainly associated with their antioxidant [16,17,18,19]. However, little research is available on the natural contents of main phenolic compounds in the banana peel of different cultivars and maturities for picking out banana peel with rich phenolic compounds for further efficient utilization. Thus, an extraction and analytical method is urgently needed to determine main phenolic compound contents in fruit peel from different banana cultivars and subgroups over a range of maturities.
To add value to the industrial waste from banana processing, an effective extraction would be beneficial to recover functional ingredients sustainably [19,20]. In order to obtain phenolic-rich extracts, conventional extraction methods with organic solvents are commonly used [21]. These extraction technologies are highly polluting, labor-intensive, solvent consuming, and time consuming, so it is necessary to develop green alternative methods [22]. The ultrasound assisted extraction (UAE) could be one of the most suitable techniques [23], as it is very simple to use, requires relatively inexpensive apparatus, reduces the volume of solvent [24], uses acoustic energy and solvents to enhance the release and diffusion of phenolic compounds from various matrices [25], and allows to use green extraction solvents with a high efficiency due to the mechanical effects that it produces in the cellular structure of the matrix [26,27]. Many analytical methods have been used to determine phenolic compound contents in fruit peel, but currently only UPLC-MS/MS could provide higher sensitivity, selectivity, shorter analysis time, and simultaneous determination of many phenolic compounds [28]. Therefore, in the study, we first proposed to use UPLC-MS/MS combining with ultrasonic extraction to simultaneous determine the main phenolic compound contents in banana peel and further explored the difference of phenolic compound contents in banana peel of different cultivars and subgroups with different levels of maturity.
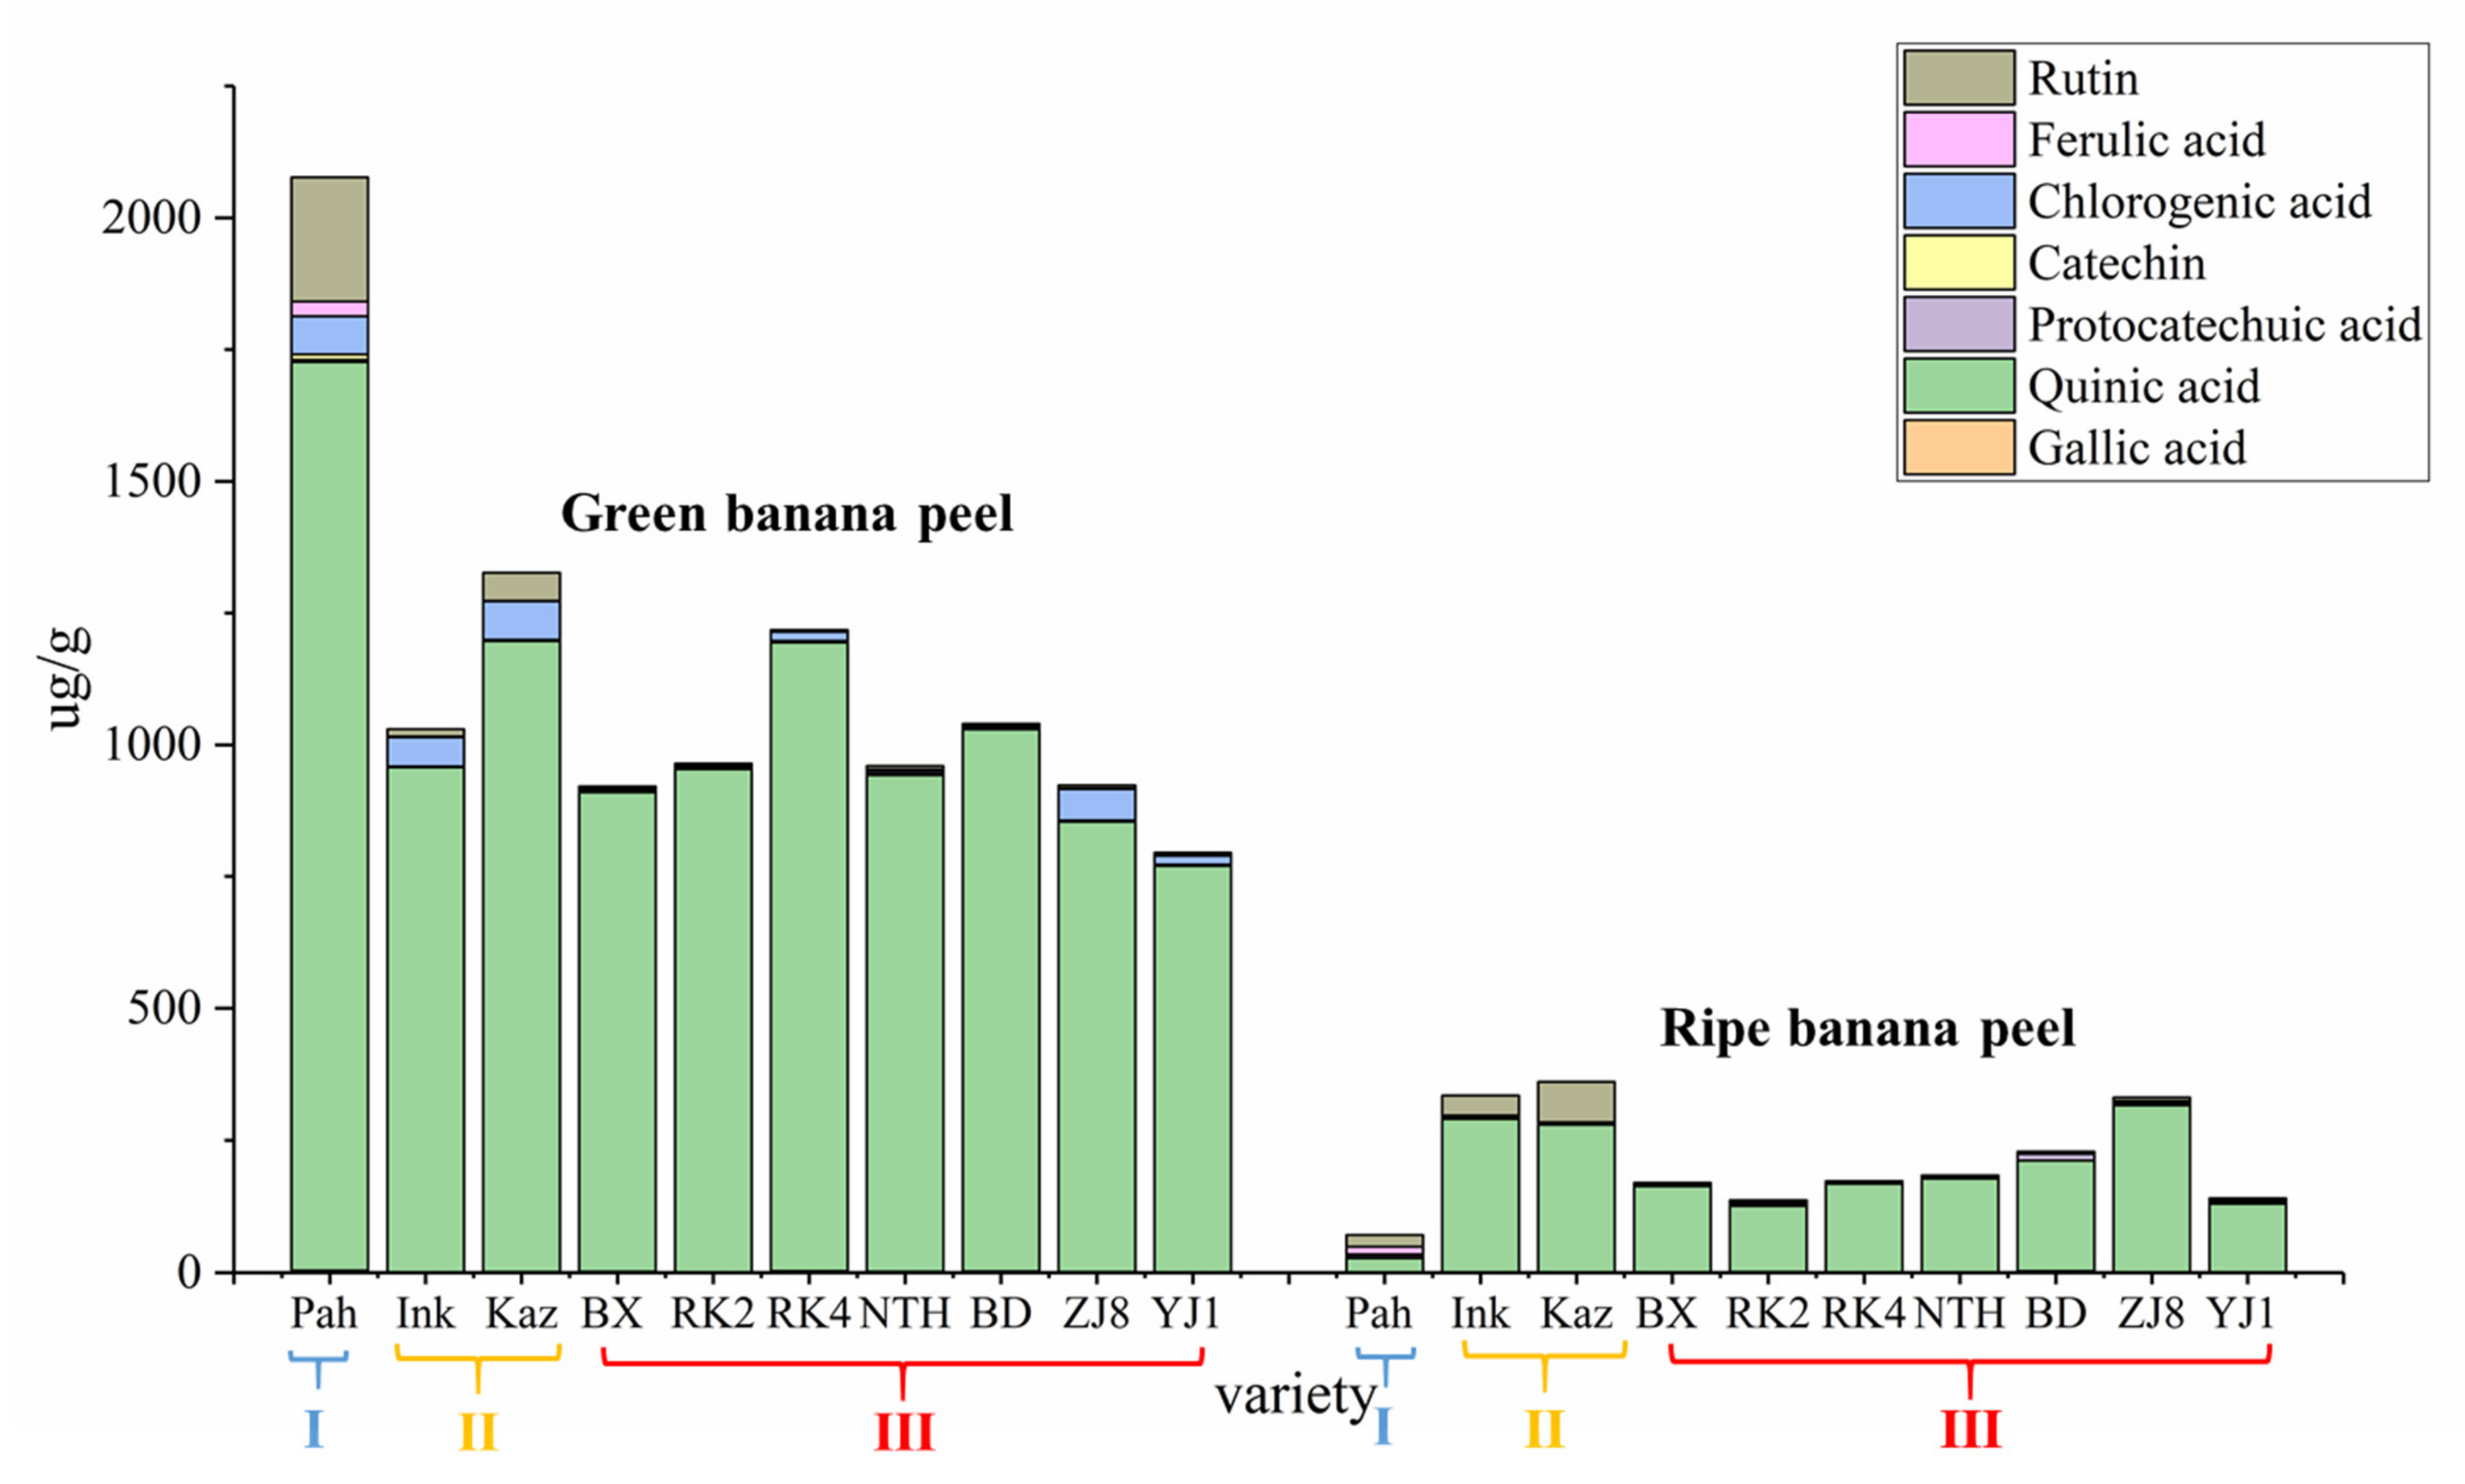
The plant cultivar and maturity are the important factors that influence the synthesis and accumulation of biologically active substances in fruit peel. Thus, our work aimed to develop a sensitive and effective UPLC-MS/MS method combined with ultrasonic extraction for simultaneous determination of eight main phenolic compounds in the fruit peels of different banana ecotypes and subgroups, with different degrees of maturity. Quantification of main phenolic compounds across the fruit peels with different banana ecotypes and maturity will also provide valuable data on their contents, and will demonstrate which cultivar and maturity peel is used to extract individual phenolic compound might be meaningful. Our study contributes to finding new sources of phenolic compounds and laying the foundation for future utilization of banana peel. We could use the fruit peel extracts for the production of functional food, dietary supplements, or other innovative preparations with a specific biological effect.

2. Materials and Methods

2.1. Chemicals and Reagents

Standards (gallic acid, quinic acid, protocatechuic acid, catechin, chlorogenic acid, caffeic acid, ferulic acid, and rutin) were purchased from Sigma Company (Ontario, CA, USA). HPLC-grade methanol and acetonitrile (99.95%) were purchased from Fisher Scientific (Loughborough, UK). Formic acid (HPLC grade) was purchased from Sigma–Aldrich (St. Quentin Fallavier, France). Dimethyl sulfoxide (DMSO, analytical-reagent grade) was purchased from Gaoyao Chemical Reagent Co., Ltd. (Shanghai, China). Deionized water used throughout the study was purified using a Milli-Q water-purification system (Millipore, Bedford, MA, USA).

2.2. Preparation of Stock and Standard Solutions

Individual stock standard solutions of gallic acid, quinic acid, protocatechuic acid, catechin, chlorogenic acid, caffeic acid, ferulic acid, and rutin were prepared on a weight basis in pure methanol at 1.0 mg/mL. Next, 0.1 mL of each individual standard stock solution was accurately measured in a 10 mL amber volumetric flask, and the mixture was diluted with pure methanol to prepare a 100.0 μg/mL mixed standard stock solution. The standard stock solutions were sealed and stored at −80 °C.
The individual standard working solutions (100.0, 10.0, 5.0, 1.0 μg/m, 100.0, 10.0, and 1.0 ng/mL) and mixed standard working solutions (1.0, 0.5 μg/mL, and 200.0, 100.0, 50.0, 20.0, and 10.0 ng/mL) were prepared by diluting the individual standard stock solutions and mixed standard stock solution with pure methanol, respectively. The individual standard working solutions and mixed standard working solution were stable for 1 week at −20 °C.

2.3. Conditions of Ultra-High-Performance Liquid Chromatography–Tandem Mass Spectrometry

The analytical system was UPLC-MS/MS analyses. The model of mass spectrometer (MS) consisted of a Qtrap 6500+ (Applied Biosystems, New York, NY, USA) with an electrospray ionization (ESI) source for molecule ionization. The optimized ESI temperature was set at 500 °C, ionspray voltage at −4500 V for negative mode. The curtain gas and collision gas pressure were 36 and 10 psi, respectively. All qualitative and quantitative data in this study were acquired using MRM mode. A UPLC model 20A (Shimadzu, Kyoto, Japanese) consisted of a binary pump, degasser, and auto-sampler. Peak areas of each constituent were automatically integrated using analyst software. The analytical column was Agilent Zorbax Extend-C18 (2.1 × 100 mm, 3.5 µm; Agilent Technologies, Santa Clara, CA, USA). The binary mobile phase contained both methanol (solvent A) and 0.2% (v/v) aqueous formic acid (solvent B), which was pumped at a flow rate of 0.3 mL/min for a total run time of 9 min [29]. The injection volume was 5.0 μL, and the column temperature was 35 °C.

2.4. Samples Collection

Banana samples were imported from the Alliance of Bioversity International and CIAT, the Agrobiodiversity and Banana Research Team of Agricultural Environment and Resources Institute, Yunnan Academy of Agricultural Sciences, then tissue culture and rapid propagation were performed. Afterwards, 10 banana germplasm resources were planted in the experimental base of Xishuangbanna, Yunnan (21°54′13″ N; 100°48′25″ E). The 10 banana ecotypes were, respectively, Pahang, Inkira, Kazirakwe, Brazilian, Reke No. 2, Reke No. 4, Nantianhuang, Baodaojiao, Zhongjiao No. 8, and Yunjiao No. 1. During sampling, the third comb of banana was collected from top to bottom, with 3 repeating bases, one for each cultivar in each base, and the middle 4–6 fruit fingers of each comb of banana shall be continuously taken for measurement and statistics.
Banana germplasms are classified into different subgroups according to clusters of phenotypically similar populations of a particular species. The 10 banana ecotype cultivars in the study were divided into three subgroups based on their origin and genetic relationship: the Malaccensis subgroup, the Mutika–Lujμgira subgroup, and the Cavendish subgroup. Pahang in the Malaccensis subgroup was the wild banana species from Malaysia, Inkira, and Kazirakwe in the Mutika–Lujμgira subgroup were the cultivated cooked bananas from Africa, and the other seven banana cultivars, in the Cavendish subgroup, were all the cultivated and domesticated cultivars which were commonly grown in China with high yields and the highest degree of commercialization. The first two subgroups belong to non-dessert banana, which includes non-edible banana and boiled banana, and the last subgroup is the dessert banana which includes fresh banana.

2.5. Sample Extraction

According to the color chart of banana maturity, seven ripe-green bananas and full-ripe bananas accelerated with Ethrel were harvested. A knife was used to separate the peel from the pulp to obtain a weighed sample of 100.0 g of fresh fruit peel. After washing and slicing, we put the slices in an oven at 70 °C and dried them for 9–10 h until they were dry. They were then weighed and pulverized, and sieved through a 60-mesh sieve to make a powder for use. Samples of accurately weighed 1.0 g of banana peel powder were placed in a 50 mL centrifuge tube, and 45 mL of 30% acetonitrile was added, and vortexed for 10 s. Then ultrasonic extraction was conducted for 40 min, centrifugation at 5000 rpm/min for 10 min, and then 15 mL of supernatant in a new centrifuge tube was taken. We repeated the above operation 3 times. Finally, 45 mL of the supernatant was obtained, vortexed to mix, and passed through 0.22 μm microporous membrane to obtain the test solution.

2.6. Determination of Fruit Agronomic Traits, the Proportion and the Moisture Content of the Peel in Different Green/Ripe Banana Ecotypes

Six fruit agronomic characters of green and ripe banana were measured, including fruit finger girth, fruit finger length, peel thickness, fresh weight of pulp, fresh weight of peel, and fruit finger fresh weight. The girth of fruit finger refers to the circumference of the middle position of fruit finger. The fruit finger length refers to the length from the top of the fruit along the outer edge of the curved surface to the base of the fruit handle. Then, we determined the proportion of the fresh green fruit peel and dry weight of fruit peel of 10 banana cultivars. The proportion of fresh green fruit peel was the percentage of fresh green fruit peel fresh weight/green banana fresh weight, the dry weight ratio of banana peel refers to the percentage of dried banana peel weight/fresh banana peel weight. The proportion of dry weight of the peel can be used to explain the water content of the peel. The smaller the dry weight is, the higher the water content is. The data indexes of banana samples were determined six times.

2.7. Statistical Analysis

For the quantitative analysis of phenolic compounds in banana peel, we measured 10 samples for each banana cultivar and calculated the average value. The validation experiment was performed in six replicates. Experimental data are represented as means ± SD and p < 0.05 was considered to be statistically significant. Data were calculated by one-way analysis of variance (ANOVA) and analyses were performed using SPSS 26.0. Probability values of less than 5% were considered to be significant.

3. Results and Discussion

3.1. Optimization of Multiple Reaction Monitoring (MRM) Parameters

At first, in the mass spectrum system, the Q1 quadrupole mass spectral analyses in full scan mode (m/z 100–300) were conducted to search in ion mode and precursor ions to search in the MRM method [30]. This was respectively obtained by ESI in the negative and positive ion mode. Eight kinds of phenolic compounds could display the deprotonated ion peak ([M−H]) in the negative ion mode and the protonated ion peak ([M+H]+) in the positive ion mode. All the phenolic compounds showed a stronger response in the negative ion mode than that in the positive ion mode, which was the same as the result of Fan et al. [31]. Thus, the negative ion mode was selected for the MRM method, and the deprotonated ion in ([M−H]) for the eight compounds was selected as the precursor ion. The results are shown in Table 1. After selecting precursor ions in the Q1 quadrupole mass spectra, the product ion scan mode was applied for fragment ions in the Q3 quadrupole mass spectra. One precursor ion and two main ion fragments were selected and optimized with collision energy (CE) and declustering potential (DP) voltage for each compound in the MRM mode [32]. All the optimized MRM parameters are shown in Table 1.

3.2. Optimization of Separation Conditions

To completely separate and preserve the eight analytes on the column, we referred to the reported methods [34], and an Agilent ZORBAX Extend-C18 column was selected for UPLC. In UPLC, polar compounds showed good retention on this column, and the column can tolerate a wide pH range. In order to obtain the best separation of target analytes, we tested the feasibility of different mixtures of solvents (such as methanol-water and acetonitrile-water) using various buffers (such as 0.05%, 0.1%, 0.2% formic acid solution and 1, 2, 3 mM of ammonium formate solution) with different flow rates and column temperatures, to optimize the separation condition in the C18 column. It was determined that both acetonitrile and methanol can elute these eight compounds. Eight compounds were found to be difficult in separating well in acetonitrile, although the elution capacity of acetonitrile was higher than that of methanol. Therefore, we selected methanol for the organic phase. In addition, the peaks of gallic acid and quinic acid were always trailing in ammonium formate buffer or 0.1% formic acid-1 mM ammonium formate solution. Finally, we concluded that the amine salt was not suitable for the determining the peak shape of phenolic compounds.
The acid formulation in solution as an aqueous phase appears to be a better choice due to better resolution and good peak shape. We investigated the effect of adding 0.05%, 0.1%, and 0.2% (v/v) formic acid on the sensitivity of each analyte in the aqueous phase. This improved separation made the peak shape more symmetrical and increased the retention time of the target analytes. The maximum response of the eight target analytes was attained with 0.2% formic acid, and the peaks and separation effects of each compound were enhanced. Therefore, methanol−0.2% (v/v) formic acid was deemed suitable for these compounds after testing. In order to achieve effective separation of the eight phenolic compounds, the gradient elution program was optimized by adjusting the mobile phase ratio and analysis time. Finally, the optimum liquid chromatographic conditions for separating eight phenolic compounds were established. The gradient elution program was as follows: 0–4% A for 1 min, 4–15% A for 2 min, 15–55% A for 1 min, 55–60% A for 1.5 min, 60–90% A for 0.5 min, 90–4% A for 1 min, and 4% A for 2 min. Mass ion chromatograms of the phenolic compound solutions are shown in Figure 1. Their retention times are shown in Table 1.

3.3. Optimization of Extraction Conditions

Jimenez et al., indicated that UAE had a great potential to improve the extraction of bioactive compounds from natural products [35]. In order to obtain better extraction yield, the main 4 factors were optimized in an ultrasonic extraction method based on a single factor experiment, using specified acetonitrile concentration (30%, 50%, 70%), extraction times (40, 60, 90 min), solid–liquid ratios (1:15, 1:30, 1:45 g/mL), and the numbers of extraction (1, 2, 3 times). On this basis, a four-factor three-level orthogonal experiment L9 (34) was designed (Table 2). The influence of the four factors on the extraction of phenolic compounds from banana peel was as follows: the number of extraction > solid–liquid ratio > extraction time > acetonitrile concentration. The optimal extraction process was as follows: the number of extraction was 3 times, the solid–liquid ratio 1:45 g/mL, extraction time 40 min, and the acetonitrile concentration 30%.

3.4. Method Validation of UPLC-MS/MS Analysis

The developed method was validated by determining the linearity, recovery, accuracy, stability, precision (intra-day precision and inter-day precision), limit of detection (LOD), and limit of quantification (LOQ) as established by the European Union and the Food and Drug Administration [36]. An external standard method was used for quantification.

3.4.1. Linearity Range, Limits of Detection (LOD), and Limits of Quantification (LOQ)

The calibration curves of eight phenolic compounds were constructed by plotting each of the peak-area ratios (y) of targets to IS versus the corresponding concentration (x) of targets at different levels using the weighted (1/x2) least squares linear regression model. The linear range was selected according to the concentrations of real samples. All analytes showed good linear regression in the range from 1 to 1000 μg/L with the correlation coefficients no less than 0.9992. The LOD and LOQ were calculated as the concentration for each analyte with signal/noise ratio (SNR) at 3 and 10, respectively. The LOD and LOQ for 8 analytes were in the range of 0.10–1.00 and 0.30–3.00 μg/L, respectively (Table 3).

3.4.2. Recoveries and Relative Standard Deviations

In the recovery experiment, the working standard solutions were spiked at low, medium, and high concentration levels (50%, 100%, and 150% of the measured amount of each component of the sample) [37] for each compound into the samples separately and then processed and analyzed following the procedure articulated in Section 2.5. The recoveries of all analytes in banana peel varied between 86.5%–94.9% with the relative standard deviations (RSD) lower than 11.0% (data only shown for medium level) (Table 4).

3.4.3. Precision, Repeatability, and Stability

The precision of the method was expressed by intra-day and inter-day RSDs. Intra-day and inter-day precision of the analytical method were measured and assessed by injecting six replicates at low, medium, and high concentrations of the reference compounds on the same day and three consecutive days. The precision was excellent, showing RSD values of intra-day and inter-day variations within 3.7% and 4.1%, respectively. Six samples from the same batch were extracted and analyzed to evaluate the method repeatability. The RSD values of repeatability were lower than 5.5%. The solution stability was analyzed with injecting a sample solution at 0, 2, 4, 8, 12, and 24 h at room temperature. The stability tests showed the analytes were stable enough at room temperature for 24 h (Table 5).
The results indicated the method developed was sensitive, precise, and accurate for simultaneous quantitation of the 8 phenolic compounds in the banana peel samples.

3.5. Determination of Fruit Agronomic Traits of Different Green/Ripe Ecotype Bananas

Among the six agronomic traits (see Section 2.6) of green and ripe banana, Pahang was both significantly lower than the other nine cultivars, p < 0.001 (Tables S1 and S2 in Supplementary Materials). There were significant differences in fruit agronomic characters between green and ripe banana among all cultivars. The fruit agronomic character index provided the data basis for the ample utilization of banana peel resources in the future.

3.6. Determination of the Proportion of Peel and the Moisture Content of Peel in Different Green/Ripe Ecotype Bananas

The proportion of fresh green fruit peel of Pahang was 2–3 times of that of the other nine cultivars (Pahang 93.7 ± 8.6% vs. other nine cultivars 43.0 ± 6.0%). Similarly, Pahang had the highest proportion in ripe fruit peel (Pahang 80.7 ± 7.8% vs. other nine cultivars 38.4 ± 5.6%). The dry matter of ripe fruit peel of Pahang was also the highest (Pahang 28.4 ± 3.7% vs. other nine cultivars 9.3 ± 3.2%). The results showed that the peel proportion and dry matter content of the Pahang was significantly higher than those of other cultivars (Table S3 in Supplementary Materials); therefore, Pahang can be used as a dominant cultivar for resource utilization of pericarp.

3.7. Quantitative Analysis of Main Phenolic Compounds in the Banana Peel

3.7.1. Quantitative Analysis of Main Phenolic Compounds in Green Banana Peel

In the green fruit peel extracts of 10 banana ecotype cultivars, three phenolic compounds were dominant: quinic acid, chlorogenic acid, and rutin. The quinic acid content in green fruit peel of Pahang was the highest, at 177 mg/100 g DW (dry weight is about the dried material). In addition, the chlorogenic acid contents of Pahang and Kazirakwe were similar, and significantly higher than the other cultivars, p < 0.001. Furthermore, the rutin content in Pahang was 4–200 times higher than that in the other nine cultivars. The content of ferulic acid in 10 banana cultivars was in the middle level, and its content in Pahang was the highest, which was significantly higher than the other nine cultivars, p < 0.001. However, among the 10 banana cultivars, the contents of gallic acid, protocatechuic acid, and catechin were very low. Among them, the gallic acid contents of Pahang and Reke No.4 were the highest in the green banana peel, which were significantly higher than that of the other cultivars, p < 0.001. The protocatechuic acid content of Pahang was significantly higher than that of other cultivars, p < 0.001. The catechin content of Pahang was 10 times higher than that of the other nine cultivars (Table 6). Traces of caffeic acid were detected but in very low amounts in green banana peel; therefore, they were not quantified. There are significant differences in the contents of phenolic compounds in the green banana peel, especially Pahang, the green peel of which can be used as a high-quality raw material for extracting phenolic compounds. Furthermore, green banana peels could be exploited in food and pharmaceutical industries for their high contents in phenolic compounds.

3.7.2. Quantitative Analysis of Main Phenolic Compounds in Ripe Banana Peel

Quinic acid and rutin were the most abundant phenolic compounds in the fruit peel of fully ripe banana cultivars. The quinic acid contents in Zhongjiao No.8, Inkira, and Kazirakwe were the highest, but that in Pahang was the lowest, which was about 10 times lower. Among the 10 banana cultivars, Kazirakwe had the highest rutin content, followed by Pahang and Inkira. Additionally, the ferulic acid content in Pahang was the highest, which was significantly higher than the other nine cultivars, p < 0.001. The content of protocatechuic acid in Baodaojiao was the highest, followed by Pahang and Reke No.2. However, among the 10 banana cultivars, the contents of gallic acid, catechin, and chlorogenic acid were very low in ripe banana peel (Table 7). Traces of caffeic acid were detected but in very low amounts in ripe banana peel; therefore, they were not quantified.
Among the green/ripe peel of the banana cultivars selected in our study, quinic acid had the highest concentration ratio among the main phenolic compounds. The above results verified that the type and content of phenolic compounds in banana peel were varied depending on the variety of banana [11,16]. Similarly, research by Bashmil et al., showed that the highest phenolic compound contents were found in the ripe Ducasse peel, unripe Ladyfinger peel, ripe Plantain peel, and unripe Monkey peel, which contained 1.32, 1.15, 0.87, and 0.79 mg GAE/g, respectively [38]. Baskar et al. [39] also found that among the nine local cultivars from Tamil Nadu, India, Poovan cultivar had less total phenolic compound content (0.39 mg catechol equivalent (CE)/g), but higher level of flavonoids (22.83 mg rutin equivalent (RE)/g) in comparison with other cultivars, such as Sevvazhai, Nendran, and Rasthali. Passo Tsamo et al. [40] reported that rutin was dominant in the peel of all plantain cultivars and the dessert cultivar Gros Michel. However, rutin was low in the hybrids (F568) and was even not detected in the dessert cultivar Grand Nain. In addition, kaempferol-3-O-rutinoside was predominant only in the peel of hybrids banana, but not in other cultivars [41].
In our study, the contents of the main phenolic compounds and the composition proportion of each compound in the green/ripe banana peel of each cultivar were different, so the peel of each cultivar had its own characteristics. We should therefore determine the utilization mode suitable for the peel of each cultivar according to our quantitative analysis results of phenolic compounds. Therefore, extracting phenolic compound from fruit peel improves the utilization of banana peel. The banana peel residues used as compost especially as a source of P/K, thus, reduce the pollution of peel waste.

3.7.3. Comparison of Main Phenolic Compound Contents between Green Fruit Peel and Ripe Fruit Peel

Whether in the green fruit peel or ripe fruit peel, the contents of quinic acid and rutin were the highest among the eight phenolic compounds. In the 10 banana cultivars, the quinic acid content of green fruit peel was 3–66 times higher than that of the ripe fruit peel. For rutin, only the Pahang had a significantly higher content in green fruit peel than in its ripe fruit peel, which was about 10 times higher, and yet in other banana cultivars, the content of green fruit peel was equivalent to that in ripe fruit peel. In addition, the chlorogenic acid content in green fruit peel was 10–70 times that in ripe fruit peel among the 10 banana ecotype cultivars. The ferulic acid content in the green fruit peel of Pahang was twice that in the ripe fruit peel. For gallic acid and catechin, their contents in the green banana peel of Pahang were significantly higher than that of ripe banana peel, but there was no significant difference among other cultivars. The maturity of fruit has been reported to significantly affect phenolic compound content of the peel [16,42]. Among all banana cultivars, the total phenolic compound contents of green fruit peel were significantly higher than that of ripe banana peel (Figure 2). It is consistent with the results found by Fatemeh et al., that total phenolic content was found to decrease during the ripening process [42]. Over-ripened peel had 52% less, while ripe peel had 15–45% less phenolic content than that in the green peel [43]. Many individual bioactive compounds such as naringin, rutin, norepinephrine, dopamine, and L-dopa were reduced significantly when the peel changed from green to yellow [44]. Vu et al., also found the peel without ethylene treatment had a relatively higher phenolic content and antioxidant power than those of the peel treated by ethylene at maturity stages 5–7 [45]. Therefore, depending on the purpose of its potential usage, the stage of maturation must be considered when selecting of the peel material: Green banana peel is a better source of phenolic compounds compared to ripe ones, and banana cultivar and maturity can be screened according to the results determined in this study, when extracting phenolic compounds from banana peel resources in the future. These findings will help a more rational utilization of the huge biomass of banana peel in the future.

3.8. Comparison of Phenolic Compound Contents and Fruit Agronomic Traits among the Three Subgroups

In the study, we found that the total phenolic compound content in the green banana peel of the Malaccensis subgroup was significantly higher than that in other subgroups, p < 0.01. In the ripe banana peel, the content of total phenolic compound in Mutika–Lujμgira subgroup was the highest (Figure 2). Furthermore, the total phenolic compound contents in the green/ripe fruit peel of the non-dessert banana were significantly higher than that of dessert banana (green: non-dessert banana 1.48 ± 0.44 mg/g vs. dessert banana 0.97 ± 0.12 mg/g; ripe: non-dessert banana 0.26 ± 0.13 mg/g vs. dessert banana 0.19 ± 0.06 mg/g). In particular, in the Malaccensis subgroup, the total phenolic compound content in its green fruit peel was the highest (2.08 ± 0.04 mg/g) (Table 8), in which the proportion of fruit peel was significantly higher (93.7 ± 8.6%) than the other two subgroups (total mean 43.0 ± 6.0%) and the water content was very low (Table S3 in Supplementary Materials); thus, it was a high-quality source for extracting phenolic compounds from pericarp. However, studies found the dessert bananas (e.g., ‘Ney Poovan’) and cooking bananas (e.g., ‘Tiparot’) had the highest concentrations of phenolic compounds, mainly in ripe fruit (stage 5-yellow with green) [46]. This was mainly due to the differences in cultivar and maturity from our study. The comparison of phenolic compound content and fruit agronomic traits among different subgroups may provide a useful guide for phenolic compound utilization from the banana peel in the future.

4. Conclusions

In conclusion, banana peel contains a substantial number of phenolic compounds and has a high antioxidant potential. The results showed that among the green/ripe peel of the banana cultivars selected in our study, quinic acid had the highest concentration ratio among the main phenolic compounds. Obviously, the content of phenolic compounds in green fruit peel was significantly higher than that in ripe fruit peel. The obtained data can be useful to select banana peel materials with high phenolic compounds for better utilizing as many dietary supplements, food additives, drug formulations, and so on. As an inexpensive source of phenolic compounds, there remains great potential for future studies on the recovery of these compounds and their utilization. In addition, health benefits of banana peel crude extract and their individual compounds, along with its potential applications as natural preservatives or functional food ingredients, requires further in-depth investigation.

Supplementary Materials

The following supporting information can be downloaded at: https://www.mdpi.com/article/10.3390/horticulturae8010070/s1, Table S1: Fruit agronomic traits of different green banana ecotypes; Table S2: Fruit agronomic traits of different ripe banana ecotypes; Table S3: The proportion of green/ripe banana peel and the water content of the peel of 10 banana cultivars.

Author Contributions

Conceived and designed the experiments, S.-J.Z., W.Z. and J.Z. Performed the sampling and carried out the sample preparation, Y.W., B.Y., Y.L. and L.L. Analyzed the data and wrote the paper, J.Z. Revised the manuscript, S.-J.Z. and W.Z. Supervision, S.-J.Z. and W.Z. Project administration, S.-J.Z. and J.Z. Funding acquisition, S.-J.Z. All authors have read and agreed to the published version of the manuscript.

Funding

This work was supported by National Natural Science Foundation of China (NSFC32161143001), Yunling Scholar Programme of Yunnan Provincial Government (YNWR-YLXZ-2018-018).

Data Availability Statement

All the data are available in manuscript file and Supplementary Materials.

Acknowledgments

We are grateful to Junjun Jin, Fan Gao, Chuping Tan, and Junjie Tan for their kind help during implementing field experiments. The authors acknowledge Vincent Johnson of Green Quills and the Alliance of Bioversity International and CIAT for his editorial review.

Conflicts of Interest

The authors declare no conflict of interest.

References

  1. Ahmad, F.; Martawi, N.M.; Poerba, Y.S.; de Jong, H.; Schouten, H.; Kema, G.H.J. Genetic mapping of Fusarium wilt resistance in a wild banana Musa acuminata ssp. malaccensis accession. Theor. Appl. Genet. 2020, 133, 3409–3418. [Google Scholar] [CrossRef] [PubMed]
  2. Kusić, D.; Božič, U.; Monzón, M.; Paz, R.; Bordón, P. Thermal and Mechanical Characterization of Banana Fiber Reinforced Composites for Its Application in Injection Molding. Materials 2020, 13, 3581. [Google Scholar] [CrossRef] [PubMed]
  3. Cordoba, L.d.P.; da Silva, R.G.; Gomes, D.d.S.; Schnitzler, E.; Waszczynskyj, N. Brazilian green banana. J. Therm. Anal. Calorim. 2018, 134, 2065–2073. [Google Scholar] [CrossRef]
  4. FAO. Banana Facts. Rome: Food and Agriculture Organization of the United Nations. 2020. Available online: www.fao.org/economic/est/est-commodities/bananas/bananafacts/en/ (accessed on 15 November 2021).
  5. Al-Sahlany, S.T.G.; Al-musafer, A.M.S. Effect of substitution percentage of banana peels flour in chemical composition, rheological characteristics of wheat flour and the viability of yeast during dough time. J. Saudi Soc. Agric. Sci. 2020, 19, 87–91. [Google Scholar] [CrossRef]
  6. Abu Qdais, H.; Wuensch, C.; Dornack, C.; Nassour, A. The role of solid waste composting in mitigating climate change in Jordan. Waste Manag. Res. 2019, 37, 833–842. [Google Scholar] [CrossRef]
  7. Ahmad, T.; Danish, M. Prospects of banana waste utilization in wastewater treatment: A review. J. Environ. Manag. 2018, 206, 330–348. [Google Scholar] [CrossRef]
  8. Mondal, N.K. Natural Banana (Musa acuminate) Peel: An Unconventional Adsorbent for Removal of Fluoride from Aqueous Solution through Batch Study. Water Conserv. Sci. Eng. 2017, 1, 223–232. [Google Scholar] [CrossRef]
  9. Akpomie, K.G.; Conradie, J. Banana peel as a biosorbent for the decontamination of water pollutants. A review. Environ. Chem. Lett. 2020, 18, 1085–1112. [Google Scholar] [CrossRef]
  10. Wang, Z.; Pu, H.; Shan, S.; Zhang, P.; Li, J.; Song, H.; Xu, X. Melatonin enhanced chilling tolerance and alleviated peel browning of banana fruit under low temperature storage. Postharvest Biol. Technol. 2021, 179, 111571. [Google Scholar] [CrossRef]
  11. Hernández-Carranza, P.; Ávila-Sosa, R.; Guerrero-Beltrán, J.A.; Navarro-Cruz, A.R.; Corona-Jiménez, E.; Ochoa-Velasco, C.E. Optimization of Antioxidant Compounds Extraction from Fruit By-Products: Apple Pomace, Orange and Banana Peel. J. Food Processing Preserv. 2016, 40, 103–115. [Google Scholar] [CrossRef]
  12. Alu’datt, M.H.; Rababah, T.; Alhamad, M.N.; Al-Mahasneh, M.A.; Almajwal, A.; Gammoh, S.; Ereifej, K.; Johargy, A.; Alli, I. A review of phenolic compounds in oil-bearing plants: Distribution, identification and occurrence of phenolic compounds. Food Chem. 2017, 218, 99–106. [Google Scholar] [CrossRef]
  13. Ramírez-Bolaños, S.; Pérez-Jiménez, J.; Díaz, S.; Robaina, L. A potential of banana flower and pseudo-stem as novel ingredients rich in phenolic compounds. Int. J. Food Sci. Technol. 2021, 56, 5601–5608. [Google Scholar] [CrossRef]
  14. Morais, D.R.; Rotta, E.M.; Sargi, S.C.; Schmidt, E.M.; Bonafe, E.G.; Eberlin, M.N.; Sawaya, A.C.H.F.; Visentainer, J.V. Antioxidant activity, phenolics and UPLC–ESI(–)–MS of extracts from different tropical fruits parts and processed peels. Food Res. Int. 2015, 77, 392–399. [Google Scholar] [CrossRef]
  15. Pereira, A.; Maraschin, M. Banana (Musa spp) from peel to pulp: Ethnopharmacology, source of bioactive compounds and its relevance for human health. J. Ethnopharmacol. 2015, 160, 149–163. [Google Scholar] [CrossRef]
  16. Vu, H.T.; Scarlett, C.J.; Vuong, Q.V. Phenolic compounds within banana peel and their potential uses: A review. J. Funct. Foods 2018, 40, 238–248. [Google Scholar] [CrossRef]
  17. Zhang, L.; Li, Y.; Liang, Y.; Liang, K.; Zhang, F.; Xu, T.; Wang, M.; Song, H.; Liu, X.; Lu, B. Determination of phenolic acid profiles by HPLC-MS in vegetables commonly consumed in China. Food Chem. 2019, 276, 538–546. [Google Scholar] [CrossRef]
  18. Pernin, A.; Guillier, L.; Dubois-Brissonnet, F. Inhibitory activity of phenolic acids against Listeria monocytogenes: Deciphering the mechanisms of action using three different models. Food Microbiol. 2019, 80, 18–24. [Google Scholar] [CrossRef]
  19. Rodsamran, P.; Sothornvit, R. Extraction of phenolic compounds from lime peel waste using ultrasonic-assisted and microwave-assisted extractions. Food Biosci. 2019, 28, 66–73. [Google Scholar] [CrossRef]
  20. Hanafy, S.M.; Abd El-Shafea, Y.M.; Saleh, W.D.; Fathy, H.M. Chemical profiling, in vitro antimicrobial and antioxidant activities of pomegranate, orange and banana peel-extracts against pathogenic microorganisms. J. Genet. Eng. Biotechnol. 2021, 19, 80. [Google Scholar] [CrossRef]
  21. De Francesco, G.; Bravi, E.; Sanarica, E.; Marconi, O.; Cappelletti, F.; Perretti, G. Effect of Addition of Different Phenolic-Rich Extracts on Beer Flavour Stability. Foods 2020, 9, 1638. [Google Scholar] [CrossRef]
  22. Marchante, L.; Gómez Alonso, S.; Alañón, M.E.; Pérez-Coello, M.S.; Díaz-Maroto, M.C. Natural extracts from fresh and oven-dried winemaking by-products as valuable source of antioxidant compounds. Food Sci. Nutr. 2018, 6, 1564–1574. [Google Scholar] [CrossRef] [PubMed]
  23. Arauzo, P.J.; Lucian, M.; Du, L.; Olszewski, M.P.; Fiori, L.; Kruse, A. Improving the recovery of phenolic compounds from spent coffee grounds by using hydrothermal delignification coupled with ultrasound assisted extraction. Biomass Bioenergy 2020, 139, 105616. [Google Scholar] [CrossRef]
  24. Panzella, L.; Moccia, F.; Nasti, R.; Marzorati, S.; Verotta, L.; Napolitano, A. Bioactive Phenolic Compounds From Agri-Food Wastes: An Update on Green and Sustainable Extraction Methodologies. Front. Nutr. 2020, 7, 60. [Google Scholar] [CrossRef]
  25. Šeremet, D.; Durgo, K.; Jokić, S.; Huđek, A.; Vojvodić Cebin, A.; Mandura, A.; Jurasović, J.; Komes, D. Valorization of Banana and Red Beetroot Peels: Determination of Basic Macrocomponent Composition, Application of Novel Extraction Methodology and Assessment of Biological Activity In Vitro. Sustainability 2020, 12, 4539. [Google Scholar] [CrossRef]
  26. Barba, F.J.; Zhu, Z.; Koubaa, M.; Sant’Ana, A.S.; Orlien, V. Green alternative methods for the extraction of antioxidant bioactive compounds from winery wastes and by-products: A review. Trends Food Sci. Technol. 2016, 49, 96–109. [Google Scholar] [CrossRef]
  27. Tzima, K.; Brunton, N.P.; Lyng, J.G.; Frontuto, D.; Rai, D.K. The effect of Pulsed Electric Field as a pre-treatment step in Ultrasound Assisted Extraction of phenolic compounds from fresh rosemary and thyme by-products. Innov. Food Sci. Emerg. Technol. 2021, 69, 102644. [Google Scholar] [CrossRef]
  28. Li, J.; Xu, J.; Zhang, R.; Hao, Y.; He, J.; Chen, Y.; Jiao, G.; Abliz, Z. Strategy for Global Profiling and Identification of 2- and 3-Hydroxy Fatty Acids in Plasma by UPLC–MS/MS. Anal. Chem. 2020, 92, 5143–5151. [Google Scholar] [CrossRef] [PubMed]
  29. Zhou, F.; Huang, W.; Li, M.; Zhong, Y.; Wang, M.; Lu, B. Bioaccessibility and Absorption Mechanism of Phenylethanoid Glycosides Using Simulated Digestion/Caco-2 Intestinal Cell Models. J. Agric. Food Chem. 2018, 66, 4630–4637. [Google Scholar] [CrossRef]
  30. Deutsch, E.W.; Perez-Riverol, Y.; Carver, J.; Kawano, S.; Mendoza, L.; Van Den Bossche, T.; Gabriels, R.; Binz, P.-A.; Pullman, B.; Sun, Z.; et al. Universal Spectrum Identifier for mass spectra. Nat. Methods 2021, 18, 768–770. [Google Scholar] [CrossRef]
  31. Fan, L.; Wang, X.; Huang, J.; Gan, C.; Jiang, S.; Yang, X.; Yang, C.; Yao, M. Comparison of the pharmacokinetic profiles of 13 phenolic acids and 6 triterpenes in normal and leukopenia rats after oral administration of Sanguisorba officinalis L. extract by LC-MS/MS. J. Sep. Sci. 2020, 43, 4103–4122. [Google Scholar] [CrossRef]
  32. Wei, J.; Xiao, X.; Li, K.; Song, Y.; Huang, S.-K.; Cai, Z.; Liu, Z. Derivatization strategy for semi-quantitative analysis of medium- and long-chain fatty acids using multiple reaction monitoring. Talanta 2021, 233, 122–464. [Google Scholar] [CrossRef]
  33. Luo, Y.; Wen, Q.; Lai, C.-J.-S.; Feng, Y.; Tan, T. Characterization of polymeric phenolic acids and flavonoids in Clerodendranthi Spicati Herba using ultrahigh-performance liquid chromatography coupled to quadrupole time-of-flight tandem mass spectrometry with target and nontarget data mining strategy. Rapid Commun. Mass Spectrom. 2019, 33, 1884–1893. [Google Scholar] [CrossRef]
  34. Du, B.; Shen, M.; Pan, Z.; Zhu, C.; Luo, D.; Zeng, L. Trace analysis of multiple synthetic phenolic antioxidants in foods by liquid chromatography-tandem mass spectrometry with complementary use of electrospray ionization and atmospheric pressure chemical ionization. Food Chem. 2021, 375, 131663. [Google Scholar] [CrossRef]
  35. Jimenez-Lopez, C.; Pereira, A.G.; Lourenço-Lopes, C.; Garcia-Oliveira, P.; Cassani, L.; Fraga-Corral, M.; Prieto, M.A.; Simal-Gandara, J. Main bioactive phenolic compounds in marine algae and their mechanisms of action supporting potential health benefits. Food Chem. 2021, 341, 128–262. [Google Scholar] [CrossRef]
  36. Mei, S.; Wang, J.; Cheng, Q.; Zhu, L.; Yang, L.; Chen, R.; Zhao, Z. Development, validation, and application of an UPLC-MS/MS method for norvancomycin analysis in human blood plasma. J. Chromatogr. B Analyt. Technol. Biomed. Life Sci. 2018, 1072, 199–204. [Google Scholar] [CrossRef]
  37. Zhou, W.; Wu, H.; Wang, Q.; Zhou, X.; Zhang, Y.; Wu, W.; Wang, Y.; Ren, Z.; Li, H.; Ling, Y.; et al. Simultaneous determination of formononetin, biochanin A and their active metabolites in human breast milk, saliva and urine using salting-out assisted liquid-liquid extraction and ultra high performance liquid chromatography-electrospray ionization tandem mass spectrum. J. Chromatogr. B Analyt. Technol. Biomed. Life Sci. 2020, 1145, 122108. [Google Scholar] [CrossRef]
  38. Bashmil, Y.M.; Ali, A.; Bk, A.; Dunshea, F.R.; Suleria, H.A.R. Screening and Characterization of Phenolic Compounds from Australian Grown Bananas and Their Antioxidant Capacity. Antioxidants 2021, 10, 1521. [Google Scholar] [CrossRef]
  39. Baskar, R.; Shrisakthi, S.; Sathyapriya, B.; Shyampriya, R.; Nithya, R.; Poongodi, P. Antioxidant Potential of Peel Extracts of Banana Varieties (Musa sapientum). Food Nutr. Sci. 2011, 02, 119–126. [Google Scholar]
  40. Passo Tsamo, C.V.; Herent, M.F.; Tomekpe, K.; Happi Emaga, T.; Quetin-Leclercq, J.; Rogez, H.; Larondelle, Y.; Andre, C. Phenolic profiling in the pulp and peel of nine plantain cultivars (Musa sp.). Food Chem. 2015, 167, 197–204. [Google Scholar] [CrossRef]
  41. Oliveira, B.G.; Pimentel, E.F.; Pereira, A.C.H.; Tosato, F.; Pinto, F.E.; Ventura, J.A.; Endringer, D.C.; Romão, W. Phenolic and glycidic profiling of bananas Musa sp associated with maturation stage and cancer chemoprevention activities. Microchem. J. 2020, 153, 104391. [Google Scholar] [CrossRef]
  42. Fatemeh, S.R.; Saifullah, R.; Abbas FM, A.; Azhar, M.E. Total phenolics, flavonoids and antioxidant activity of banana pulp and peel flours: Influence of variety and stage of ripeness. Int. Food Res. J. 2012, 19, 1041–1046. [Google Scholar]
  43. Sundaram, S.; Anjum, S.; Dwivedi, P.; Rai, G.K. Antioxidant activity and protective effect of banana peel against oxidative hemolysis of human erythrocyte at different stages of ripening. Appl. Biochem. Biotechnol. 2011, 164, 1192–1206. [Google Scholar] [CrossRef] [PubMed]
  44. Borges, C.V.; Minatel, I.O.; Amorim, E.P.; Belin, M.A.F.; Gomez-Gomez, H.A.; Correa, C.R.; Lima, G.P.P. Ripening and cooking processes influence the carotenoid content in bananas and plantains (Musa spp.). Food Res Int 2019, 124, 129–136. [Google Scholar] [CrossRef] [PubMed]
  45. Vu, H.T.; Scarlett, C.J.; Vuong, Q.V. Changes of phytochemicals and antioxidant capacity of banana peel during the ripening process; with and without ethylene treatment. Sci. Hortic. 2019, 253, 255–262. [Google Scholar] [CrossRef]
  46. Borges, C.V.; Maraschin, M.; Coelho, D.S.; Leonel, M.; Gomez, H.A.G.; Belin, M.A.F.; Diamante, M.S.; Amorim, E.P.; Gianeti, T.; Castro, G.R.; et al. Nutritional value and antioxidant compounds during the ripening and after domestic cooking of bananas and plantains. Food Res. Int. 2020, 132, 109061. [Google Scholar] [CrossRef]
Figure 1. MRM chromatography of gallic acid (A), quinic acid (B), protocatechuic acid (C), catechin (D), chlorogenic acid (E), caffeic acid (F), ferulic acid (G), and rutin (H) was spiked at 10 ng/mL concentration in methanol solution.
Horticulturae 08 00070 g001
Figure 2. The accumulation histogram of total phenolic compound content in green fruit peel and ripe fruit peel of 10 banana cultivars. Note: Pah: Pahang, Ink: Inkira, Kaz: Kazirakwe, BX: Brazilian, RK2: Reke No. 2, RK4: Reke No. 4, NTH: Nantianhuang, BD: Baodaojiao, ZJ8: Zhongjiao No. 8, YJ1: Yunjiao No. 1; Mark “Ⅰ” stands for Malaccensis subgroup; mark “Ⅱ” stands for Mutika–Lujμgira subgroup; mark “Ⅲ” stands for Cavendish subgroup.
Horticulturae 08 00070 g002
Table 1. The optimized parameters of multiple reaction monitoring (MRM) mode (n = 6) [33].
CompoundsMolecular WeightRetention Time (min)Ionization ModePrecursor IonsProduct IonsDP (V)CE (eV)
Gallic acid170.122.68 ± 0.15[M-H]169.0124.9−20−21
125.0−20−21
Quinic acid192.173.92 ± 0.15[M-H]191.085.0−30−28
93.0−30−27
Protocatechuic acid154.124.03 ± 0.10[M-H]152.9109.0−30−23
108.9−30−18
Catechin290.276.76 ± 0.21[M-H]289.1109.0−30−30
203.1−30−27
Chlorogenic acid354.316.96 ± 0.23[M-H]353.1191.1−30−24
179.0−30−19
Caffeic acid180.157.23 ± 0.20[M-H]179.1135.1−30−21
134.1−20−34
Ferulic acid194.197.78 ± 0.21[M-H]193.0134.0−20−23
178.0−20−16
Rutin610.517.85 ± 0.18[M-H]609.2300.1−30−51
271.1−30−74
Note: Among the product ions, those marked in bold were quantitative ions, and those not marked in bold were qualitative ions.
Table 2. Orthogonal test and measurement results.
Experiment NumberFactorsResults
Acetonitrile Concentration (A)Extraction Time (B)The Numbers of Extraction (C)Solid-Liquid Ratio (D)
111112.34
212223.64
313334.48
421233.83
522314.07
623122.45
731324.38
832132.60
933213.11
K110.4610.557.399.52
K210.3510.3110.5810.47
K310.0910.0412.9310.91
k13.493.522.463.17
k23.453.443.533.49
k33.363.354.313.64
Range0.130.171.850.47
Factor priority orderC > D > B > A
Excellent levelA1B1C3D3
Excellent combinationA1B1C3D3
Note: 1, 2, and 3 in the columns of A, B, C, and D, respectively, represent the acetonitrile concentration (30%, 50%, 70%), extraction time (40, 60, 90 min), and the numbers of extraction (1, 2, 3 times) and the solid–liquid ratio (1:15, 1:30, 1:45 g·mL−1) of each of the four single factor levels.
Table 3. Regression equation, correlation coefficient, linear range, limit of detection (LOD), and limit of quantitation (LOQ) of banana phenolic compounds.
CompoundsLinear EquationCorrelation Coefficients (r2)Dynamic Range (μg/L)LOD (μg/L)LOQ (μg/L)
Gallic acidY = 1.15 × 10⁴x − 2.38 × 1040.99921–2000.82.5
Quinic acidY = 3.57 × 10³x − 3.19 × 1020.99991–10000.83.0
Protocatechuic acidY = 1.46 × 10⁴x − 1.36 × 1040.99931–2000.62.0
CatechinY = 2.57 × 10³x − 6.24 × 1030.99941–2000.83.0
Chlorogenic acidY = 1.31 × 10⁴x − 3.27 × 1040.99991–2000.51.5
Caffeic acidY = 4.03 × 10⁴x + 2.14 × 1050.99981–2000.10.3
Ferulic acidY = 7.71 × 10³x − 4.07 × 1030.99962–2001.03.0
RutinY = 9.04 × 10³x − 2.73 × 1040.99951–5000.51.5
Table 4. Recovery of phenolic compounds in the peel of 10 banana cultivars (n = 6).
CompoundsOriginal Quantity μg/gAdded Scalar Quantity μg/gAverage Recovery/%Standard DeviationRSD/%
Gallic acid2.501.2592.210.111.0
2.50
3.75
Quinic acid100050091.77.98.6
1000
1500
Protocatechuic acid4.002.0094.99.09.4
4.00
6.00
Catechin1.691.0087.55.15.8
2.00
3.00
Chlorogenic acid502586.53.33.8
50
75
Caffeic acid<LOQ////
Ferulic acid3.001.5087.07.58.6
3.00
4.50
Rutin50.0025.0086.77.68.8
50.00
75.00
Table 5. Precision, stability, and repeatability of phenolic compounds in 10 banana cultivars (n = 6).
CompoundsPrecisionsStability (RSD%)Repeatability (RSD%)
Intra-Day (RSD%)Inter-Day (RSD%)
Gallic acid2.83.71.75.5
Quinic acid3.34.12.31.7
Protocatechuic acid2.22.91.51.5
Catechin2.83.21.61.7
Chlorogenic acid3.73.93.00.4
Caffeic acid////
Ferulic acid1.93.91.73.9
Rutin1.23.62.63.7
Table 6. Determination of main phenolic compounds in green fruit peel of 10 banana cultivars (μg/g).
CultivarGallic AcidQuinic AcidProtocatechuic AcidCatechinChlorogenic Acid Ferulic AcidRutinTotal Phenolic Compound Content
Pahang3.92 ± 0.07 b1722.50 ± 35.97 a4.16 ± 0.06 a10.15 ± 0.16 a72.63 ± 1.99 b27.93 ± 0.47 a235.30 ± 6.12 a2076.60 ± 40.49 a
Inkira1.27 ± 0.04 h955.60 ± 5.49 e,f,g0.92 ± 0.02 j0.76 ± 0.11 i55.96 ± 1.01 d1.23 ± 0.36 h14.08 ± 0.42 c1029.82 ± 6.21 e
Kazirakwe1.30 ± 0.16 g,h1195.80 ± 10.73 c1.04 ± 0.02 i1.28 ± 0.09 c, d72.71 ± 1.76 a,b1.49 ± 0.24 f,g,h53.00 ± 1.25 b1326.61 ± 11.29 b
Brazilian2.02 ± 0.11 e907.45 ± 8.58 h2.22 ± 0.03 e0.93 ± 0.08 g,h2.71 ± 0.55 i,j1.51 ± 0.08 e, f,g,h3.87 ± 0.19 g,h,i920.71 ± 8.04 i
Reke No.20.73 ± 0.11 j952.65 ± 5.11 f,g3.86 ± 0.07 b0.64 ± 0.03 j4.23 ± 0.34 h1.16 ± 0.21 i1.09 ± 0.08 j964.34 ± 4.83 f,g,h,i
Reke No.44.01 ± 0.12 a1488.75 ± 40.67 b,c2.25 ± 0.03 d,e1.39 ± 0.09 b16.81 ± 0.15 e,f1.57 ± 0.14 d,e,f,g,h,i,j3.15 ± 0.08 h,i1218.15 ± 40.60 c
Nantianhuang2.03 ± 0.09 d,e939.85 ± 16.43 g1.91 ± 0.01 f1.22 ± 0.08 d5.24 ± 0.04 g,h2.60 ± 0.08 b6.60 ± 0.25 d,e,f959.45 ± 16.49 g,h,i
Baodaojiao2.75 ± 0.09 c1026.85 ± 33.35 d2.69 ± 0.06 c1.01 ± 0.07 e,f,g2.58 ± 0.41 j1.49 ± 0.11 g2.80 ± 0.10 i1040.17 ± 33.34 d,e
Zhongjiao No.81.54 ± 0.12 f852.15 ± 3.29 i1.36 ± 0.03 h0.87 ± 0.05 h59.95 ± 1.12 c1.15 ± 0.39 j5.84 ± 0.12 e,f922.86 ± 4.18 h,i
Yunjiao No.11.00 ± 0.07 i768.95 ± 29.74 j1.76 ± 0.05 g0.93 ± 0.04 f,g,h16.41 ± 0.87 f1.80 ± 0.08 c,e4.54 ± 0.18 f,g,h,i795.39 ± 28.94 j
Statistical note: Means (n = 3) within a column followed by different letters are significantly different at p < 0.05 according to the Tukey’s honestly significant difference (HSD) multiple range test. Means with superscripts having the same letter are not significantly different.
Table 7. Determination of main phenolic compounds in ripe fruit peel of 10 banana cultivars (μg/g).
CultivarGallic AcidQuinic AcidProtocatechuic AcidCatechinChlorogenic AcidFerulic AcidRutinTotal Phenolic Compound Content
Pahang0.40 ± 0.02 i,j26.93 ± 0.43 j5.47 ± 0.07 b0.92 ± 0.14 d,e,f,g1.14 ± 0.00 b,c14.27 ± 0.50 a21.97 ± 0.73 c71.10 ± 0.97 j
Inkira0.71 ± 0.02 g290.05 ± 0.60 b2.10 ± 0.04 f1.02 ± 0.12 b,c,d1.04 ± 0.02 c2.49 ± 0.41 b37.47 ± 0.61 b334.88 ± 0.60 b,c
Kazirakwe0.53 ± 0.06 h279.20 ± 4.07 c1.33 ± 0.03 j0.94 ± 0.16 c,d,e,f,g0.81 ± 0.01 d1.49 ± 0.21 f,g,h,i 76.75 ± 2.32 a361.05 ± 5.02 a
Brazilian0.73 ± 0.04 f, g162.60 ± 4.98 g1.87 ± 0.03 g0.71 ± 0.15 i,j0.52 ± 0.00 f,g,h,i,j1.39 ± 0.16 h,i2.10 ± 0.11 h,i169.91 ± 5.02 g
Reke No.21.80 ± 0.03 b124.59 ± 0.25 i4.59 ± 0.06 c0.82 ± 0.14 e,f,g,h,i,j0.45 ± 0.01 i,j1.53 ± 0.19 e,f,g,h,i3.09 ± 0.22 f,g,h136.87 ± 0.34 i
Reke No.40.98 ± 0.04 e167.25 ± 4.24 f1.75 ± 0.02 h0.70 ± 0.12 j0.48 ± 0.01 g,h,i,j0.92 ± 0.17 j0.92 ± 0.10 j173.00 ± 4.17 f,g
Nantianhuang0.39 ± 0.05 j177.30 ± 1.49 e 1.65 ± 0.04 i0.72 ± 0.13 h,i,j0.47 ± 0.00 h,i,j1.55 ± 0.14 d,e,f,g,h,i1.91 ± 0.14 i,j183.99 ± 1.50 e,f
Baodaojiao2.88 ± 0.08 a209.05 ± 6.00 d12.25 ± 0.17 a0.78 ± 0.15 g,h,i,j0.42 ± 0.01 j1.46 ± 0.17 g,h,i2.27 ± 0.11 g,h,i229.11 ± 5.93 d
Zhongjiao No.81.13 ± 0.06 c315.23 ± 4.07 a2.41 ± 0.06 e1.69 ± 0.06 a2.95 ± 0.48 a1.34 ± 0.02 i6.56 ± 0.21 d331.29 ± 4.39 c
Yunjiao No.11.04 ± 0.05 d,e129.50 ± 0.99 h2.58 ± 0.04 d0.78 ± 0.14 f,g,h,i,j0.53 ± 0.01 e,f,g,h,i,j1.78 ± 0.22 c,d,e,f,g4.41 ± 0.19 e140.62 ± 1.08 h,i
Statistical note: Means (n = 3) within a column followed by different letters are significantly different at p < 0.05 according to the Tukey’s honestly significant difference (HSD) multiple range test. Means with superscripts having the same letter are not significantly different.
Table 8. Comparison of the total phenolic compound content in three banana subgroups with different maturity.
ClassificationSubgroupsGreen Banana PeelRipe Banana Peel
Total Phenolic Compound Content μg/gTotal Phenolic Compound Content μg/g
Non-dessert bananaMalaccensis2076.60 ± 40.4971.10 ± 0.97
Mutika–Lujμgira1178.21 ± 148.68347.97 ± 13.56
Dessert bananaCavendish974.44 ± 122.84194.97 ± 62.58
Publisher’s Note: MDPI stays neutral with regard to jurisdictional claims in published maps and institutional affiliations.

