Abstract
Salinity is one of the major problems facing crops worldwide. Salinity can severely affect plants in a negative manner. This study aimed to evaluate the impact of NaCl on morpho–physiological, biochemical, structural and ultrastructural properties in Solanum melongena seedlings under different NaCl concentrations. Plants treated with high concentrations of NaCl showed a nonsignificant decrease in shoot height compared to the controls. However, NaCl concentration of 50 mM and above significantly decreased leaf area, while 75 mM and above significantly reduced the photosynthetic rate (PN) and leaf total sugar content when compared with plants treated with less-concentrated NaCl and the controls. Thick root sections from plants grown in 100 and 150 mM NaCl exhibit severe deformation in the epidermal and cortical layers. Additionally, TEM micrographs of plants treated with 75, 100, and 150 mM exhibited bulgy chloroplasts with loss of integrity thylakoid membranes associated with large starch grains. The changes in plant ultrastructure observed in this study broaden our knowledge about the impact of salinity at the cellular level.
1. Introduction
Salinity is one of the major problems facing crops worldwide. About 40,000 hectare of agricultural production of land every year becomes inaccessible because of salinization throughout the world [1]. Salinity imparts both ionic and osmotic stresses, thus leading to growth inhibition, leaf chlorosis, chloroplasts deformation, and photoinhibition [2,3]. Shahbaz et al. (2012) reported that the decline in plant growth under salinity stress is usually caused by a variety of biochemical, molecular, and physiological characteristics [4]. In addition, Queiroz et al. (2013) reported that applying nutrient solutions with salinity levels between 0.5 to 6.0 dS m−1 in eggplant cultivars did not show any significant impact on plant growth [5]. In contrast, saline medium exhibits an adverse impact on plant growth due to osmotic and salt stress, leading to nutritional imbalances [6]. In saline medium, osmotic balance is vital for plant growth, and any imbalance leads to cell dehydration, loss of turgidity, ion toxicity, and consequently plant death [7]. In addition, crops grown in saline soils characterized by poor physical conditions suffer from nutritional disorders due to severe osmotic stress resulting in decreased crop yield [8]. Moreover, Abbaspour (2012) observed that pistachio seedlings under saline conditions had a major reduction in lipid peroxidation and glutathione reductase activity [9]. In contrast, antioxidant enzymes and levels of free proline in the cells were remarkably increased (i.e., super oxide dismutase (SOD), catalase (CAT)) to cope with salt stress. In saline soils, water is osmotically held in salt solution, making it less available to the plant. Ion imbalances due to salinity stress also have been reported in plants such as eggplants where a significant reduction in the K+/Na+ ratio was observed in seedling leaves [10]. In lettuce, significant reduction in seed germination rate and delayed germination was reported by Nasri et al. (2011), observed in growth medium containing 100 mM NaCl [11]. A similar observation was made in tomatoes where seed germination was reduced when treated with 80 mM NaCl and drastically declined at 190 mM NaCl [12].
To cope with salinity stress, Plants develop various adaptive physiological and biochemical mechanisms against salt-induced stress [2]. For example, K+ and Na+ homeostasis is very crucial under salt stress in glycophytic crops for improving salinity tolerance ability [13]. Moreover, plants accumulate solutes such as soluble sugars, amino acids, proteins, and other compounds to ensure ionic balance in the vacuole, a process known as osmotic adjustment [14]. These osmolytes are stress protectors, and their accumulation in plants experiencing salinity stress is an adaptive mechanism protecting plants from stress damage by maintaining cell turgor [15,16]. Global climate change is affecting plant growth and crop productivity by increasing atmospheric CO2 concentration and soil salinization [17]. Moreover, an increased CO2 and saline stress might affect major physiological processes such as gas exchange and water relations [18,19].
Eggplant (Solanum melongena L.) is a vegetable crop with an annual cycle in the Mediterranean region. It belongs to the Solanaceae family, with its center of origin traced to the tropical regions of the East [20]. The area under eggplant production has increased mainly because of its claimed medicinal properties such as the potential to reduce cholesterol levels and as a source of important minerals and vitamins [21]. They require considerable amount of water for their growth and development. Eggplant responses to salt stress vary from species to species or even cultivar to cultivar within the same species. In general, eggplants are widely reported to be moderately sensitive to salinity [22]. The impact of salt stress on plants is well studied in many species, including eggplants (Solanum melongena). However, little is known about its impact on the physiological, biochemical and cellular structures. Therefore, the aim of our study was to determine the impact of salinity stress on the physiological, biochemical, structural and ultrastructural properties in eggplants, and how growth and development are affected in the seedlings at different levels of salinity stress. This was achieved by growing seeds of the eggplant cultivar Black Beauty in a hydroponic medium containing varying concentrations of NaCl. Our results show that higher concentrations of NaCl above 50 mM negatively impacted plant growth and development.
2. Materials and Methods
2.1. Plant Materials and Experimental Design
Eggplant seeds were surface-sterilized prior to planting in the soil where they were grown for 5 weeks. After 5 weeks, seedlings were transferred to the Hoagland’s solution (a complete nutrient medium) and grown hydroponically in a growth chamber as described by Alkhatib et al. (2018) [23]. Seedlings were allowed to acclimatize in the Hoagland’s solution for 3 days before assigning them to treatments. Seedlings were assigned to six levels of NaCl concentration (0, 25, 50, 75, 100, and 150 mM), which was mixed in the Hoagland’s solution. Plants phenotyped 2 weeks post treatment. Four independent experiments were conducted, and in each experiment three replicates were used per treatment.
2.2. Phenotyping
Morphology of shoot and root systems: After 2 weeks of treatment, seedling roots were detached from the shoots. Shoot height, root length and leaf area were measured from all plants under different treatments. Leaf area was measured using Licor leaf area meter (Licor 3100, LI-COR Biosciences, Lincoln, NE, USA).
Photosynthetic activity: Two fully expanded mature leaves were sampled from each plant and used to measure the net photosynthetic rate (PN), stomatal conductance (gs) and the transpiration rate (E). Leaves were measured at 6.25 cm2 leaf area using an infrared gas analyzer (CI-340, CID Bio-Science Inc., Camas, WA, USA). All measurements were taken at PPFD of 1300 μmol(quanta) m−2 s−1 following the procedure described by Alkhatib et al. (2018) [23].
Total sugar content: The sugar content in the leaves of seedlings was determined using the anthrone method [24,25]. In brief, 100 mg of leaf tissue was ground in liquid nitrogen. The leaf powder was homogenized in 5 mL of 80% (v/v) ethanol, and centrifuged at 1500 rpm for 10 min. The supernatant was transferred in a clean tube, and 4 mL of a freshly prepared 0.2% (m/v) anthrone solution [0.2109 g of anthrone dissolved in 100 mL of chilled 75% H2SO4 (m/m)] was added. A spectrophotometer (UVM51 110 UV-VIS, BEL, BEL Engineering, Monza, Italy) calibrated with standard solutions of D-glucose was used to measure the absorbance of the samples at 630 nm.
Protein content: Protein content in leaf samples was measured following the protocol of the Bradford method [26]. Briefly, 1 g of ground leaf tissue sample was mixed with 3 mL of phosphate buffered saline (PBS) at PH 7.4 and incubated overnight at 4 °C. Sample tubes were centrifuged at 5000 rpm (1118× g) for 10 min at 4 °C. From each sample, 20 μL aliquot of the supernatant was transferred to a 2 mL Eppendorf tube followed by 980 μL of PBS and 1 mL of Coomassie Brilliant Blue G-250. The absorbance of the solution was measured at 595 nm. Bovine serum albumin (BSA) was used as a standard.
Microscopic analysis: Tissue samples were prepared for microscopy analyses following the protocol described by Alkhatib et al. (2019) [27]. Briefly, samples (1 × 1 cm) of the central leaf blade next to the main vein were excised and fixed with 2.5% glutaraldehyde, post-fixed in 1% osmium tetroxide, dehydrated in a graded series of ethanol and embedded in freshly prepared Araldite resin (EMS, PA, USA). Two experiments were conducted with three replicates per treatment. Thick sections were made from embedded leaf and root samples, stained using 1% toluidine blue (Epoxy Tissue Stain, EMS, Hatfield, PA, USA) and viewed under a light microscope. To visualize the ultrastructures, thin sections from embedded leaf and root tissues were cut and stained with uranyl acetate [28], followed by lead citrate [29]. The stained microtome sections were analyzed using a transmission electron microscopy (TEM) running at 80Kv (MORGAGNI 268) that was equipped with a digital camera (Mega view III soft imaging system) for image capture.
2.3. Data Analysis
All statistical analyses for morphological, physiological, and biochemical parameters were conducted using PC SAS (v. 9.2; SAS Institute, Cary, NC, USA). Analysis of variance (ANOVA) and Dunnett’s test at α = 0.05 were used for data analysis. Graphs were made using Graph pad Prism 7.
3. Results
3.1. Morphological and Physiological Characteristics
The physical appearance of shoots from seedlings grown in 25 and 50 mM NaCl containing medium was the same as the control plants (Figure 1A–F). In contrast, seedlings grown in 75, 100 and 150 mM NaCl showed a severe reduction in shoot height compared to control plants, and the reduction was more pronounced as the concentration of NaCl increased. However, the physical appearance of seedling roots from all NaCl concentrations did not differ from the control treatment except at 150 mM NaCl where a change in root branching pattern was observed (Figure 1a–f). Severe chlorosis and necrosis were observed on the leaves of plants grown in 100 and 150 mM NaCl (Figure 1E,F).
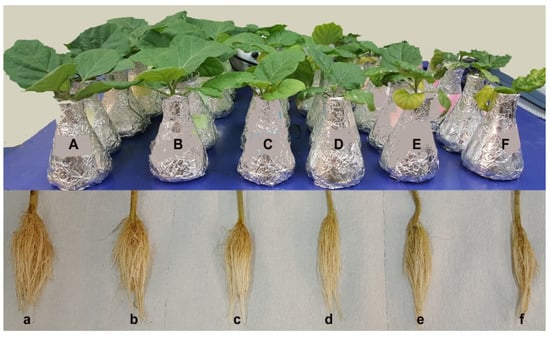
Figure 1.
Effect of NaCl on Solanum melongena growth. (A–F) Shoot growth [from left to right; (A) control, 25 (B), 50 (C), 75 (D), 100 (E), and 150 (F) mM NaCl]. (a–f) Root growth [from left to right; (a) control, 25 (b), 50 (c), 75 (d), 100 (e), and 150 (f) mM NaCl].
The effect of NaCl concentration on shoot height and root length was not statistically significant across all treatments (Figure 2A,B). However, the leaf area of seedlings grown in 50, 75, 100 and 150 mM 165 was significantly reduced compared to the leaves from the control seedlings (p < 0.0001) (Figure 2C). Moreover, the photosynthetic efficiency (PSII) significantly decreased in seedlings grown in 150 mM relative to the control plants (p < 0.0001) (Figure 2D).
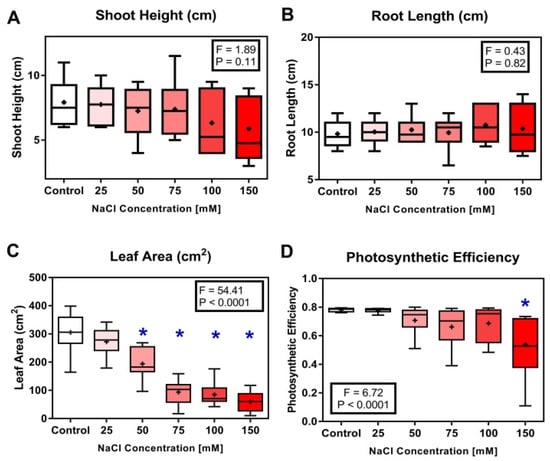
Figure 2.
Side-by-side boxplots of changes in morphological parameters in Solanum melongena (A) Shoot height, (B) root length, (C) leaf area, and (D) photosynthetic efficiency in response to each of five NaCl concentrations. p-values at α = 0.05. * indicates values significantly different from the control (Dunnett’s test with p < 0.05).
A negative linear relationship was observed between photosynthetic rate (PN) and NaCl concentration. Significant decrease in PN was observed in seedlings grown in 75, 100 and 150 mM NaCl as compared to control seedlings (p < 0.0001) (Figure 3A). For plants grown in 25 and 50 mM NaCl, PN was not significantly different from the control plants (Figure 3A). We did not observe any significant differences between the controls and NaCl-treated seedlings for stomatal conductance (gs) (p = 0.7) and transpiration rate (E), (p = 0.11) at 95% confidence level (Figure 3B,C, respectively).
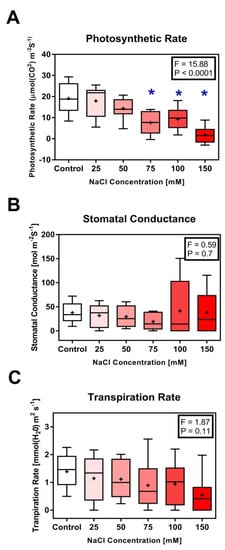
Figure 3.
Side-by-side boxplots of changes in photosynthetic parameters in Solanum melongena. (A) Photosynthesis rate (PN) [µmol m−2 s−1], (B) stomatal conductance (gs) [mol H2Om−2 s−1]; (C) transpiration rate (E) [mmol H2O m−2 s−1]; in response to each of five NaCl concentrations. p-values at α = 0.05. * indicates values significantly different from the control (Dunnett’s test with p < 0.05).
3.2. Biochemical Characteristics
An increase in leaf total sugar content was observed in eggplant seedlings from all treatments (Figure 4A). Low levels of NaCl concentration (25 and 50 mM) had less impact on leaf total sugar content, while at 75 mM and above a significant increase in the total sugar content was observed (p < 0.001). In contrast, changes in NaCl concentration in the growth medium did not have a significant impact on the protein content in the leaves of eggplant seedlings (Figure 4B).
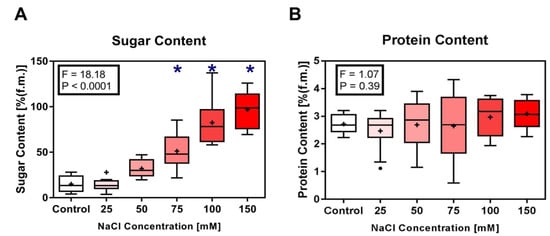
Figure 4.
Side-by-side boxplots of changes in biochemical parameters in Solanum melongena. (A) sugar content, (B) protein content in response to each of five NaCl concentrations. p-values at α = 0.05. * indicates values significantly different from the control (Dunnett’s test with p < 0.05).
3.3. Microscopic Analysis
The structural and ultrastructural characterization of root and leaf sections was done using the light and transmission electron microscopes. Images from thick sections of root samples observed under a light microscope revealed a well-arranged epidermis and intact multilayer cortical cells irrespective of the NaCl treatment (Figure 5A,C,E,G,I). However, the epidermal cells from root samples of plants grown in 150 mM NaCl were severely damaged and had fewer cortical layers. The TEM micrographs did not reveal any differences in the ultrastructure of root cells from plants treated with different concentrations of NaCl (Figure 5B,D,F,H,J,L).
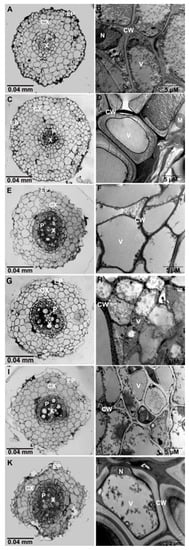
Figure 5.
Thick and thin root sections of Solanum melongena control and NaCl-treated plants. Light microscopy micrographs of control plant (A); NaCl-treated plants with 25–100 mM (C,E,G,I) did not show any visible deformation. 150 mM NaCl-treated plants (K) exhibit deformed epidermal and cortical cells and major disruption in the organization of the vascular bundles [xylem and phloem].TEM micrographs of control (B) and NaCl-treated plants (D,F,H,J,L) showed no deformation. Nucleus (N), Cell wall (CW), epidermal cells (EP), cortical cells (CX), phloem (P), xylem (X).
The images from thick sections of leaf samples of plants treated with varying NaCl concentrations (25, 50, 75, 100, and 150 mM) showed a normal-shaped epidermis, regular palisade and spongy layers (Figure 6A,C,E,G,I,K). However, at 150 mM NaCl, leaves exhibited compact spongy cells (Figure 5K). The TEM micrographs of leaves from the control and NaCl treated plants (25 and 50) exhibited intact thylakoid membranes with a normal chloroplast shape (elliptical) (Figure 6B,D,F). At 75 mM and above NaCl concentration, leaves had deform-shaped chloroplasts and thylakoid membranes (Figure 6H,J,L). We also observed an increase in starch granules inside the chloroplasts.
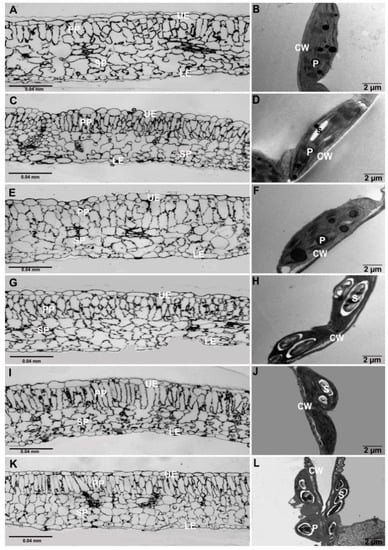
Figure 6.
Thick and thin leaf sections of Solanum melongena. Light microscopy micrographs of control plants (A); NaCl-treated plants (C,E,G,I,K) did not show any visible deformation with intact upper and lower epidermis, palisade, and spongy layers. NaCl-treated plants 75–150 mM (H,J,L) exhibiting large amounts of starch grains. Micrograph images of 150 mM NaCl-treated plants (L) showed deformed thylakoid membranes associated with large starch grains. Cell wall (CW), upper epidermis (UE), palisade parenchyma layer (PP), spongy parenchyma layer (SP), plastoglobule (P), lower epidermis (LE), starch (S).
4. Discussion
Crops all over the world have a substantial decline of yields due to the increment of salinity. In most plants, the threshold value is about 40 mM NaCl in sand cultures or hydroponics [30]. Our data revealed that the loss in seedlings growth under salinity stress is usually correlated with a variety of physiological, biochemical, and ultrastructural factors. NaCl-treated plants (75, 100 and 150 mM) showed a reduction in shoot heights compared to control plants (Figure 1), even though these reductions were not significant (Figure 2A). On the root level, our data showed no effect in root lengths in all NaCl concentrations as compared with control (Figure 2B), and their physical appearance was the same (Figure 1). However, the branching pattern was adversely affected in 150 mM NaCl-treated plants (Figure 1). This suggests that high concentrations of Na+ or Cl− ions in the shoot system inhibits cell division and the photosynthetic rate mainly. Moreover, wheat plants under salt stress exhibit a decrease in shoot total dry weight, plant heights, Na+ content and Na+/K+ rate (200 mM NaCl) as compared to control wheat plants [31].
At the physiological level, our data showed no significant effect in the net photosynthetic rate in the leaves of seedlings treated with 25 and 50 mM NaCl compared to the controls. In contrast, a significant reduction in photosynthetic rate for plants grown in 75, 100, and 150 mM NaCl was observed (Figure 3A). Wen-Yuan et al. (2012) showed that plant growth is affected by salinity when plant physiological processes such as photosynthesis and transpiration are altered [32]. In addition, Zuo et al. (2021) reported that salt stress in wheat significantly reduced the concentrations of Chl a, Chl b and total chlorophylls, compared with the non-stress control and increased the Na+ concentration while decreasing the K+ concentration in leaves reducing the photosynthetic activity (PN) [33]. Moreover, under saline conditions, a reduction in water uptake by plants occurs, causing the closure of leaf stomata, which negatively affects photosynthesis, resulting in reduced plant growth [34,35]. Shaheen et al. (2013) also showed that the photosynthetic rate and stomatal conductance were significantly reduced in eggplant seedlings under salt stress [36]. This suggests differences in tolerance mechanisms used by different cultivars towards salinity stress (i.e., Black Beauty vs. New Noble). Surprisingly, our data showed no significant drop in both gs and E (Figure 3B,C, respectively). This suggests that stomatal opening and/or closure is not the key regulating factor in plant growth reduction [27].
Furthermore, the leaf area and photosynthetic efficiency were evidently affected by salinity stress. A significant decrease in leaf area was more pronounced in plants grown in 50, 75, 100, and 150 mM NaCl (Figure 2C,D). Netondo et al. (2004) reported that salt stress reduces leaf area, chlorophyll content and stomatal conductance, thereby affecting photosynthesis and most likely the photosystem II efficiency (PSII) [37]. Moreover, Faseela et al. (2019) reported that the maximum quantum yield of electron transport and the electron transport from PSII side to the PSII reaction center was highly reduced under salinity stress in rice seedlings [38]. Thus, a reduction in CO2 intake and Calvin cycle efficiency, caused by salinity stress, likely leads to a reduction in chlorophyll content [39], causing an overall reduction in the net photosynthetic rate [40] and an increase in shoot Na+/K+ ratio that inhibits photosynthesis [41]. Ibrahimova et al. (2021) reported that the Na+/K+ ratio increased significantly in all five Triticum aestivum L. genotypes exposed to salinity stress (150 mM NaCl) inhibiting the photosynthetic efficiency [42].
The accumulation of different osmolytes in plants can be achieved by several stress-response signaling pathways such as salt overly sensitive (SOS) pathway and abscisic acid (ABA) signaling, and reactive oxygen species (ROS) signaling [42]. The accumulation of these osmolytes inside the plant cells increases the cellular osmolarity, which provides the turgidity needed for cell expansion [43]. In this study, a significant increase in leaf total sugar content from plants grown in 75, 100, and 150 mM NaCl was observed (Figure 4A). These results suggests that the sugar accumulation in leaves under salt stress could be a limiting factor for growth and might reduce the translocation of photosynthetic-assimilates to the actively growing sink part [44]. In addition, the expression of Rubisco could be repressed due to the considerable accumulation of sugars in the cytoplasm [45].
Even though the most common physio–biochemical attributes affected by salinity stress in different plants is protein synthesis [46], our data showed no significant changes in protein content in all NaCl concentrations as compared to control (Figure 4B). Wimmer et al. (2003) reported that plant stresses induced intercellular protein synthesis because of the structural changes in the cell wall [47]. Moreover, it has been reported that in all cultivars tested, the total soluble proteins increased due to the salt stress but it was more pronounced in salt-sensitive cultivars, suggesting that some genes change their expression under various salt concentrations [16,48].
In general, salt or water stress in plants exhibits vacuolation in the root cells to accumulate osmotically active substances that help in osmotic adjustment [49]. In this study, the root structural and ultrastructural characteristics in NaCl-treated seedlings (25, 50, 75 and 100 mM) were similar to the controls. However, the images from a light microscope for samples from seedlings grown in 150 mM NaCl showed deformation in the epidermis, cortex and stele structure (Figure 5K), suggesting that 150 mM NaCl is highly toxic and negatively affects the root system. On the other hand, TEM micrographs in all NaCl-treated seedlings showed no abnormalities in their ultrastructural characteristics as compared to controls. The light microscopy images of thick leaf sections from plants treated with NaCl showed no abnormalities in epidermal cells, palisade, spongy layers and vascular tissue in comparison to the controls (Figure 6A,C,E,G,I,K). However, thin-sectioned TEM micrographs exhibit deformed bulgy chloroplasts with numerous large starch granules in leaves from seedling grown in 75, 100, 150 mM NaCl (Figure 6H,J,L). These results suggest that the toxicity threshold of NaCl was 75 mM NaCl and any further increase in concentration severely retarded growth in the seedlings [50]. Fu et al. (2013) reported that the number of chloroplasts per cell was reduced in salt-stressed eggplant, and the chloroplasts became round in shape with more damaged structure of the cell membranes [34]. Moreover, the number of plastoglobuli increased, suggesting a function storage of thylakoid components such as lipids, plastohydroquinone, and tocopherols [51]. However, Oi et al. (2020) reported that the 3D reconstructed models of whole rice chloroplasts under salt-stress conditions were not swollen but became spherical without increasing their volume as compared to controls [52].
5. Conclusions
In this study, we have demonstrated that growth and development in eggplants are much more disrupted when plants are grown in a medium containing very high concentrations of NaCl. The effect of salinity stress due to NaCl was more pronounced on the shoot system than the root system. Among the physiological properties studied, photosynthetic rate was the main limiting factor in plant growth under salinity stress. However, new evaluation and prediction techniques of stress impact on plants by deep learning and molecular approaches will give additional agricultural solutions to prevent the risk of yield losses through abiotic or biotic stresses.
Author Contributions
R.A.: study design, result interpretation, writing and revising the manuscript. N.A.: methodology assistance, data analysis, and result discussion. M.M.: performing the experimental work, data collection. All authors have read and agreed to the published version of the manuscript.
Funding
This research was financially supported by the Deanship of Research, Jordan University of Science and Technology, Jordan, grant number [390/2017].
Institutional Review Board Statement
Not applicable.
Informed Consent Statement
Not applicable.
Acknowledgments
The authors would like to thank Duaa Qattan and Kholoud Friehat for using the TEM facility. Faculty of Medicine, The University of Jordan, Amman, Jordan.
Conflicts of Interest
The authors declare no conflict of interest.
References
- Unlukara, A.; Kurunc, A.; Semiz, D.G.; Yurtseven, E.; Suarez, L.D. Effects of salinity on eggplant (Solanum melongena L.) growth and evapotranspiration. Irrig. Drain. 2010, 59, 203–214. [Google Scholar]
- Acosta-Motos, J.R.; Ortuño, M.F.; Bernal-Vicente, A.; Diaz-Vivancos, P.; Sanchez-Blanco, M.J.; Hernandez, J.A. Plant responses to salt stress: Adaptive mechanisms. Agronomy 2017, 7, 18. [Google Scholar] [CrossRef]
- Dąbrowski, P.; Kalaji, M.H.; Baczewska, A.H.; Pawluśkiewicz, B.; Mastalerczuk, G.; Borawska-Jarmułowicz, B.; Paunov, M.; Goltsev, V. Delayed chlorophyll a fluorescence, MR 820, and gas exchange changes in perennial ryegrass under salt stress. J. Lumin. 2017, 183, 322–333. [Google Scholar] [CrossRef]
- Shahbaz, M.; Ashraf, M.; Al-Qurainy, F.; Harris, P.J.C. Salt tolerance in selected vegetable crops. Crit. Rev. Plant Sci. 2012, 31, 303–320. [Google Scholar] [CrossRef]
- Queiroz, I.S.R.; Leitão, A.R.F.; Ferreira, L.L.; Dias, N.S.; Cosme, C.R.; Mota, A.F. Tolerance of the eggplant salinity cultivated in coconut fiber substrate. Agropecuária Científica No Semi-Árido 2013, 9, 15–20. [Google Scholar]
- Ashraf, M. Some important physiological selection criteria for salt tolerance in plants. Flora 2004, 199, 361–376. [Google Scholar] [CrossRef]
- She, D.; Sun, X.; Gamareldawla, A.H.D.; Nazar, E.A.; Hu, W.; Edith, K.; Yu, S. Benefits of soil biochar amendments to tomato growth under saline water irrigation. Sci. Rep. 2018, 8, 14743. [Google Scholar] [CrossRef] [PubMed]
- Shrivastava, P.; Kumar, R. Soil salinity: A serious environmental issue and plant growth promoting bacteria as one of the tools for its alleviation. Saudi. J. Biol. Sci. 2014, 22, 123–131. [Google Scholar] [CrossRef] [PubMed]
- Abbaspour, H. Effect of salt stress on lipid peroxidation, antioxidative enzymes, and proline accumulation in pistachio plants. J. Med. Plants Res. 2012, 6, 526–529. [Google Scholar]
- Akinci, E.I.; Akinci, S.; Yilmaz, K.; Dikici, H. Response of eggplant varieties (Solanum melongena) to salinity in germination and seedling stages. New Zealand J. Crop Hortic. Sci. 2004, 32, 193–200. [Google Scholar] [CrossRef]
- Nasri, N.; Kaddour, R.; Rebhi, M.; Plassard, C.; Lachal, M. Effect of salinity on germination, phytase activity and phytate content in lettuce seedling. Acta Physiol. Plant. 2011, 33, 935–994. [Google Scholar] [CrossRef]
- Cuatero, J.; Fernandez-Munoz, R. Tomato and salinity. Sci. Hortic. 1999, 78, 83–125. [Google Scholar] [CrossRef]
- Mishra, S.; Kumar, S.; Saha, B.; Awasthi, J.; Dey, M.; Panda, S.K.; Sahoo, L. Crosstalk between salt, drought, and cold stress in plants:toward genetic engineering for stress tolerance. In Abiotic Stress Response in Plants: Tuteja/Abiotic Stress Response in Plants; Wiley-VCH Verlag GmbH & Co. KGaA: Weinheim, Germany, 2016; pp. 55–86. [Google Scholar]
- Turkan, I.; Demiral, T. Recent developments in understanding salinity tolerance. Environ. Exp. Bot. 2009, 67, 2–9. [Google Scholar] [CrossRef]
- Hannachi, S.; Labeke, M.V. Salt stress affects germination, seedling growth and physiological responses differentially in eggplant cultivars (Solanum melongena L.). Sci. Hortic. 2018, 228, 56–65. [Google Scholar] [CrossRef]
- Soltabayeva, A.; Ongaltay, A.; Omondi, J.O.; Srivastava, S. Morphological, Physiological and Molecular Markers for Salt-Stressed Plants. Plants 2021, 10, 243. [Google Scholar] [CrossRef]
- Zhu, X.; Cao, Q.; Sun, L.; Yang, X.; Yang, W.; Zhang, H. Stomatal conductance and morphology of arbuscular mycorrhizal wheat plants response to elevated CO2 and NaCl stress. Front. Plant Sci. 2018, 9, 1363. [Google Scholar] [CrossRef] [PubMed]
- Eller, F.; Lambertini, C.; Nguyen, L.X.; Brix, H. Increased invasive potential of non-native Phragmites australis: Elevated CO2 and temperature alleviate salinity effects on photosynthesis and growth. Glob. Chang. Biol. 2014, 20, 531–543. [Google Scholar] [CrossRef] [PubMed]
- Yu, J.J.; Sun, L.H.; Fan, N.L.; Yang, Z.M.; Huang, B.R. Physiological factors involved in positive effects of elevated carbon dioxide concentration on Bermuda grass tolerance to salinity stress. Environ. Exp. Bot. 2015, 115, 20–27. [Google Scholar] [CrossRef]
- Oliveira, F.S.; Sá, F.V.S.; Souto, L.S.; Paiva, E.P.; Oliveira, F.A.; Araújo, E.B.G.; Neto, H.T.O.; Mesquita, E.F. Seedling of development and tolerance of eggplant cultivars under saline stress. Afr. J. Agric. Res. 2016, 11, 2310–2315. [Google Scholar]
- Gonçalves, M.C.R.; Diniz, M.F.M.; Dantas, A.H.G.; Borba, J.R.C. Modesto efeito hipolipemiante do extrato seco de berinjela (Solanum melongena L.) em mulheres dislepidemias, sob controle nutricional. Rev. Bras. Farm. 2006, 16, 656–663. [Google Scholar] [CrossRef]
- Abbas, W.; Ashraf, M.; Akram, N.A. Alleviation of salt-induced adverse effects in eggplant (Solanum melongena L.) by glycinebetaine and sugarbeet extracts. Sci. Hortic. 2010, 125, 188–195. [Google Scholar] [CrossRef]
- Alkhatib, R.; Alkhatib, B.; AL-Eitan, L.; Abdo, N.; Tadros, M.; Bsoul, E. Physio-anatomical responses of tobacco under caffeine stress. Photosynthetica 2018, 56, 1140–1146. [Google Scholar] [CrossRef]
- Yemm, E.W.; Willis, A.J. The estimation of carbohydrates in plant extracts by anthrone. Biochem. J. 1954, 57, 508–514. [Google Scholar] [CrossRef] [PubMed]
- Parthiban, M.; Thilagavathi, G.; Viju, S. Effect of Solanum tuberosum on Muslin-Gauze Composite for Healthcare Applications. J. Text. Sci. Eng. 2012, 2, 121. [Google Scholar]
- Bradford, M.M. A rapid and sensitive method for the quantitation of microgram quantities of protein utilizing the principle of protein-dye binding. Anal. Biochem. 1976, 72, 248–254. [Google Scholar] [CrossRef]
- Alkhatib, R.; Alkhatib, B.; Abdo, N.; AL-Eitan, L.; Creamer, R. Physio-biochemical and ultrastructural impact of (Fe3O4) nanoparticles on tobacco. BMC Plant Biol. 2019, 19, 253–265. [Google Scholar] [CrossRef] [PubMed]
- Epstein, M.A.; Holt, S.J. The localization by electron microscopy of HeLa cell surface enzymes splitting adenosine triphosphate. J. Cell Biol. 1963, 19, 325–336. [Google Scholar] [CrossRef]
- Reynolds, E.S. The use of lead citrate at high pH as an electron-opaque stain in electron microscopy. J. Cell Biol. 1963, 17, 208–212. [Google Scholar] [CrossRef] [PubMed]
- Munns, R.; Tester, M. Mechanisms of salinity tolerance. Annu. Rev. Plant Biol. 2008, 59, 651–681. [Google Scholar] [CrossRef]
- Safdarian, M.; Askari, H.; Shariati, J.V.; Nematzadeh, G. Transcriptional responses of wheat roots inoculated with Arthrobacter nitroguajacolicus to salt stress. Sci. Rep. 2019, 9, 1792. [Google Scholar] [CrossRef]
- Wen-Yuan, W.; Xiao-Feng, Y.; Ying, J.; Bo, Q.; Yu-Feng, X. Effects of salt stress on water content and photosynthetic characteristics in Iris lacteal var. Chinensis seedlings. Middle East J. Sci. Res. 2012, 12, 70–74. [Google Scholar]
- Zuo, Z.Y.; Ye, F.; Wang, Z.S.; Li, S.X.; Li, H.; Guo, J.H.; Mao, H.P.; Zhu, X.C.; Li, X.N. Salt acclimation induced salt tolerance in wild-type and chlorophyl b-deficient mutant wheat. Plant Soil Environ. 2021, 67, 26–32. [Google Scholar] [CrossRef]
- Romero-Aranda, R.; Soria, T.; Cuartero, J. Tomato plant-water uptake and plant-water relationships under saline growth conditions. Plant Sci. J. 2001, 160, 265–272. [Google Scholar] [CrossRef]
- Fu, Q.S.; Yang, R.C.; Wang, H.S.; Zhao, B.; Zhou, C.L.; Ren, S.X.; Guo, Y.D. Leaf morphological and ultrastructural performance of eggplant (Solanum melongena L.) in response to water stress. Photosynthetica 2013, 51, 109–114. [Google Scholar] [CrossRef]
- Shaheen, S.; Naseer, S.; Ashraf, M.; Akram, N.A. Salt stress affects water relations, photosynthesis, and oxidative defense mechanisms in Solanum melongena L. J. Plant Interact. 2013, 8, 85–96. [Google Scholar] [CrossRef]
- Netondo, G.W.; Onyango, J.C.; Beck, E. Sorghum and salinity: II. Gas exchange and chlorophyll fluorescence of sorghum under salt stress. Crop Sci. 2004, 44, 806–811. [Google Scholar] [CrossRef]
- Faseela, P.; Sinisha, A.K.; Brestič, M.; Puthur, J.T. Chlorophyll a fluorescence parameters as indicators of a particular abiotic stress in rice. Photosynthetica 2019, 57, 108–115. [Google Scholar]
- Daoud, A.M.; Hemada, M.M.; Saber, N.; El-Araby, A.A.; Moussa, L. Effect of Silicon on the Tolerance of Wheat (Triticum aestivum L.) to Salt Stress at Different Growth Stages: Case Study for the Management of Irrigation Water. Plants 2018, 7, 29. [Google Scholar]
- Sairam, R.K.; Rao, K.V.; Srivastava, G.C. Differential response of wheat genotypes to long term salinity stress in relation to oxidative stress, antioxidant activity and osmolyte concentration. Plant Sci. 2002, 163, 1037–1046. [Google Scholar] [CrossRef]
- Gupta, B.; Huang, B. Mechanism of salinity tolerance in plants: Physiological, biochemical and molecular characterization. Int. J. Genom. 2014, 2014, 1–18. [Google Scholar] [CrossRef]
- Ibrahimova, U.; Zivcak, M.; Gasparovic, K.; Rastogi, A.; Allakhverdiev, S.I.; Yang, X.; Brestic, M. Electron and proton transport in wheat exposed to salt stress: Is the increase of the thylakoid membrane proton conductivity responsible for decreasing the photosynthetic activity in sensitive genotypes? Photosynth. Res. 2021. [Google Scholar] [CrossRef] [PubMed]
- Hare, P.D.; Cress, W.A.; Staden, J.V. Dissecting the roles of osmolyte accumulation during stress. Plant Cell Environ. 1998, 21, 535–553. [Google Scholar] [CrossRef]
- Pattanagul, W.; Thitisaksakul, M. Effect of salinity stress on growth and carbohydrate metabolism in three rice (Oryza sativa L.) cultivars differing in salinity tolerance. Indian J. Exp. Biol. 2008, 46, 736–742. [Google Scholar] [PubMed]
- Koch, K.E. Carbohydrate-modulated gene expression in plants. Annu. Rev. Plant Biol. 1996, 47, 509–540. [Google Scholar] [CrossRef] [PubMed]
- Ashraf, M.; Akram, N.A.; Arteca, R.N.; Foolad, M.R. The physiological, biochemical and molecular roles of brassinosteroids and salicylic acid in plant processes and salt tolerance. Crit. Rev. Plant Sci. 2010, 29, 162–190. [Google Scholar] [CrossRef]
- Wimmer, M.A.; Muhling, K.H.; Läuchli, A.; Brown, P.H.; Goldbach, H.E. The interaction between salinity and boron toxicity affects the subcellular distribution of ions and proteins in wheat leaves. Plant Cell Environ. 2003, 26, 1267–1274. [Google Scholar] [CrossRef]
- Ashraf, M.; O’Leary, J.W. Changes in soluble proteins in spring wheat stressed with sodium chloride. Biol. Plant. 1999, 42, 113–117. [Google Scholar] [CrossRef]
- Hajibagheri, M.; Harvey, D.M.; Flowers, T.J. Quantitative ion distribution withir/root cells of salt-sensitive and salt-tolerant maize varieties. New Phytol. 1987, 105, 367–379. [Google Scholar] [CrossRef]
- Xie, Z.; Song, R.; Shao, H.; Song, F.; Xu, H.; Lu, Y. Silicon improves maize photosynthesis in saline-alkaline soils. Sci. World J. 2015, 2015, 1–6. [Google Scholar] [CrossRef]
- Munné-Bosch, S.; Jubany-Marí, T.; Alegre, L. Drought induced senescence is characterized by a loss of antioxidant defences in chloroplasts. Plant Cell Environ. 2001, 24, 1319–1327. [Google Scholar] [CrossRef]
- Oi, T.; Enomoto, S.; Nakao, T.; Arai, S.; Yamane, K.; Taniguchi, M. Three-dimensional ultrastructural change of chloroplasts in rice mesophyll cells responding to salt stress. Ann. Bot. 2020, 125, 833–840. [Google Scholar] [CrossRef] [PubMed]
Publisher’s Note: MDPI stays neutral with regard to jurisdictional claims in published maps and institutional affiliations. |
© 2021 by the authors. Licensee MDPI, Basel, Switzerland. This article is an open access article distributed under the terms and conditions of the Creative Commons Attribution (CC BY) license (https://creativecommons.org/licenses/by/4.0/).