Article

Sensory Profile, Shelf Life, and Dynamics of Bioactive Compounds during Cold Storage of 17 Edible Flowers

Department of Agricultural, Forest and Food Sciences, University of Turin, 10095 Turin, Italy
*
Author to whom correspondence should be addressed.
Horticulturae 2021, 7(7), 166; https://doi.org/10.3390/horticulturae7070166
Submission received: 12 May 2021 / Revised: 24 June 2021 / Accepted: 25 June 2021 / Published: 29 June 2021
(This article belongs to the Special Issue Nutritional and Antioxidant Value of Horticulturae Products)

Abstract

:
In this study, 17 edible flowers (Allium ursinum L., Borago officinalis L., Calendula officinalis L., Centaurea cyanus L., Cichorium intybus L., Dianthus carthusianorum L., Lavandula angustifolia Mill., Leucanthemum vulgare (Vaill.) Lam., Paeonia officinalis L., Primula veris L., Robinia pseudoacacia L., Rosa canina L., Rosa pendulina L., Salvia pratensis L., Sambucus nigra L., Taraxacum officinale Weber, and Tropaeolum majus L.) were investigated to assess their sensory profile at harvest and their shelf life and bioactive compounds dynamics during cold storage. The emerging market of edible flowers lacks this information; thus, the characteristics and requirements of different flower species were provided. In detail, a quantitative descriptive analysis was performed by trained panelists at flower harvest, evaluating 10 sensory descriptors (intensity of sweet, sour, bitter, salt, smell, specific flower aroma, and herbaceous aroma; spiciness, chewiness, and astringency). Flower visual quality, biologically active compounds content (total polyphenols and anthocyanins), and antioxidant activity (FRAP, DPPH, and ABTS assays) were evaluated both at harvest and during storage at 4 °C for 14 days to assess their shelf life. Generally, species had a wide range of peculiar sensory and phytochemical characteristics at harvest, as well as shelf life and bioactive compounds dynamics during postharvest. A strong aroma was indicated for A. ursinum, D. carthusianorum, L. angustifolia, and L. vulgare, while B. officinalis and C. officinalis had very low values for all aroma and taste descriptors, resulting in poor sensory profiles. At harvest, P. officinalis, R. canina, and R. pendulina exhibited the highest values of polyphenols (884–1271 mg of gallic acid equivalents per 100 g) and antioxidant activity (204–274 mmol Fe2+/kg for FRAP, 132–232 and 43–58 µmol of Trolox equivalent per g for DPPH and ABTS). The species with the longest shelf life in terms of acceptable visual quality was R. pendulina (14 days), followed by R. canina (10 days). All the other species lasted seven days, except for C. intybus and T. officinale that did not reach day 3. During cold storage, the content of bioactive compounds differed, as total phenolics followed a different trend according to the species and anthocyanins remained almost unaltered for 14 days. Considering antioxidant activity, ABTS values were the least variable, varying in only four species (A. ursinum, D. carthusianorum, L. angustifolia, and P. officinalis), while both DPPH and FRAP values varied in eight species. Taken together, the knowledge of sensory profiles, phytochemical characteristics and shelf life can provide information to select suitable species for the emerging edible flower market.

1. Introduction

The consumption of flowers as food is an ancient practice but many flowers, or parts of them, have had a much wider use in the past than today [1,2,3,4,5,6]. Rose petals (Rosa spp.) were already used in Roman times as ingredients in various preparations, as well as chamomile (Matricaria chamomilla L.) in ancient Greece and chrysanthemum (Chrysanthemum morifolium Ramat.) in China. In the Middle Ages, common marigold flowers (Calendula officinalis L.) were used as components of salads, especially in France; in the same region from the 1600s onwards, various products based on violets (Viola odorata L.) became popular. Similarly, in various areas of Europe, carnation (Dianthus caryophyllus L.), dandelion (Taraxacum officinale Weber) and elder (Sambucus nigra L.) flowers were consumed. Some of these food cultures that were once confined to rural populations have survived, albeit marginally, to the present day and have recently been revived adding color, flavor, taste and visual appeal to food preparations [7,8].
Today, the assortment of edible flowers includes several species that are used to improve the aesthetic appearance, color, and aroma of foods but also for their nutritional properties [2,9,10,11,12,13]. Edible flowers contain indeed several bioactive compounds (vitamins, minerals, phenolic substances), while they are poor in fat and proteins [2,3,9,11,13,14,15,16]. Many studies foster the nutritional interest in wild and ornamental flowers, similar to leafy vegetables. Phenolic compounds (e.g., phenolic acids, flavonoids, and anthocyanins) are among the most representative biologically active compounds as they are a rich family of phytochemicals. Additionally, antioxidant effects [17,18,19,20] are highly correlated in edible flowers [1]. These compounds exert several biological activities important for human health [7,20,21]. Phenolic compounds counteract oxidative stress caused by reactive oxygen species [18], and epidemiological data showed that a diet rich in antioxidants could prevent chronic diseases, such as cancer, cardiovascular and neurodegenerative disorders [2,18,22,23,24].
The increasing demand for more attractive, tasty and healthy food can lead to the production of edible flowers to complement growers’ revenues, creating opportunities to develop value-added products in the floriculture sector, facing a challenging market [1,21,23]. Nowadays, several flowers are available on the market [25], however being few comparing to the variety of the species with edible flowers. It is therefore important to widen the knowledge about their quality, phytochemical composition and marketability to face the demand of consumers, producers, and retailers.
The sensory properties of food are extremely important not just to consumers, but also to food producers, because they relate directly to product quality and end-user acceptance [26], particularly concerning unfamiliar food, such as edible flowers [8,27]. According to the ISO 9000:2015 on quality management systems, the quality is the degree to which a combination of characteristics fulfils requirements [26]. Concerning edible flowers, sensory attributes such as color, appearance, flavor, and texture should be included in these characteristics [28,29]. Sensory science is a scientific discipline that concerns the presentation of a stimulus to subjects and then the evaluation of the subjects’ response [30]. Studies on sensory profiles or aptitudes of consumers towards edible flowers are increasing [8,27,31,32,33,34,35] but only a few were performed by trained panelists [29,36].
Edible flowers are highly perishable products, with early petal abscission and discoloration, flower wilt, dehydration, and tissue browning [11,37,38]. After harvesting, plant organs continue living, and both respiration and transpiration processes are considered the major causes of postharvest losses and poor quality [39]. Senescence is controlled by developmental [40,41] and environmental signals [42]. Among environmental factors, temperature plays a major role in slowing down these processes, affecting the metabolism of harvested flowers and their shelf life [11,38,43]. Temperatures from −2.5 °C to 20 °C differently affected the quality and appearance of edible flowers according to the species, showing the possibility to extend their shelf life by decreasing the temperature of storage [11]. Amid low temperatures, the values often chosen are in the range 4–6 °C [2,37,39,44,45,46] and the most frequently evaluated parameter during postharvest has been the visual quality so far. Thus, further detailed studies are needed to understand the dynamics of bioactive compounds in edible flowers and their antioxidant activity upon cold storage.
Recently, we characterized several species of fresh edible flowers by means of spectrometry and chromatography, discovering a wide range of variability among species and numerous promising sources of bioactive compound, such as roses (Rosa canina L. and Rosa pendulina L.), peony (Paeonia officinalis L.), or Primula veris L. [13]. This research provides the sensory profiles of the flowers of 17 species, performed by trained panelists to add information about this emerging type of food. Their shelf life during storage at 4 °C for 14 days was then assessed through visual quality evaluation, as well as the content of their biologically active compounds (total polyphenols and anthocyanins) and antioxidant activity (FRAP, DPPH, and ABTS assays) both at harvest and during cold storage to evaluate their quality and marketability.

2. Materials and Methods
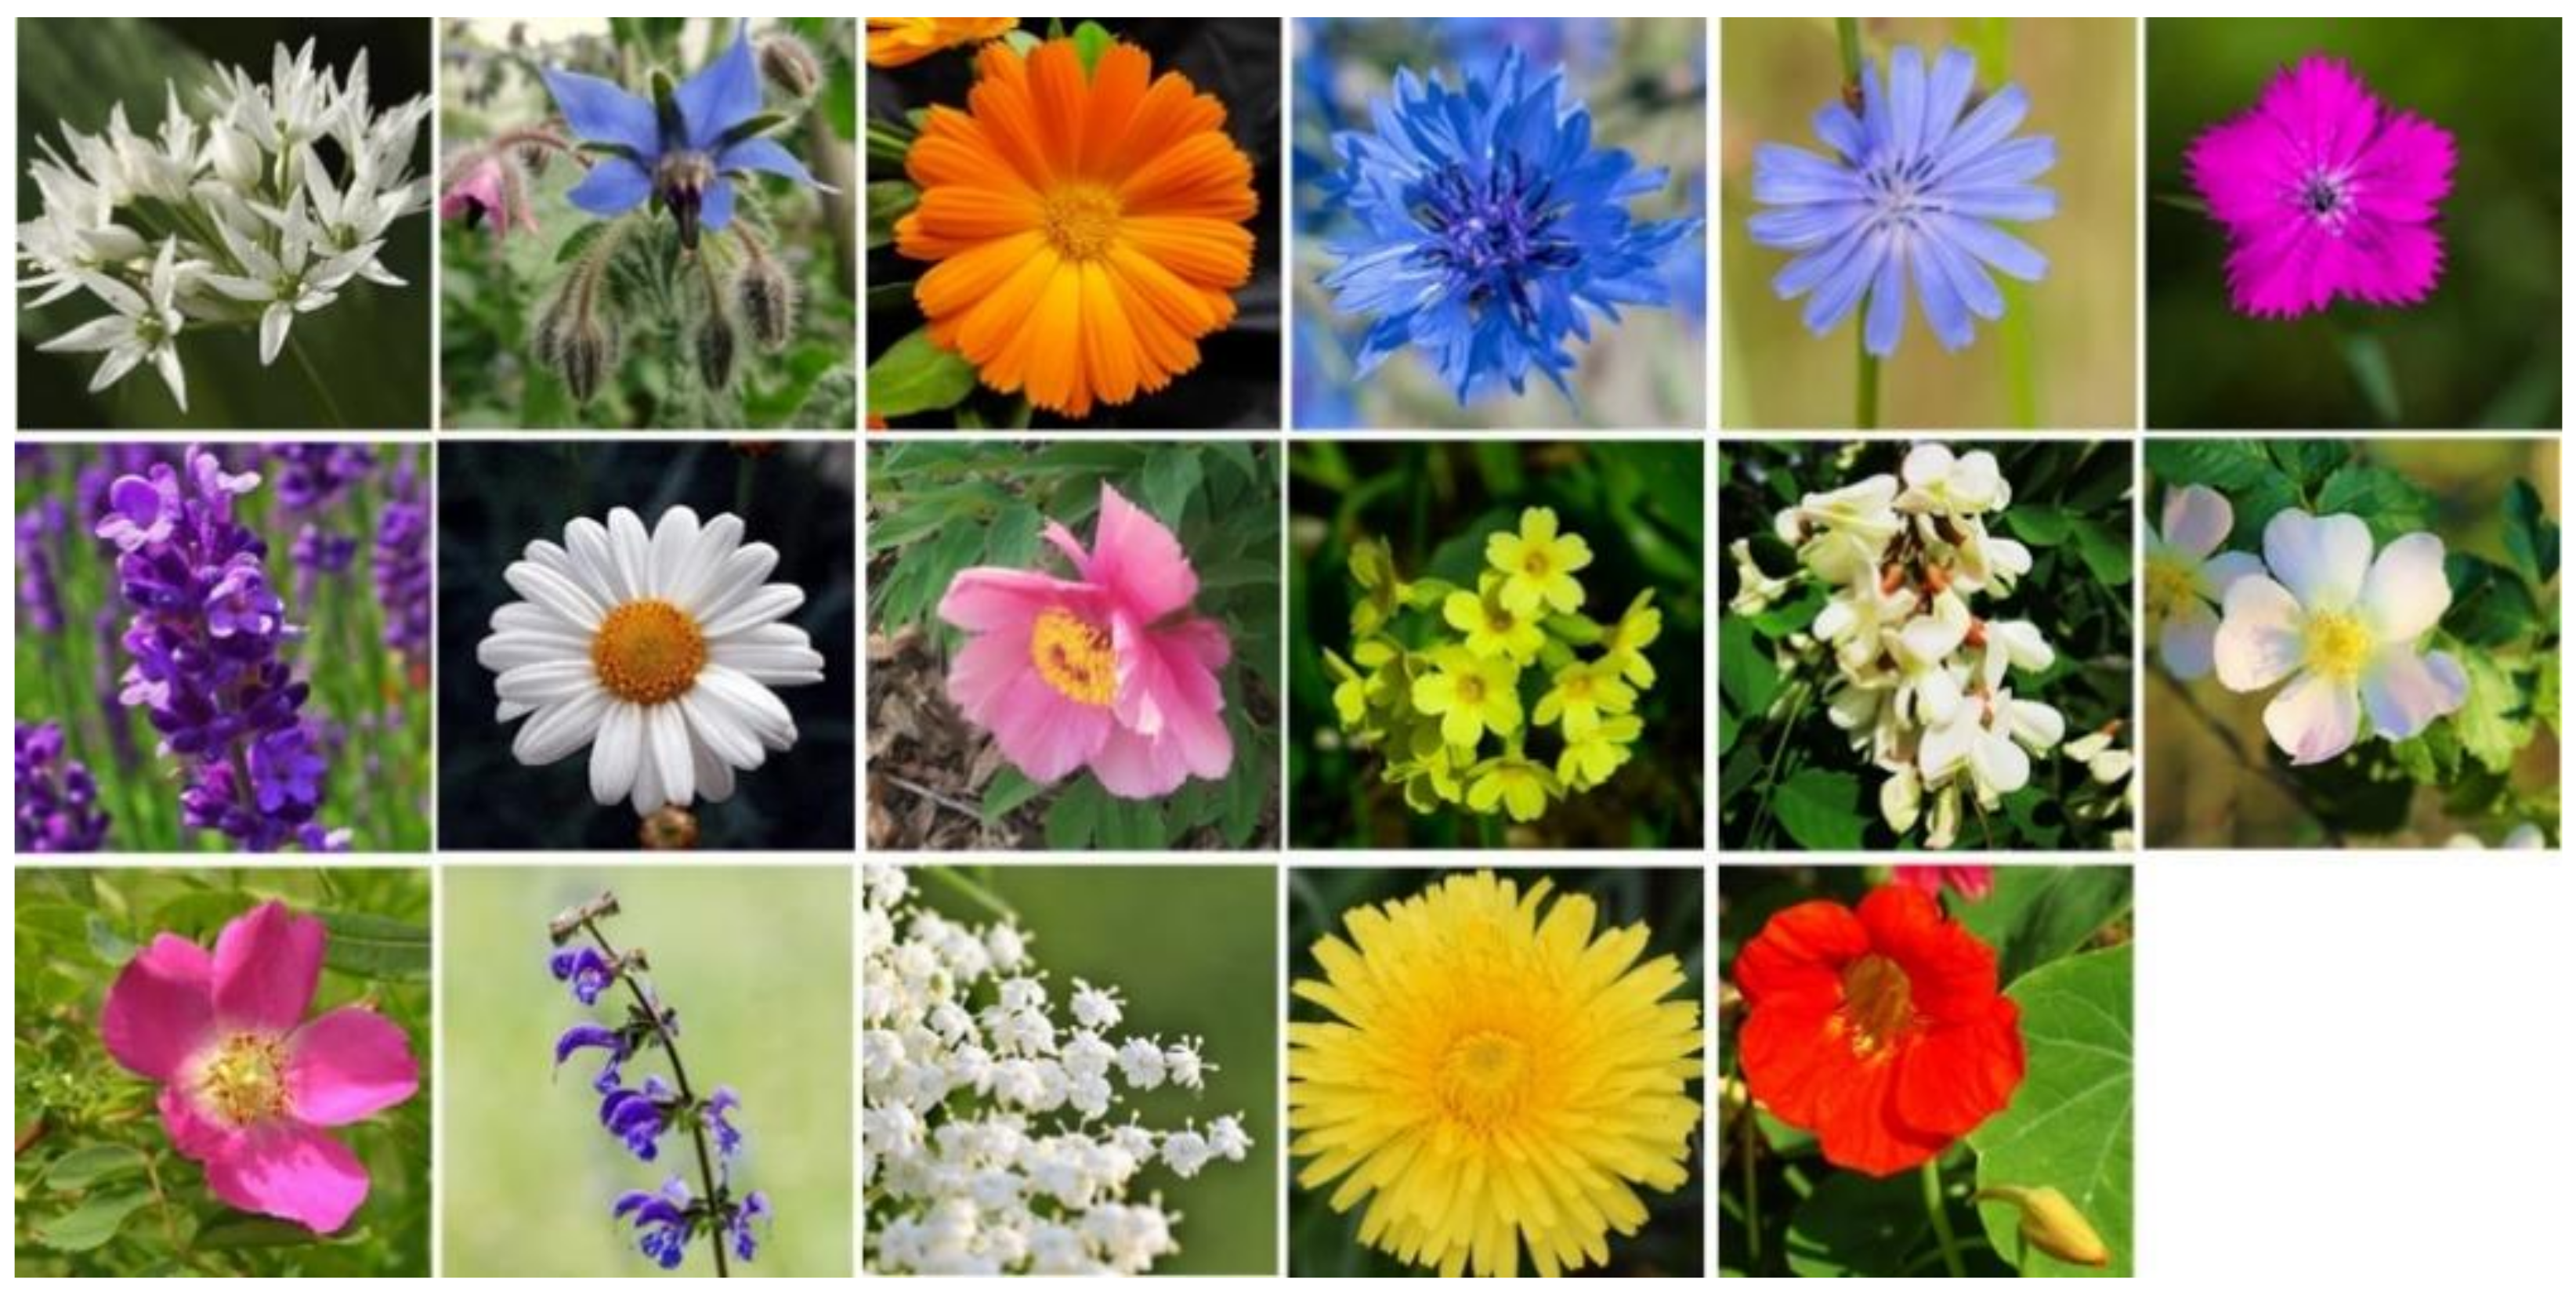
2.1. Plant Material

Seventeen edible flower species (Figure 1) were selected (Table 1) for the sensory and postharvest evaluation, including different properties and uses [13] and a wide assortment of flower color, shape and aroma, i.e., the traits that mostly attract consumers to try edible flowers [8]. Flowers were collected in the nursery for the species already available on the market (e.g., B. officinalis, C. officinalis, L. angustifolia, and T. majus), while for the others, it was necessary to collect them from wild plants. Flowers were collected at their full bloom (March through September according to the species), in 2017 and 2018. See reference [13] for detailed information on sampling sites and month. Flowers were preserved in plastic boxes inside a portable refrigerator. A portion of the sample was subjected to sensory evaluation within a few hours and another portion was transported to the laboratories of the Department of Agricultural, Forest and Food Sciences (DISAFA—University of Torino; Long. 7.589, Lat. 45.066) for analyses and postharvest trial.

2.2. Sensory Analysis

2.2.1. Panel Member Selection and Training

The sensory analysis was performed by the Italian National Organization of Fruit Tasters (O.N.A.Frut), composed of highly trained panelists that have been working since 2001 to promote and valorize sensory evaluation in the fruit sector. Panelists were trained in sensory analysis and quantitative descriptive analysis, being able to differentiate between basic taste solutions and aromas at various levels. The training on edible flowers started in 2016 with twenty people to improve their perception sensitivity and evaluation of individual descriptors, according to ISO 8586:2012 and ISO 3972:2011.
To guarantee a common lexicon of organoleptic terminology, the judges worked for four weeks tasting flowers and evaluating the samples both in groups and individually during the training sessions. After each panel session, a discussion was held according to literature [28,66,67,68,69] to define the descriptors in terms of appearance, aroma, texture and taste, following bibliographic references, to build an evaluation sheet for the Quantitative Descriptive Analysis (QDA). Of the 20 participants, twelve subjects, including males and females aged 20 to 60, were selected to form the panel and analyze five species (C. officinalis, L. vulgare, R. pseudoacacia, S. nigra, T. majus) in 2017 and twelve species (A. ursinum, B. officinalis, C. cyanus, C. intybus, D. carthusianorum, L. angustifolia, P. officinalis, P. veris, R. canina, R. pendulina, S. pratensis, T. officinale) in 2018.

2.2.2. Sensory Evaluation Test

The sessions for the sensory evaluation of the edible flowers were carried out in the sensory laboratory of O.N.A.Frut (Cuneo Province, Italy). Each judge received about 10 g of species items that had been presented as follows: about 5 g of flowers in a glass for olfactory evaluation and about 5 g in a white plastic dish for visual and tasting evaluation. Each species was evaluated independently by each panelist. According to sensory analysis rules, the sample presentation was basic, without other food in order to uniform the total impact of different species. Flowers were evaluated in the harvest day, fresh and without cooking preparation. All samples were served in duplicate to all judges and the order of presentation was randomized within each test day. Between tasting, assessors were encouraged to clean their palates with water during a 5-min break.

2.2.3. Quantitative Descriptive Analysis (QDA)

The Quantitative Descriptive Analysis (QDA) is a key part of sensory methodology: only when the intensity of sensory traits is rated, a food can be described in detail regarding its taste. The QDA method joins descriptor intensity points together with visually display difference [70]. The QDA was applied as analytical-descriptive method for sensory evaluation of flower samples. Each selected descriptor was evaluated on a continuous scale partially structured into 10 segments with intervals from zero (absence of the character) to 10 (maximum intensity). The evaluations of this study were based on previous experiences of taste evaluation performed on vegetables and fruits [69,71,72,73,74,75,76] and on flowers [31,36]. During separate sessions, panelists were also asked to give a personal preference (hedonistic test) to flower samples collected in 2018, although not planned in QDA, in order to assess a preliminary general rating, considering the experience acquired in the previous years [71,73]. Preference was scored from zero (lowest) to 10 (highest), providing judgement for taste, appearance and overall satisfaction.

2.3. Shelf Life

The shelf life evaluation was performed once in 2017 in five species (C. officinalis, L. vulgare, R. pseudoacacia, S. nigra, T. majus) and in 2018 in twelve species (A. ursinum, B. officinalis, C. cyanus, C. intybus, D. carthusianorum, L. angustifolia, P. officinalis, P. veris, R. canina, R. pendulina, S. pratensis, T. officinale). Five grams of flowers were put into plastic boxes with lid (Ondipack 250 cc, 123 mm × 114 mm × 50 mm, polypropylene, 4.46 g empty, Plemet, France) and stored at 4 °C in a cool chamber (MEDIKA 700, Fiocchetti Cold Manufacturer, Luzzara, Italy) with a transparent glass door, for 14 days, without artificial light. At least five boxes were prepared for each species. The shelf life of flowers was assessed through a visual quality evaluation across the experiment, performed by the same person. A 10-points scale was used, based on visual observation of the degree of decay [21,44] with 10 corresponding to freshly harvested flowers, without imperfections, six was the limit of marketability, while one corresponded to decomposing flowers (wilting, browning).

2.4. Plant Extracts

For each species, three biological replicates of fresh flowers were finely ground with liquid nitrogen at harvest (day 0) and stored at −80 °C until analyses. Then, on days 3, 7, 10, and 14, three biological replicates of fresh flowers were randomly picked from the same plastic boxes used for the shelf life evaluation. The material was ground with liquid nitrogen and stored at −80 °C until analyses. Flowers’ extracts were prepared through the ultrasound-assisted extraction method [45,77]. For each sample, 0.5 g of frozen grinded material was put into a glass tube, to which 25 mL of a water:methanol solution (1:1) were added. The tubes were then put into an ultrasound extractor (23 kHz; SARL REUS, Drap, France) for 15 min at room temperature. The extraction procedure was performed once. The phytoextract obtained was filtered through paper filters (Whatman No. 1, Whatman, Maidstone, UK) and then maintained at −20 °C until the following analyses.

2.5. Bioactive Compounds

2.5.1. Total Polyphenols

The total phenolic content in the extracts was determined following the Folin–Ciocalteu method [45,78]. The analysis was performed as follows: 1000 µL of diluted (1:10) Folin reagent were mixed with 200 µL of phytoextract in each plastic tube. The samples were left in the dark at room temperature for 10 min, then 800 µL of Na2CO3 (7.5%) were added to each tube. Samples were left in the dark at room temperature for 30 min. Absorbance was then measured at 765 nm by means of a spectrophotometer (Cary 60 UV-Vis, Agilent Technologies, Santa Clara, CA, USA), and the results were expressed on a fresh weight basis in milligrams of gallic acid equivalents per 100 g (mg GAE/100 g). The evaluation of total polyphenols was performed in triplicate on extracts of days 0, 3, 7, 10, and 14.

2.5.2. Total Anthocyanins

The total anthocyanins were estimated by pH differential method using two buffer systems: hydrochloric acid/potassium chloride buffer at pH 1.0 (25 mM) and sodium acetate buffer pH 4.5 (0.4 M), as described in the literature [45,79,80]. This method is based on the structural transformation of anthocyanins due to a change in pH (colored at pH 1.0 and colorless at pH 4.5). Briefly, 0.2 mL of each extract was diluted in a 5-mL volumetric flask with the corresponding buffers and the solution was read after 15 min against Milli-Q water as a blank at 510 and 700 nm. By means of a spectrophotometer (Cary 60 UV-Vis, Agilent Technologies, Santa Clara, CA, USA). Absorbance (A) was calculated as follows: A = (A510 nm–A700 nm) pH 1.0 − (A510 nm–A700 nm) pH 4.5. Then, the total anthocyanins (TA) of each extract were calculated by the following equation: TA = [A × MW × DF × 1000] × 1/ε × 1, where A is the absorbance; MW is the molecular weight of cyanidin-3-O-glucoside (449.2 D); DF is the dilution factor (25); ε is the molar extinction coefficient of cyanidin-3-glucoside (26.900) and results were expressed on a fresh weight basis in milligrams of cyanidin-3-O-glucoside per 100 g (mg C3G/100 g). The evaluation of total anthocyanins was performed in triplicate on extracts of days 0, 3, 7, 10, and 14.

2.6. Antioxidant Activity

2.6.1. DPPH Assay

To evaluate the antioxidant activity, the first procedure adopted was the 2,2-diphenyl-1-picrylhydrazyl radical (DPPH) scavenging method [77,81] with slight modifications. The working solution of DPPH radical cation (DPPH˙, 100 µM) was obtained, dissolving 2 mg of DPPH in 50 mL of MeOH. The solution must have an absorbance of 1.000 (±0.05) at 515 nm. To prepare the samples, 40 µL of phytoextract were mixed with 3 mL of DPPH˙. Samples were then left in the dark at room temperature for 30 min. Absorbance was measured at 515 nm by means of a spectrophotometer (Cary 60 UV-Vis, Agilent Technologies, Santa Clara, CA, USA). The DPPH radical-scavenging activity was calculated as [(Abs0–Abs1/Abs0)∙100], where Abs0 is the absorbance of the control and Abs1 is the absorbance of the sample. The antioxidant capacity was plotted against a Trolox calibration curve and results were expressed on a fresh weight basis as µmol of Trolox equivalents per gram (µmol TE/g). The DPPH assay was performed in triplicate on extracts of days 0, 3, 7, 10, and 14.

2.6.2. ABTS Assay

The second procedure adopted was the 2,2′-azino-bis(3-ethylbenzthiazoline-6-sulphonic acid) (ABTS) method [79] with slight modification. The working solution of ABTS radical cation (ABTS˙) was obtained by the reaction of 7.0 mM ABTS stock solution with 2.45 mM potassium persulfate (K2S2O8) solution. After the incubation for 12–16 h in the dark at room temperature, the working solution was diluted with distilled water to obtain an absorbance of 0.70 (±0.02) at 734 nm. The antioxidant activity was assessed by mixing 30 µL of phytoextract with 2 mL of diluted ABTS˙. Samples were left in the dark at room temperature for 10 min. Absorbance was the measured at 734 nm by means of a spectrophotometer (Cary 60 UV-Vis, Agilent Technologies, Santa Clara, CA, USA). The antioxidant activity was plotted against a Trolox calibration curve and results were expressed on a fresh weight basis as µmol of Trolox equivalents per gram (µmol TE/g). The ABTS assay was performed in triplicate on extracts of days 0, 3, 7, 10, and 14.

2.6.3. FRAP Assay

The third procedure was the FRAP (Ferric ion Reducing Antioxidant Power) method [45,77,82]. The FRAP solution was obtained by mixing a buffer solution at pH 3.6 (C2H3NaO2 + C2H4O2 in water), 2,4,6-tripyridyltriazine (TPTZ, 10 mM in HCl 40 mM), and FeCl3∙6H2O (20 mM). The antioxidant activity was determined mixing 30 µL of phytoextract with 90 µL of deionized water and 900 µL of FRAP reagent. The samples were then placed at 37 °C for 30 min. Absorbance was measured at 595 nm by means of a spectrophotometer (Cary 60 UV-Vis, Agilent Technologies, Santa Clara, CA, USA). Results were expressed on a fresh weight basis as mill moles of ferrous iron equivalents per kilogram (mmol Fe2+/kg). The FRAP assay was performed in triplicate on extracts of days 0, 3, 7, 10, and 14.

2.7. Statistical Analysis

Data of the sensory profiles, visual quality, bioactive compounds, and antioxidant activity were previously subjected to the Shapiro–Wilk normality test and Levene homogeneity test (p > 0.05). The differences between species and across time were computed using a parametric or a non-parametric one-way analysis of variance (ANOVA), according to the significance of the previous tests and means were separated with Tukey’s HSD test (p ≤ 0.05). The Pearson’s correlation was performed on QDA values and subjective judgement. The Spearman’s correlation was performed on polyphenols, anthocyanins, DPPH, ABTS, FRAP and sensory profile values. The principal component analysis (PCA) was performed on sensory data to visualise the contribution of each attribute to the overall variability. The partial least square (PLS) regression was also done to investigate correlations between phytochemical profile (X-variables) and sensory data (Y-variables) after standardization of the data; the phytochemical profile of the 17 species derives from recent work on the same plant material [13]. All data were analyzed by means of the SPSS software (version 25.0; SPSS Inc., Chicagom, IL, USA), except for PCA (Past 4.01, [83]), and spider charts were prepared using Microsoft Office Excel.

3. Results

3.1. Sensory Analysis

3.1.1. Lexicon and QDA Sensory Sheet Definition

The 10 selected sensory descriptors are defined in Table 2, with four descriptors for taste (sweet, sour, bitter, and salt), three for aroma (smell, specific flower aroma, and herbaceous aroma), together with chewiness, astringency and spiciness. A specific sensory analysis sheet for flower evaluations was realized (Figure S1) and used for the QDA test, using a reduced list of sensory lexicon both to ease the judges’ evaluation and to describe the essential traits of samples.

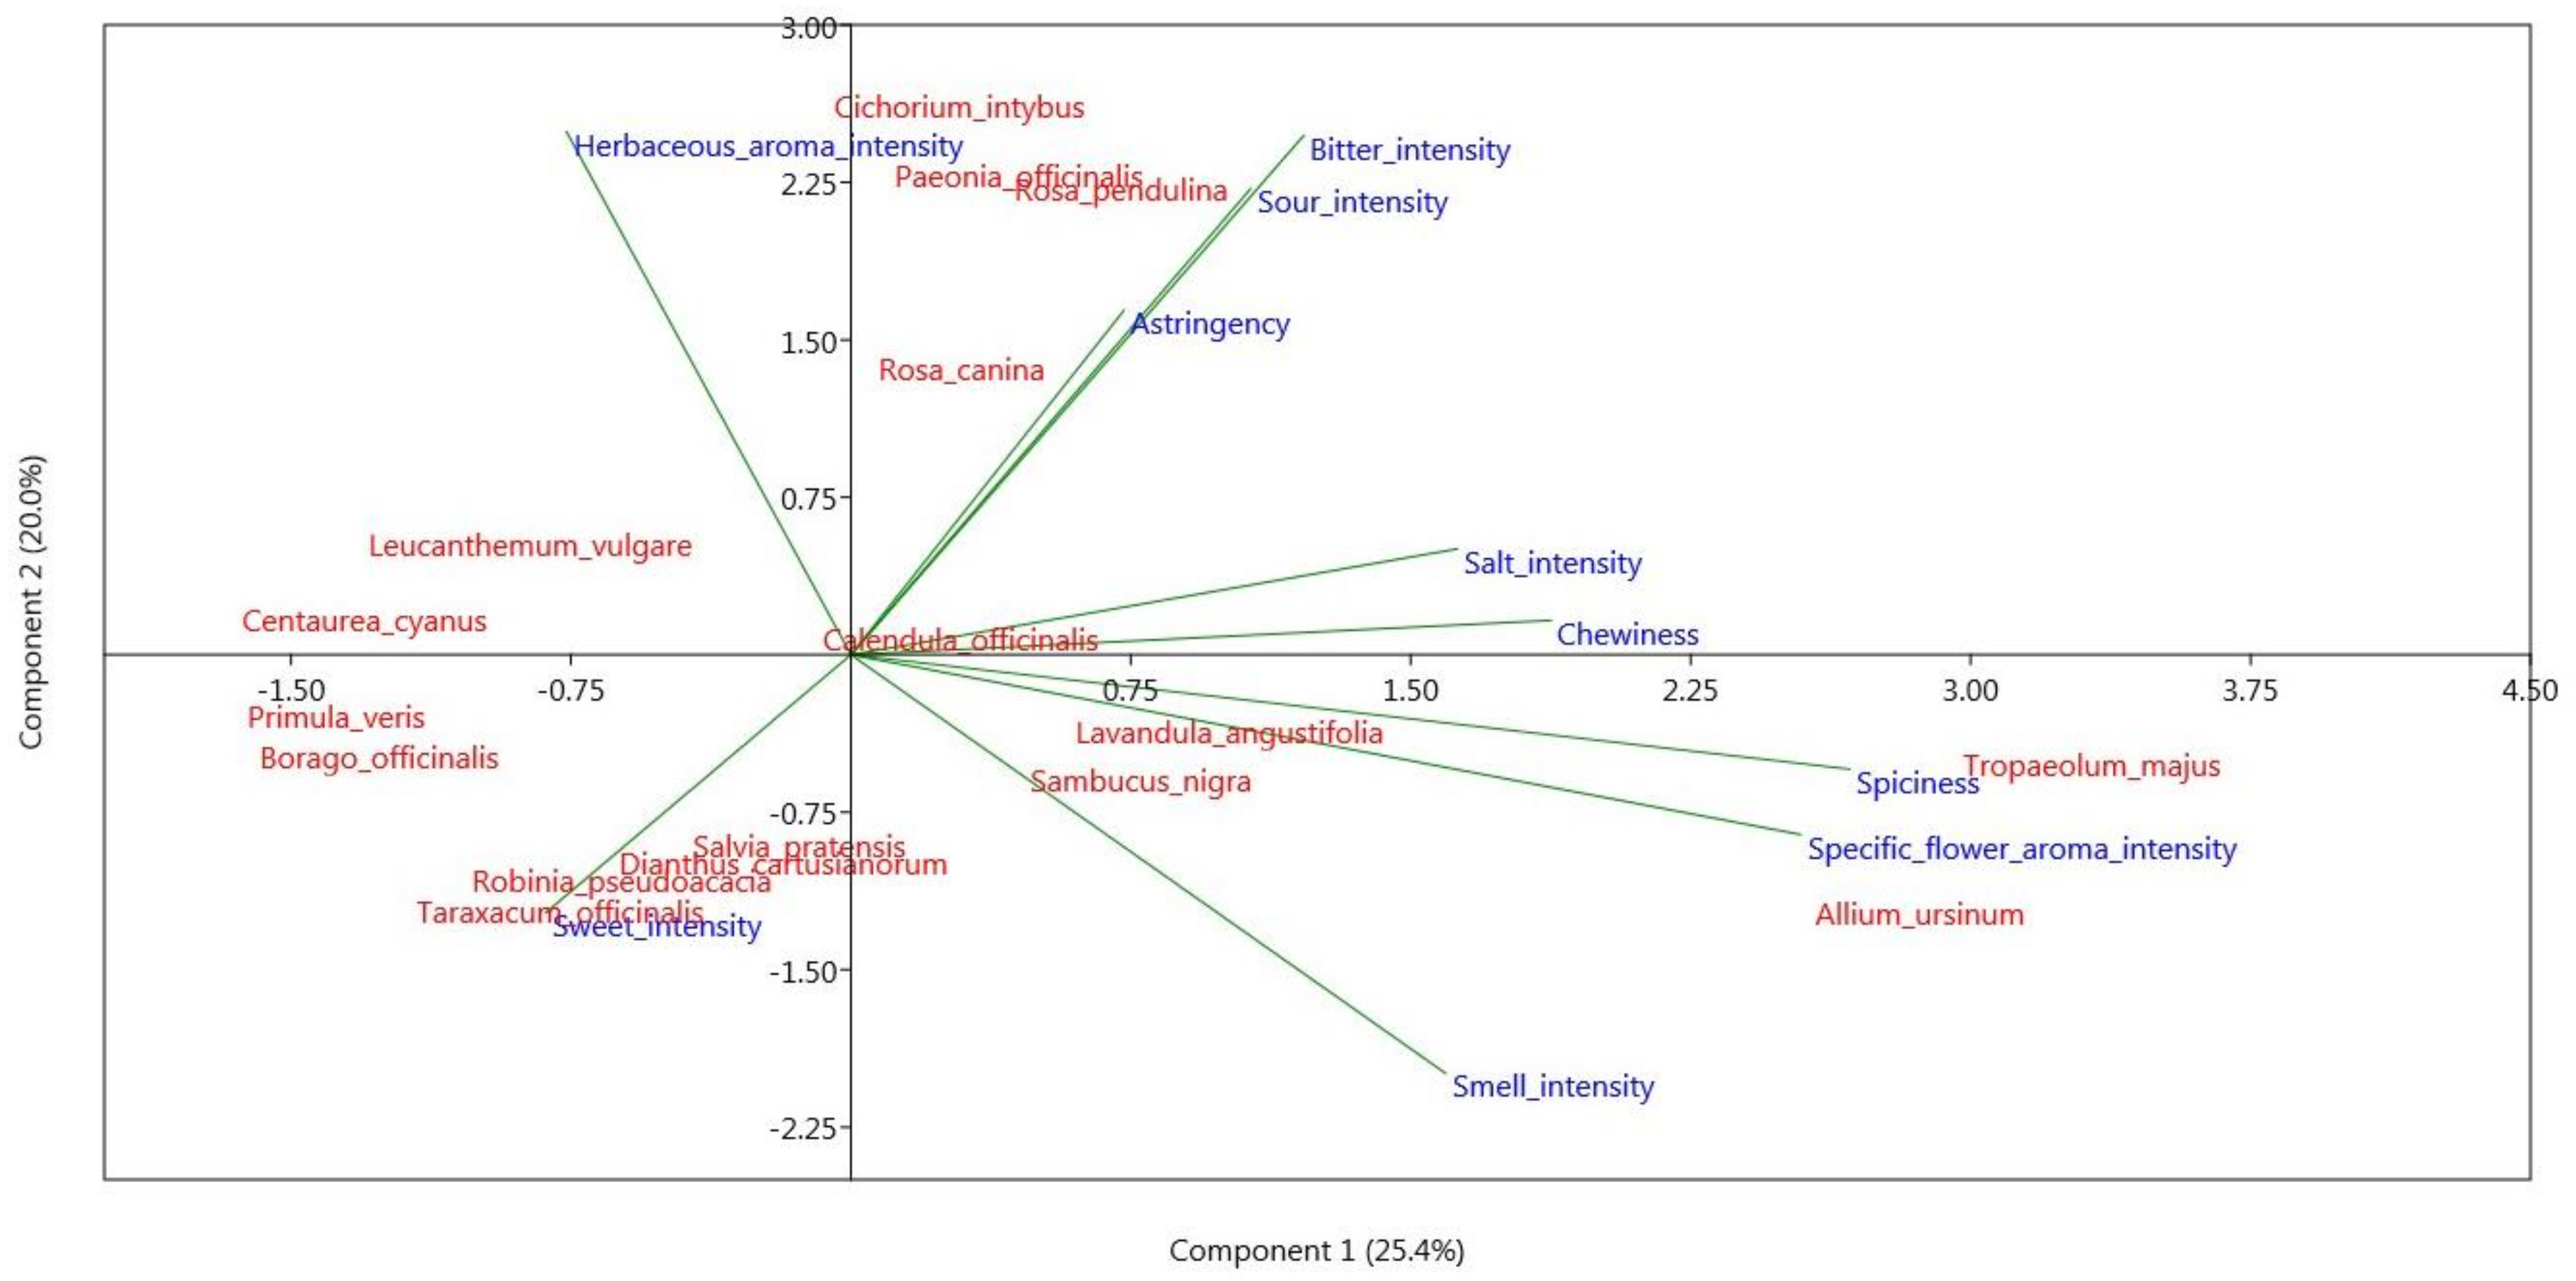
3.1.2. Sensory Profiles

The detailed sensory profiles of the 17 species are shown in Table 3 and Figures S2–S4. A wide variability was recorded among the tested edible flowers in terms of the range of intensities, with spiciness having the widest range of variation (7.4), followed by specific flower aroma (6.2), bitterness and sweetness (6.1), smell (6.1), herbaceous aroma (4.7), chewiness (4.4), astringency (4.1), sour intensity (2.5), and salt intensity as the least variable descriptor (2.4). All the sensory descriptors were detected in each flower species, except for spiciness that was absent in R. pseudoacacia. The highest intensities were recorded for smell in L. angustifolia (9.0) and specific flower aroma in A. ursinum (8.8).
In A. ursinum (Table 3, Figure S2), the intensities of smell and garlic aroma were very high (8.3 and 8.8, respectively) and flowers were easy to chew (7.4). Borago officinalis had a marked chewiness (6.1), but was not astringent neither spicy and taste descriptors (sweet, sour, bitter and salt) were lower than 3.5. Calendula officinalis had medium smell (6.7) and aroma (5.2), not very marked for taste but easy to chew and little astringent and spicy. The QDA profile of C. cyanus had low values, with the most marked descriptors (smell, aroma, and chewiness) lower than 6. The sensory profile of C. intybus was defined by bitter taste, aroma intensity and chewiness.
The flowers of D. carthusianorum (Table 3, Figure S3) had 6.7 of smell and 6 of aroma, while bitterness was the most marked of the taste descriptors. The profile of L. angustifolia had very high values for smell and aroma intensity (9.0–8.2); the chewiness was medium (4.7) and bitterness characterized the taste. Leucanthemum vulgare had values higher than 5 only in smell (7.4), herbaceous aroma (5.3), and chewiness (5.2). The panel scored a high chewiness for P. officinalis and among the taste descriptors, the bitter taste was the highest (6.1).
Primula veris had values lower than 5 in all descriptors, except for chewiness (6.3), so the organoleptic sensations are delicate. The sensory profile of R. pseudoacacia showed high values for smell (7.0), sweet (7.0), and aroma (6.0), and chewiness was sufficiently easy (6.0).
The profile of R. canina (Table 3, Figure S4) reveals an easy chewiness (6.6) and bitterness was the most marked of the taste descriptors (4.8). Rosa pendulina flowers had higher bitter taste (7.2) and astringency (4.4) and lesser herbaceous aroma (2.5) than R. canina flowers. Salvia pratensis was chewable (6.6), with high smell (7.3) and medium aroma (5.3); all the other descriptors were equal or lower than 2.0, except for the sweet taste (3.9). Sambucus nigra had a sensory profile with high intensities of smell (7.8) and aroma (6.7); it was easy to chew (7.4), sweet and bitter intensities were balanced (3.5), while all the other descriptors were lower than 2. In T. officinale, the smell and aroma were sufficiently marked (6.4 and 4.5 respectively), as per chewiness (5.7), while sweet intensity was the highest among the taste descriptors, though being 3.7. Finally, T. majus had very high intensities of smell (8.3) and aroma (7.3) and was easy to chew (8.2), spicy (8.2), and quite bitter (5.4), while all the other descriptors were lower than 2.
The PCA plot generated from the sensory data is shown in Figure 2. Component 1 (PC1) accounted for 25.4% of the sensory variation in the studied edible flowers and PC2 accounted for 20.0%, explaining 45.4% of sensory descriptors variability. PC1 has a positive association mostly with the variation of specific flower aroma and spiciness, with T. majus and A. ursinum showing the highest values; while PC2 mainly reflected sour, bitter, and herbaceous aroma intensities with C. intybus, P. officinalis, and R. pendulina showing the highest values. The other species are scattered on the plot, with intermediate or negative relation with most of the sensory descriptors, except for sweet intensity, which characterizes S. pratensis, D. carthusianorum, R. pseudoacacia, and T. officinale. According to the loadings, sour and bitter intensity and astringency (upper right quadrant) are inversely related with sweet intensity (lower left quadrant), while to a lesser extent, smell intensity (lower right quadrant) is inversely related with herbaceous aroma intensity (upper right quadrant).
The data acquired on the sensory traits of the 17 species were evaluated together with the HPLC-DAD phytochemical profiles of the same plant material reported in a recent work [13]. In particular, sensory data were correlated with the content of phenolic acids (cinnamic acids: caffeic, chlorogenic, coumaric and ferulic acid; benzoic acids: ellagic and gallic acid), flavonols (hyperoside, isoquercitrin, quercetin, quercitrin and rutin), flavanols (catechin and epicatechin), and vitamin C with PLS regression. Cumulative Q2 of component 1 (0.059) and component 2 (0.163) and cumulative R2 of both X and Y in the two components were below 0.3 (R2Y comp.1 = 0.099, R2Y comp.2 = 0.223, R2X comp.1 = 0.167, R2X comp.2 = 0.274) suggesting weak relations between descriptors and compounds.

3.1.3. Subjective Judgement

Concerning the satisfaction rating (Table 4), the flowers showed very different levels of acceptance. The overall subjective judgement ranged from 4.63 of C. intybus to 7.07 of A. ursinum. Regarding taste, the subjective judgement of panel members ranged from 3.25 (R. pendulina) to 6.57 (A. ursinum). Regarding appearance, the different species were generally appreciated (from 6.21 in T. officinale to 7.64 in P. officinalis) except for C. intybus (3.25) and D. carthusianorum (4.60).
Despite the positive significant correlations found between the overall subjective judgement and the intensity of smell, sweet and aroma of specific flower (Table 5, p < 0.01), and the intensity of herbaceous aroma (p < 0.05), these are often weak (below 0.45). The correlation between the overall judgment and salt intensity (p < 0.01) and astringency was instead negative (p < 0.05). The overall subjective judgement was not significantly correlated with sour and bitter intensity, spicy and chewiness.

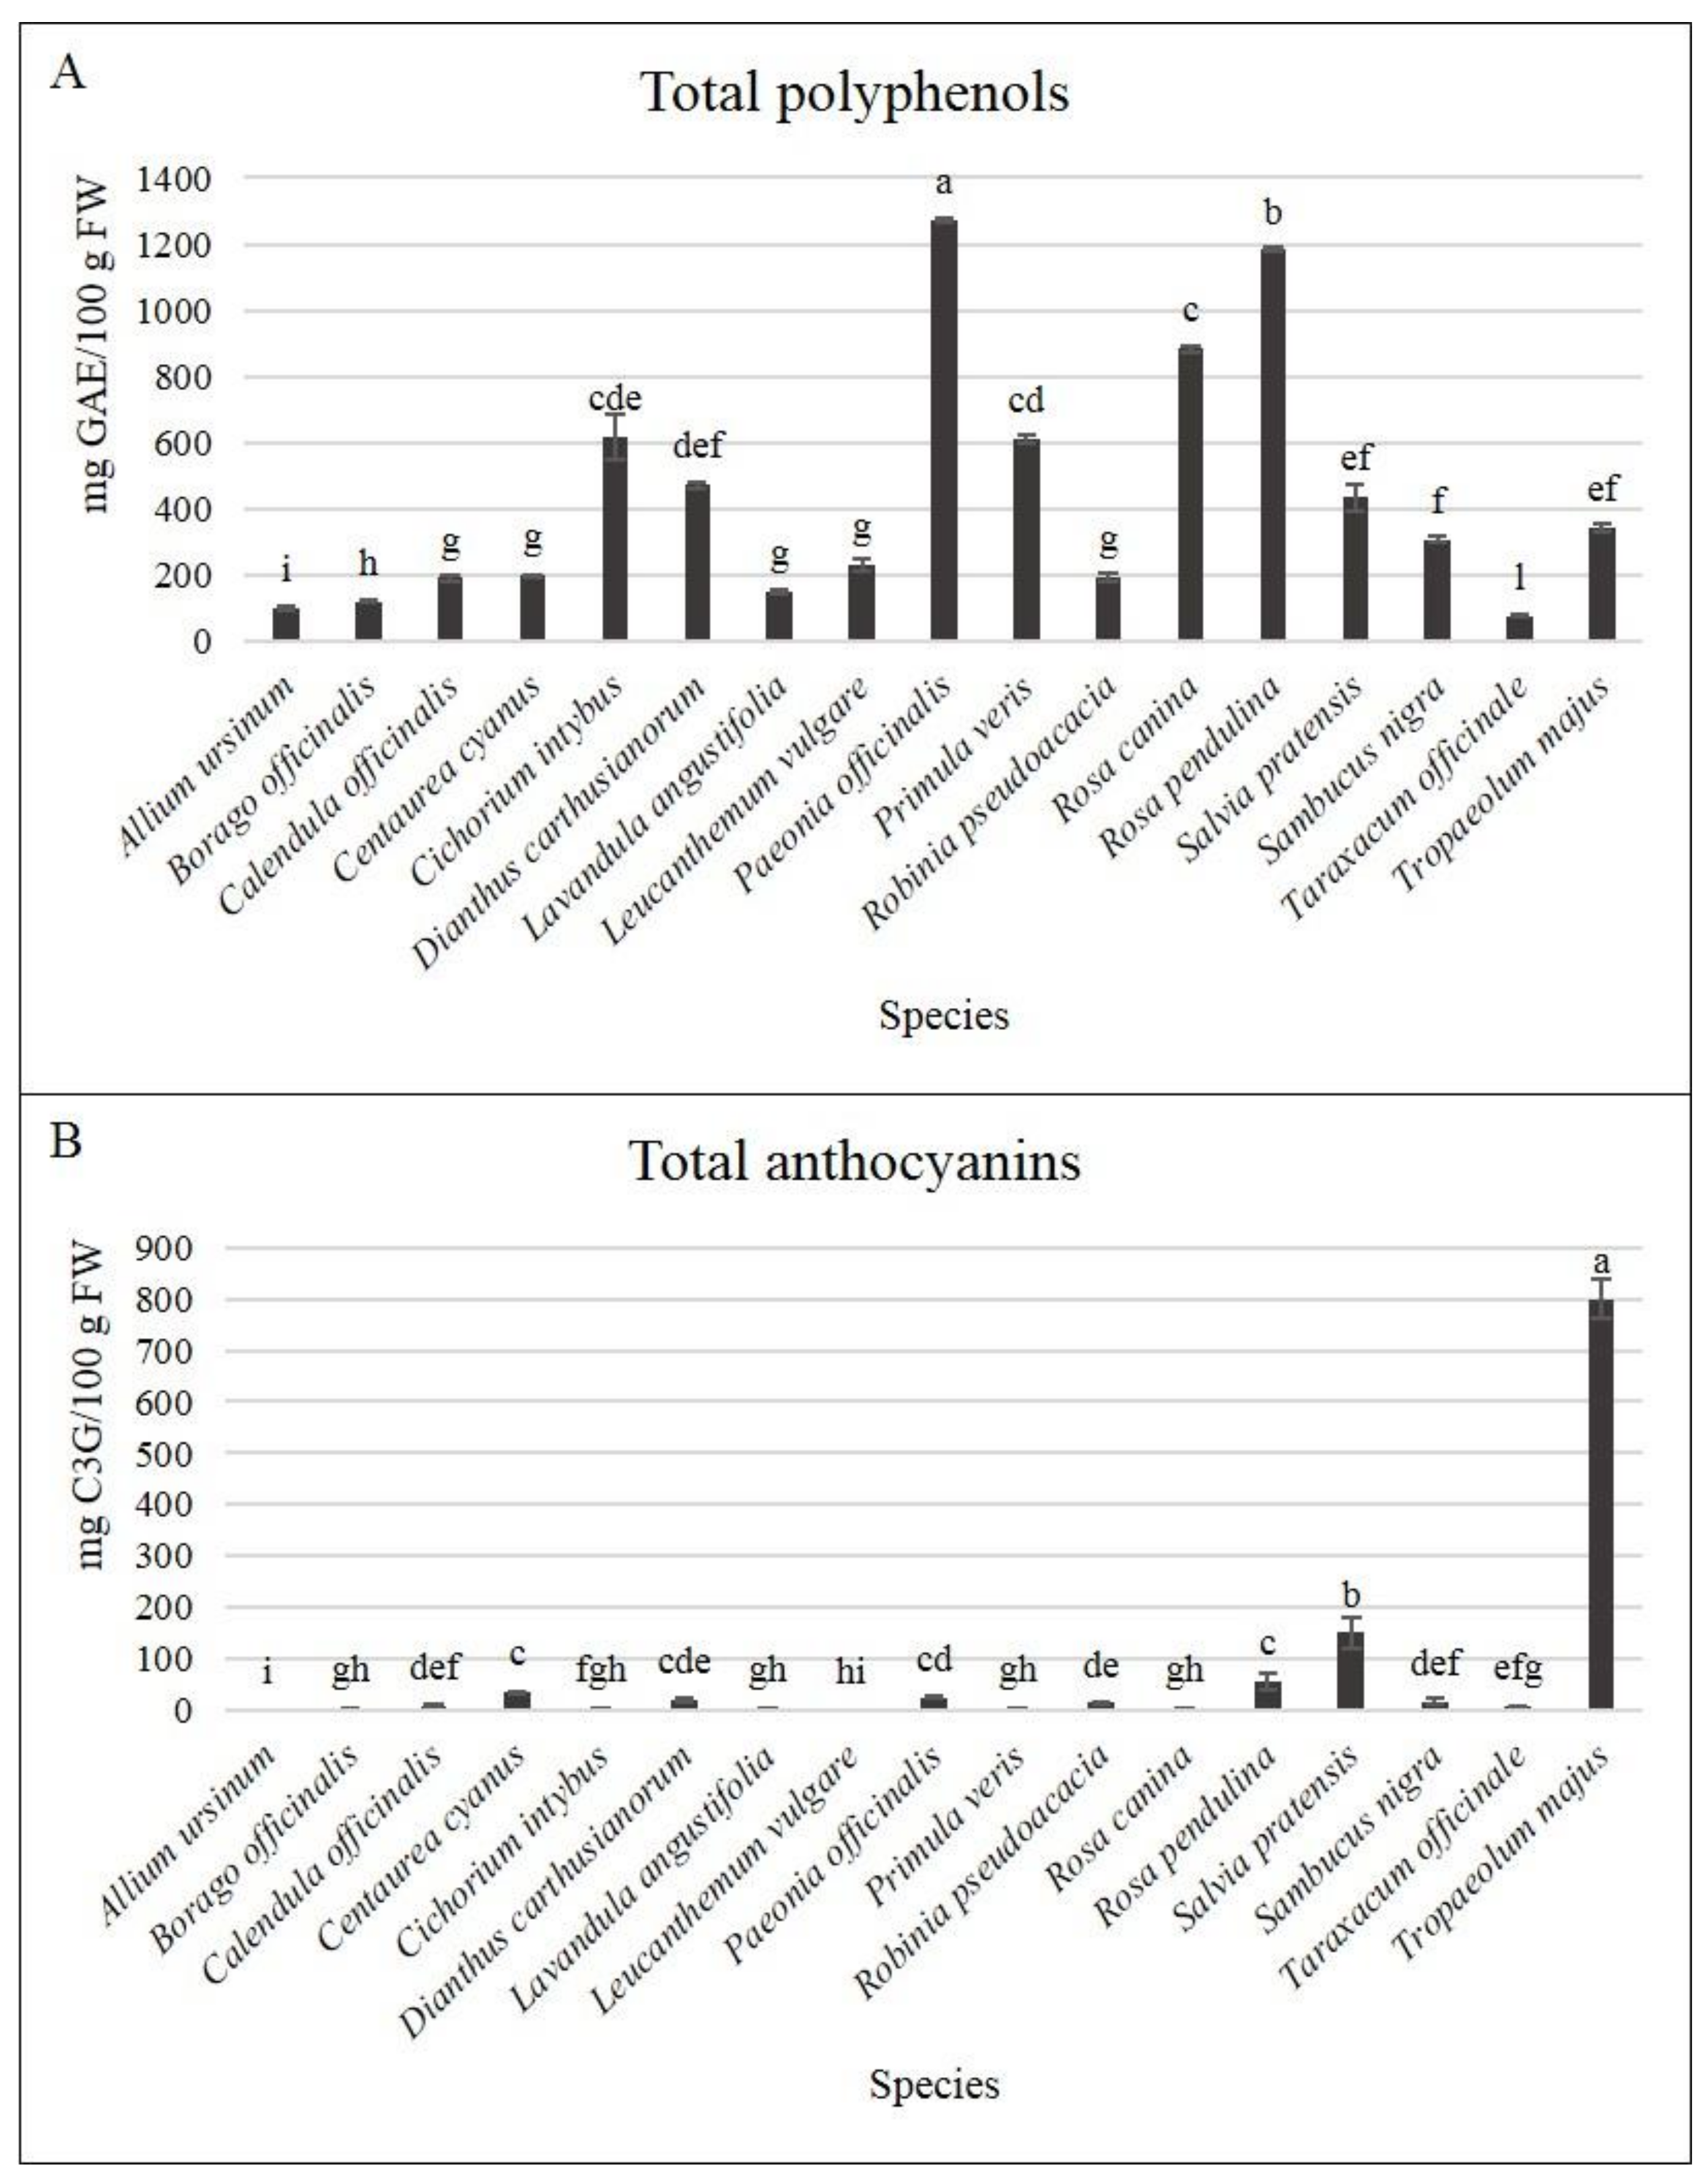
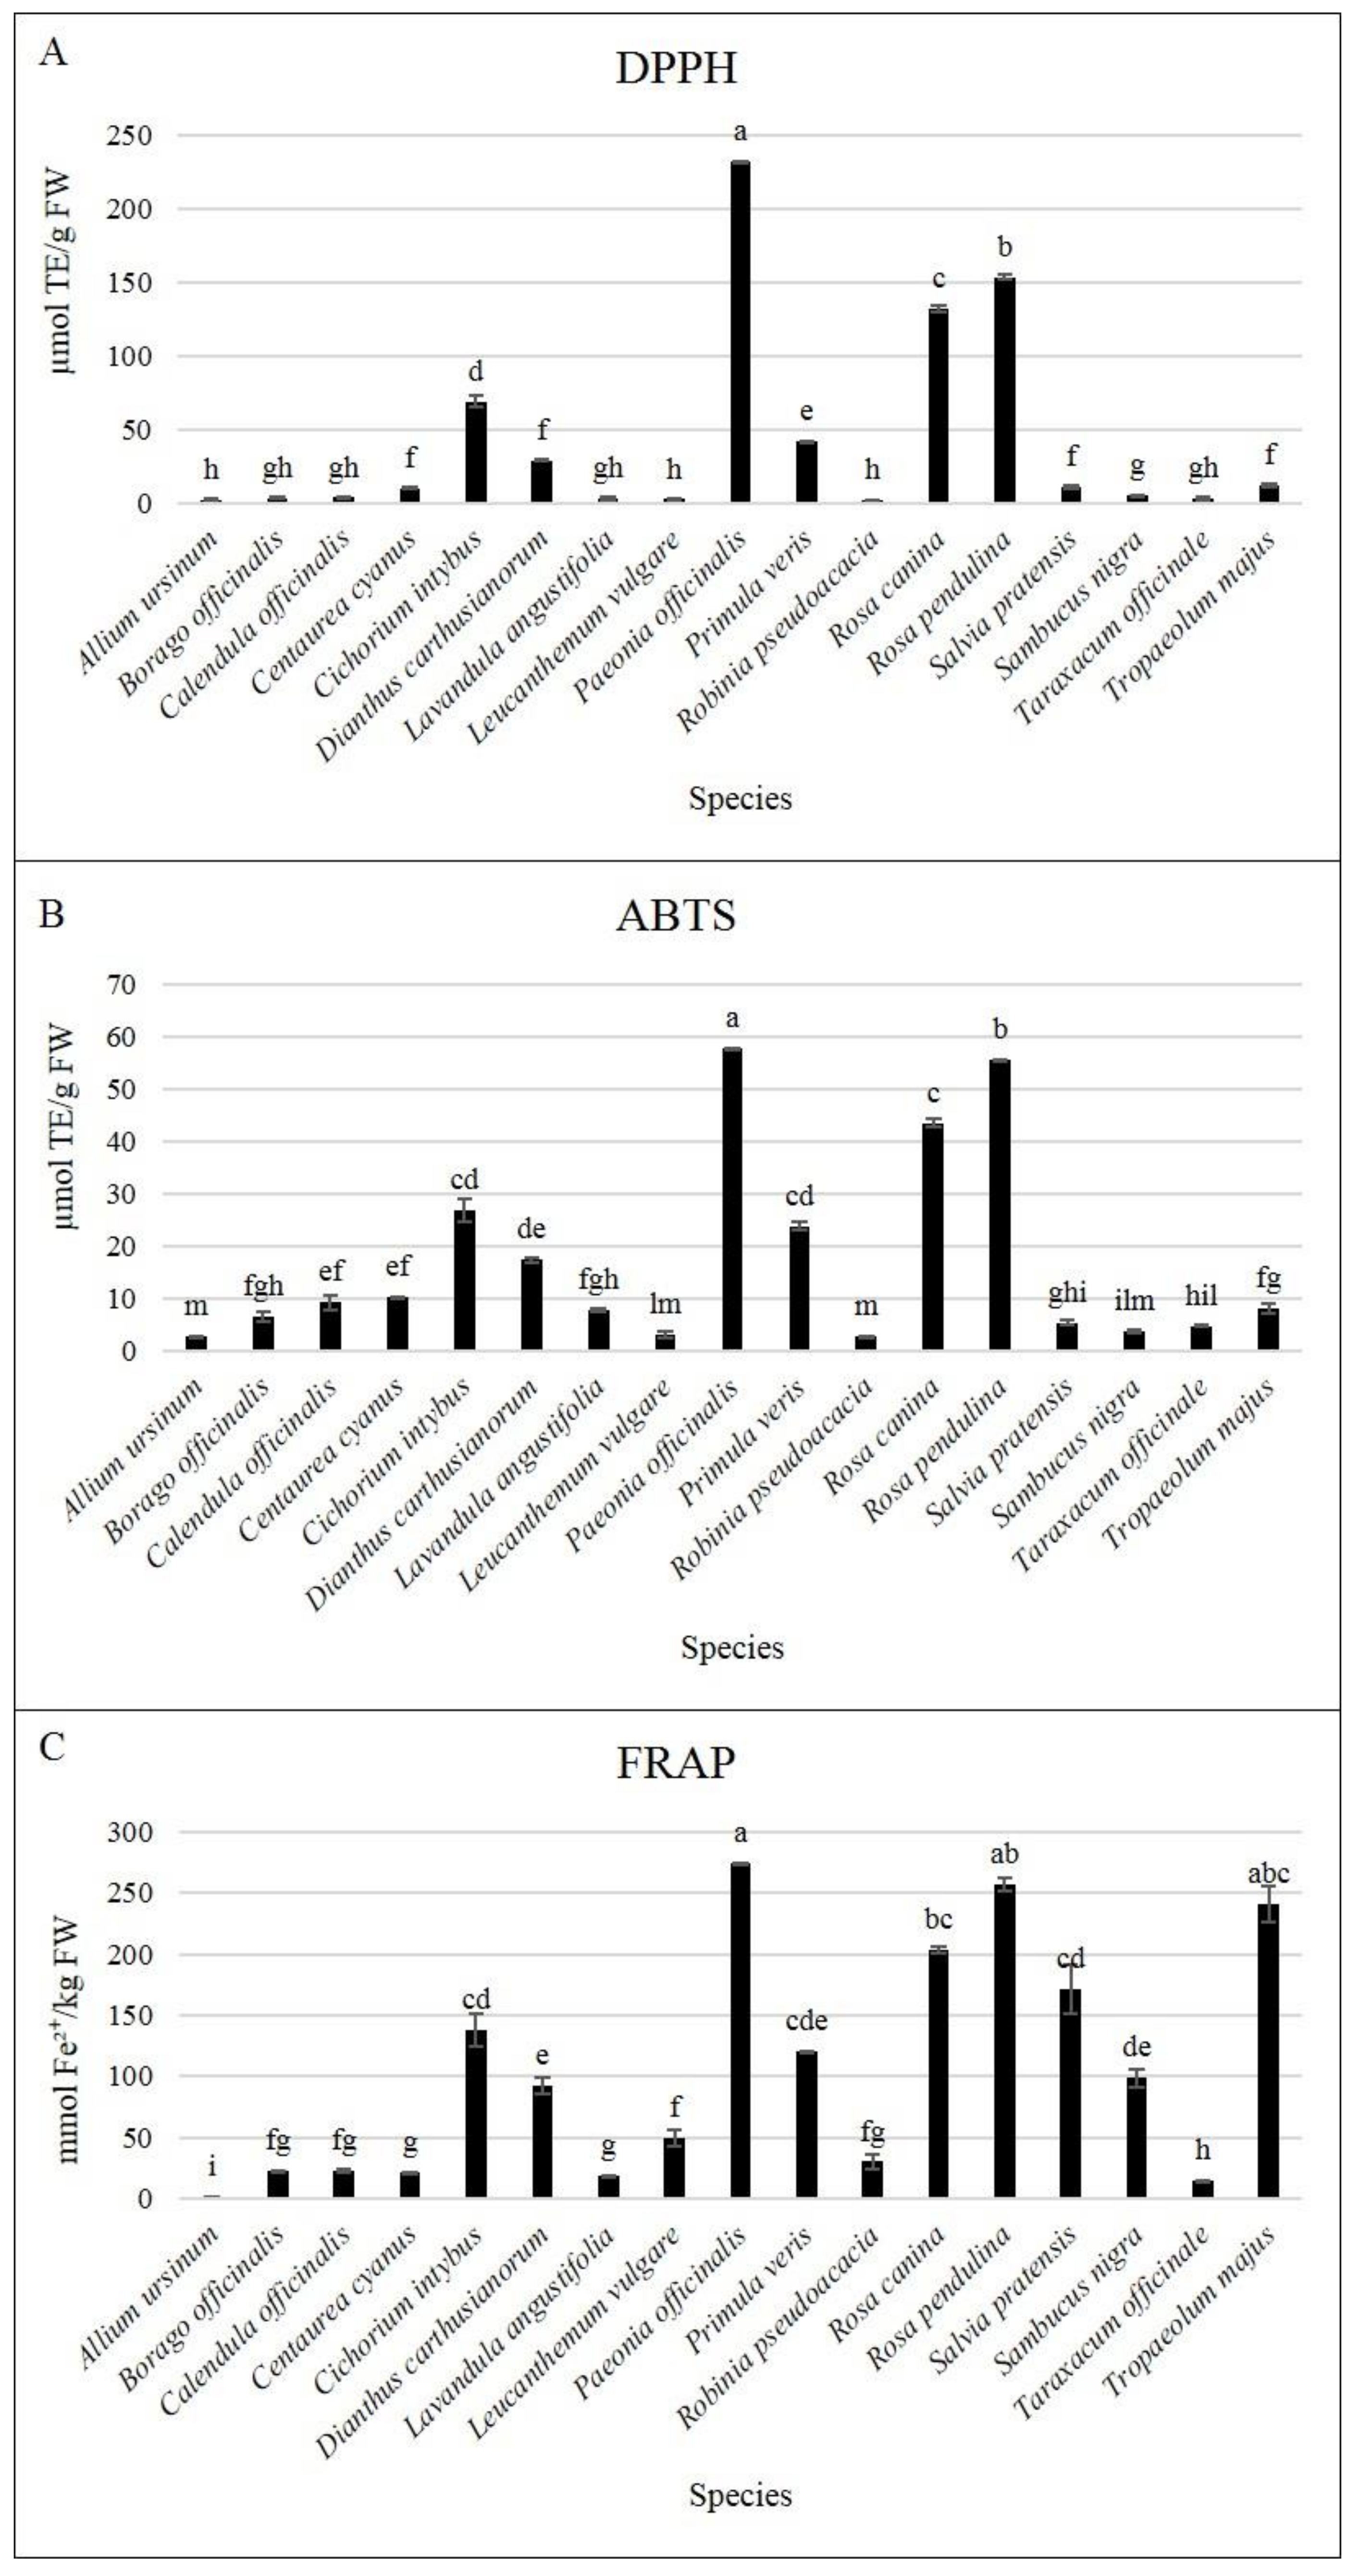
3.2. Bioactive Compounds and Antioxidant Activity at Harvest

Bioactive compounds and antioxidant activity of freshly harvested flowers are reported in Figure 3 and Figure 4. Particularly, polyphenols (Figure 3A) ranged from 76.41 mg GAE/100 g FW (T. officinale) and 1270.72 mg GAE/100 g FW (P. officinalis). Anthocyanins (Figure 3B) ranged from 0.58 mg C3G/100 g FW (A. ursinum) and 800.23 mg C3G/100 g FW of T. majus, which had four times higher values than the second species in ranking (S. pratensis). The antioxidant activity, measured through different assays, had a similar pattern in DPPH and ABTS methods (Figure 4A,B), while the FRAP differed (Figure 4C). DPPH values ranged from 2.08 µmol TE/g FW (R. pseudoacacia) and 232.44 µmol TE/g FW (P. officinalis). Both roses had high DPPH scavenging activity (153.96 µmol TE/g FW in R. pendulina and 132.25 µmol TE/g FW in R. canina), followed by C. intybus (69.17 µmol TE/g FW) and all the other species. Concerning ABTS, values ranged from 2.70 µmol TE/g FW (A. ursinum) to 57.59 µmol TE/g FW (P. officinalis). As for the DPPH assay, roses had high scavenging activity (55.44 µmol TE/g FW in R. pendulina and 43.45 µmol TE/g FW in R. canina), followed by C. intybus (26.85 µmol TE/g FW) and all the other species. FRAP values (Figure 4C) ranged from 1.45 mmol Fe2+/kg FW (A. ursinum) to 274.22 mmol Fe2+/kg FW (P. officinalis). In this assay, T. majus showed very high antioxidant activity (241.12 mmol Fe2+/kg FW), comparable to that of R. canina (203.72 mmol Fe2+/kg FW), R. pendulina (257.04 mmol Fe2+/kg FW), S. pratensis (171.09 mmol Fe2+/kg FW), C. intybus (138.36 mmol Fe2+/kg FW), and P. veris (120.14 mmol Fe2+/kg FW).
The correlation analysis (Table 6) between the content of polyphenols and anthocyanins at harvest and the antioxidant activity evaluated through different assays indicated that all these parameters are significantly correlated, except for the content of anthocyanins and ABTS values (p = 0.091). All the correlations were positive and the three methods of analysis for the antioxidant activity were highly related. The total polyphenol and anthocyanin content at harvest was also evaluated in relation to the sensory profiles of the species. Few correlations were recorded, being both groups of bioactive compounds negatively correlated only with salt intensity (polyphenols: r = −0.275, p < 0.001; anthocyanins: r = −0.299, p < 0.001).

3.3. Shelf Life and Dynamics of Bioactive Compounds

Visual quality grade and the content of total polyphenols and anthocyanins in the studied species are reported in Table 7. Data on C. intybus was not available, since the flowers rapidly rotted and no further evaluations were possible beyond day 0. Roses had acceptable visual quality rate (≥6) for the longest period, up to day 10 in R. canina and up to day 14 in R. pendulina. All the other species lasted seven days, while T. officinale did not reach day 3.
Concerning the bioactive compounds, the total phenolic content (Table 8) during storage varied, increasing significantly in eight species (B. officinalis, C. cyanus, L. angustifolia, L. vulgare, P. veris, R. canina, t. officinale) and decreasing in 4 (A. ursinum, C. officinalis, P. officinalis, T. majus) while it remained stable in R. pseudoacacia, R, pendulina, S. pratensis, and S. nigra. The total anthocyanin content varied to a lesser extent (Table 8), as only two species showed significant variation across the trial, namely T. officinale and T. majus. Whereas all the other species had constant values of anthocyanins during storage.

Antioxidant Activity during Postharvest

The antioxidant activity measured with the DPPH assay significantly increased in four species (A. ursinum, D. carthusianorum, L. angustifolia, L. vulgare), decreased in four species (C. officinalis, P. officinalis, R. canina, R. pendulina) and remained constant in the others during 14 days of storage (Table 9).
The antioxidant activity measured with the ABTS assay increased in 3 species (A. ursinum, D. carthusianorum, L. angustifolia) across the trial, decreased in P. officinalis and remained constant in the others.
Finally, the antioxidant activity measured with the FRAP assay throughout the trial increased in eight species (A. ursinum, B. officinalis, C. officinalis, C. cyanus, D. carthusianorum, L. angustifolia, L. vulgare, P. veris), decreased in three species (P. officinalis, R. pseudoacacia, T. majus) and remained constant in the others.

4. Discussion

4.1. Sensory Evaluation

In the present study, trained panelists have described the sensory profiles of 17 edible flower species. Sensory analyses or hedonistic evaluations concerning edible flowers are few; previous studies concerned garlic, pansies, borage, calendula, and nasturtium, among the others [8,27,29,31,32,33,34,35,36]. Since sensory science is still evolving on these emergent food products, a common lexicon of organoleptic terminology was guaranteed by comparison with specific literature (Table 2), studying and preparing a sensory sheet with a reduced list of sensory descriptors to ease the judges’ evaluation and to describe the essential traits of the samples.
The detected sensory profiles were very different from each other in terms of the intensity of each descriptor, highlighting peculiar traits. Allium ursinum, D. carthusianorum, L. angustifolia, and L. vulgare were featured by a strong aroma (smell, herbaceous and specific flower aroma) but a poor taste (sweet, sour, bitter, and salt), while in C. intybus, P. officinalis, R. pseudoacacia, and R. pendulina, one of the taste descriptor overcame the aromatic traits. The other species (B. officinalis, C. officinalis, C. cyanus, P. veris, R. canina, S. pratensis. T. officinale, and T. majus) had medium or quite high aroma, and one predominant taste. Among these species, B. officinalis resulted in a poor sensory profile, confirming previous results [29], while other authors [31] conferred a very high score to sweet taste of B. officinalis, which resembled cucumber, despite not being very fragrant. Calendula officinalis also had a poor sensory profile, but an easy chewiness, which are in contrast with a previous report [31], where this flower had a notably bitter taste, not easy chewiness and an affinity to saffron taste.
Spiciness was the most variable descriptor out of the 10 considered, characterizing the profile of A. ursinum and T. majus, as recorded in previous reports [31,36].
Sensory analysis is essential to understand the potential and most suitable use and combination of each edible flower in the food industry. Differences between species in taste and aroma are ascribed to the different chemical composition of each flower, constituted by hundreds of compounds [14]. The fruity and floral aromas in flowers are, for example, due to the presence of volatile compounds such as ethyl octanoate, 1-hexanol, ρ-cymene, or β-myrecene [29], and flavonoids are responsible for the astringent and bitter taste of foods [97], while organic acids confer sour taste [98]. In this study, few correlations were found between sensory descriptors and higher presence of bioactive compounds (polyphenols and anthocyanins), except for a decreased intensity of salted taste. The multivariate analyses (e.g., PCA or PLS regression) are increasingly used in the sensory science in the attempt of highlighting the degree of contribution of each interdependent sensory attribute to the overall variability of data, or assessing the correlation between the sensory attributes and the analytical data [99,100,101,102,103,104].
In this study, the PCA output confirmed the wide variability of the species in terms of sensory traits, highlighting interesting taste and aroma intensities. However, the Q2 and R2 coefficients of PLS regression suggested that the current model does not fully elucidate the role of phytochemical compounds in the sensory profiles of the studied edible flowers. Despite the importance of bioactive compounds in human nutrition, they are still of difficult sensory perception and further studies are needed to understand which compounds are responsible for the taste and aroma of flowers. The phytochemical profile of edible flowers is affected by environmental and agronomic conditions [105,106] and it is of major importance to standardize the cultivation of each species in order to obtain a uniform food produce not only in terms of appearance, but also in terms of sensory profile, both highly affecting consumer preferences [2,35,36]. This would lead to better satisfy consumers, which are almost unaware of flowers as a food product, but are curious and willing to eat them [2,8,14,27,32,33,34,35].

4.2. Shelf Life

Fresh edible flowers are commonly considered highly perishable products, as they rapidly decay within few days after harvest [11,37,38]. Each species has different storage requirements [2], according to their moisture content and respiration rate [21]. Few studies examined the storage conditions of edible flowers, receiving much less attention than cut flowers, vegetables and fruits. An increasing number of trials are thus necessary to understand their postharvest requirements [11,37,38,46,107].
Thirteen species out of the 17 analyzed in this study were acceptable for seven days if stored at 4 °C in polypropylene boxes, agreeing with several reports that mostly indicated the limit of acceptance within one week of cold storage [21,37,38,45,107]. Among these, B. officinalis, which showed a seven-day shelf life, also spoiled when stored at 0, 2.5, or 5 °C in sealed polyethylene film bags [38], despite the orage flowers lasting two weeks at −2.5 °C [38] or only one day at 4 °C in another study [107].
Centaurea cyanus also lasted seven days; however, showed a satisfactorily shelf life for 12 days in another study [107]. D. carthusianorum showed an acceptable quality for seven days, similar to the more common edible carnation (Dianthus caryophyllus L.) in commercial packaging at 5 °C [107]. Salvia pratensis (seven-day shelf life) lasted more than the common sage (Salvia discolor Kunth, five days [21]), and Salvia hybrid (six days at 5 °C in controlled permeability films with 14 h of light [108]). Tropaeolum majus was acceptable for seven days, as observed also by [38] at 5 °C, but this flower could last two weeks if stored in the dark, in sealed polyethylene film bags at 0 and 2.5 °C [38]. The species with the longest shelf life were roses, as R. canina lasted 10 days and R. pendulina 14 days, being the most suitable for sale. Conversely, C. intybus and T. officinale were the least interesting products, not suitable for storage using the described experimental conditions, as the first one rapidly went rotten and the second one was suitable only on the day of harvest. There is evidence that these two species release ethylene [109,110], the hormone that affects the growth, development, and storage of many vegetables, fruits, and ornamental plants [111].
Despite the presence of ethylene can enhance coloration, it can also induce yellowing of green portions and softening, fostering the senescence of the stored material even at extremely low concentrations (30 ppb). The presence and dynamics of this plant growth regulator should be further investigated to understand its role during postharvest storage of C. intybus and T. officinale and generally all the edible flowers. During senescence, polyphenols are also possibly involved in affecting the visual quality of vegetable products. Most polyphenols are located in the vacuole of plant cells and once a physical stress or deteriorative process start, plant cells begin to break. Therefore, phenolic compounds mix with phenol peroxidases or polyphenol oxidase present in the cytoplasm and other cell organs, leading to the appearance of browning tissues [112].
Results indicated that the studied edible flowers maintained an acceptable visual quality for one week under cold storage while roses could last more. Further studies are thus necessary to explore the storage requirements of fresh edible flowers to maintain their good visual quality for longer periods and prevent flower damages (i.e., tissue browning, petal discoloration, or dehydration) [37,46].

4.3. Bioactive Compounds and Antioxidant Activity Dynamics

In this study, P. officinalis, R. canina, and R. pendulina had the highest values in polyphenols and antioxidant activity at harvest, confirming previous results on the same species [13,22,113,114,115]. Comparing the total phenolic compounds with previous studies, the range of values detected (76.41–1270.72 mg GAE/100 g FW) is in accordance with that found in 51 Chinese edible flowers [22] and in the methanolic extracts of five species [116]. Focusing on single species, B. officinalis polyphenols were similar to another research [15], but three-fold higher than another study [117]. Polyphenols in C. cyanus were not abundant, and 2.5-fold lower than the research of [9]. Results on P. officinalis were instead similar to that of the tree peony (Paeonia, section Moutan) cultivars [114]. Data of S. nigra polyphenols were three-fold lower than previously evaluated [118] and finally, the phenolic content of T. majus and P. veris was concordant with other reports on the same species [5,59]. Regarding anthocyanins, S. pratensis and T. majus showed the highest content, probably thanks to their bright blue and red-orange colors, determined by these phytochemicals [119]. However, comparisons with other studies are difficult for the lack of information on the 17 studied species.
Most of the 17 species had FRAP values similar to Chinese edible flowers [22], except for P. officinalis, both roses and T. majus, which showed higher levels of antioxidant activity with this assay. Cichorium intybus had threefold higher FRAP activity than the ethanolic extracts of the same species [18], while for S. nigra flowers similar values were reported [18]. The ranges of the radical scavenging assays (DPPH and ABTS) were also comparable to literature, except again for P. officinalis and roses which had higher values in this study. Conversely, C. officinalis FRAP and DPPH values and T. majus DPPH and ABTS values resulted lower than previous studies [64,120]. At harvest, our data support previous reports [17,23,115,116,121], indicating that the antioxidant activity is highly correlated with the phenolic pattern, as the polyphenols are among the main phytochemicals responsible for the antioxidant activity [7,23].
Polyphenol content in plant organs depends on several preharvest factors, mainly related to environmental and stress conditions, since they are principally produced as a defense against pathogens and solar radiation [122]. Some polyphenols are present in all plant products, while others are specific to particular foods, but mostly, plants have complex mixtures of phenolic compounds, which are often poorly characterized and can behave differently during storage and ripening. Few trials have been performed so far on the dynamics of bioactive compounds and antioxidant activity in edible flowers during storage, as the visual quality has been the most frequent evaluated parameter [11]. According to some authors [21], cold storage could affect the bioactive compounds of edible flowers. A reduction in total phenolic content in squash (Cucurbita pepo L.) flowers during storage at 5 °C was found [44], while no variations were detected in A. oleracea and B. semperflorens flowers stored at 4 °C [21,123]. Total polyphenol content and DPPH clearance activity changed slight in daylily flowers (Hemerocallis lilioasphodelus L.) during four days at 4 °C [43]. However, during storage throughout 20 days at 4 °C, the content of bioactive compounds and the antioxidant activity measured with DPPH assay increased in pansies [107]. In addition to differences among species, a comparison between edible flowers in plastic boxes and flow packs (stored at 4 °C) showed that the phytochemical content can also vary according to the packaging during postharvest [45].
In this study, the content of bioactive compounds differed considering the two-week trial, as polyphenols followed a different trend according to the species. Anthocyanins were less variable during storage, with no changes in 15 of the examined species, suggesting that anthocyanins were not influenced by cold storage. Among the antioxidant assays, ABTS values were the least variable, varying in only four species across the trial. Interestingly, S. pratensis was the only species where no variations in the five evaluated parameters occurred during the trial. Tropaeolum majus phenolic content and S. pratensis anthocyanin content were stable during storage, conversely to previous studies [21,108]. In addition, we recorded a decrease in anthocyanins and in antioxidant activity (especially for the FRAP assay) of nasturtium, conversely to previous findings [21].
The limit of visual acceptance was recorded at day 7 for most of the species (day 10 in R. canina and day 14 in R. pendulina). During the shelf life period, the total polyphenols slightly decreased in C. officinalis (−21.3%), P. officinalis (−4.9%), and R. pendulina (−12.5%), while increased to a higher extent in C. cyanus (+40.2%), D. carthusianorum (+43.7%), L. vulgare (+46.7%), P. veris (+26.4%), and R. canina (+30.6%). Generally, it has been seen that during ripening the concentration of phenolic acids decrease, while the anthocyanins increase. However, many factors can affect the content of polyphenols in plants, and different behavior have been recorded according to the species [124]. This can possibly be explained by the wide diversity of phenolic compounds that can be synthetized by plants, leading to different phenolic profiles [122]. In addition, if we consider that the dehydration of fresh material could occur during storage, affecting the amounts of bioactive compounds and antioxidant activity detected. Besides, an increased accumulation of phenolic compounds has been found to be related to exposure to ethylene in lettuce, asparagus, and parsnip during storage [111]. It is not currently known whether C. cyanus, D. carthusianorum, L. vulgare, P. veris, and R. canina produce ethylene except for the related species of carnation (Dianthus caryophyllus) and rose (Rosa bourboniana and Rosa hybrida), which are ethylene-sensitive [125,126,127]. Further investigations on this hormone production by edible flowers are thus needed to understand if and how it can affect phenolic dynamics during storage.
Polyphenols have also been found to decline (−46%) during the shelf life period of B. semperflorens (nine days), but was unaltered in V. cornuta (16 days) [45]. As per the antioxidant activity, the trend varied depending on the analytical method used; however, three species (A. ursinum, C. cyanus, and R. canina) showed increased values in all assays, DPPH (+99.6%, +59.1%, +34.3%), ABTS (+23%, +64.9%, +32.1%), and FRAP (+247.6%, +90.1%, +30.1%), compared to the day of harvest. A previous study [45] reported decreasing values in FRAP antioxidant activity during the flowers’ shelf life (−52% in B. semperflorens and −34% in V. cornuta).
Numerous structural, physiological, and biochemical changes occur during ripening of horticultural products, which is a complex process [128]. This process is influenced by endogenous and environmental factors, involving multiple transcription regulatory and biochemical pathways that are still need to be clarified [128]. So far, cold storage has been seen to successfully delay flower senescence and quality deterioration of edible flowers, by slowing the growth of microorganisms and the production of ethylene, and by reducing internal breakdown of tissues, respiration, water loss and wilting [11]. To fully understand flower senescence during postharvest, more information on the complex phytochemical profile of each species are needed. However, data of dynamics during postharvest suggest that the studied edible flowers can be valuable sources of bioactive compounds exerting antioxidant activity, also beyond the limit of acceptance for sale purposes. Decaying fresh flowers can be thus recovered and not wasted and can be proposed for the extraction of valuable bioactive compounds.

5. Conclusions

This study described for the first time the sensory profiles of several edible flower species. The methodology presented here might be useful for the selection of sensory descriptors and for giving an indication on the range intensity values concerning the flowers, even if data will have to be further confirmed in future studies. All the species were also investigated for their main phytochemical characteristics related to bioactive compounds, showing a wide variability between species. Generally, cold storage (4 °C) seemed not to have negative effects on the phytochemical compounds, as the total phenolic and anthocyanin contents remained almost unaltered or even increased across 14 days. Paeonia officinalis exhibited the highest values in four out of five characteristics (total polyphenols, DPPH, ABTS, FRAP). Nevertheless, P. officinalis is not currently cultivated for its flowers and in North-West Italy (where the flowers were sampled) is a protected species.
Similar interesting results have been obtained in commonly cultivated roses. Rosa canina and R. pendulina flowers had 10 and 14 days of shelf life at 4 °C in plastic boxes, respectively, being interesting products to be sold as edible flowers, with R. canina having the strongest smell and rose aroma intensity. The high polyphenol content of these species might be responsible for their bitter taste, which must be considered before consumption or preparation of foods. Salvia pratensis too could be easily marketable, as its values did not change in all five parameters assessed during seven days of storage and it is characterized by high smell intensity and easy chewability. Edible flowers can be stored satisfactorily at 4 °C for 7–14 days according to the species, and used to confer appeal and a wide range of tastes, aromas and sensory characteristics to dishes or food products. The preliminary results on the subjective evaluation should be confirmed in the future by specific consumer’s tests on a large number of individuals to provide indication of the possible final user’s judgement. Despite its availability, it is eaten in lower quantities than fruits and vegetables. However, flowers are confirmed as source of bioactive compounds with antioxidant activity, which can provide not only aesthetic beauty but also benefits for health, explaining the increasing number of studies on new food applications of edible flowers.

Supplementary Materials

The following are available online at https://www.mdpi.com/article/10.3390/horticulturae7070166/s1, Figure S1: Evaluation sheet developed for the Quantitative Descriptive Analysis of edible flowers. Figure S2: Spider charts with intensities (from 0 to 10) of each descriptor detected in the flowers of Allium ursinum, Borago officinalis, Calendula officinalis, Centaurea cyanus, Cichorium intybus, and Dianthus carthusianorum. Figure S3: Spider charts with intensities (from 0 to 10) of each descriptor detected in the flowers of Lavandula angustifolia, Leucanthemum vulgare, Paeonia officinalis, Primula veris, Robinia pseudoacacia, and Rosa canina. Figure S4: Spider charts with intensities (from 0 to 10) of each descriptor detected in the flowers of Rosa pendulina, Salvia pratensis, Sambucus nigra, Taraxacum officinale, and Tropaeolum majus.

Author Contributions

Conceptualization, V.S.; methodology, M.G.M., V.S.; investigation, S.D., M.G.M., N.M.F., M.C.; resources, V.S.; data curation, S.D., M.G.M., N.M.F., M.C.; writing—original draft preparation, S.D., M.G.M., N.M.F.; writing—review and editing, S.D., M.G.M., N.M.F., M.C., V.S.; supervision, V.S.; funding acquisition, V.S. All authors have read and agreed to the published version of the manuscript.

Funding

This research was supported by the program Interreg V-A Francia Italia Alcotra, project n. 1139: “ANTEA—Attività innovative per lo sviluppo della filiera transfrontaliera del fiore edule”.

Institutional Review Board Statement

Not applicable.

Informed Consent Statement

Not applicable.

Data Availability Statement

Data is contained within the article or Supplementary Material.

Acknowledgments

Regione Piemonte (Italy) is thanked for granting the sampling of flowers of the protected species Paeonia officinalis L. The authors thank Marie-Jeanne Welter and the Masters students of the Laboratory of Cultivation and Transformation of Aromatic Plants at the University of Turin for their help in collecting data during postharvest of edible flowers, and the Italian National Organization of Fruit’s Tasters (O.N.A.Frut) for performing the sensory evaluations.

Conflicts of Interest

The authors declare no conflict of interest.

References

  1. Mlcek, J.; Rop, O. Fresh edible flowers of ornamental plants—A new source of nutraceutical foods. Trends Food Sci. Technol. 2011, 22, 561–569. [Google Scholar] [CrossRef]
  2. Fernandes, L.; Casal, S.; Pereira, J.A.; Saraiva, J.A.; Ramalhosa, E. Edible flowers: A review of the nutritional, antioxidant, antimicrobial properties and effects on human health. J. Food Compos. Anal. 2017, 60, 38–50. [Google Scholar] [CrossRef]
  3. Scariot, V.; Gaino, W.; Demasi, S.; Caser, M.; Ruffoni, B. Flowers for edible gardens: Combinations of species and colours for northwestern Italy. Acta Hortic. 2018, 1215, 363–368. [Google Scholar] [CrossRef]
  4. Lim, T.K. Edible Medicinal and Non-Medicinal Plants. Volume 7, Flowers; Springer: Dordrecht, The Netherlands, 2014; ISBN 978-94-007-7394-3. [Google Scholar]
  5. Lim, T.K. Edible Medicinal and Non-Medicinal Plants. Volume 8, Flowers; Springer: Dordrecht, The Netherlands, 2014; ISBN 978-94-017-8747-5. [Google Scholar]
  6. Chitrakar, B.; Zhang, M.; Bhandari, B. Edible flowers with the common name “marigold”: Their therapeutic values and processing. Trends Food Sci. Technol. 2019, 89, 76–87. [Google Scholar] [CrossRef]
  7. Koike, A.; Barreira, J.C.M.; Barros, L.; Santos-Buelga, C.; Villavicencio, A.L.C.H.; Ferreira, I.C.F.R. Edible flowers of Viola tricolor L. as a new functional food: Antioxidant activity, individual phenolics and effects of gamma and electron-beam irradiation. Food Chem. 2015, 179, 6–14. [Google Scholar] [CrossRef]
  8. Chen, N.H.; Wei, S. Factors influencing consumers’ attitudes towards the consumption of edible flowers. Food Qual. Prefer. 2017, 56, 93–100. [Google Scholar] [CrossRef]
  9. Rop, O.; Mlcek, J.; Jurikova, T.; Neugebauerova, J.; Vabkova, J. Edible Flowers—A New Promising Source of Mineral Elements in Human Nutrition. Molecules 2012, 17, 6672–6683. [Google Scholar] [CrossRef]
  10. Cunningham, E. What nutritional contribution do edible flowers make? J. Acad. Nutr. Diet. 2015, 115, 856. [Google Scholar] [CrossRef]
  11. Fernandes, L.; Saraiva, J.A.; Pereira, J.A.; Casal, S.; Ramalhosa, E. Post-harvest technologies applied to edible flowers: A review. Food Rev. Int. 2019, 35, 132–154. [Google Scholar] [CrossRef]
  12. Falla, N.M.; Contu, S.; Demasi, S.; Caser, M.; Scariot, V. Environmental impact of edible flower production: A case study. Agronomy 2020, 10, 579. [Google Scholar] [CrossRef] [Green Version]
  13. Demasi, S.; Caser, M.; Donno, D.; Ravetto Enri, S.; Lonati, M.; Scariot, V. Exploring wild edible flowers as a source of bioactive compounds: New perspectives in horticulture. Folia Hortic. 2021, 33, 1–22. [Google Scholar] [CrossRef]
  14. Pires, T.C.S.P.; Barros, L.; Santos-Buelga, C.; Ferreira, I.C.F.R. Edible flowers: Emerging components in the diet. Trends Food Sci. Technol. 2019, 93, 244–258. [Google Scholar] [CrossRef]
  15. Grzeszczuk, M.; Stefaniak, A.; Pachlowska, A. Biological value of various edible flower species. Sci. Pol. 2016, 15, 109–119. [Google Scholar]
  16. González-Barrio, R.; Periago, M.J.; Luna-Recio, C.; Garcia-Alonso, F.J.; Navarro-González, I. Chemical composition of the edible flowers, pansy (Viola wittrockiana) and snapdragon (Antirrhinum majus) as new sources of bioactive compounds. Food Chem. 2018, 252, 373–380. [Google Scholar] [CrossRef]
  17. Kaisoon, O.; Konczak, I.; Siriamornpun, S. Potential health enhancing properties of edible flowers from Thailand. Food Res. Int. 2012, 46, 563–571. [Google Scholar] [CrossRef]
  18. Loizzo, M.R.; Pugliese, A.; Bonesi, M.; Tenuta, M.C.; Menichini, F.; Xiao, J.; Tundis, R. Edible flowers: A rich source of phytochemicals with antioxidant and hypoglycemic properties. J. Agric. Food Chem. 2016, 64, 2467–2474. [Google Scholar] [CrossRef]
  19. Ceccanti, C.; Landi, M.; Benvenuti, S.; Pardossi, A.; Guidi, L. Mediterranean wild edible plants: Weeds or “new functional crops”. Molecules 2018, 23, 2299. [Google Scholar] [CrossRef] [Green Version]
  20. Durazzo, A.; Lucarini, M.; Souto, E.B.; Cicala, C.; Caiazzo, E.; Izzo, A.A.; Novellino, E.; Santini, A. Polyphenols: A concise overview on the chemistry, occurrence, and human health. Phyther. Res. 2019, 33, 2221–2243. [Google Scholar] [CrossRef] [Green Version]
  21. Landi, M.; Ruffoni, B.; Combournac, L.; Guidi, L. Nutraceutical value of edible flowers upon cold storage. Ital. J. Food Sci. 2018, 30, 336–347. [Google Scholar] [CrossRef]
  22. Li, A.-N.; Li, S.; Li, H.-B.; Xu, D.-P.; Xu, X.-R.; Chen, F. Total phenolic contents and antioxidant capacities of 51 edible and wild flowers. J. Funct. Foods 2014, 6, 319–330. [Google Scholar] [CrossRef]
  23. Lu, B.; Li, M.; Yin, R. Phytochemical content, health benefits, and toxicology of common edible flowers: A review (2000–2015). Crit. Rev. Food Sci. Nutr. 2016, 56, S130–S148. [Google Scholar] [CrossRef]
  24. Zheng, J.; Yu, X.; Maninder, M.; Xu, B. Total phenolics and antioxidants profiles of commonly consumed edible flowers in China. Int. J. Food Prop. 2018, 21, 1524–1540. [Google Scholar] [CrossRef] [Green Version]
  25. Fernandes, L.; Casal, S.; Pereira, J.A.; Saraiva, J.A.; Ramalhosa, E. An overview on the market of edible flowers. Food Rev. Int. 2020, 36, 258–275. [Google Scholar] [CrossRef]
  26. Bursać, D.; Vahčić, N.; Levaj, B.; Dragović-Uzelac, V.; Biško, A. The influence of cultivar on sensory profiles of fresh and processed strawberry fruits grown in Croatia. Flavour Fragr. J. 2007, 22, 512–520. [Google Scholar] [CrossRef]
  27. Rodrigues, H.; Cielo, D.P.; Goméz-Corona, C.; Silveira, A.A.S.; Marchesan, T.A.; Galmarini, M.V.; Richards, N.S.P.S. Eating flowers? Exploring attitudes and consumers’ representation of edible flowers. Food Res. Int. 2017, 100, 227–234. [Google Scholar] [CrossRef]
  28. Lawless, H.T.; Heymann, H. Sensory Evaluation of Food-Principles and Practices; Food Science Text Series; Springer: New York, NY, USA, 2010; Volume 24, ISBN 978-1-4419-6487-8. [Google Scholar]
  29. Fernandes, L.; Casal, S.; Pereira, J.A.; Malheiro, R.; Rodrigues, N.; Saraiva, J.A.; Ramalhosa, E. Borage, calendula, cosmos, Johnny Jump up, and pansy flowers: Volatiles, bioactive compounds, and sensory perception. Eur. Food Res. Technol. 2019, 245, 593–606. [Google Scholar] [CrossRef] [Green Version]
  30. Sharif, M.K.; Butt, M.S.; Sharif, H.R.; Nasir, M. Sensory Evaluation and Consumer Acceptability. In Handbook of Food Science and Technology; University of Agriculture: Faisalabad, Pakistan, 2017; pp. 362–386. [Google Scholar]
  31. Benvenuti, S.; Bortolotti, E.; Maggini, R. Antioxidant power, anthocyanin content and organoleptic performance of edible flowers. Sci. Hortic. 2016, 199, 170–177. [Google Scholar] [CrossRef]
  32. Kelley, K.M.; Behe, B.K.; Biernbaum, J.A.; Poff, K.L. Consumer preference for edible-flower color, container size, and price. HortScience 2001, 36, 801–804. [Google Scholar] [CrossRef]
  33. Kelley, K.M.; Behe, B.K.; Biernbaum, J.A.; Poff, K.L. Consumer and professional chef perceptions of three edible-flower species. HortScience 2001, 36, 162–166. [Google Scholar] [CrossRef] [Green Version]
  34. Kelley, K.M.; Behe, B.K.; Biernbaum, J.A.; Poff, K.L. Combinations of colors and species of containerized edible flowers: Effect on consumer preferences. HortScience 2002, 37, 218–221. [Google Scholar] [CrossRef] [Green Version]
  35. Simoni, N.K.; Santos, F.F.; Andrade, T.A.; Villavicencio, A.L.C.H.; Pinto-e-Silva, M.E.M. The use of edible flowers in human food: Sensory analysis of preparations. ETP Int. J. Food Eng. 2018, 140–143. [Google Scholar] [CrossRef]
  36. D’Antuono, L.F.; Manco, M.A. Preliminary sensory evaluation of edible flowers from wild Allium species. J. Sci. Food Agric. 2013, 93, 3520–3523. [Google Scholar] [CrossRef] [PubMed]
  37. Kou, L.; Turner, E.R.; Luo, Y. Extending the shelf life of edible flowers with controlled release of 1-Methylcyclopropene and modified atmosphere packaging. J. Food Sci. 2012, 77, S188–S193. [Google Scholar] [CrossRef] [PubMed]
  38. Kelley, K.M.; Cameron, A.C.; Biernbaum, J.A.; Poff, K.L. Effect of storage temperature on the quality of edible flowers. Postharvest Biol. Technol. 2003, 27, 341–344. [Google Scholar] [CrossRef]
  39. Flores-López, M.L.; Cerqueira, M.A.; de Rodríguez, D.J.; Vicente, A.A. Perspectives on utilization of edible coatings and nano-laminate coatings for extension of postharvest storage of fruits and vegetables. Food Eng. Rev. 2016, 8, 292–305. [Google Scholar] [CrossRef] [Green Version]
  40. Edelman, N.F.; Jones, M.L. Evaluating ethylene sensitivity within the family Solanaceae at different developmental stages. HortScience 2014, 49, 628–636. [Google Scholar] [CrossRef] [Green Version]
  41. Edelman, N.F.; Kaufman, B.A.; Jones, M.L. Comparative evaluation of seedling hypocotyl elongation and mature plant assays for determining ethylene sensitivity in bedding plants. HortScience 2014, 49, 472–480. [Google Scholar] [CrossRef] [Green Version]
  42. Macnish, A.J.; Jiang, C.-Z.; Negre-Zakharov, F.; Reid, M.S. Physiological and molecular changes during opening and senescence of Nicotiana mutabilis flowers. Plant Sci. 2010, 179, 267–272. [Google Scholar] [CrossRef]
  43. Liu, W.; Zhang, J.; Zhang, Q.; Shan, Y. Effects of postharvest chilling and heating treatments on the sensory quality and antioxidant system of daylily flowers. Hortic. Environ. Biotechnol. 2018, 59, 671–685. [Google Scholar] [CrossRef]
  44. Aquino-Bolaños, E.N.; Urrutia-Hernández, T.A.; López Del Castillo-Lozano, M.; Chavéz-Servia, J.L.; Verdalet-Guzmán, I. Physicochemical parameters and antioxidant compounds in edible squash (Cucurbita pepo) flower stored under controlled atmospheres. J. Food Qual. 2013, 36, 302–308. [Google Scholar] [CrossRef]
  45. Demasi, S.; Falla, N.M.; Caser, M.; Scariot, V. Postharvest aptitude of Begonia semperflorens and Viola cornuta edible flowers. Adv. Hortic. Sci. 2020, 34, 13–20. [Google Scholar] [CrossRef]
  46. Chrysargyris, A.; Tzionis, A.; Xylia, P.; Tzortzakis, N. Effects of salinity on tagetes growth, physiology, and shelf life of edible flowers stored in passive modified atmosphere packaging or treated with ethanol. Front. Plant Sci. 2018, 871. [Google Scholar] [CrossRef] [Green Version]
  47. Pavlović, D.R.; Veljković, M.; Stojanović, N.M.; Gočmanac-Ignjatović, M.; Mihailov-Krstev, T.; Branković, S.; Sokolović, D.; Marčetić, M.; Radulović, N.; Radenković, M. Influence of different wild-garlic (Allium ursinum) extracts on the gastrointestinal system: Spasmolytic, antimicrobial and antioxidant properties. J. Pharm. Pharmacol. 2017, 69, 1208–1218. [Google Scholar] [CrossRef]
  48. Bombicz, M.; Priksz, D.; Varga, B.; Kurucz, A.; Kertész, A.; Takacs, A.; Posa, A.; Kiss, R.; Szilvassy, Z.; Juhasz, B. A novel therapeutic approach in the treatment of pulmonary arterial hypertension: Allium ursinum liophylisate alleviates symptoms comparably to Sildenafil. Int. J. Mol. Sci. 2017, 18, 1436. [Google Scholar] [CrossRef] [Green Version]
  49. Sobolewska, D.; Podolak, I.; Makowska-Wąs, J. Allium ursinum: Botanical, phytochemical and pharmacological overview. Phytochem. Rev. 2015, 14, 81–97. [Google Scholar] [CrossRef] [Green Version]
  50. Karimi, E.; Oskoueian, E.; Karimi, A.; Noura, R.; Ebrahimi, M. Borago officinalis L. flower: A comprehensive study on bioactive compounds and its health-promoting properties. J. Food Meas. Charact. 2018, 12, 826–838. [Google Scholar] [CrossRef]
  51. Ukiya, M.; Akihisa, T.; Yasukawa, K.; Tokuda, H.; Suzuki, T.; Kimura, Y. Anti-inflammatory, anti-tumor-promoting, and cytotoxic activities of constituents of marigold (Calendula officinalis) flowers. J. Nat. Prod. 2006, 69, 1692–1696. [Google Scholar] [CrossRef]
  52. Muley, B.P.; Khadabadi, S.S.; Banarase, N.B. Phytochemical constituents and pharmacological activities of Calendula officinalis L. (Asteraceae): A review. Trop. J. Pharm. Res. 2009, 8, 455–465. [Google Scholar] [CrossRef] [Green Version]
  53. Palma, L. Le Piante Medicinali d’Italia; Società Editrice Internazionale: Torino, Italy, 1964. [Google Scholar]
  54. Rashed, M.M.A.; Tong, Q.; Nagi, A.; Li, J.; Khan, N.U.; Chen, L.; Rotail, A.; Bakry, A.M. Isolation of essential oil from Lavandula angustifolia by using ultrasonic-microwave assisted method preceded by enzymolysis treatment, and assessment of its biological activities. Ind. Crops Prod. 2017, 100, 236–245. [Google Scholar] [CrossRef]
  55. Facciola, S. Cornucopia: A Source Book of Edible Plants; Kampong Publications: Vista, CA, USA, 1990; ISBN 0-9628087-0-9. [Google Scholar]
  56. Magharri, E.; Razavi, S.M.; Ghorbani, E.; Nahar, L.; Sarker, S.D. Chemical composition, some allelopathic aspects, free-radical-scavenging property and antifungal activity of the volatile oil of the flowering tops of Leucanthemum vulgare Lam. Rec. Nat. Prod. 2015, 9, 538–545. [Google Scholar]
  57. Chen, Z.; Li, X.-P.; Li, Z.-J.; Xu, L.; Li, X.-M. Reduced hepatotoxicity by total glucosides of paeony in combination treatment with leflunomide and methotrexate for patients with active rheumatoid arthritis. Int. Immunopharmacol. 2013, 15, 474–477. [Google Scholar] [CrossRef] [PubMed]
  58. Ghédira, K.; Goetz, P. Pivoine Paeonia officinalis L. (Paeoniaceae). Phytothérapie 2015, 13, 328–331. [Google Scholar] [CrossRef]
  59. Tünde, J.; Eleonora, M.; Laura, V.; Neagu, O.; Annamária, P. Bioactive compounds and antioxidant capacity of Primula veris L. flower extracts. Ecotoxicologie Zooteh. Ind. 2015, 15B, 235–242. [Google Scholar]
  60. Lattanzio, F.; Greco, E.; Carretta, D.; Cervellati, R.; Govoni, P.; Speroni, E. In vivo anti-inflammatory effect of Rosa canina L. extract. J. Ethnopharmacol. 2011, 137, 880–885. [Google Scholar] [CrossRef] [PubMed]
  61. Guarrera, P.M.; Savo, V. Wild food plants used in traditional vegetable mixtures in Italy. J. Ethnopharmacol. 2016, 185, 202–234. [Google Scholar] [CrossRef]
  62. Schütz, K.; Carle, R.; Schieber, A. Taraxacum—A review on its phytochemical and pharmacological profile. J. Ethnopharmacol. 2006, 107, 313–323. [Google Scholar] [CrossRef]
  63. Martinez, M.; Poirrier, P.; Chamy, R.; Prüfer, D.; Schulze-Gronover, C.; Jorquera, L.; Ruiz, G. Taraxacum officinale and related species—An ethnopharmacological review and its potential as a commercial medicinal plant. J. Ethnopharmacol. 2015, 169, 244–262. [Google Scholar] [CrossRef]
  64. Garzón, G.A.; Wrolstad, R.E. Major anthocyanins and antioxidant activity of Nasturtium flowers (Tropaeolum majus). Food Chem. 2009, 114, 44–49. [Google Scholar] [CrossRef]
  65. Bazylko, A.; Granica, S.; Filipek, A.; Piwowarski, J.; Stefańska, J.; Osińska, E.; Kiss, A.K. Comparison of antioxidant, anti-inflammatory, antimicrobial activity and chemical composition of aqueous and hydroethanolic extracts of the herb of Tropaeolum majus L. Ind. Crops Prod. 2013, 50, 88–94. [Google Scholar] [CrossRef]
  66. Canterino, S.; Donno, D.; Mellano, M.G.; Beccaro, G.L.; Bounous, G. Nutritional and sensory survey of Citrus sinensis (L.) cultivars grown at the most northern limit of the mediterranean latitude. J. Food Qual. 2012, 35, 108–118. [Google Scholar] [CrossRef]
  67. Donno, D.; Beccaro, G.L.; Mellano, M.G.; Torello Marinoni, D.; Cerutti, A.K.; Canterino, S.; Bounous, G. Application of sensory, nutraceutical and genetic techniques to create a quality profile of ancient apple cultivars. J. Food Qual. 2012, 35, 169–181. [Google Scholar] [CrossRef]
  68. Kemp, S.E.; Hollowood, T.; Hort, J. Sensory Evaluation: A Practical Handbook; John Wiley & Sons, Ltd.: Chichester, UK, 2009; ISBN 978-1-405-16210-4. [Google Scholar]
  69. Meilgaard, M.; Civille, G.V.; Carr, B.T. Sensory Evaluation Techniques; CRC Press: Boca Raton, FL, USA, 1999; ISBN 9780849302763. [Google Scholar]
  70. Stone, H.; Sidel, J.; Oliver, S.; Woolsey, A.; Singleton, R.C. Sensory evaluation by Quantitative Descriptive Analysis. In Descriptive Sensory Analysis in Practice; Food & Nutrition Press, Inc.: Trumbull, CT, USA, 2008; pp. 23–34. [Google Scholar]
  71. De Biaggi, M.; Rapalino, S.; Donno, D.; Mellano, M.G.; Beccaro, G.L. Genotype influence on chemical composition and sensory traits of chestnut in 18 cultivars grown on the same rootstock and at the same agronomic conditions. Acta Hortic. 2018, 215–220. [Google Scholar] [CrossRef]
  72. Mellano, M.G.; Carli, C.; Folini, L.; Draicchio, P.; Beccaro, G. Training of two groups of tasters for the creation of sensory profiles of highbush blueberry cultivars grown in Northern Italy. Acta Hortic. 2009, 810, 835–840. [Google Scholar] [CrossRef]
  73. Mellano, M.G.; Rapalino, S.; Donno, D. Profili sensoriali di cultivar di Castanea sativa e ibridi eurogiapponesi (in Italian). Castanea 2017, 9, 8–9. [Google Scholar]
  74. Montevecchi, G.; Mellano, M.G.; Simone, G.V.; Masino, F.; Bignami, C.; Antonelli, A. Physico-chemical and sensory characterization of pescabivona P.G.I., A sicilian white flesh peach cultivar [Prunus persica (L.) batsch]: A case study. In Apricots and Peaches: Nutritional Properties, Post-Harvest Management and Potential Health Benefits; Nova Science Publishers, Inc.: New York, NY, USA, 2016; pp. 93–124. ISBN 9781634846851. [Google Scholar]
  75. Tobin, R.; Moane, S.; Larkin, T. Sensory evaluation of organic and conventional fruits and vegetables available to Irish consumers. Int. J. Food Sci. Technol. 2013, 48, 157–162. [Google Scholar] [CrossRef]
  76. Zhao, X.; Chambers, E., IV; Matta, Z.; Loughin, T.M.; Carey, E.E. Consumer sensory analysis of organically and conventionally grown vegetables. J. Food Sci. 2007, 72, S87–S91. [Google Scholar] [CrossRef]
  77. Caser, M.; Demasi, S.; Stelluti, S.; Donno, D.; Scariot, V. Crocus sativus L. cultivation in alpine environments: Stigmas and tepals as source of bioactive compounds. Agronomy 2020, 10, 1473. [Google Scholar] [CrossRef]
  78. Singleton, V.L.; Orthofer, R.; Lamuela-Raventós, R.M. Analysis of total phenols and other oxidation substrates and antioxidants by means of folin-ciocalteu reagent. Methods Enzymol. 1999, 299, 152–178. [Google Scholar] [CrossRef]
  79. Caser, M.; Victorino, Í.M.M.; Demasi, S.; Berruti, A.; Donno, D.; Lumini, E.; Bianciotto, V.; Scariot, V. Saffron cultivation in marginal alpine environments: How AMF inoculation modulates yield and bioactive compounds. Agronomy 2019, 9, 12. [Google Scholar] [CrossRef] [Green Version]
  80. Lee, J.; Durst, R.W.; Wrolstad, R.E.; Eisele, T.; Giusti, M.M.; Hach, J.; Hofsommer, H.; Koswig, S.; Krueger, D.A.; Kupina, S.; et al. Determination of total monomeric anthocyanin pigment content of fruit juices, beverages, natural colorants, and wines by the pH differential method: Collaborative study. J. AOAC Int. 2005, 88, 1269–1278. [Google Scholar] [CrossRef] [Green Version]
  81. Wong, S.P.; Leong, L.P.; William Koh, J.H. Antioxidant activities of aqueous extracts of selected plants. Food Chem. 2006, 99, 775–783. [Google Scholar] [CrossRef]
  82. Benzie, I.F.F.; Strain, J.J. Ferric reducing/antioxidant power assay: Direct measure of total antioxidant activity of biological fluids and modified version for simultaneous measurement of total antioxidant power and ascorbic acid concentration. Methods Enzymol. 1998, 299, 15–27. [Google Scholar] [CrossRef]
  83. Hammer, Ø.; Harper, D.A.T.; Ryan, P.D. PAST: Paleontological statistics software package for education and data analysis. Palaeontol. Electron. 2001, 4, 9. [Google Scholar]
  84. Bachmanov, A.A. Genetic Architecture of Sweet Taste. In ACS Symposium Series; American Chemical Society: Washington, DC, USA, 2008; Volume 979, pp. 18–47. ISBN 978-0-84127-432-7. [Google Scholar]
  85. Beauchamp, G.K. Basic taste: A perceptual concept. J. Agric. Food Chem. 2019, 67, 13860–13869. [Google Scholar] [CrossRef] [PubMed]
  86. Shallenberger, R.S. Sugar structure and taste. In Advances in Chemistry; ACS Publications: Washington, DC, USA, 1973; pp. 256–263. ISBN 978-0-84120-178-1. [Google Scholar]
  87. Zarzo, M. A sensory 3D map of the odor description space derived from a comparison of numeric odor profile databases. Chem. Senses 2015, 40, 305–313. [Google Scholar] [CrossRef] [PubMed] [Green Version]
  88. Forde, C.G.; van Kuijk, N.; Thaler, T.; de Graaf, C.; Martin, N. Oral processing characteristics of solid savoury meal components, and relationship with food composition, sensory attributes and expected satiation. Appetite 2013, 60, 208–219. [Google Scholar] [CrossRef]
  89. Drewnowski, A. The science and complexity of bitter taste. Nutr. Rev. 2009, 59, 163–169. [Google Scholar] [CrossRef]
  90. Simat, T. Panel Training on Odour and Aroma Perception for Sensory Analysis. Available online: https://www.dlg.org/en/food/topics/dlg-expert-reports/sensory-technology/dlg-expert-report-1-2017/ (accessed on 27 October 2017).
  91. Vieira, P.M. Avaliação da Composição Química, dos Compostos Bioativos e da Atividade Antioxidante Em Seis Espécies de Flores Comestíveis, Universidade Estadual Paulista “Júlio De Mesquita Filho”. 2013. Available online: http://hdl.handle.net/11449/100866 (accessed on 27 October 2017).
  92. Byrnes, N.K. The Influence of Experience and Personality on the Perception, Liking, and Intake of Spicy Foods; Pennsylvania State University: State College, PA, USA, 2014. [Google Scholar]
  93. Yang, P.; Song, H.; Wang, L.; Jing, H. Characterization of key Aroma-active compounds in black garlic by sensory-directed flavor analysis. J. Agric. Food Chem. 2019, 67, 7926–7934. [Google Scholar] [CrossRef]
  94. Ashok, P.K.; Upadhyaya, K. Tannins are astringent. J. Pharmacogn. Phytochem. 2012, 1, 45–50. [Google Scholar]
  95. Noble, A.C. Astringency and Bitterness of Flavonoid Phenols. In Chemistry of Taste; ACS Symposium Series; ACS Publications: Washington, DC, USA, 2002; Volume 825, pp. 192–201. [Google Scholar]
  96. Ma, W.; Guo, A.; Zhang, Y.; Wang, H.; Liu, Y.; Li, H. A review on astringency and bitterness perception of tannins in wine. Trends Food Sci. Technol. 2014, 40, 6–19. [Google Scholar] [CrossRef]
  97. Dinnella, C.; Recchia, A.; Tuorila, H.; Monteleone, E. Individual astringency responsiveness affects the acceptance of phenol-rich foods. Appetite 2011, 56, 633–642. [Google Scholar] [CrossRef]
  98. Neta, E.R.D.C.; Johanningsmeier, S.D.; McFeeters, R.F. The chemistry and physiology of sour taste—A review. J. Food Sci. 2007, 72, R33–R38. [Google Scholar] [CrossRef]
  99. Rocha, I.F.D.O.; Bolini, H.M.A. Passion fruit juice with different sweeteners: Sensory profile by descriptive analysis and acceptance. Food Sci. Nutr. 2015, 3, 129–139. [Google Scholar] [CrossRef]
  100. Melgarejo, P.; Calín-Sánchez, Á.; Carbonell-Barrachina, Á.A.; Martínez-Nicolás, J.J.; Legua, P.; Martínez, R.; Hernández, F. Antioxidant activity, volatile composition and sensory profile of four new very-early apricots (Prunus armeniaca L.). J. Sci. Food Agric. 2014, 94, 85–94. [Google Scholar] [CrossRef]
  101. Hernández, F.; Noguera-Artiaga, L.; Burló, F.; Wojdyło, A.; Carbonell-Barrachina, Á.A.; Legua, P. Physico-chemical, nutritional, and volatile composition and sensory profile of Spanish jujube (Ziziphus jujuba Mill.) fruits. J. Sci. Food Agric. 2016, 96, 2682–2691. [Google Scholar] [CrossRef]
  102. Kirsanov, D.; Mednova, O.; Vietoris, V.; Kilmartin, P.A.; Legin, A. Towards reliable estimation of an “electronic tongue” predictive ability from PLS regression models in wine analysis. Talanta 2012, 90, 109–116. [Google Scholar] [CrossRef]
  103. Cheong, M.W.; Liu, S.Q.; Zhou, W.; Curran, P.; Yu, B. Chemical composition and sensory profile of pomelo (Citrus grandis (L.) Osbeck) juice. Food Chem. 2012, 135, 2505–2513. [Google Scholar] [CrossRef]
  104. Pinto, T.; Vilela, A.; Pinto, A.; Nunes, F.M.; Cosme, F.; Anjos, R. Influence of cultivar and of conventional and organic agricultural practices on phenolic and sensory profile of blackberries (Rubus fruticosus). J. Sci. Food Agric. 2018, 98, 4616–4624. [Google Scholar] [CrossRef]
  105. Najar, B.; Demasi, S.; Caser, M.; Gaino, W.; Cioni, P.L.; Pistelli, L.; Scariot, V. Cultivation substrate composition influences morphology, volatilome and essential oil of Lavandula angustifolia Mill. Agronomy 2019, 9, 411. [Google Scholar] [CrossRef] [Green Version]
  106. Caser, M.; Demasi, S.; Victorino, Í.M.M.; Donno, D.; Faccio, A.; Lumini, E.; Bianciotto, V.; Scariot, V. Arbuscular mycorrhizal fungi modulate the crop performance and metabolic profile of saffron in soilless cultivation. Agronomy 2019, 9, 232. [Google Scholar] [CrossRef] [Green Version]
  107. Fernandes, L.; Casal, S.; Pereira, J.A.; Pereira, E.L.; Ramalhosa, E.; Saraiva, J.A. Effect of high hydrostatic pressure on the quality of four edible flowers: Viola × wittrockiana, Centaurea cyanus, Borago officinalis and Camellia japonica. Int. J. Food Sci. Technol. 2017, 52, 2455–2462. [Google Scholar] [CrossRef] [Green Version]
  108. Landi, M.; Ruffoni, B.; Salvi, D.; Savona, M.; Guidi, L. Cold storage does not affect ascorbic acid and polyphenolc content of edible flowers of a new hybrid of sage. Agrochimica 2015, 59, 348–357. [Google Scholar] [CrossRef]
  109. Stewart-Wade, S.M.; Neumann, S.; Collins, L.L.; Boland, G.J. The biology of Canadian weeds. 117 Taraxacum officinale G. H. Weber ex Wiggers. Can. J. Plant Sci. 2002, 82, 825–853. [Google Scholar] [CrossRef] [Green Version]
  110. Sadeghi, H.; Ghanaatiyan, K. Probing the responses of four chicory ecotypes by ethylene accumulation and growth characteristics under drought stress. Ital. J. Agron. 2017, 12, 177–182. [Google Scholar] [CrossRef] [Green Version]
  111. Saltveit, M.E. Effect of ethylene on quality of fresh fruits and vegetables. Postharvest Biol. Technol. 1999, 15, 279–292. [Google Scholar] [CrossRef]
  112. Toivonen, P.M.A.; Brummell, D.A. Biochemical bases of appearance and texture changes in fresh-cut fruit and vegetables. Postharvest Biol. Technol. 2008, 48, 1–14. [Google Scholar] [CrossRef]
  113. Kumar, N.; Bhandari, P.; Singh, B.; Bari, S.S. Antioxidant activity and ultra-performance LC-electrospray ionization-quadrupole time-of-flight mass spectrometry for phenolics-based fingerprinting of Rose species: Rosa damascena, Rosa bourboniana and Rosa brunonii. Food Chem. Toxicol. 2009, 47, 361–367. [Google Scholar] [CrossRef]
  114. Fan, J.; Zhu, W.; Kang, H.; Ma, H.; Tao, G. Flavonoid constituents and antioxidant capacity in flowers of different Zhongyuan tree penoy cultivars. J. Funct. Foods 2012, 4, 147–157. [Google Scholar] [CrossRef]
  115. Xiong, L.; Yang, J.; Jiang, Y.; Lu, B.; Hu, Y.; Zhou, F.; Mao, S.; Shen, C. Phenolic compounds and antioxidant capacities of 10 common edible flowers from China. J. Food Sci. 2014, 79, C517–C525. [Google Scholar] [CrossRef]
  116. Petrova, I.; Petkova, N.; Ivanov, I. Five edible flowers—Valuable source of antioxidants in human nutrition. Int. J. Pharmacogn. Phytochem. Res. 2016, 8, 604–610. [Google Scholar]
  117. Aliakbarlu, J.; Tajik, H. Antioxidant and antibacterial activities of various extracts of Borago officinalis flowers. J. Food Process. Preserv. 2012, 36, 539–544. [Google Scholar] [CrossRef]
  118. Młynarczyk, K.; Walkowiak-Tomczak, D.; Łysiak, G.P. Bioactive properties of Sambucus nigra L. as a functional ingredient for food and pharmaceutical industry. J. Funct. Foods 2018, 40, 377–390. [Google Scholar] [CrossRef]
  119. Khoo, H.E.; Azlan, A.; Tang, S.T.; Lim, S.M. Anthocyanidins and anthocyanins: Colored pigments as food, pharmaceutical ingredients, and the potential health benefits. Food Nutr. Res. 2017, 61, 1361779. [Google Scholar] [CrossRef] [Green Version]
  120. Butnariu, M.; Coradini, C.Z. Evaluation of biologically active compounds from Calendula officinalis flowers using spectrophotometry. Chem. Cent. J. 2012, 6, 35. [Google Scholar] [CrossRef] [Green Version]
  121. Ji, H.F.; Du, A.L.; Zhang, L.W.; Xu, C.Y.; Yang, M.D.; Li, F.F. Effects of drying methods on antioxidant properties in Robinia pseudoacacia L. flowers. J. Med. Plants Res. 2012, 6. [Google Scholar] [CrossRef]
  122. Manach, C.; Scalbert, A.; Morand, C.; Rémésy, C.; Jiménez, L. Polyphenols: Food sources and bioavailability. Am. J. Clin. Nutr. 2004, 79, 727–747. [Google Scholar] [CrossRef] [Green Version]
  123. Friedman, H.; Rot, I.; Agami, O.; Vinokur, Y.; Rodov, V.; Reznick, N.; Umiel, N.; Dori, I.; Ganot, L.; Shmuel, D.; et al. Edible flowers: New crops with potential health benefits. Acta Hortic. 2007, 755, 283–290. [Google Scholar] [CrossRef]
  124. D’Archivio, M.; Filesi, C.; Varì, R.; Scazzocchio, B.; Masella, R. Bioavailability of the Polyphenols: Status and Controversies. Int. J. Mol. Sci. 2010, 11, 1321–1342. [Google Scholar] [CrossRef]
  125. Pun, U.K.; Yamada, T.; Tanase, K.; Shimizu-Yumoto, H.; Satoh, S.; Ichimura, K. Effect of ethanol on ethylene biosynthesis and sensitivity in cut carnation flowers. Postharvest Biol. Technol. 2014, 98, 30–33. [Google Scholar] [CrossRef]
  126. Khatami, F.; Najafi, F.; Yari, F.; Khavari-Nejad, R.A. Expression of etr1-1 gene in transgenic Rosa hybrida L. increased postharvest longevity through reduced ethylene biosynthesis and perception. Sci. Hortic. 2020, 263, 109103. [Google Scholar] [CrossRef]
  127. Singh, P.; Bharti, N.; Singh, A.P.; Tripathi, S.K.; Pandey, S.P.; Chauhan, A.S.; Kulkarni, A.; Sane, A.P. Petal abscission in fragrant roses is associated with large scale differential regulation of the abscission zone transcriptome. Sci. Rep. 2020, 10, 17196. [Google Scholar] [CrossRef]
  128. Gong, T.; Li, C.; Bian, B.; Wu, Y.; Dawuda, M.M.; Liao, W. Advances in application of small molecule compounds for extending the shelf life of perishable horticultural products: A review. Sci. Hortic. 2018, 230, 25–34. [Google Scholar] [CrossRef]
Figure 1. Seventeen edible flowers selected for the study. From left to right, first line: Allium ursinum L., Borago officinalis L., Calendula officinalis L., Centaurea cyanus L., Cichorium intybus L., Dianthus carthusianorum L.; second line: Lavandula angustifolia Mill., Leucanthemum vulgare (Vaill.) Lam., Paeonia officinalis L., Primula veris L., Robinia pseudoacacia L., Rosa canina L.; third line: Rosa pendulina L., Salvia pratensis L., Sambucus nigra L., Taraxacum officinale Weber, Tropaeolum majus L.
Horticulturae 07 00166 g001
Figure 2. PCA biplot of the sensory descriptors of 17 edible flowers.
Horticulturae 07 00166 g002
Figure 3. Total phenolic content (A) and total anthocyanin content (B) of fresh flowers at harvest (day 0) in all the analyzed species. Data are given as mean values; bars indicate standard error. Different letters correspond to significant differences between means according to Tukey’s HSD test (p < 0.05).
Horticulturae 07 00166 g003
Figure 4. Antioxidant activity of fresh flowers at harvest in all the analyzed species, according to (A) DPPH, (B) ABTS, and (C) FRAP assay. Data are given as mean values; bars indicate standard error. Different letters correspond to significant differences between means according to Tukey’s HSD test (p < 0.05).
Horticulturae 07 00166 g004
Table 1. List of the 17 species of edible flowers studied in the present work, with related beneficial properties and food use reported in the literature.
Species (Common Name)Flower PropertiesEaten in/asReferences
Allium ursinum L.
(wild garlic)
Antioxidant, anti-inflammatory, antimycotic, cardioprotective.Garlic substitute.[47,48,49]
Borago officinalis L.
(borage)
Purifying, emollient, antitussive, diuretic, sudorific, anti-inflammatorySalads, soups, desserts, syrups and drinks. Cucumber taste.[2,15,50]
Calendula officinalis L.
(calendula)
Anti-inflammatory, antispasmodic, antiseptic, hepatoprotective, emollient, refreshing, cicatrizing.Flavoring and decoration of salted dishes, bakery products and herb teas. Food coloring.[2,51,52]
Centaurea cyanus L.
(cornflower)
Diuretic, anti-inflammatory, disinfectant.Garnishing dishes, syrups, teas[2]
Cichorium intybus L.
(chicory)
Laxative, diuretic, hypoglycemic, depurative, disinfectant, hepatoprotective.Salads, soups.[18]
Dianthus carthusianorum L.
(Carthusian pink)
Diuretic, sudorific, nervine stimulant, febrifuge, sedative.Infusions, liquors.[53]
Lavandula angustifolia Mill.
(lavender)
Antispasmodic, antiseptic, sedative, carminative, cicatrizing.Flavoring and decoration of cakes, soups, salads, jellies. Essential oil to flavor food.[15,54]
Leucanthemum vulgare Lam.
(ox-eye daisy)
Antispasmodic, diuretic, tonic, antifungal, antibacterial.Tea, salads[55,56]
Paeonia officinalis L.
(common peony)
Antirheumatic, antispasmodic, anti-inflammatory, analgesic, hepatoprotective.Infusions.[57,58]
Primula veris L.
(cowslip)
Anti-inflammatory, anti-viral, anti-asthmatic.Garnishing dishes, conserves, salads[55,59]
Robinia pseudoacacia L.
(black locust)
Antispasmodic, antiviral, diuretic, emollient, febrifuge, laxative, purgative, tonic.Flavoring liquors, jams, honey, pancakes.[18,55]
Rosa canina L.
(dog rose)
Anticancer, diuretic, laxative, anti-rheumatic, anti-inflammatory.Salads, jellies, syrups, teas.[2,60]
Rosa pendulina L.
(Alpine rose)
Anticancer, diuretic, laxative, anti-rheumatic.Salads, jellies.[2]
Salvia pratensis L.
(meadow sage)
Anti-inflammatory, antibacterial, antiseptic, eupeptic.Flavoring of butter, vinegar, oil, salads and creams, soups. Essential oil to flavor food.[61]
Sambucus nigra L.
(elder)
Antioxidant, anti-inflammatory, antibacterial, diuretic, emollient, sudorific, laxative, cardioprotective.Herb teas and drinks. Flavoring honey, jellies and jams. Salads.[18]
Taraxacum officinale Weber
(dandelion)
Antioxidant, anti-inflammatory, hepatoprotective, diuretic, laxative, depurative, analgesic.Salads and soups.[62,63]
Tropaeolum majus L.
(nasturtium)
Disinfectant, antimicrobial, expectorant, diuretic, anti-inflammatory.Salads, flavoring of soups, meat, pasta, cheese, vinegar. Peppery flavor.[2,64,65]
Table 2. Sensory lexicon used in this study: descriptors, definitions and bibliographic references.
Sensory DescriptorDefinitionReferences
Sweet intensityTaste of sucrose[84,85,86]
Sour intensityTaste of citric acid[85,87,88]
Bitter intensityTaste of caffeine[85,89]
Salt intensityTaste of sodium chloride[85,88]
Smell intensityOdor’s intensity of edible flower in evaluation [87,90]
Specific flower aroma intensity Aroma’s intensity of edible flower in evaluation[2,9,87,90,91]
Herbaceous aroma intensity Intensity of herbaceous and cut grass aroma[87]
SpicinessIntensity of spice aroma, hot and pungent taste[85,87,92,93]
ChewinessThe amount of chewing required to break down the sample so that it can be swallowed[88]
AstringencyThe tactile sensation described as dryness, tightening, tannic and puckering sensations perceived in the oral cavity.[94,95,96]
Table 3. Intensities (from 0 to 10) of each sensory descriptor detected in the studied edible flowers.
SmellSweetSourBitterSaltSpecific
Flower Aroma
Herbaceous AromaSpicinessChewinessAstringency
Allium ursinum8.32.41.82.12.78.81.46.17.40.3
Borago officinalis4.33.60.81.20.83.92.40.16.10.4
Calendula officinalis6.72.61.43.00.85.22.20.67.22.1
Centaurea cyanus5.12.21.12.20.94.13.40.23.80.7
Cichorium intybus3.10.92.87.20.75.54.11.35.81.3
Dianthus carthusianorum6.71.90.42.90.56.01.31.44.60.5
Lavandula angustifolia9.02.81.75.00.58.22.51.84.70.7
Leucanthemum vulgare7.42.40.92.70.93.15.30.75.21.5
Paeonia officinalis4.13.92.96.10.65.15.11.67.91.9
Primula veris4.12.80.81.20.42.61.60.36.21.4
Robina pseudoacacia7.16.91.01.40.95.93.1-6.31.2
Rosa canina6.32.02.05.20.56.14.20.16.32.0
Rosa pendulina5.51.32.17.30.35.02.50.66.54.4
Salvia pratensis7.33.91.12.00.65.32.00.86.60.8
Sambucus nigra7.83.50.73.51.36.72.81.37.40.9
Taraxacum officinale6.43.70.61.40.84.51.40.45.70.4
Tropaeolum majus8.30.80.85.41.67.30.67.48.21.9
Range of variation5.96.12.56.12.46.24.77.44.44.1
Table 4. Subjective judgement (0–10 of satisfaction rating) on edible flower.
SpeciesOverallTasteAppearance
Allium ursinum7.07 ± 0.93 a 16.57 ± 0.79 a7.21 ± 0.91 a
Borago officinalis5.60 ± 0.55 ab4.60 ± 0.55 abcde6.60 ± 0.55 a
Centaurea cyanus5.64 ± 0.84 ab4.25 ± 0.94 bcde7.32 ± 0.87 a
Cichorium intybus4.63 ± 0.75 b4.00 ± 0.82 cde3.25 ± 0.96 c
Dianthus carthusianorum4.80 ± 0.45 b4.20 ± 0.84 bcde4.60 ± 0.89 bc
Lavandula angustifolia6.30 ± 0.84 ab5.30 ± 0.97 abcd7.60 ± 0.55 a
Paeonia officinalis6.93 ± 0.93 a6.21 ± 0.99 ab7.64 ± 0.99 a
Primula veris5.43 ± 0.98 ab3.29 ± 0.95 de6.36 ± 0.99 ab
Rosa canina5.57 ± 0.98 ab4.43 ± 0.79 bcde7.36 ± 0.63 a
Rosa pendulina5.25 ± 0.50 ab3.25 ± 0.96 e7.50 ± 0.71 a
Salvia pratensis6.00 ± 0.82 ab5.25 ± 0.50 abcde6.50 ± 0.58 ab
Taraxacum officinale6.00 ± 0.99 ab5.86 ± 0.90 abc6.21 ± 0.99 ab
1 Mean value ± standard deviation of each sample is given. Values with the same letter within the same column are not statistically different (p < 0.01) according to Tukey’s HSD test.
Table 5. Pearson’s correlation between sensory parameters and overall subjective judgement.
Sensory DescriptorsOverall Subjective JudgementPearson Correlation Significance
Smell intensity0.342** 1
Sweet intensity0.421**
Sour intensity−0.009ns
Bitter intensity−0.135ns
Salt intensity−0.234**
Specific flower aroma intensity0.272**
Herbaceous aroma intensity0.179*
Spicy0.510ns
Chewiness0.022ns
Astringency−0.171*
1 the level of significance is given: *, p < 0.05; **, p < 0.01; ns, not significant.
Table 6. Spearman’s correlation coefficient (r) and related level of significance between polyphenols, anthocyanins, and antioxidant activity measured with DPPH, ABTS, and FRAP assays.
PolyphenolsAnthocyaninsDPPHABTSFRAP
Polyphenolsr10.2700.8130.6490.895
Sign. 0.0320.0000.0000.000
Anthocyaninsr 10.3860.2140.444
Sign. 0.0020.0910.000
DPPHr 10.8370.793
Sign. 0.0000.000
ABTSr 10.557
Sign. 0.000
FRAPr 1
Sign.
Table 7. Visual quality of fresh edible flowers during cold storage at 4 °C (0, 3, 7, 10, 14 days after harvest). Data shown are mean values.
DaysA. ursinum D. carthusianorum P. veris S. pratensis
010a 110a10a10a
38.5b8.3b6.5b9b
76.5c7.2c5.6bc8c
105.8d5d5c4.2d
145e3e4.8c3.7e
*** *** *** ***
B. officinalis L. angustifolia R. pseudoacacia S. nigra
010a10a10a10a
39ab8b7.3b9b
78.2b7.2c7.3b8.8b
105.4c5.2d4.8c4c
144.6c4e3.8d2.5d
*** *** *** ***
C. officinalis L. vulgare R. canina T. officinale
010a10a10a10a
38.6b8.1b8.8b3.3b
77c7.7b8.3b2c
104.5d5.9c7.3c2c
141.7e5.3c5.8d1d
*** *** *** ***
C. cyanus P. officinalis R. pendulina T. majus
010a10a10a10a
39b8.4b9b8.6b
78.8b7.8b6.8c6c
105.6c5.7c6.7cd4.7d
144.6d4.7c5.8d1d
*** *** *** ***
1 Data with different letters are significantly different according to Tukey’s HSD test; the level of significance is given (***, p < 0.001; ns, not significant).
Table 8. Total polyphenols and total anthocyanins of fresh edible flowers during cold storage at 4 °C (0, 3, 7, 10, 14 days after harvest). Data shown are mean values expressed on a fresh weight (FW) basis.
DaysTotal
Polyphenols
Total
Anthocyanins
Total
Polyphenols
Total
Anthocyanins
Total
Polyphenols
Total
Anthocyanins
mgGAE/100 g FWmg C3G/100 g FWmg GAE/100 g FWmg C3G/100 g FWmg GAE/100 g FWmg C3G/100 g FW
A. ursinumL. vulgareR. pendulina
099.26ab 10.58230.76b0.831181.9a55.93
3109.2ab0.77197.91b4.31043.5bc47.22
7138.7a1.4338.45a6.671151.4ab60.13
1081.51b0.23313.52ab4.321033.9c31.03
1447.96c0.92343.48a13.931139.8abc39.48
* ns* ns* ns
B. officinalisP. officinalisS. pratensis
0118.1b38.431270.7a25.96433.93 150.7
3100.8b40.271210.9b28.76425.35 135.5
7100.6b3.891208.6b25.58396.64 107.4
10115.6b45.431219.8b26.68349.52 141.8
14157.2a44.731161.1c26.2457.66 118.7
*** ns*** nsns ns
C. officinalisP. verisS. nigra
0189.6a9.9609.16b3.99307.64ab17.29
3156ab35.66770.23a4.24365.14a29.46
7149.2ab26.46610.58b4.86284.33b16.03
10136.2b20.11638.24b4.96315.84ab15.22
14135.7b19.61731.4a3.52292.16b11.72
* ns*** ns** ns
C. cyanusR. pseudoacaciaT. officinale
0196.8d34.67191.45 14.4576.41d8.84ab
3171.5e50.12204.08 9.84157.33a6.05b
7276b28.57243.17 10.83100.35c10.62a
10213.5c23.11187.53 15.49117.89b8.68ab
14317.9a38.04205.6 11.9598.62c8.57ab
*** nsns ns*** **
D. carthusianorumR. caninaT. majus
0470.5c19.16884.44d4.39341.33a800.2a
3446.8c15.921009.6c5.04343.64a414.2b
7675.9a17.251204.2a4.96353.95a327.5b
10635.9b16.491155ab4.5271.93a335.8b
14697.7a18.971104.6b5.248.74b322b
*** ns*** ns*** **
L. angustifolia
0148.2c4.27
3198.7bc4.94
7202.9bc5.03
10212.3b4.98
14387.5a5
* ns
1 Data with different letters are significantly different according to Tukey’s HSD test; the level of significance is given (*, p < 0.05; **, p < 0.01; ***, p < 0.001; ns, not significant).
Table 9. Antioxidant activity (DPPH, ABTS, FRAP assays) of fresh edible flowers during cold storage at 4 °C (0, 3, 7, 10, 14 days after harvest). Data shown are mean values expressed on a fresh weight (FW) basis.
DaysDPPHABTSFRAPDPPHABTSFRAP
µmol TE/g FWµmol TE/g FWmmol Fe2+/kg FWµmol TE/g FWµmol TE/g FWmmol Fe2+/kg FW
A. ursinumP. veris
02.38c 12.7c1.45b41.91abc23.83bc120.14b
36.76a7.41a4.01a42.63ab24.7bc115.17b
74.75b3.32b5.04a53.29a22.96c114.25b
104.73b5.56ab3.77a28.68bc27.67a118.84b
144.79b4.65ab4.22a29.96c25.43ab131.17a
*** * *** * *** **
B. officinalisR. pseudoacacia
03.47a6.53 22.74b2.08ab2.66ab30.35ab
31.81b4.61 15.63d2.53a3.43a40.44a
71.28b5.34 18.06c1.86ab4.16a47.1a
104.59a7.92 24.19b1.82b3.4ab24.66b
144.8a8.16 33.56a1.4b2.56b18.88c
*** ns *** ** * **
C. officinalisR. canina
03.62a9.21 22.55b132.3b43.45c203.72b
31.29bc2.39 34.16a137.7b52.86b227.37ab
71.06bc2.3 32.56a137.4b50.91bc239.1ab
100.97c2.34 31.34a177.6a57.39a265.09a
141.89b1.97 34.87a115.8c49.98bc248ab
*** ns *** *** * *
C. cyanusR. pendulina
010.08b10.3b21.19c153.9b55.44ab257.04
310.77b13.4ab34.31bc104.8c55.35ab248.22
716.04a16.9a40.29b170.6a56.29a246.11
1011.59b14ab26.57bc99.85d54.62b251.63
1412.67ab13.7ab44.65a89.77e56.36a224.1
** * * ** ** ns
D. carthusianorumS. pratensis
029.13c17.4b92.51b11.02 5.39 171.09
317.19d12.8c69.6b10.78 5.23 151.51
737.59b20b121.3a10.3 5.64 144.54
1034.87bc27.1a127.8a10.62 5.26 170.26
1458.3a25.5a131.4a11.76 5.65 194.11
*** *** *** ns ns ns
L. angustifoliaS. nigra
02.78bc7.77b19.25c5.14ab3.74b98.79
39.72b8.75ab32.97abc6.64a5.4a109.38
74.19bc8.9ab36.12ab4.34b4.35ab93.79
103.3c8.97ab31.14bc5.35ab4.24ab92.91
1425.05a16.7a71.61a4.14b3.76b83.46
* * * ** * ns
L. vulgareT. officinale
02.49cd3.08 50.08b3.18b4.78 14.41bc
31.85d2.35 49.49b6.87a7.06 18.46ab
73.86bc3.4 77.88a2.8b6.39 12.15c
105.54ab3.18 89.05a9.59a6.16 22.29a
145.74a3.51 96.72a2.53b6.53 15.59bc
*** ns *** *** ns ***
P. officinalisT. majus
0232.4a57.6b274.2a11.51a8.05 241.12a
3227.3b57.9a265.8b5.85b4.73 129.15b
7190.9c57.5b275a5.62b5.02 113.86b
10221c57.6b274.3a4.53b5.69 119.76b
14187.9c55.7c261.1b6.79ab5.88 83.47b
* * *** * ns ***
1 Data with different letters are significantly different according to Tukey’s HSD test; the level of significance is given (*, p < 0.05; **, p < 0.01; ***, p < 0.001; ns, not significant).
Publisher’s Note: MDPI stays neutral with regard to jurisdictional claims in published maps and institutional affiliations.

