Article

Chemical Composition, Antioxidant, and α-Glucosidase-Inhibiting Activity of Aqueous and Hydroethanolic Extracts of Traditional Antidiabetics from Croatian Ethnomedicine

by
Kristina Bljajić
1,
Andrea Brajković
1,2,
Ana Čačić
1,2,
Lovorka Vujić
1,
Jasna Jablan
1,
Isabel Saraiva de Carvalho
2 and
Marijana Zovko Končić
1,*
1
Faculty of Pharmacy and Biochemistry, University of Zagreb, 10000 Zagreb, Croatia
2
Food Science Laboratory, MED-Mediterranean Institute for Agriculture, Environment and Development, University of Algarve, 8005-139 Faro, Portugal
*
Author to whom correspondence should be addressed.
Horticulturae 2021, 7(2), 15; https://doi.org/10.3390/horticulturae7020015
Submission received: 30 December 2020 / Revised: 15 January 2021 / Accepted: 20 January 2021 / Published: 26 January 2021

Abstract

:
Type 2 diabetes (T2D) is a chronic disease with a growing prevalence worldwide. In addition to the conventional therapy, many T2D patients use phytotherapeutic preparations. In the present study, chemical composition, antioxidant, and α-glucosidase inhibiting activity of traditional antidiabetics from Croatian ethnomedicine (Achillea millefolium, Artemisia absinthium, Centaurium erythraea, Morus alba, Phaseolus vulgaris, Sambucus nigra, and Salvia officinalis) were assessed. The efficacy of water and 80% ethanol as extraction solvents for bioactive constituents was compared. HPLC analysis revealed that the prepared extracts were rich in phenols, especially rutin, ferulic, and chlorogenic acid. Antiradical (against DPPH and ABTS radicals), reducing (towards Mo6+ and Fe3+ ions), and enzyme inhibiting properties were in linear correlation with the content of phenolic constituents. Ethanolic extracts, richer in phenolic substances, showed dominant efficacy in those assays. Aqueous extracts, on the other hand, were better Fe2+ ion chelators and more active in the β-carotene linoleic acid assay. Extracts from S. officinalis and A. millefolium were particularly active antioxidants and α-glucosidase inhibitors. A. absinthium, another potent α-glucosidase inhibitor, contained chromium, a mineral that promotes insulin action. The investigated plants contained significant amounts of minerals useful in management of T2D, with negligible amounts of heavy metals deeming them safe for human use.

1. Introduction

Unhealthy dietary choices and sedentary living style have led to an increased incidence of different chronic diseases including metabolic syndrome and type 2 diabetes (T2D) [1]. Those diseases are primarily characterized by insulin resistance resulting not only in hyperglycemia but reactive oxygen species (ROS) production and accumulation [2]. While ROS, in physiological concentrations, play an important role in healthy metabolism, excessive ROS production can lead to oxidative stress, a state characterized by damage of cellular macromolecules, impaired protein function, and, eventually, cell death [3]. A constant state of enhanced oxidative stress leads to the development of diabetic complications including nephropathy, neuropathy, and retinopathy, as well as to liver damage [3,4]. The consequences of hyperglycemia-induced oxidative stress may be ameliorated using various endo- and exogenous antioxidants. Among the latter, phenolic natural substances have an especially prominent place due to their notable antioxidant, but also other biological activities. Numerous studies indicate that they can modulate carbohydrate and lipid metabolism, attenuate hyperglycemia, dyslipidemia, and insulin resistance, as well as alleviate oxidative stress and inflammatory processes [3,5]. Secondary metabolites can target the key enzymes of carbohydrate metabolism and retard the postprandial increase of glucose concentration. For instance, they can inhibit the activity of α-glucosidase, the enzyme that degrades the oligosaccharides to glucose. Plants used in traditional medicine are an especially rich source of α-glucosidase inhibitors making them valuable nutritional and therapeutic tool for prevention of onset and long-term T2D complications [5,6]. Recent studies have shown that most patients use medicinal plants as a complementary therapy for T2D [7] and a potential value of herbal products for T2D may lay primarily in the area of prevention of diabetic complications [8]. In order to develop such products from plants, it is important to investigate the influence of different types of extraction, as they may radically affect the composition and, as a result, the biological activity of the prepared extracts [9].
Traditional medicine is an accessible, affordable, and culturally acceptable form of healthcare trusted by large numbers of people worldwide. Ethnobotanical data indicate that more than 800 plants around the world are used as traditional remedies for the treatment of T2D, often with efficacy comparable to conventional drugs [10]. However, the use of medicinal plants is not without its risks because they often contain harmful substances, such as pesticides and heavy metals [11]. On the other hand, the presence of some minerals may positively contribute to the antidiabetic effects of plants e.g., by enhancing insulin effects [12].
Medicinal plants are a rich source of bioactive phenols that may affect multiple targets and act beneficially in treatment of T2D. Thus, the aim of this work was evaluation and comparison of the phenolic composition, antioxidant, and α-glucosidase-inhibiting activity of aqueous and ethanolic extracts of the plants traditionally used in Croatia for management of diabetes: Achillea millefolium, Artemisia absinthium, Centaurium erythraea, Morus alba, Phaseolus vulgaris, Sambucus nigra, and Salvia officinalis. In order to assess their safety, but also potential favorable effects of the minerals present in the plant material, the content of heavy and other metals was determined.

2. Materials and Methods

2.1. Plant Material, Chemicals, and Apparatus

Herbal material included in this study was bought from the herbalists from the local markets. Using the appropriate monographs of European pharmacopoeia [13] and other relevant literature [14], the identity was confirmed by the authors. Vouchers are deposited at the University of Zagreb Faculty of Pharmacy and Biochemistry (Department of Pharmacognosy). Extraction was performed using Bandelin SONOREX® Digital 10 P DK 156 BP ultrasonic bath (Berlin, Germany). For total reflection X-ray fluorescence (TXRF) determination of metal content in the plant material, the bench top TXRF spectrometer “S2 Picofox” (Bruker Nano GmbH, Berlin, Germany), equipped with a Mo target micro focus tube, a multilayer monochromator (80% reflectivity), as well as the liquid nitrogen-free XFlash® silicon drift detector and with energy resolution of <150 eV (Mn Kα) was used. The instrument was operated at 50 kV/750 μA. A microplate reader Stat Fax 3200 (Awareness Technologies, Palm City, FL, USA) was used for UV-VIS spectroscopy. An Agilent 1200 series HPLC instrument with an autosampler, DAD detector, and Zorbax Eclipse XDB-C18 (5 μm, 12.5 mm × 4.6 mm) (Agilent Technologies, Santa Clara, CA, USA) column and guard column was used for determination of individual flavonoids and phenolic acids. HPLC standards (purity ≥ 97%) and α-glucosidase (type I from Saccharomyces cerevisiae) were purchased from Sigma-Aldrich (St. Louis, MO, USA). For chromatographic separation, HPLC grade methanol was used, while the other reagents and chemicals were of analytical grade.

2.2. Determination of Metal Content in Plant Material

For TXRF analysis, powdered plant material (0.3 g) was ultrasonicated with 15 mL of HNO3 (0.14 M) for 10 min at 25 °C. Upon filtration, aliquots (1 mL) of each prepared extract were mixed with 10 μL of a yttrium stock solution (1 g/L, internal standard). After homogenization, an aliquot (10 μL) of thus prepared solution was centred at an unsiliconized quartz glass sample carrier. The solvent was removed on a plate heater at the temperature of 50 °C and inserted into a TXRF spectrometer. The measurement time was 1000 s.

2.3. Preparation of the Extracts

Extracts were prepared from aerial parts of Artemisia absinthium, Achillea millefolium, Centaurium erythraea, leaves of Morus alba, and Salvia officinalis, as well as Phaseolus vulgaris pods, and Sambucus nigra flowers. Dried plant material was milled and passed through a sieve of 850 μm mesh size. To 20 mL of the appropriate solvent (water or 80% ethanol) in a 50 mL Erlenmeyer flask, 2 g of plant material was added. After 30 min in an ultrasonication bath (80 °C, 720 W), the extracts were subjected to centrifugation for 30 min at 3400 rpm. Supernatant was collected and subjected either to freeze-drying (aqueous extracts), or evaporation at 30 °C in rotavapor (hydroethanolic extracts).

2.4. Spectrophotometric Determination of Phenolic Compounds

Total phenols (TP) content was determined using a Folin–Ciocalteau reagent [15]. For the determination of total flavonoids (TF), a reaction with aluminum chloride was used [16]. Total phenolic acids (TPA) content was assessed with a nitrite-molybdate reagent [17]. Content of TP, TF and TPA was expressed as mg of gallic acid (GAE), quercetin (QE), and caffeic acid (CAE) equivalents in g of dry weight (DW), respectively.

2.5. HPLC Analysis of Phenolic Constituents

Methanolic solutions of the extracts (2 mg/mL) and the phenolic standards (0.2 mg/mL), filtered through a 0.45 μm PTFE syringe filter, were subjected to HPLC chromatographic separation at a temperature of 40 °C and flow of 1.0 mL/min. The solvents A and B were water, methanol, and formic acid in proportions 93:5:2 (v:v:v) and 3:95:2 (v:v:v), respectively. Hyperoside, kaempferol, protocatechuic acid, and quercetin were quantified at 270 nm, while for caffeic, chlorogenic, ferulic, and p-coumaric acid, absorbance at 320 nm was recorded. In order to construct a calibration curve, varying volumes of standard solutions were injected using an autosampler. The peak assignment and identification were based on comparison of retention times of peaks in sample chromatogram and UV spectra with those of the standards. Calibration curve parameters, level of detection (LOD), and level of quantification and (LOQ) are reported in Table 1.

2.6. ABTS and DPPH Radical Scavenging Activity

Radical scavenging activity (RSA) of the extracts was evaluated using 2,2′-azino-bis(3-ethylbenzothiazoline-6-sulfonic acid) (ABTS) and 2,2-diphenyl-1-picrylhydrazyl (DPPH) free radicals as described in the references [18,19], using Trolox and butylated hydroxyanisole (BHA) as standard radical scavengers, respectively. The solution of the extract was added to the free radical solution. After 30 min, the absorbance was read either at 734 nm (for ABTS RSA) or 545 nm (for DPPH RSA), respectively. RSA was calculated according to Equation (1):
R S A   = A c o n t r o l A s a m p l e A c o n t r o l × 100
where Acontrol and Asample are the absorbances of the negative control (methanol) and the solution containing the extract, respectively.

2.7. Fe2+ Chelating Activity

Chelating activity (ChA) determination was based on complexation of Fe2+ ions with ferrozine [19]. To the methanolic solution (150 μL), of either extract or ethylenediaminetetraacetic acid (EDTA) (chelating standard), 50 μL FeCl2 (0.25 mM) was added. After 5 min, ferrozine solution (1.0 mM, 100 μL) was added. After additional 10 min, absorbance was measured at 545 nm. ChA was calculated according to Equation (2):
C h A   = A c o n t r o l A s a m p l e A c o n t r o l × 100
where is Acontrol is absorbance of the negative control (reaction mixture without ion chelators), and Asample is the absorbance of the solution with the extract.

2.8. β-Carotene-Linoleic Acid Assay

The β-carotene-linoleic acid was performed as follows [19]: Tween 40 (200 mg) was added to the mixture of linoleic acid (20 mg) and β-carotene (1.0 mL, γ = 0.2 g/L) in chloroform. After vortexing the mixture, chloroform was removed and 30 mL of water, previously saturated with oxygen, was added. Upon the addition of the aliquots of thus prepared emulsion (200 μL) to the extract solutions (50 μL), the reaction mixture was incubated at 50 °C for 120 min and the absorbance at 450 nm measured every 15-min. antioxidant activity in β-carotene-linoleic acid assay (ANT) was calculated according to Equation (3):
A N T   = R c o n t r o l R s a m p l e R c o n t r o l × 100
where Rcontrol and Rsample are reaction rates for the water (control) and the extract, respectively. BHA was used as the standard antioxidant. Final concentrations of the extracts and the BHA in the reaction solution were 8 μg/mL.

2.9. Total Antioxidant Activity

For determination of total antioxidant activity (TAA) [20], 0.1 mL of the extract solution was combined with 1 mL of solution consisting of sulfuric acid (0.6 M), sodium phosphate (28 mM), and ammonium molybdate (4 mM). Reaction mixture was incubated for 90 min at 95 °C. The absorbance was measured at 695 nm after cooling the mixture to the room temperature. The activity calculation was based on the calibration curve of ascorbic acid, and expressed as mg ascorbic acid equivalents (AAE) per g of DW.

2.10. Reducing Power

Reducing power (RP) determination was performed as described previously [21]. The extract solution (0.2 mL) was mixed with 2.5 mL phosphate buffer (0.2 M, pH 6.6) and 0.5 mL K3[Fe(CN)6] (1.0%). After 20 min at 50 °C, 0.5 mL of trichloroacetic acid (10%) was added. An aliquot (0.5 mL) of supernatant was mixed with water (0.5 mL) and FeCl3 (0.1 mL, 0.1%). The absorbance was read at 700 nm. The calibration curve of Trolox was constructed and RP expressed as mg Trolox equivalent (TE) per g of DW.

2.11. Ferric Reducing Antioxidant Power

Ferric reducing antioxidant power (FRAP) was performed as described in reference [22]. To 0.9 mL of the FRAP reagent, consisting of acetate buffer (25 mL, 300 mM), of 2,4,6-tripyridyl-2-triazine solution (2.5 mL, 10 mM in in 40 mM HCl) and 2.5 mL ferric chloride solution (20 mM), the extract solution was added (0.1 mL) and left in the dark at 25 °C and the absorbance at 593 nm recorded after 30 min. FRAP was calculated using the Trolox calibration curve and expressed as mg Trolox equivalent (TE) per g of DW.

2.12. Determination of α-Glucosidase Inhibiting Activity

Determination was performed according to Tiwari et al. [23]. The enzyme (1.0 U/mL in 0.1 M phosphate buffer, pH 6.8) was added to the 100 μL of the extract. After 10 min at 37 °C., 50 μL of 5 mM p-nitrophenyl-α-d-glucopyranoside, dissolved in the same buffer, was added. After 5 min, the absorbance was measured at 405 nm and the α-glucosidase inhibiting activity (AG) calculated according to Equation (4):
A G   = A c o n t r o l A s a m p l e A c o n t r o l × 100
where Acontrol is the absorbance of the control mixture (mixture with the buffer instead of the inhibitor), and Asample represents the absorbance of samples containing the inhibitor (the extracts or acarbose).

2.13. Statistical Analysis

The experiments were performed in triplicate. The results were expressed as mean ± SD. Statistical analyses were performed using GraphPad Prism 8.0 (www.graphpad.com). Analyses were performed using one-way ANOVA followed by either Dunnett (comparisons of the individual extracts with the controls) or Tukey (for comparisons between the extracts) post-hoc tests. The differences between ethanolic and aqueous extracts were investigated using a paired t-test. Unless otherwise noted, p-values < 0.05 were considered statistically significant. IC50 values in ABTS RSA, DPPH RSA, ChA, and α-glucosidase assay were calculated using regression analysis.

3. Results

3.1. Plant Included in the Study

A recent ethnopharmacological study has shown that various medicinal plants are used either as complementary or the individual therapy of diabetes in Croatia [7]. In this study, seven plants were selected and their chemical content and biological effects were compared. The plants and their parts included in this study, as well as the abbreviations used throughout the text, are presented in Table 2. One group of the plants was selected according to the prevalence of their use against T2D. For example, most of the plants selected for this study were used by more than 30% of interviewed herbalists (AA, CE, MA, and PV) [7]. The other plants were selected due to their widespread use in Croatia for culinary or other medicinal purposes (AM, SN, and SO). Some of them were better researched in regard to their antidiabetic activity (e.g., MA) [24], while the others were the subject of a fewer studies (e.g., AA). For example, it was interesting to note that, while both beans and pods (pericarp) of Phaseolus vulgaris are well-known traditional antidiabetic agents, only the beans are rather well studied and recognized as functional food for diabetics. The pods, on the other hand, are still under-researched and the existing studies failed to establish its efficacy unequivocally [8]. In spite of that, Phaseolus vulgaris pods were still one of the most popular remedies in Croatia, recommended by 50% of herbalists, surpassed only by Urtica dioica [7].
Plant materials are complex mixtures of phytochemical constituents, which, due to their differing chemical properties (e.g., polarities), may not all be equally efficiently extracted with the same extraction solvents. Thus, different extraction methods may affect the composition and thus biological effects of the prepared extracts. In order to include a wider spectrum of metabolites, as well as to determine the solvent best suited for potential production of food supplements based on the selected plants, the extraction was performed using two solvents of different polarities: water and 80% ethanol (v/v). The prepared extracts and their abbreviations are presented in Table 2.

3.2. Content of Metals in Selected Plants

Herbal teas for T2D, similar to other herbal teas at local markets, often sold without appropriate health safety and quality control, may represent a potential health-hazard to the patients who use them. In order to investigate the safety of the plant material, but also to assess the potential contribution of selected minerals to their antidiabetic effects, multielemental analysis was performed using TXRF (Table 3).
Chromium is an essential element necessary for the action of insulin most probably through its complex with a chromium-binding oligopeptide called chromoduline. This complex binds to β-subunit of the insuline receptor, thus activating it and increasing the insulin signal [12]. Even though it has been postulated that PV might exert its potential antidiabetic effect due to its chromium content [8], among the investigated samples, only AA contained a significant amount of this metal. On the other hand, all the investigated plants contained significant amounts of magnesium, zinc, and manganese. Magnesium is a cofactor in more than 300 enzymatic reactions. It is important for maintaining cellular membrane integrity, muscle contraction, nervous system conduction, and vascular tone. Its deficiency is associated with a number of clinical disorders, including insulin resistance, type 2 diabetes, hypertension, and cardiovascular disease. Magnesium supplementation has been reported to improve insulin sensitivity in patients with T2D [25]. Among the investigated samples, PV was the richest in this metal, and its content was two-fold higher than in MA, another sample rich in Mg.
Zinc is another important mineral in the human diet. The interaction of zinc with insulin causes conformational changes and enhances binding to the insulin receptor. Zinc ions possess insulin-mimetic activity, presumably through the ability to inhibit protein tyrosine phosphatases. Zinc is a cofactor of several key enzymes related to glucose metabolism. It is the activator of fructose-1-6-bisphosphate aldolase and the inhibitor of fructose-1-6-bisphosphatase. It can also have antioxidant activity, and is a cofactor in copper/zinc superoxide dismutase, the major antioxidant enzyme [25]. Manganese aids in glucose metabolism and is required for normal synthesis and secretion of insulin. The manganese-activated enzymes play an important role in the metabolism of carbohydrates, amino acids, and cholesterol. Copper deficiency, on the other hand, leads to glucose intolerance, decreased insulin response and increased glucose response. It has been associated with hypercholesterolemia and atherosclerosis [26]. AA was particularly rich in zinc, manganese and copper, followed by CE and SN.
Heavy metals are one of the most important contemporary environmental problems due to their toxic effects and high accumulation capacity. They remain in the soil for long periods of time and can be transferred to the food chain in significant quantities [27]. Heavy metals in food and drinking water adversely affect developmental processes, as well as the nervous, gastrointestinal, immune, urogenital, cardiovascular, and musculoskeletal system [28]. For example, it has been repeatedly shown that there is an association between arsenic exposure and T2D [29]. In the samples investigated herein, the content of of lead, nickel, and arsenic was generally low, with the largest amount of lead contained in AA and nickel in PV, while the content of arsenic was highest in CE. Given that the preparations purchased from herbalists were recommended in the doses of up to three teaspoons per day, it is important to point out that the heavy metals analyzed in the tested samples were below the maximum allowed daily dose [30], regardless if used in a mixture or individually.

3.3. Phenolic Content of the Extracts

The research on natural phenols, including flavonoids and phenolic acids, is gaining momentum due to their effectiveness in prevention and therapy of numerous chronic diseases including insulin resistance, T2D and its complications. Numerous scientific studies indicate that natural phenols can protect cellular targets in the eye, kidney, liver, and other organs affected by T2D complications [3]. Content of TP, TF, and TPA in the prepared extracts is presented in Table 4. In order to estimate the effects and influence of individual flavonoids and phenolic acids on the potential antidiabetic effects of the extracts, HPLC analysis was used (Table 5).
Significant differences in the TP content can be noted among extracts (Table 4). TP in hydroethanolic extracts varied from 54.51 mg GAE/g DW (PV-E) to as much as 423.51 mg GAE/g DW (SN-E), while the aqueous extracts contained much lower amounts of phenolic compounds, and their amounts ranged from 27.59 mg GE/g DW (PV-V) to 147.78 mg GE/g DW (SO-W). TP was statistically higher in the hydroethanolic than in aqueous extracts (paired t-test, p < 0.05). On average, the amount of total phenols in hydroethanolic extracts was almost threefold higher than their amount in the aqueous extract. This is expected because 80% ethanol is a solvent of relatively low polarity (as compared to water), suitable for dissolving natural phenolic substances.
Flavonoids are a group of phenolic compounds that have a significant potential to combat the consequences and complications of T2D e.g., by attenuating the progression of diabetic retinopathy. It is widely recognized that many of their observed effects are closely related to their antioxidant properties [31]. TF content of the investigated extracts is presented in Table 4. Among the hydroethanolic extracts, MA-E was particularly rich in flavonoids with 154.51 mg QE/g DW, while CE-E contained only 17.43 mg QE/g DW of TF. SO-W, on the other hand, contained 47.85 mg QE/g DW of flavonoids, much more than some hydroethanolic extracts, while the amount of flavonoid in PV-W was almost negligible (6.22 mg QE/g DW). The amount of TF was statistically higher in hydroethanolic than in aqueous extracts (paired t-test, p < 0.05), and the effect of the solvent on the TF was even more pronounced than with TP. The average yield of the extracted flavonoids was almost 3.5 lower when water was used instead of 80% ethanol.
The results revealed that the extracts contained several common flavonoids investigated in this work such as hyperoside, luteolin, myricetin, and rutin (Table 5). The presence of other flavonoids used as standards (baicalein, chrysin, hesperetin, and kaempferol) was not detected in the extracts. Rutin was the most common flavonoid in the investigated extracts (AA-E, AM-E, MA-E, SN-E, SN-W, SO-E, and SO-W) (Table 5). It is a flavonoid with the well-documented anti-inflammatory and antioxidant activity. Its antihyperglycemic effects are based on multiple mechanisms such as a decrease of carbohydrates absorption from the small intestine, inhibition of tissue gluconeogenesis, increase of tissue glucose uptake, stimulation of insulin secretion from beta cells, and protecting Langerhans islet against degeneration. Rutin also decreases the formation of sorbitol, reactive oxygen species, advanced glycation end-product precursors, and inflammatory cytokines. These mechanisms are considered to be responsible for the neuroprotective, nephroprotective, and hepatoprotective, as well as the protective effect against cardiovascular disorders in T2D [32].
Another important group of phenolic compounds universally present in plants are phenolic acids. They have a high antioxidant capacity and the ability to remove free radicals [33]. They can also inhibit certain enzymes responsible for the production of ROS [34]. In addition, they can modulate carbohydrate metabolism due to their ability to inhibit α-glucosidase, the enzyme that degrades complex carbohydrates into glucose [35]. The content of TPA is presented in Table 4. While the TP and TF were significantly higher in the hydroethanolic than in the aqueous extracts, TPA extracted with the two solvents did not differ significantly (paired t-test, p > 0.05). Sage leaf extracts were richest in phenolic acids with 65.67 mg CAE/g DW and 77.47 mg CAE/g DW in hydroethanolic and aqueous extract, respectively. The amount of phenolic acids in PV was again lowest among the investigated extracts being as low as 1.54 mg CAE/g DW in PV-W. In general, the results obtained in this work are in line with some previous studies of phenols and flavonoid content comparison of selected plants e.g., for A. absinthium and A. millefolium [36].
Using HPLC analysis, numerous phenolic acids were detected in the extracts. The results, presented in Table 5, revealed the presence of caffeic acid, chlorogenic acid, p-coumaric acid, ferulic acid, gallic acid, and rosmarinic acid. Ferulic acid was the most widespread phenolic acid in the investigated extracts (AA-E, AM-E, AM-W, SN-E, SN-W, SO-E, and SO-W). On the other hand, chlorogenic acid, found in AM-E, AM-W, MA-E, SN-E, and SN-W, was the most represented phenolic acid by weight. Ferulic acid may play an important role in the potential antidiabetic activity of the investigated extracts. It improves glucose and lipid profile in diabetic rats by enhancing activities of antioxidant enzymes, superoxide dismutase, and catalase in the pancreatic tissue. In addition, combination of ferulic acid with metformin improved both, in vitro glucose uptake activity and in vivo hypoglycemic activity of the metformin, thus making it possible to reduce the dose of metformin by four folds [37]. Chlorogenic acid is a substance with well researched antidiabetic properties. Besides hypoglycemic, it shows also hypolipidemic, anti-inflammatory, antioxidant, and other activities potentially useful in combating T2D causes and consequences. Regular consumption of coffee rich in chlorogenic acid has been linked to the prevention of T2D in the consumers. Caffeic acid relieves the complications arising from T2D, such as diabetic nephropathy, diabetic retinopathy, and diabetic peripheral neuropathy [5,38].
While the presence of some of the selected phenolic standards confirms previously reported findings (e.g., rutin in S. officinalis leaf [39] and S. nigra flower [40], ferulic acid in S. nigra flower [40], and A. absinthium aerial parts [41]), the other previously reported compounds were not recorded in this work (e.g., caffeic acid in A. absinthium aerial parts [41]). This may be related either to the interspecies variations or the specific condition of extract preparation. This finding further stresses the well-known necessity of the standardization of herbal material used for T2D treatment [42].

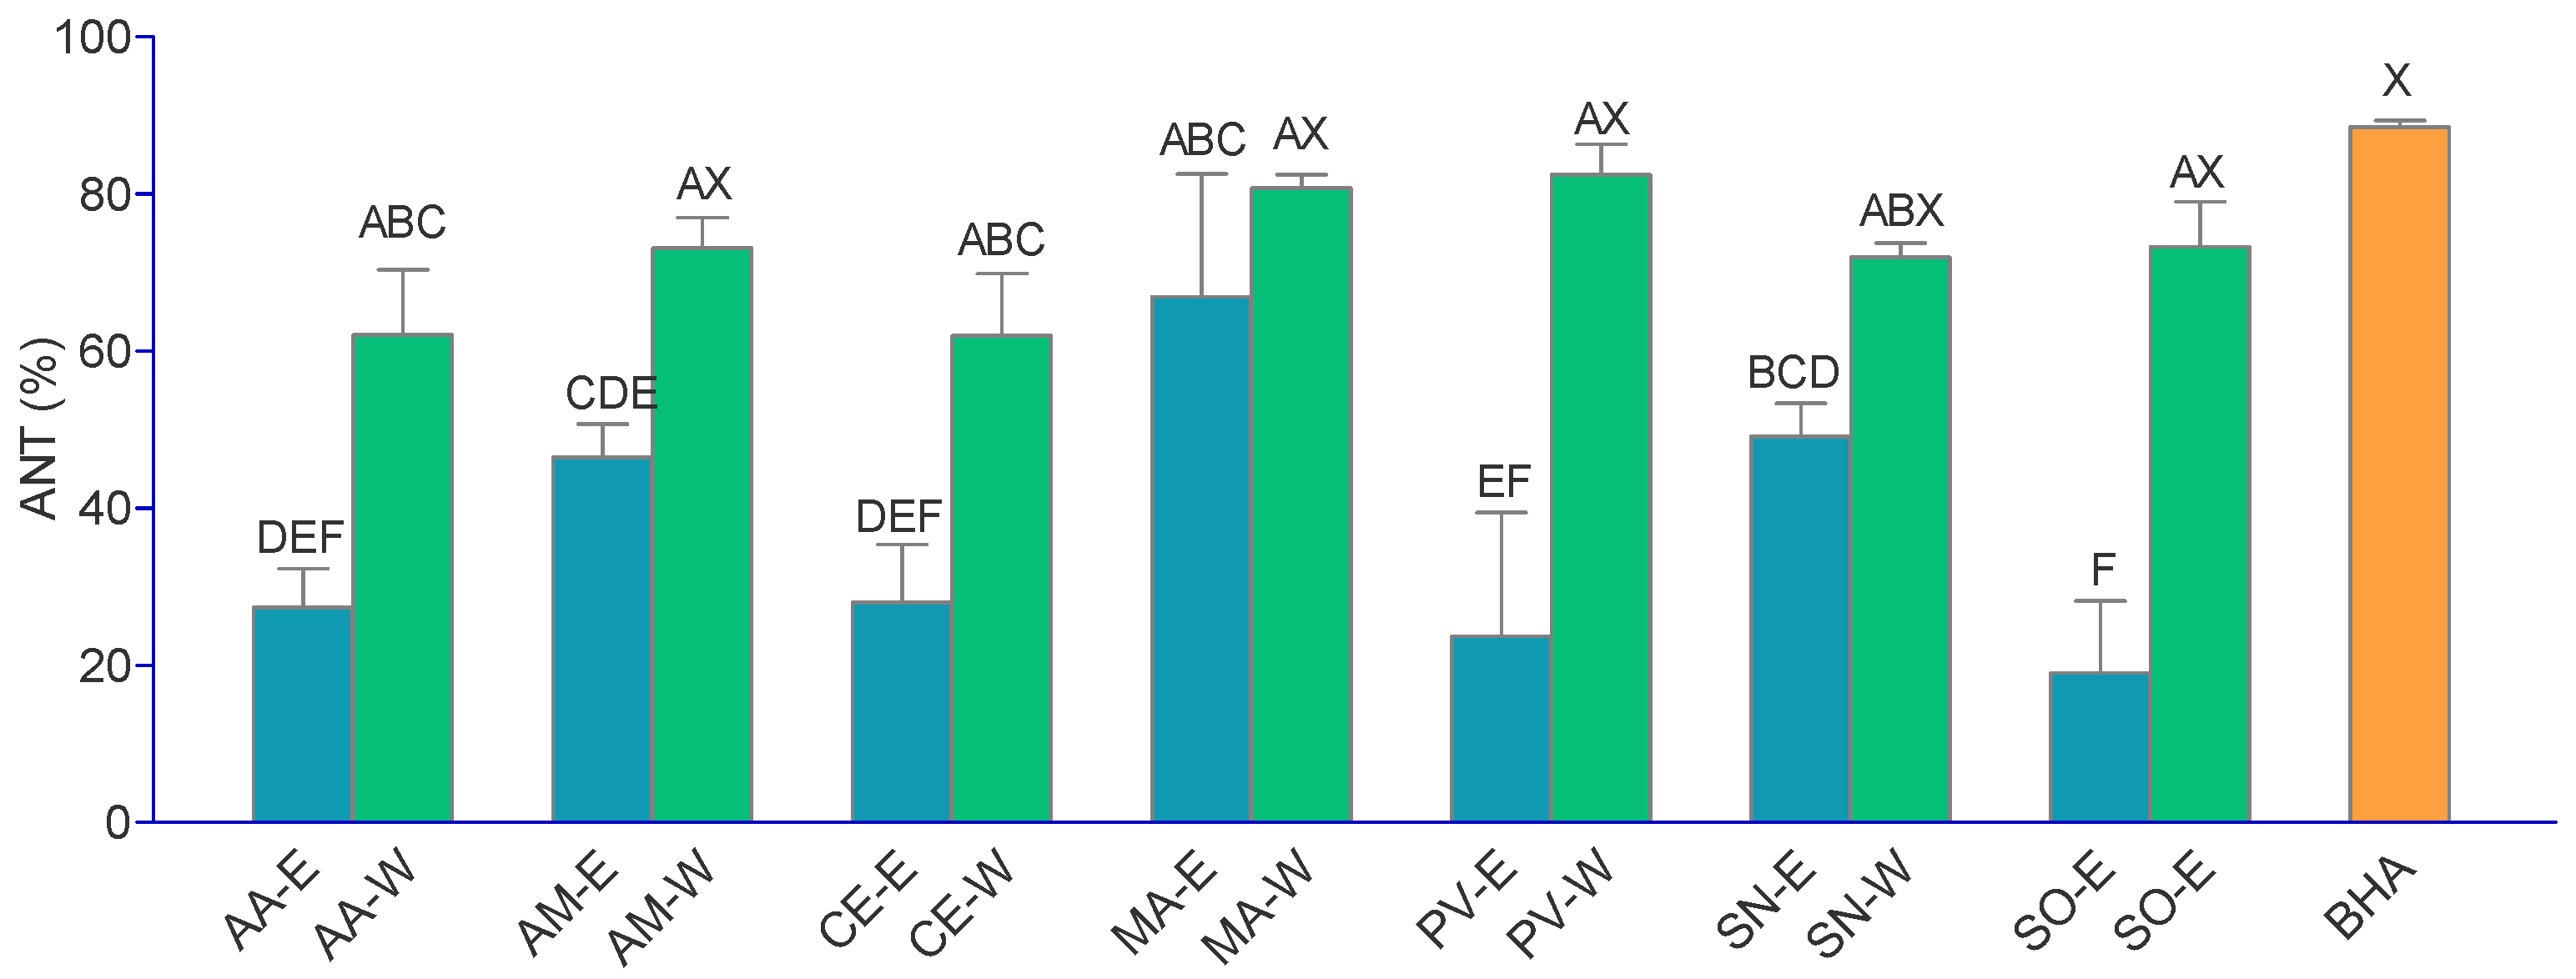
3.4. Antioxidant Activity of the Extracts

Antioxidant activity of plant secondary metabolites and other natural antioxidants may take place directly, e.g., through hydrogen atom or single electron transfer, or, indirectly, by their complexation of pro-oxidative metal ions. Thus, it is often necessary to use several methods to give a comprehensive analysis of the antioxidant activity of complex mixtures such as herbal extracts [43]. In this work, RSA of the extracts was evaluated using ABTS and DPPH free radicals, while TAA, RP, and FRAP were used to explore reducing properties of the investigated extracts. ChA and ANT assay were used to assess chelating and polyunsaturated fatty acid-protecting ability, respectively. BHA, ascorbic acid, Trolox and EDTA, antioxidants, and ion chelator often employed in the food and pharmaceutical industry, as well as common standards for antioxidant and chelating assays, were used as the positive controls [44]. The results of the employed assays are presented in Table 6 and Table 7, and Figure 1.
As shown in Table 6, ABTS RSA, DPPH RSA, and ChA differed depending on the extract and the assay. In general, the most efficient ABTS radical scavengers were the extracts prepared from SN, SO, and AM. Those extracts were also the most successful scavengers of DPPH free radicals. In addition, the activity of the SO and AM extracts did not statistically differ from the synthetic antioxidant, butylated hydroxyanisole (BHA) (Dunnet’s post-test, p > 0.05). Comparison of IC50 values shows that neither ABTS RSA nor DPPH RSA assay results differed statistically between the hydroethanolic and the aqueous extracts (paired t-test, p > 0.05). Among the investigated extracts AA-E and, especially AA-W, were the most efficient Fe3+ ion chelators, and its activity was not different from the standard, ethylenediaminetetraacetic acid (EDTA). Interestingly, the activity of PV-W, although seemingly lower, did not differ from the activity of EDTA (Dunnet’s post-test, p > 0.05), indicating that this extract acted as a relatively good secondary antioxidant. It is interesting to note that ChA IC50 values were slightly lower for aqueous extracts than their hydroethanolic counterparts (paired t-test, p < 0.1), indicating better activity of the aqueous extracts.
The ANT activity is presented in Figure 1. In general, the aqueous extracts were very good inhibitors of β-carotene degradation, and the ANT activity of the majority of the investigated aqueous extracts was equal to the activity of BHA. The most active extracts were AM-W, MA-W, PV-W, and SO-W. The observed high activity of PV in this assay is rather surprising considering its low phenolic content and weak activity in the other assays. Hydroethanolic extracts, on the other hand, displayed significantly lower activity, the most active among them being MA-E. The observed good activity of the aqueous extract in this assay may be related to the aqueous medium in which the reaction is performed [19].
In Table 7, the results of the three assays based on the reducing abilities of the analytes are presented. The TAA assay measures the ability to reduce Mo6+ to Mo5+ ions [20]. RP and FRAP assays, on the other hand, are based on the reduction of Fe3+ to Fe2+, with the FRAP assay being the more specific of the two. In this work, SO extracts were the most efficient reducing agents. However, the SO-W was more active in TAA assay, while SO-E was more active in the RP and FRAP assays. Other extracts also showed notable reducing properties, such as AM-W in TAA assay, and SN-E in RP and FRAP assay. Hydroethanolic extracts were statistically better Fe3+ reducing agents than aqueous extracts in the RP assay (paired t-test, p < 0.05), while such differences were not observed in the other two assays.

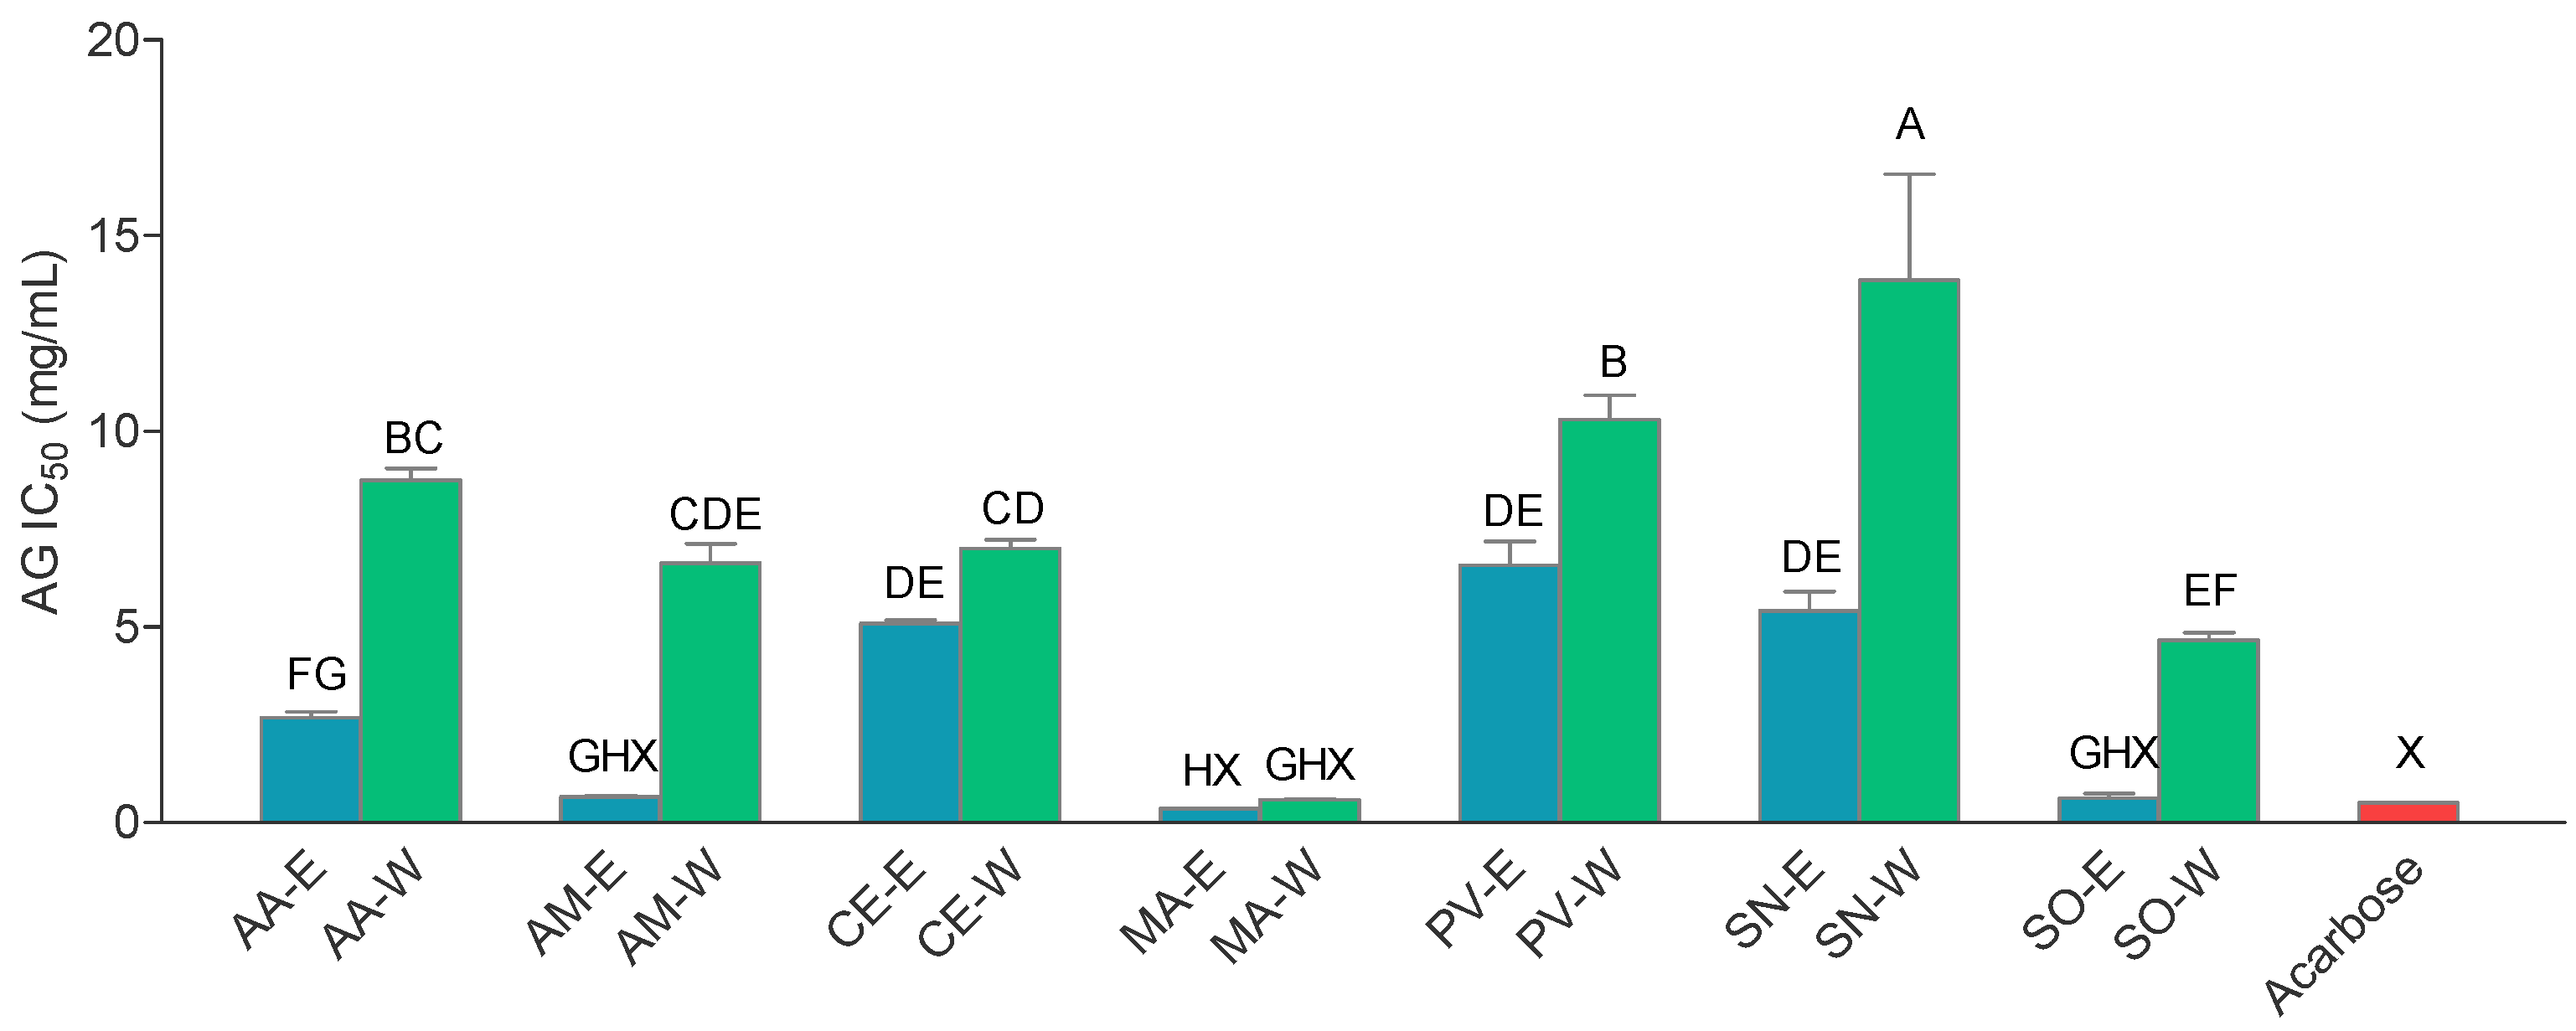
3.5. α-Glucosidase-Inhibitory Activity of the Extracts

The investigated extracts were tested for their activity against α-glucosidase, an important enzyme that participates in carbohydrate digestion. The results are presented in Figure 2. While the inhibiting activity of most extracts was excellent, MA extracts were particularly good α-glucosidase inhibitors with the IC50 value statistically equal to IC50 of acarbose, conventional anti-diabetic drug. Two other hydroethanolic extracts also showed the activity equal to the activity of acarbose AM-E and SO-E. These findings are in accordance with previous studies showing good α-glucosidase inhibiting activity of the sage [45] and yarrow [46] extracts. However, good activity of wormwood extracts is an interesting find because, to the best of our knowledge, this is the first report of anti- α-glucosidase activity of this plant commonly used in bitter alcoholic beverages with digestive properties. In this study, hydroethanolic extracts were significantly better α-glucosidase inhibitor than the corresponding aqueous extracts (paired t-test, p < 0.05). This is an interesting finding in light of the traditional preparation mode for the investigated plants being in the form of infusions [7] as the results clearly indicate that it may be desirable to use them in the form of hydroalcoholic extracts or preparations thereof.
The observed anti-glucosidase activity may be related to the presence of specific flavonoids, which hydroethanolic extracts were particularly abundant in. It has been found that the α-glucosidase-inhibiting effects of rutin, the most prevalent flavonoid in the hydroethanolic extracts, surpass the inhibiting effects of acarbose [47]. Significant correlation of the activity in this assay with the flavonoids content was also observed in this work, as discussed further in the text. In addition, phenolic acids may also contribute to the observed α-glucosidase inhibiting activity. Chlorogenic acid, the most represented phenolic acid in the investigated extracts, can inhibit α-glucosidase and alleviate postprandial hyperglycemia [48]. Furthermore, aglycones formed by hydrolysis of rutin and chlorogenic acid, quercetin, and caffeic acid, respectively, may also strongly suppress α-glucosidase activity [48,49]. In addition, current studies suggest that combinations of plant phenolics may have an additive effect on α-glucosidase inhibition [50].

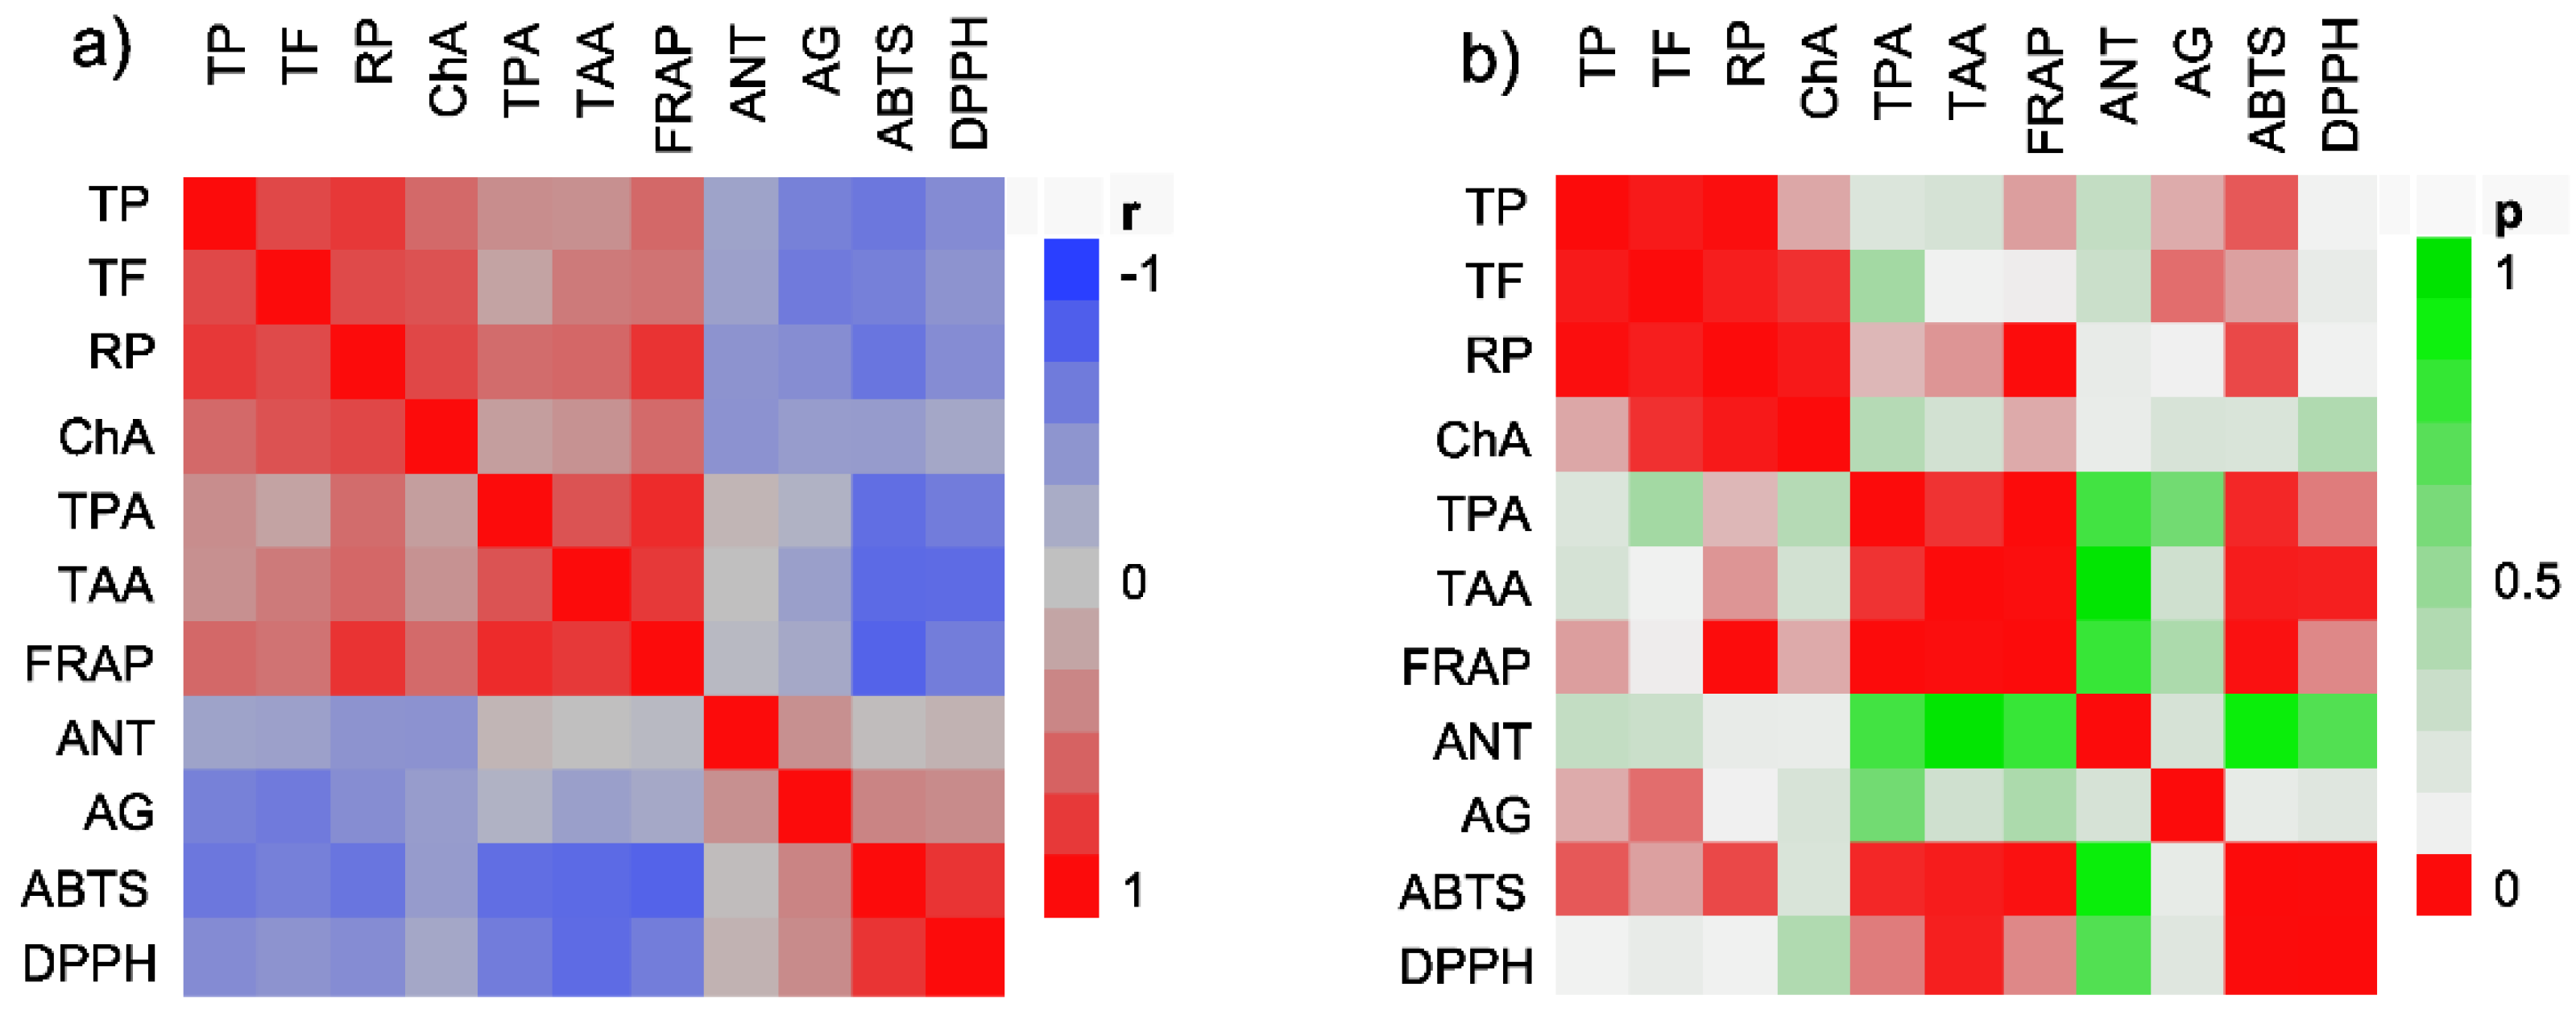
3.6. The Relationship between the Investigated Variables

In this work, multivariate analysis was employed in order to investigate possible relationship between the composition, antioxidant, and α-glucosidase inhibiting potential of the investigated plants.
The color maps with the correlations between the measured variables are presented in Figure 3, while the statistically significant coefficients of determinations between the content of selected phenolics and the performed assays’ results are presented in Table 8. In Figure 3, two distinct groups, marked by two dark red zones, where groups of variables are positively (Figure 3a) and significantly (Figure 3a) correlated to one another, can be discerned. The first group consists of four variables TF, TP, RP, and ChA IC50. While it is well known that natural flavonoids and other phenols possess reducing abilities [51], and their correlation with RP was thus expected, it was interesting to see that ChA IC50 showed a positive correlation with TP and TF, indicating lower activity of the extracts rich in flavonoids and other phenols. This is rather unexpected because flavonoids are well-known ion chelators [52]. As previously noted, TF and TP were better extracted with hydroethanolic mixtures. However, it seems that the aqueous extraction is better suited for obtaining the extracts with high chelating abilities. Several other studies also demonstrated higher chelating activity of aqueous extracts in comparison with the hydroethanolic extracts [53].
The second group of variables, TPA, TAA, and FRAP, correlated positively (Figure 3a) and significantly (Figure 3b) with one another and, in some cases, with the variables from the first group. Expectedly, the results of the reducing assays (TAA, FRAP from the second, and RP from the first group of assays, respectively) showed a good correlation. It seems that phenolic acids were responsible for most of the observed reducing properties of the extracts as TPA was in a statistically significant positive correlation with all the assays based on this type of activity (Figure 3a,b, Table 8). Interestingly, in addition to the RP assay from the previous group, TP correlated only with the FRAP assay and not with the TAA. On the other hand, TF did not show any connection to any of the assays in the second group. It is not unusual that different antioxidants would give comparable but not identical results in different electron transfer-based assays. This is due to the specific conditions of every reaction such as redox potential, pH, and kinetics [54]. In this particular case, the reason may lay in typically different reduction potentials of phenolic acid and flavonoids, which, in addition to their chemical characteristics, may also influence their biological behavior [55].
Among the remaining variables, the IC50 value of ABTS RSA and DPPH RSA correlated well with one another (Figure 3, Table 8). In addition, the IC50 value of ABTS was negatively affected by TP, TF, and TPA, indicating a positive correlation with the actual activity in the assay (Table 8). The IC50 values of DPPH RSA, on the other hand, were affected only by TPA. Knowing that numerous phenolic substances may form resonance-stabilized phenoxyl radicals which scavenge other free radicals and reduce oxidative stress [37], the role of phenolic substances in these assays is not surprising. While ANT did not show any significant interaction with the selected groups of the phenolic compounds, AG was affected by TP and TF content, further confirming the α-glucosidase inhibitory effects of flavonoids [47] and other phenolics [48,49] present in the extracts. It may also be observed that the coefficients of determinations were typically low (Table 8), indicating that TP, TF, and TPA simultaneously influence the results of the performed antioxidant activity assays [56]. While it was not possible to ascertain that phenolic compounds were the only metabolites responsible for all the observed activity in the presented work, the statistically significant correlations between the content of phenolic compounds, and the results of the majority of assays presented herein, show that they do play a pivotal role in the performed assays. The determination of all the pyhtochemical components of the investigated extracts was outside of scope of this work. However, it is also possible that other compounds may be partly involved in the observed activity. This is especially true for the activity in the β-carotene-linoleic acid assay that showed no connection to any of the types of phenolic compounds quantified in this work. It is our hope that comprehensive analytical studies, who will disclose the full spectrum of plant metabolites responsible for the activity in this and the other assays, will be performed in the future.
The results presented here confirm traditional medicine as a starting place for development of new antidiabetics. Croatian ethnomedicine in particular was shown to be a rich source of traditional remedies for T2D whose activity may be based on their bioactive phenolics, antioxidant, and anti-α-glucosidase properties. However, the effects of the investigated plants greatly varied according to the species and the solvent used for the extraction. Some of the plants investigated in this study, like sage and white mulberry, were previously well-researched in relation to their antioxidant and antidiabetic properties. Several studies have noted the abundance of phenolic compounds in sage extracts, connecting them to the potential antidiabetic effects of this plant [45]. Sage phenolics may affect carbohydrate digestion [57], inhibit hepatocyte gluconeogenesis, and decrease insulin resistance. In this study, hydroethanolic sage extract was shown to be an excellent α-glucosidase inhibitor, especially when compared to the aqueous one. Better activity of the sage extracts prepared using moderately polar solvents was also observed in the study of Mahdi et al. [57]. In their study, the extract prepared using ethyl-acetate was better inhibitor of α-amylase and α-glucosidase than the extracts prepared using either hydro-methanol solution or n-butanol. The authors related this effect to the presence of flavonoids that ethyl acetate extract was particularly abundant in. The same effect was noted in this study with flavonoid-rich 80% ethanolic extract.
Another excellent α-glucosidase inhibitor in this study was white mulberry. Its leaf is used as a traditional antidiabetic in both Croatian and Chinese ethnomedicine. Superior anti-α-glucosidase activity of mulberry extracts observed in this work is not surprising because several studies have shown its excellent ability to inhibit this enzyme in vitro, and this effect was observed even in clinical setting [58]. A study performed in China demonstrated that flavonoid-rich mulberry leaf extracts may improve skeletal muscle insulin resistance and mitochondrial function [59]. The abundance of flavonoids and other phenolics in the hydroethanolic extract of mulberry leaf from Croatia, as well as its antioxidant and anti-glucosidase effects may well justify the widespread use of this plant. Another good inhibitor of α-glucosidase was yarrow. Previous studies have shown that aqueous extracts of this plant were better inhibitors of this enzyme than ethyl acetate extracts [46]. Since ethanol extract in this study was even more potent than the aqueous one, it seems that it should be the extract of choice for incorporation into antidiabetic formulations.
Unlike yarrow, sage, and mulberry leaf, bean pods are rather under-researched when it comes to their antidiabetic effects even though they are among the most commonly used antidiabetic remedies in Croatia [7]. However, their activity in this study was rather unremarkable, and they demonstrated only a weak activity in the large majority of the performed assays. The exception was excellent activity of the aqueous extract in the β-carotene linoleic acid assay. This activity could not be related to the phenolic compounds due to their low content in the extract. However, knowing that the pods are a source of pectic polysaccharides with antioxidant properties [60], we may postulate that they could be responsible for the observed effect in this assay. In addition to that, the abundance of magnesium in the pods may also contribute to the potential anti-T2D effects in the users of herbal teas containing pods. Similar to bean pods, centaury, another widely used antidiabetic plant, was rather poor in phenolic compounds and displayed modest effects in the majority of the assays in this study. While the anti-α-glucosidase activity of water and hydroethanolic centaury extracts is reported for the first time in this study, the activity of methanol and chloroform extracts was, similar to the results reported herein, moderate [61]. Richest in phenolic compounds in this study were elderflower extracts, material that is not so well researched for its anti-T2D activity in spite of its relatively common use in European cuisine. However, similar to the results presented herein, recent studies indicate that they are excellent antioxidants and rich source of phenolic compounds, richer in fact than elder fruits, part of the plants that are much better researched [62]. On the other hand, there are few studies on the antidiabetic effects of elder flowers. One study demonstrated that elderflowers may positively affect glucose- and fatty acid uptake in human myotubes and HepG2-cells [63]. It seems that phenolic compounds from elderflower are mostly responsible for that activity, which is not surprising given the qualitative and quantitative abundance of various elder flower phenolics detected in this study. One of the most interesting findings was very good anti-α-glucosidase activity of wormwood hydroethanolic extract. It is interesting that, in spite of wormwood widespread use in traditional digestives and alcoholic beverages, this is, to the best of our knowledge, the first report of its anti-α-glucosidase activity. In addition to that, the aqueous extract of this plant was rich in phenolic acids and demonstrated excellent antiradical, chelating, and Fe3+ reducing properties, making it one of the most interesting plants in this research. It is important to note that wormwood was the only one among the investigated plants to contain chromium, a mineral that is necessary for insulin action [12].
This study has demonstrated that the selected plants from Croatian ethnomedicine may have a significant potential in complementary therapy of diabetes. The hydroethanolic extracts were especially active, so they seem like the first candidate for development of anti-T2D supplements and herbal drugs. However, it is important to note that, before they could be widely applied, their toxicological profile should also be thoroughly assessed. For example, it is well known that sage and wormwood raw ethanolic extracts contain not only their phenolic components, but also their essential oils rich in thujone, camphor, and other potentially toxic natural compounds. For example, prolonged use or overdose of sage ethanolic extract or essential oil may produce unwanted effects such as vomiting, tachycardia, vertigo, and even convulsions [45]. It is important to note that the extracts investigated in this study were evaporated to dry prior to performing the antioxidant-and anti-glucosidase assays. In the evaporation process, not only ethanol was removed, but also essential oils, which are known to contain potentially toxic volatile compounds. This rendered the prepared extracts safer for human consumption. Great differences in the observed activity of the extracts prepared by two solvents implicate that more than one extraction method should be considered when developing new herbal treatments from traditional medicine. The displayed antioxidant and anti-glucosidase effects of the investigated plants give hope that they may be a source of new natural and affordable antidiabetics. However, before being widely accepted for use as antidiabetics, detailed studies of pharmacological activity should be performed in the clinical setting.

4. Conclusions

The results presented herein indicate that the investigated extracts were active radical scavengers, ion chelators, and reducing agents with significant α-glucosidase inhibitory activity. Ethanolic extracts from S. officinalis leaf and A. millefolium aerial parts were the most active radical scavengers, reducing agents and α-glucosidase inhibitors. Notable antioxidant activity was also displayed by S. nigra, while A. absinthium and M. alba extracts were good α-glucosidase inhibitors. A. absinthium contained chromium, a mineral that promotes insulin action. The investigated plants contained and low amounts of toxic heavy metals, deeming them safe for human use. The long-standing tradition of their use, as well as their significant antioxidant and α-glucosidase-inhibitory effects, indicate that the investigated plants represent a potentially viable alternative to conventional medicine for complementary treatment of diabetes and its complications.

Author Contributions

Conceptualization, M.Z.K.; methodology, I.S.d.C., L.V., J.J. and M.Z.K.; validation, K.B., I.S.d.C., L.V., J.J. and M.Z.K.; investigation, K.B., A.B., A.Č., I.S.d.C., L.V., J.J. and M.Z.K.; resources, I.S.d.C. and M.Z.K.; writing—original draft preparation, M.Z.K.; writing—review and editing, J.J. and L.V.; supervision, I.S.d.C. and M.Z.K. All authors have read and agreed to the published version of the manuscript.

Funding

This research is funded by the scientific support fund from University of Zagreb and Croatian Science Foundation, project Bioactive plant principles extraction using green solvents—a step towards green cosmeceuticals, Grant No. IP-2018-01-6504. The APC is funded by the authors.

Institutional Review Board Statement

Not applicable.

Informed Consent Statement

Not applicable.

Conflicts of Interest

The authors declare no conflict of interest.

References

  1. Esposito, K.; Ciotola, M.; Maiorino, M.I.; Giugliano, D. Lifestyle Approach for Type 2 Diabetes and Metabolic Syndrome. Curr. Atheroscler. Rep. 2008, 10, 523–528. [Google Scholar] [CrossRef] [PubMed]
  2. Luc, K.; Schramm-Luc, A.; Guzik, T.J.; Mikolajczyk, T.P. Oxidative Stress and Inflammatory Markers in Prediabetes and Diabetes. J. Physiol. Pharmacol. 2019, 70, 809–824. [Google Scholar] [CrossRef]
  3. Kapoor, R.; Kakkar, P. Protective Role of Morin, a Flavonoid, against High Glucose Induced Oxidative Stress Mediated Apoptosis in Primary Rat Hepatocytes. PLoS ONE 2012, 7, e41663. [Google Scholar] [CrossRef] [Green Version]
  4. Fiorentino, T.V.; Prioletta, A.; Zuo, P.; Folli, F. Hyperglycemia-Induced Oxidative Stress and Its Role in Diabetes Mellitus Related Cardiovascular Diseases. Curr. Pharm. Des. 2013, 19, 5695–5703. [Google Scholar] [CrossRef] [PubMed]
  5. Lin, D.; Xiao, M.; Zhao, J.; Li, Z.; Xing, B.; Li, X.; Kong, M.; Li, L.; Zhang, Q.; Liu, Y.; et al. An Overview of Plant Phenolic Compounds and Their Importance in Human Nutrition and Management of Type 2 Diabetes. Molecules 2016, 21, 1374. [Google Scholar] [CrossRef] [PubMed]
  6. Truba, J.; Stanisławska, I.; Walasek, M.; Wieczorkowska, W.; Woliński, K.; Buchholz, T.; Melzig, M.F.; Czerwińska, M.E. Inhibition of Digestive Enzymes and Antioxidant Activity of Extracts from Fruits of Cornus alba, Cornus sanguinea Subsp. Hungarica and Cornus florida—A Comparative Study. Plants 2020, 9, 122. [Google Scholar] [CrossRef] [Green Version]
  7. Zovko Končić, M.; Bljajić, K. Chapter 42—Traditional Herbal Products Used for the Management of Diabetes in Croatia: Linking Traditional Use with α-Glucosidase-Inhibitory Activity. In Bioactive Food as Dietary Interventions for Diabetes, 2nd ed.; Watson, R.R., Preedy, V.R., Eds.; Academic Press: Oxford, UK, 2019; pp. 647–664. ISBN 978-0-12-813822-9. [Google Scholar]
  8. Helmstädter, A. Beans and Diabetes: Phaseolus Vulgaris Preparations as Antihyperglycemic Agents. J. Med. Food 2010, 13, 251–254. [Google Scholar] [CrossRef]
  9. Wen, Y.; He, L.; Peng, R.; Lin, Y.; Zhao, L.; Li, X.; Ye, L.; Yang, J. A Novel Strategy to Evaluate the Quality of Herbal Products Based on the Chemical Profiling, Efficacy Evaluation and Pharmacokinetics. J. Pharm. Biomed. Anal. 2018, 161, 326–335. [Google Scholar] [CrossRef]
  10. Bilal, M.; Iqbal, M.S.; Shah, S.B.; Rasheed, T.; Iqbal, H.M.N. Diabetic Complications and Insight into Antidiabetic Potentialities of Ethno- Medicinal Plants: A Review. Recent Pat. Inflamm Allergy Drug Discov. 2018, 12, 7–23. [Google Scholar] [CrossRef]
  11. Dghaim, R.; Al Khatib, S.; Rasool, H.; Ali Khan, M. Determination of Heavy Metals Concentration in Traditional Herbs Commonly Consumed in the United Arab Emirates. J. Environ. Public Health 2015, 2015, e973878. [Google Scholar] [CrossRef] [Green Version]
  12. Lewicki, S.; Zdanowski, R.; Krzyżowska, M.; Lewicka, A.; Dębski, B.; Niemcewicz, M.; Goniewicz, M. The Role of Chromium III in the Organism and Its Possible Use in Diabetes and Obesity Treatment. Ann. Agric. Environ. Med. 2014, 21, 331–335. [Google Scholar] [CrossRef] [PubMed]
  13. European Pharmacopoeia, 8th ed.; Council of Europe: Strasbourg, France, 2013.
  14. Abbasi, A.M.; Khan, M.A.; Khan, N.; Shah, M.H. Ethnobotanical Survey of Medicinally Important Wild Edible Fruits Species Used by Tribal Communities of Lesser Himalayas-Pakistan. J. Ethnopharmacol. 2013, 148, 528–536. [Google Scholar] [CrossRef] [PubMed]
  15. Singleton, V.L.; Orthofer, R.; Lamuela-Raventós, R.M. Analysis of total phenols and other oxidation substrates and antioxidants by means of folin-ciocalteu reagent. In Methods in Enzymology; Elsevier: Amsterdam, The Netherlands, 1999; Volume 299, pp. 152–178. ISBN 978-0-12-182200-2. [Google Scholar]
  16. Kumazawa, S.; Hamasaka, T.; Nakayama, T. Antioxidant Activity of Propolis of Various Geographic Origins. Food Chem. 2004, 84, 329–339. [Google Scholar] [CrossRef]
  17. Nicolle, C.; Carnat, A.; Fraisse, D.; Lamaison, J.-L.; Rock, E.; Michel, H.; Amouroux, P.; Rémésy, C. Characterisation and Variation of Antioxidant Micronutrients in Lettuce (Lactuca sativa Folium). J. Sci. Food Agric. 2004, 84, 2061–2069. [Google Scholar] [CrossRef]
  18. Re, R.; Pellegrini, N.; Proteggente, A.; Pannala, A.; Yang, M.; Rice-Evans, C. Antioxidant Activity Applying an Improved ABTS Radical Cation Decolorization Assay. Free Radic. Biol. Med. 1999, 26, 1231–1237. [Google Scholar] [CrossRef]
  19. Končić, M.Z.; Barbarić, M.; Perković, I.; Zorc, B. Antiradical, Chelating and Antioxidant Activities of Hydroxamic Acids and Hydroxyureas. Molecules 2011, 16, 6232–6242. [Google Scholar] [CrossRef] [Green Version]
  20. Prieto, P.; Pineda, M.; Aguilar, M. Spectrophotometric Quantitation of Antioxidant Capacity through the Formation of a Phosphomolybdenum Complex: Specific Application to the Determination of Vitamin E. Anal. Biochem. 1999, 269, 337–341. [Google Scholar] [CrossRef]
  21. Bljajić, K.; Petlevski, R.; Vujić, L.; Čačić, A.; Šoštarić, N.; Jablan, J.; Saraiva de Carvalho, I.; Zovko Končić, M. Chemical Composition, Antioxidant and α-Glucosidase-Inhibiting Activities of the Aqueous and Hydroethanolic Extracts of Vaccinium myrtillus Leaves. Molecules 2017, 22, 703. [Google Scholar] [CrossRef]
  22. Benzie, I.F.; Strain, J.J. The Ferric Reducing Ability of Plasma (FRAP) as a Measure of “Antioxidant Power”: The FRAP Assay. Anal. Biochem. 1996, 239, 70–76. [Google Scholar] [CrossRef] [Green Version]
  23. Tiwari, A.K.; Swapna, M.; Ayesha, S.B.; Zehra, A.; Agawane, S.B.; Madhusudana, K. Identification of Proglycemic and Antihyperglycemic Activity in Antioxidant Rich Fraction of Some Common Food Grains. Int. Food Res. J. 2011, 18, 915–923. [Google Scholar]
  24. Phimarn, W.; Wichaiyo, K.; Silpsavikul, K.; Sungthong, B.; Saramunee, K. A Meta-Analysis of Efficacy of Morus alba Linn. to Improve Blood Glucose and Lipid Profile. Eur. J. Nutr. 2017, 56, 1509–1521. [Google Scholar] [CrossRef]
  25. Evans, J.L.; Bahng, M. Non-pharmaceutical intervention options for type 2 diabetes: Diets and Dietary Supplements (Botanicals, Antioxidants, and Minerals). In Endotext; De Groot, L.J., Chrousos, G., Dungan, K., Feingold, K.R., Grossman, A., Hershman, J.M., Koch, C., Korbonits, M., McLachlan, R., New, M., et al., Eds.; MDText.com, Inc.: South Dartmouth, MA, USA, 2000. [Google Scholar]
  26. Siddiqui, K.; Bawazeer, N.; Joy, S.S. Variation in Macro and Trace Elements in Progression of Type 2 Diabetes. Sci. World J. 2014, 2014, 461591. [Google Scholar] [CrossRef] [PubMed] [Green Version]
  27. Salamon, I.; Labun, P.; Petruska, P. Occurrence of Heavy Metals, Radioactivity, and Pesticide Residues in Raw Materials of Elderberry and Other Herbs and Fruits in Slovak Republic. Acta Hortic. 2015, 1061, 259–266. [Google Scholar] [CrossRef]
  28. Krejpcio, Z.; Król, E.; Sionkowski, S. Evaluation of Heavy Metals Contents in Spices and Herbs Available on the Polish Market. Pol. J. Environ. Stud. 2007, 16, 97–100. [Google Scholar]
  29. Sung, T.-C.; Huang, J.-W.; Guo, H.-R. Association between Arsenic Exposure and Diabetes: A Meta-Analysis. Biomed. Res. Int 2015, 2015, 368087. [Google Scholar] [CrossRef] [PubMed]
  30. World Health Organization. WHO Guidelines for Assessing Quality of Herbal Medicines with Reference to Contaminants and Residues; WHO Press: Geneva, Switzerland, 2007. [Google Scholar]
  31. Matos, A.L.; Bruno, D.F.; Ambrósio, A.F.; Santos, P.F. The Benefits of Flavonoids in Diabetic Retinopathy. Nutrients 2020, 12, 3169. [Google Scholar] [CrossRef] [PubMed]
  32. Ghorbani, A. Mechanisms of Antidiabetic Effects of Flavonoid Rutin. Biomed. Pharmacother. 2017, 96, 305–312. [Google Scholar] [CrossRef]
  33. Gülçin, İ. Antioxidant Activity of Food Constituents: An Overview. Arch. Toxicol. 2012, 86, 345–391. [Google Scholar] [CrossRef]
  34. Nakamura, K.; Ogasawara, Y.; Endou, K.; Fujimori, S.; Koyama, M.; Akano, H. Phenolic Compounds Responsible for the Superoxide Dismutase-like Activity in High-Brix Apple Vinegar. J. Agric. Food Chem. 2010, 58, 10124–10132. [Google Scholar] [CrossRef] [PubMed]
  35. Vinayagam, R.; Jayachandran, M.; Xu, B. Antidiabetic Effects of Simple Phenolic Acids: A Comprehensive Review. Phytother. Res. 2016, 30, 184–199. [Google Scholar] [CrossRef]
  36. Moldovan, L.; Gaspar, A.; Toma, L.; Craciunescu, O.; Saviuc, C. Comparison of Polyphenolic Content and Antioxidant Capacity of Five Romanian Traditional Medicinal Plants. Rev. Chim. 2011, 62, 299–303. [Google Scholar]
  37. Nankar, R.; Prabhakar, P.K.; Doble, M. Hybrid Drug Combination: Combination of Ferulic Acid and Metformin as Anti-Diabetic Therapy. Phytomedicine 2017, 37, 10–13. [Google Scholar] [CrossRef] [PubMed]
  38. Yan, Y.; Zhou, X.; Guo, K.; Zhou, F.; Yang, H. Use of Chlorogenic Acid against Diabetes Mellitus and Its Complications. J. Immunol. Res. 2020, 2020, 9680508. [Google Scholar] [CrossRef] [PubMed]
  39. Mocan, A.; Babotă, M.; Pop, A.; Fizeșan, I.; Diuzheva, A.; Locatelli, M.; Carradori, S.; Campestre, C.; Menghini, L.; Sisea, C.R.; et al. Chemical Constituents and Biologic Activities of Sage Species: A Comparison between Salvia officinalis L., S. glutinosa L. and S. transsylvanica (Schur Ex Griseb. & Schenk) Schur. Antioxidants 2020, 9, 480. [Google Scholar] [CrossRef]
  40. Viapiana, A.; Wesolowski, M. The Phenolic Contents and Antioxidant Activities of Infusions of Sambucus nigra L. Plant Foods Hum. Nutr. 2017, 72, 82–87. [Google Scholar] [CrossRef] [PubMed] [Green Version]
  41. Geszprych, A.; Przybył, J.L.; Kuczerenko, A.; Wȩglarz, Z. Diversity of Wormwood (Artemisia absinthium L.) Growing Wild in Poland in Respect of the Content and Composition of Essential Oil and Phenolic Compounds. Acta Hortic. 2011, 925, 123–130. [Google Scholar] [CrossRef]
  42. Chawla, R.; Thakur, P.; Chowdhry, A.; Jaiswal, S.; Sharma, A.; Goel, R.; Sharma, J.; Priyadarshi, S.S.; Kumar, V.; Sharma, R.K.; et al. Evidence Based Herbal Drug Standardization Approach in Coping with Challenges of Holistic Management of Diabetes: A Dreadful Lifestyle Disorder of 21st Century. J. Diabetes Metab. Disord. 2013, 12. [Google Scholar] [CrossRef] [Green Version]
  43. Faraone, I.; Rai, D.K.; Russo, D.; Chiummiento, L.; Fernandez, E.; Choudhary, A.; Milella, L. Antioxidant, Antidiabetic, and Anticholinesterase Activities and Phytochemical Profile of Azorella Glabra Wedd. Plants 2019, 8, 265. [Google Scholar] [CrossRef] [Green Version]
  44. Pokorny, J.; Yanishlieva, N.; Gordon, M.H. Antioxidants in Food: Practical Applications; CRC Press: Boca Raton, FL, USA, 2001. [Google Scholar]
  45. Ghorbani, A.; Esmaeilizadeh, M. Pharmacological Properties of Salvia Officinalis and Its Components. J. Tradit. Complement. Med. 2017, 7, 433–440. [Google Scholar] [CrossRef]
  46. Zengin, G.; Aktumsek, A.; Ceylan, R.; Uysal, S.; Mocan, A.; Guler, G.O.; Mahomoodally, M.F.; Glamočlija, J.; Ćirić, A.; Soković, M. Shedding Light on the Biological and Chemical Fingerprints of Three Achillea Species (A. biebersteinii, A. millefolium and A. teretifolia). Food Funct. 2017, 8, 1152–1165. [Google Scholar] [CrossRef]
  47. Jiménez-Aspee, F.; Theoduloz, C.; Soriano, M.D.P.C.; Ugalde-Arbizu, M.; Alberto, M.R.; Zampini, I.C.; Isla, M.I.; Simirigiotis, M.J.; Schmeda-Hirschmann, G. The Native Fruit Geoffroea Decorticans from Arid Northern Chile: Phenolic Composition, Antioxidant Activities and In Vitro Inhibition of Pro-Inflammatory and Metabolic Syndrome-Associated Enzymes. Molecules 2017, 22, 1565. [Google Scholar] [CrossRef] [PubMed] [Green Version]
  48. Oboh, G.; Agunloye, O.M.; Adefegha, S.A.; Akinyemi, A.J.; Ademiluyi, A.O. Caffeic and Chlorogenic Acids Inhibit Key Enzymes Linked to Type 2 Diabetes (in vitro): A Comparative Study. J. Basic Clin. Physiol. Pharmacol. 2015, 26, 165–170. [Google Scholar] [CrossRef] [PubMed]
  49. Li, Y.Q.; Zhou, F.C.; Gao, F.; Bian, J.S.; Shan, F. Comparative Evaluation of Quercetin, Isoquercetin and Rutin as Inhibitors of α-Glucosidase. J. Agric. Food Chem. 2009, 57, 11463–11468. [Google Scholar] [CrossRef]
  50. Adisakwattana, S.; Ruengsamran, T.; Kampa, P.; Sompong, W. In Vitro Inhibitory Effects of Plant-Based Foods and Their Combinations on Intestinal α-Glucosidase and Pancreatic α-Amylase. BMC Complement. Altern. Med. 2012, 12, 1–8. [Google Scholar] [CrossRef] [PubMed] [Green Version]
  51. Van Hung, P. Phenolic Compounds of Cereals and Their Antioxidant Capacity. Crit. Rev. Food Sci. Nutr. 2016, 56, 25–35. [Google Scholar] [CrossRef] [PubMed]
  52. Leopoldini, M.; Russo, N.; Toscano, M. The Molecular Basis of Working Mechanism of Natural Polyphenolic Antioxidants. Food Chem. 2011, 125, 288–306. [Google Scholar] [CrossRef]
  53. Diaz, P.; Jeong, S.C.; Lee, S.; Khoo, C.; Koyyalamudi, S.R. Antioxidant and Anti-Inflammatory Activities of Selected Medicinal Plants and Fungi Containing Phenolic and Flavonoid Compounds. Chin. Med. 2012, 7, 26. [Google Scholar] [CrossRef] [Green Version]
  54. Berker, K.I.; Güçlü, K.; Tor, İ.; Apak, R. Comparative Evaluation of Fe(III) Reducing Power-Based Antioxidant Capacity Assays in the Presence of Phenanthroline, Batho-Phenanthroline, Tripyridyltriazine (FRAP), and Ferricyanide Reagents. Talanta 2007, 72, 1157–1165. [Google Scholar] [CrossRef]
  55. Kling, B.; Bücherl, D.; Palatzky, P.; Matysik, F.-M.; Decker, M.; Wegener, J.; Heilmann, J. Flavonoids, Flavonoid Metabolites, and Phenolic Acids Inhibit Oxidative Stress in the Neuronal Cell Line HT-22 Monitored by ECIS and MTT Assay: A Comparative Study. J. Nat. Prod. 2014, 77, 446–454. [Google Scholar] [CrossRef]
  56. Wojdyło, A.; Oszmiański, J.; Czemerys, R. Antioxidant Activity and Phenolic Compounds in 32 Selected Herbs. Food Chem. 2007, 105, 940–949. [Google Scholar] [CrossRef]
  57. Mahdi, S.; Azzi, R.; Lahfa, F.B. Evaluation of in Vitro α-Amylase and α-Glucosidase Inhibitory Potential and Hemolytic Effect of Phenolic Enriched Fractions of the Aerial Part of Salvia officinalis L. Diabetes Metab. Syndr. Clin. Res. Rev. 2020, 14, 689–694. Available online: https://pubmed.ncbi.nlm.nih.gov/32442919/ (accessed on 1 December 2020). [CrossRef] [PubMed]
  58. Józefczuk, J.; Malikowska, K.; Glapa, A.; Stawińska-Witoszyńska, B.; Nowak, J.K.; Bajerska, J.; Lisowska, A.; Walkowiak, J. Mulberry Leaf Extract Decreases Digestion and Absorption of Starch in Healthy Subjects—A Randomized, Placebo-Controlled, Crossover Study. Adv. Med. Sci. 2017, 62, 302–306. [Google Scholar] [CrossRef] [PubMed]
  59. Meng, Q.; Qi, X.; Fu, Y.; Chen, Q.; Cheng, P.; Yu, X.; Sun, X.; Wu, J.; Li, W.; Zhang, Q.; et al. Flavonoids Extracted from Mulberry (Morus alba L.) Leaf Improve Skeletal Muscle Mitochondrial Function by Activating AMPK in Type 2 Diabetes. J. Ethnopharmacol. 2020, 248, 112326. [Google Scholar] [CrossRef] [PubMed]
  60. Patra, P.; Das, D.; Behera, B.; Maiti, T.K.; Islam, S.S. Structure Elucidation of an Immunoenhancing Pectic Polysaccharide Isolated from Aqueous Extract of Pods of Green Bean (Phaseolus vulgaris L.). Carbohydr. Polym. 2012, 87, 2169–2175. [Google Scholar] [CrossRef]
  61. Loizzo, M.R.; Saab, A.M.; Tundis, R.; Menichini, F.; Bonesi, M.; Piccolo, V.; Statti, G.A.; de Cindio, B.; Houghton, P.J.; Menichini, F. In Vitro Inhibitory Activities of Plants Used in Lebanon Traditional Medicine against Angiotensin Converting Enzyme (ACE) and Digestive Enzymes Related to Diabetes. J. Ethnopharmacol. 2008, 119, 109–116. [Google Scholar] [CrossRef]
  62. Mota, A.H.; Andrade, J.M.; Rodrigues, M.J.; Custódio, L.; Bronze, M.R.; Duarte, N.; Baby, A.; Rocha, J.; Gaspar, M.M.; Simões, S.; et al. Synchronous Insight of In Vitro and In Vivo Biological Activities of Sambucus nigra L. Extracts for Industrial Uses. Ind. Crop. Prod. 2020, 154, 112709. [Google Scholar] [CrossRef]
  63. Ho, G.T.T.; Kase, E.T.; Wangensteen, H.; Barsett, H. Effect of Phenolic Compounds from Elderflowers on Glucose- and Fatty Acid Uptake in Human Myotubes and HepG2-Cells. Molecules 2017, 22, 90. [Google Scholar] [CrossRef] [Green Version]
Figure 1. Antioxidant activity of the extracts and BHA (tested in the concentration of 8 μg/mL) in β-carotene-linoleic acid assay (ANT). The extracts’ abbreviations are presented in Table 2. Values are the average of three replications ± SD. A–F = differences between the extracts within a column (extracts not connected with the same capital letter are statistically different, Tukey post-test, p < 0.05); X = differences with the positive control within a column (extracts not connected with the same capital letter are statistically different, Dunnet’s post-test, p < 0.05).
Horticulturae 07 00015 g001
Figure 2. α-glucosidase inhibitory activity (AG IC50) of the extracts. The extracts’ abbreviations are presented in Table 2. Values are average of 3 replications ± SD; A–H = differences between the extracts within a column (extracts not connected with the same capital letter are statistically different, Tukey post-test, p < 0.05); X = differences with the positive control within a column (extracts not connected with the same capital letter are statistically different, Dunnet’s post-test, p < 0.05).
Horticulturae 07 00015 g002
Figure 3. Color maps of correlations between the measured variables (a) and corresponding p-values (b). TP = total phenolic content; TF = total flavonoid content; TPA = total phenolic acid content; ABTS = IC50 value of radical scavenging activity for ABTS free radical; DPPH = IC50 value of radical scavenging activity for DPPH free radical; ChA = IC50 value of chelating activity; ANT = antioxidant activity in β-carotene-linoleate assay; TAA = total antioxidant activity; RP = reducing power; FRAP = ferric reducing power; AG = IC50 value of α-glucosidase inhibiting activity.
Horticulturae 07 00015 g003
Table 1. Calibration curve parameters for flavonoids and phenolic acid standards.
StandardEquationr2LOD
(μg/mL)
LOQ
(μg/mL)
Caffeic acidy = 5335.00x − 19.450.99990.0120.041
Chlorogenic acidy = 2587.30x + 73.420.99960.0360.11
p-coumaric acidy = 6214.63x − 137.380.99730.090.299
Ferulic acidy = 5045.04x − 45.100.99980.0260.088
Gallic acidy = 4808.10x + 12.880.99980.0260.087
Hyperosidey = 1426.20x + 15.400.99990.0130.04
Luteoliny = 3205.25x − 46.600.99980.0250.077
Myricetiny = 4341.80x − 691.780.99970.3151.049
Quercetiney = 2200.20x − 36.750.99980.0270.083
Rosmarinic acidy = 2518.90x + 21.440.99990.0030.01
Rutiny = 3197.71x − 478.760.99880.2890.962
LOD = level of detection; LOQ = Level of quantification; y = Area under curve (mAU × s); x = amount of the standard (μg).
Table 2. The medicinal plants, extracts, and their abbreviations used in this study.
Plant SpeciesType of MaterialAbbreviation *
Artemisia absinthium L., Asteraceae (wormwood)Flowering aerial partsAA
Achillea millefolium L., Asteraceae (yarrow)Flowering aerial partsAM
Centaurium erythraea Rafn., Gentianaceae (centaury)Flowering aerial partsCE
Morus alba L., Moraceae (white mulberry)LeafMA
Phaseolus vulgaris L., Fabaceae (common bean)Fruit (pericarp)PV
Sambucus nigra L., Caprifoliaceae (elder)Flower SN
Salvia officinalis L., Lamiaceae (sage)LeafSO
* = In further text, the suffixes denote the solvents used for extraction: -E = extract prepared using 80% ethanol (v/v); -W = extract prepared using water.
Table 3. Content of investigated metals in dry plant material.
Plant
Material
Cr
mg/kg
Mg
mg/kg
Zn
mg/kg
Mn
mg/kg
Cu
mg/kg
Pb
mg/kg
Ni
mg/kg
As
mg/kg
AA0.5 ± 0.1205 ± 8031.9 ± 0.1528.4 ± 0.225.2 ± 0.11.6 ± 0.052.0 ± 0.050.8 ± 0.05
AMn.d.655 ± 9021.4 ± 0.124.6 ± 0.211.0 ± 0.10.8 ± 0.050.6 ± 0.051.1 ± 0.05
CEn.d.295 ± 8029.5 ± 1.337.1 ± 2.313.6 ± 1.00.4 ± 4.253.1 ± 0.071.3 ± 4.0
MAn.d.795 ± 11014.4 ± 0.19.5 ± 0.25.6 ± 0.10.8 ± 0.051.5 ± 0.051.0 ± 0.05
PVn.d.1575 ± 11016.4 ± 0.112.5 ± 0.211.3 ± 0.10.3 ± 0.055.8 ± 0.11.2 ± 0.05
SNn.d.715 ± 10522.5 ± 0.211.1±0.212.0 ± 0.10.4 ± 0.050.4 ± 0.051.1 ± 0.05
SOn.d.310 ± 7516.7 ± 0.17.8 ± 0.19.7 ± 0.10.4 ± 0.050.5 ± 0.050.6 ± 0.05
The abbreviations for plant material are presented in Table 2; n.d. = not detected. Values are average of 3 replications ± SD.
Table 4. Content of total phenols (TP), total flavonoids (TF), and total phenolic acids (TPA) in the extracts.
ExtractTP
(mg GAE/g DW)
TF
(mg QE/g DW)
TPA
(mg CAE/g DW)
AA-E154.37 ±18.95 CDE63.67 ± 2.74 BCD13.46 ± 0.74 GH
AA-W68.62 ± 8.33 DE17.25 ± 1.09 DE42.77 ± 0.8 D
AM-E362.58 ± 36.06 AB43.43 ± 1.6 CDE54.41 ± 2.23 C
AM-W116.67 ± 3.73 DE38.4 ± 0.39 CDE74.7 ± 1.35 A
CE-E111.92 ± 20.24 DE17.43 ± 0.57 DE9.08 ± 0.6 HI
CE-W44.6 ± 4.99 DE13.29 ± 0.85 DE13.04 ± 0.19 GH
MA-E281.29 ± 6.75 BC154.51 ± 22.64 A14.37 ± 0.64 GH
MA-W89.74 ± 7.36 DE31.51 ± 4.25 CDE16.37 ± 1.15 G
PV-E54.51 ± 7.87 DE34.07 ± 5.17 CDE3.8 ± 0.51 IJ
PV-W27.59 ± 1.89 E6.22 ± 1.23 E1.54 ± 0.00 E
SN-E423.51 ± 13.88 A105.55 ± 3.24 AB35.87 ± 1.06 E
SN-W87.08 ± 5.56 DE21.39 ± 1.03 CDE31.78 ± 2.59 E
SO-E271.99 ± 10.66 BC140.03 ± 21.35 A65.67 ± 2.97 B
SO-W147.78 ± 14.85 CDE47.85 ± 4.6 CDE77.47 ± 3.76 A
The extracts’ abbreviations are presented in Table 2; CAE = caffeic acid equivalents; DW—dry weight of the extract; GAE = gallic acid equivalents; QE = Quercetin equivalents; Values are average of three replications ± SD. A–J = differences between the extracts within a column (extracts not connected with the same capital letter are statistically different, Tukey post-test, p < 0.05).
Table 5. Quantity of individual phenolic acids and flavonoids in the extracts.
ExtractThe Identified Flavonoids and Phenolic Acid
AA-EChlorogenic acid (12.73 mg/g DW), Ferulic acid (12.07 mg/g DW), Rosmarinic acid (9.32 mg/g DW), Hyperoside (1.62 mg/g DW), Rutin (15.53 mg/g DW)
AA-WHyperoside (0.89 mg/g DW)
AM-EChlorogenic acid (39.72 mg/g DW), Ferulic acid (2.34 mg/g DW), Luteolin (3.19 mg/g DW), Rutin (30.24 mg/g DW)
AM-WChlorogenic acid (11.07 mg/g DW), Ferulic acid (1.2 mg/g DW),
CE-Ep-coumaric acid (3.55 mg/g DW), Gallic acid (1.22 mg/g DW)
CE-Wp-coumaric acid (2.82 mg/g DW), Gallic acid (3.67 mg/g DW)
MA-ECaffeic acid (0.53 mg/g DW), Chlorogenic acid (15.16 mg/g DW), Rutin (14.74 mg/g DW)
MA-WCaffeic acid (2.68 mg/g DW)
PV-Ep-coumaric acid (<LOQ)
PV-Wn.d.
SN-ECaffeic acid (0.95 mg/g DW), Chlorogenic acid (25.83 mg/g DW), Ferulic acid (9.38 mg/g DW), Myricetin (16.79 mg/g DW), Rutin (41.9 mg/g DW)
SN-WCaffeic acid (0.45 mg/g DW), Chlorogenic acid (10.27 mg/g DW), Ferulic acid (1.67 mg/g DW), Myricetin (14.79), Rutin (16.31 mg/g DW)
SO-EFerulic acid (5.11), Rosmarinic acid (39.2 mg/g DW), Rutin (22.62 mg/g DW)
SO-WFerulic acid (1.19 mg/g DW), Rosmarinic acid (0.45 mg/g DW), Rutin (14.2 mg/g DW)
The extracts’ abbreviations are presented in Table 2; DW = dry weight of the extract; <LOQ = below level of quantification, n.d. = not detected.
Table 6. Radical scavenging activity for ABTS (IC50 ABTS RSA) and DPPH (IC50 DPPH RSA) free radical and chelating activity (ChA).
Extract(IC50 ABTS RSA)
(μg DW/mL)
IC50 DPPH RSA
(μg DW/mL)
ChA IC50
(μg DW/mL)
AA-E799.6 ± 24.3 F156.85 ± 8.37 DEF56.04 ± 1.40 FGX
AA-W1066.1 ± 28.2 E206.27 ± 2.32 D18.26 ± 1.50 GX
AM-E569.0 ± 29.3 G68.78 ± 7.63 FGX334.37 ± 17.87 BCDE
AM-W481.6 ± 32.7 GH75.24 ± 4.10 FGX223.59 ± 14.35 CDEFG
CE-E1474.1 ± 57.2 D835.86 ± 64.59 B272.88 ± 7.01 CDEF
CE-W2399.9 ± 160.7 B388.75 ± 32.79 C230.41 ± 30.42 CDEFG
MA-E515.1 ± 41.3 GH177.79 ± 10.87 DE399.40 ± 39.02 BC
MA-W749.7 ± 18.3 F225.50 ± 19.05 D277.29 ± 12.97 CDEF
PV-E1997.5 ± 76.7 C876.82 ± 87.35 B392.19 ± 7.43 BC
PV-W2700.7 ± 72.0 A2127.86 ± 35.89 A142.99 ± 3.72 DEFGX
SN-E370.3 ± 10.5 HI85.91 ± 9.86 FG541.13 ± 61.51 B
SN-W548.1 ± 0.1 G84.07 ± 2.41 FGX364.11 ± 30.72 BCD
SO-E300.4 ± 6.6 IJ68.86 ± 6.15 FGX900.74 ± 265.24 A
SO-W185.2 ± 6.8 J40.70 ± 0.84 GX217.45 ± 12.26 CDEFG
Standarda 41.7 ± 1.8 Xb 8.40 ± 0.19 Xc 17.76 ± 3.90 X
The extracts’ abbreviations are presented in Table 2; Standards: a = Trolox, b = BHA, c = EDTA; DW—dry weight of the extract; Values are an average of three replications ± SD; A–J = differences between the extracts within a column (extracts not connected with the same capital letter are statistically different, Tukey post-test, p < 0.05); X = differences with the positive control within a column (extracts not connected with the same capital letter are statistically different, Dunnet’s post-test, p < 0.05).
Table 7. Total antioxidant activity (TAA), reducing power (RP), and ferric reducing power (FRAP) of the extracts.
ExtractTAA
mg AAE/g DW
RP
mg TA/g DW
FRAP
mg TA/g DW
AA-E149.0 ± 4.0 D189.5 ± 5.8 E123.3 ± 6.3 F
AA-W81.2 ± 2.7 H50.9 ± 2.6 IJ77.7 ± 3.0 G
AM-E94.7 ± 1.5 G261.6 ± 9.0 C204.4 ± 4.3 E
AM-W170.7 ± 7.2 C81.8 ± 2.1 H288.1 ± 6.4 D
CE-E111.2 ± 1.0 F65.0 ± 6.7 HI56.4 ± 3.8 H
CE-W134.7 ± 3.0 E29.4 ± 1.4 JK42.5 ± 1.8 H
MA-E142.3 ± 4.1 DE140.0 ± 1.8 F109.6 ± 4.4 F
MA-W116.9 ± 1.6 F61.0 ± 1.7 HI86.2 ± 4.6 G
PV-E30.1 ± 1.4 I21.8 ± 0.9 K14.3 ± 0.3 I
PV-W26.4 ± 0.5 I25.3 ± 2.1 K12.6 ± 0.3 I
SN-E137.1 ± 1.7 DE385.5 ± 23.4 B323.4 ± 10.4 C
SN-W141.6 ± 6.5 DE111.6 ± 4.3 G203.4 ± 7.9 E
SO-E199.5 ± 3.4 B501.9 ± 6.9 A435.9 ± 0.2 A
SO-W220.6 ± 10.6 A234.8 ± 12.1 D408.3 ± 5.4 B
The extracts’ abbreviations are presented in Table 2; AE = ascorbic acid equivalents; TE = Trolox equivalents. DW—dry weight of the extract; values are the average of three replications ± SD; A–K = differences between the extracts within a column (extracts not connected with the same capital letter are statistically different, Tukey post-test, p < 0.05); X = differences with the positive control within a column (extracts not connected with the same capital letter are statistically different, Dunnet’s post-test, p < 0.05).
Table 8. Coefficients of determination for significant (p < 0) correlations between the content of phenolic compounds (TP, TF, and TPA) and antioxidant activity.
ABTS RSADPPH RSAChAANTTAARPFRAPAG
TPr2 = 0.39 (−)n.s.r2 = 0.31 (+) n.s.r2 = 0.64 (+)r2 = 0.31 (+)r2 = 0.30 (−)
TFr2 = 0.31 (−)n.s.r2 = 0.46 (+) n.s.r2 = 0.51 (+)n.s.r2 = 0.36 (−)
TPAr2 = 0.48 (−)r2 = 0.35 (−)n.s. r2 = 0.45 (+)r2 = 0.29 (+)r2 = 0.74 (+)n.s.
TP = total phenolic content; TF = total flavonoid content; TPA = total phenolic acid content; ABTS RSA = IC50 value of radical scavenging activity for ABTS free radical; DPPH RSA = IC50 value of radical scavenging activity for DPPH free radical; ChA = IC50 value of chelating activity; ANT = antioxidant activity in β-carotene-linoleate assay; TAA = total antioxidant activity; RP = reducing power; FRAP = ferric reducing power; AG = IC50 value of α-glucosidase inhibiting activity; (−) = negative correlation; (+) = positive correlation. n.s.: Not significant.
Publisher’s Note: MDPI stays neutral with regard to jurisdictional claims in published maps and institutional affiliations.

