Article

Drought and Darkness during Long-Term Simulated Shipping Delay Post-Shipping Flowering of Phalaenopsis Sogo Yukidian ‘V3’

Department of Horticulture & Life Science, Yeungnam University, Gyeongsan 38541, Korea
*
Author to whom correspondence should be addressed.
Horticulturae 2021, 7(11), 483; https://doi.org/10.3390/horticulturae7110483
Submission received: 9 September 2021 / Revised: 24 October 2021 / Accepted: 8 November 2021 / Published: 10 November 2021
(This article belongs to the Section Floriculture, Nursery and Landscape, and Turf)

Abstract

:
We investigated the relationship between simulated shipping (SS) without watering or light and post-shipping growth and flowering of Phalaenopsis Sogo Yukidian ‘V3’. Two experimental environments were created: a low-temperature chamber for simulated shipping and a growth chamber for simulated finishing at the destination. Plants from both the control and treatment groups were moved from the low-temperature chamber to the growth chamber after the end of the simulated shipping. Control plants received continuous light and regular irrigation; plants in the treatment group were placed in the low-temperature chamber under light (LSS) or dark (DSS) conditions for 10, 20, 30, 40, or 50 days, without irrigation. Once DSS duration exceeded 40 days, the leaf-yellowing rate increased rapidly. Chlorophyll content decreased from day 10 to 30 of DSS and slightly increased in LSS and DSS over 40 days. The photochemical reflectance index decreased with the SS duration. The maximum quantum yield PSII photochemistry (Fv/Fm) values sharply decreased after the end of SS; after 40 days, neither LSS nor DSS plants recovered to the normal range. In the same SS duration, the number of days to spiking was delayed in the DSS. In addition, the number of days to spiking was delayed, owing to the longer SS duration. LSS for 50 days induced early flowering, as in the control group, but lowered flower quality. The results demonstrate that drought stress from long-term shipping (>40 days) delayed flowering. In particular, DSS delayed flowering more than LSS due to the decrease in chlorophyll content and the reduction in carbohydrates through respiration.

1. Introduction

Moth orchids (Phalaenopsis spp.) originate from tropical and subtropical areas of Asia, where annual temperatures range from 20 to 27 °C. These are epiphytic orchids that mainly grow under the canopy in tropical rainforests [1,2]. Phalaenopsis spp., which are Crassulacean acid metabolism (CAM) plants, have a low light demand and a special photosynthesis mechanism by which the stomata open during the night to fix CO2 in the form of organic acids and then close during the day, preventing water loss and allowing the reuse of CO2 from respiration for photosynthesis [3,4]. Phalaenopsis spp. are very popular as potted plants and cut flowers because of their high ornamental value—in particular, the various shapes, sizes, and colors of the flowers—and long flower life [5]. They are also commercially grown and exported on a large scale, thus reducing production costs. Global demand for these orchids continues to increase [6].
Phalaenopsis spp. have different ecological and physiological characteristics from those of general potted flowering plants and require a specific temperature range at each stage of production for high-quality commercial production [1]. Maintaining an ambient temperature of 28–30 ℃ in the vegetative phase suppresses flowering and promotes leaf growth. During the spiking (emergence of an inflorescence) phase, the temperature is lowered to 18–23 ℃ to induce the appearance of the spike. During the flowering and commercializing phases, the temperature is maintained at 20–25 °C [7]. In particular, it is more important to adjust the appropriate low temperature during the day than at night during the spiking and flowering phases of Phalaenopsis. Furthermore, if the night temperature is kept appropriately low during these phases, the flowering rate increases [8].
Phalaenopsis is the most popular orchid produced in Korea, accounting for 43.7% of the total orchid production as of 2019 [9]. Despite the widening domestic market for Phalaenopsis orchids, domestic production is limited by the relatively high cost of young plants, most of which are imported [10]. Consequently, the domestic orchid industry has been declining [11]. However, the growth in overseas markets has the potential to increase income to Korean orchid growers. Since 2017, Korea has been permitted by the United States Department of Agriculture to export Phalaenopsis with potting medium to the United States under a specified process [12]. The demand for orchids in the U.S. market continues to grow, requiring a stable shipping system for long-distance exports of Phalaenopsis.
Currently, the United States imports the largest volume of Phalaenopsis plants from Taiwan [13]. Shipment of plants from Taiwan to the U.S. by ocean freight takes from 21 to 30 days. If, during shipping, the plants are maintained at 17–25 ℃ (the proper spike-inducing temperature), the plant loss rate can be reduced to less than 5% [14].
In the United States, California (west coast) and Florida (east coast) are the major orchid cultivation areas, accounting for 92% of all U.S. orchid sales [11]. The shipping period of Phalaenopsis from South Korea to California is approximately 20 days, including the time it takes to quarantine. The shipping period to Florida is 25 to 30 days: shipping across the Pacific to California, followed by overland freight to Florida. However, ocean-only shipment to Florida (40–45 days) is also an option, given the high costs of overland freight from California to Florida. In that case, with a total shipping period prolonged to more than 40 days, spiking must be delayed by more than a month.
The light-saturation point of Phalaenopsis is ≈178–888 µmol·m−2·s−1, depending on the other environmental conditions [7]. Commercial cultivation of Phalaenopsis requires a light intensity of 280–380 µmol·m−2·s−1 photosynthetic photon flux density (PPFD) [15], but a rapid difference in light intensity from 0 to 200 µmol·m−2·s−1 after long-term shipping causes problems in subsequent growth [16]. In addition, shipping of Phalaenopsis packed in paper boxes and left unwatered for 4–5 weeks causes leaf abscission or rot after arrival in the local area, resulting in low-quality potted plants [17].
The objectives of this study were to investigate the effects of the simulated shipping duration under unwatered and dark conditions on post-shipping growth and flowering of Phalaenopsis Sogo Yukidian ‘V3’ and then to determine the cause of flowering delay due to long-term shipping. We chose Phalaenopsis Sogo Yukidian ‘V3′ as the plant material in this study because this cultivar has large petals and white flowers and is one of the most popular cultivars of Phalaenopsis in the world, especially in the United States [11].

2. Materials and Methods

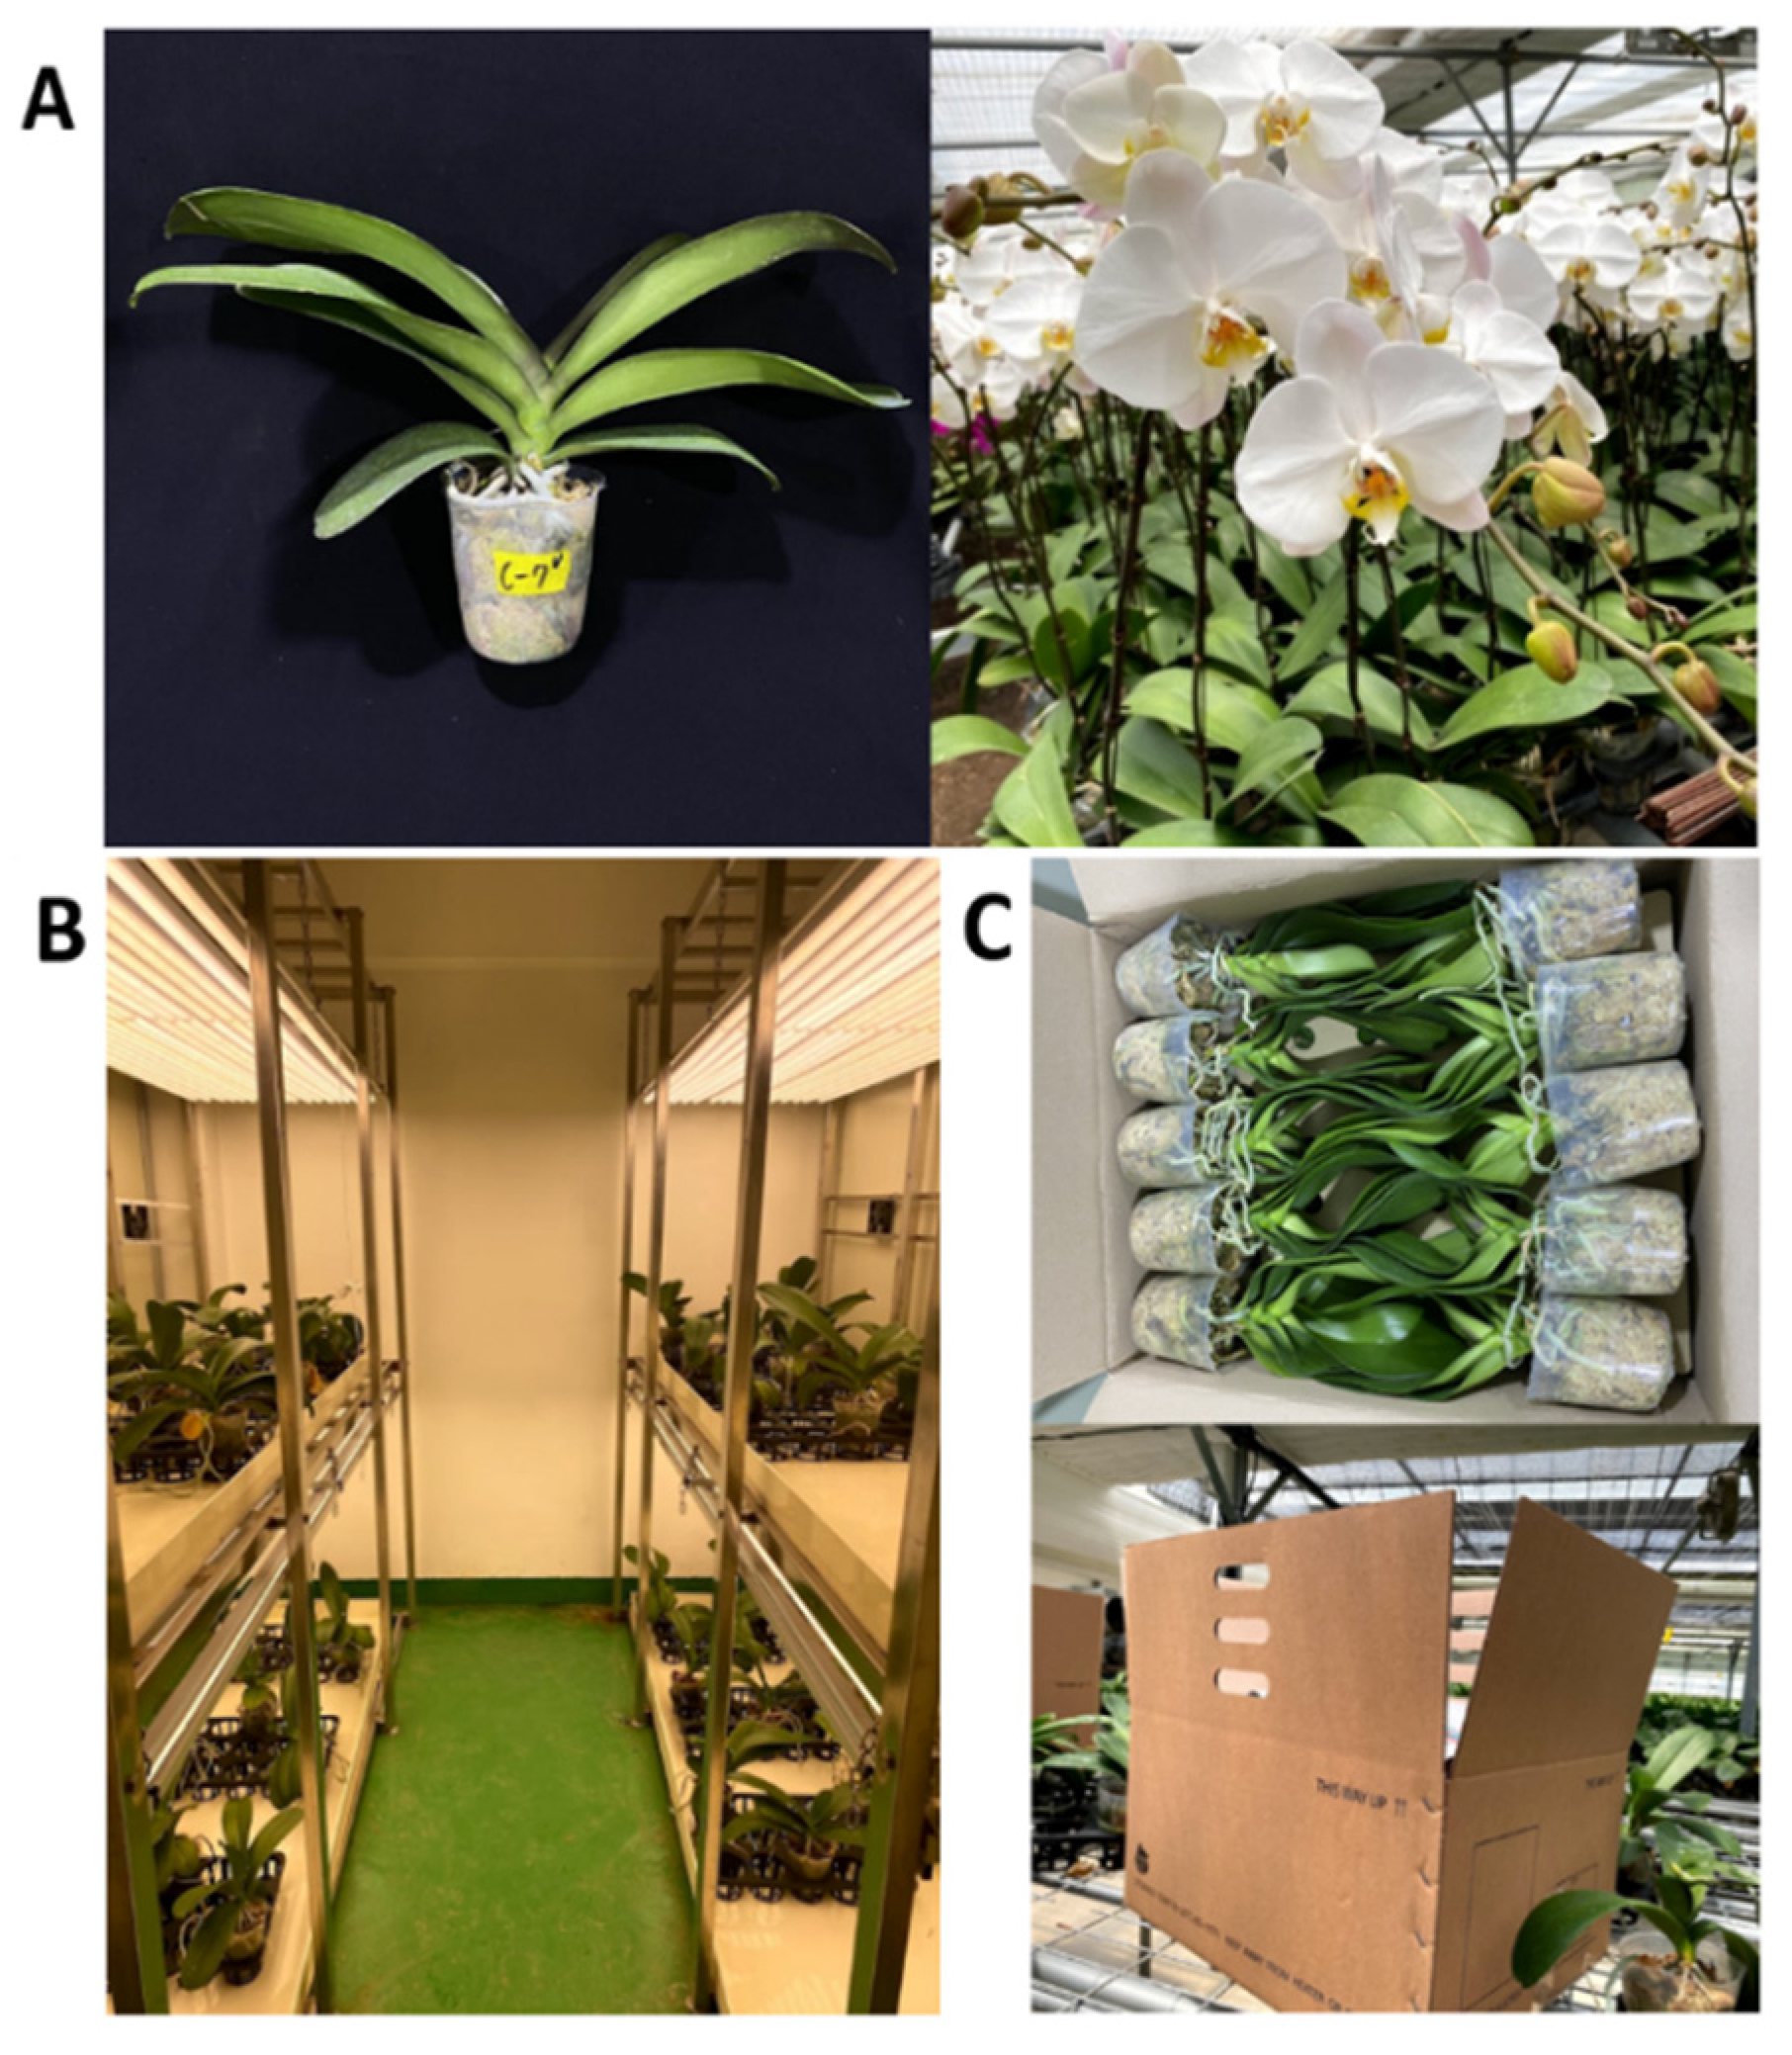
2.1. Plant Materials and Growth Conditions

After in vitro culture, plants of Phalaenopsis Sogo Yukidian ‘V3’ over 18 months old were potted in 4-inch-diameter plastic pots filled with Sphagnum moss and maintained in a greenhouse at the D Orchid Nursery, Dongducheon, Korea (37°58′05.7″ N, 127°03′42.8″ E). The plants had six to seven unfolded leaves and had white flowers (Figure 1A). The experiment was conducted at a plant production facility at Yeungnam University, Gyeongsan, Korea (35°49′34.8″ N, 128°45′21.3″ E). Two experimental environments were created: a low temperature chamber for simulated shipping (18.0 ± 1.2 °C, RH 51.4 ± 8.9%) and a growth chamber for simulated finishing in the target market (USA) (23.0 ± 3.2 °C, RH 30.4 ± 0.7%). The photoperiod was 9 h (from 09:00 to 18:00) with photosynthetic flux density (PPFD) 150 ± 10 µmol·m−2·s−1 using bar-type, warm-white LEDs (57 cm × 2.3 cm × 3.5 cm, LZT5-08L, Sunsea Industry Co., Ltd., Jiangmen, China).

2.2. Simulated Shipping Conditions

The volumetric water content (VWC) of Sphagnum moss was 22 ± 3% before packaging for simulated shipping, following the NIHHS guidelines [17]. Twelve plants were packed in each paper box and placed in a low-temperature chamber without irrigation for the simulated shipping duration. The control plants were placed under continuous light and irrigation in the low-temperature chamber for 40 days and moved to the growth chamber. Plants of each treatment group were placed in a low-temperature chamber under light (LSS) or dark (DSS, packed in a paper box) condition without irrigation during each simulated shipping duration for 10, 20, 30, 40, or 50 days and moved to the growth chamber after the end of simulated shipping (Figure 1B,C). Plants in the growth chamber were irrigated every 10 days with tap water.

2.3. Measurements of Photochemical Reflectance Index and Chlorophyll Fluorescence

The photochemical reflectance index (PRI) of the uppermost mature leaves was measured using a PolyPen RP400 (Photon Systems Instruments, Drásov, Czech Republic) at the end of each simulated shipping. Chlorophyll fluorescence of the uppermost mature leaves was measured using a FluorPen FP100 (Photon Systems Instruments) every 10 days from the end of each simulated shipping. The leaves were clamped with dark adaptation clips for 30 min. The minimal chlorophyll fluorescence (Fo) was then determined, followed by maximal chlorophyll fluorescence (Fm) measurements. The yield of variable chlorophyll fluorescence (Fv = Fm − Fo) and the maximum quantum yield PSII photochemistry (Fv/Fm) were measured.

2.4. Data Collection and Statistical Analysis

The VWC of Sphagnum moss was measured using a soil moisture sensor (TEROS12, METER Group, Inc., Pullman, WA, USA) and a data logger (ZSC Bluetooth Sensor Interface, METER Group, Inc.) at the end of simulated shipping. Temperature and relative humidity in the boxes were measured during each simulated shipping using a temperature/humidity meter (TH-05, Daekwang, Inc., Seoul, Korea).
The leaf length, width, and chlorophyll content of the uppermost mature leaves were measured for twelve plants in each treatment every 10 days during the experiment. Chlorophyll content (SPAD) was measured using a chlorophyll meter (SPAD-502plus, Konica Minolta, Japan) while avoiding the central leaf vein. The number of leaves with lengths ≥ 6 cm was counted. Yellowed leaves were defined as leaves in which more than 20% of their surface was yellow or the basal part became yellow for 10 days from the end of each simulated shipping. The rate of leaf yellowing was defined as the percentage of the number of yellow leaves on the total number of leaves in each plant.
Spiking was defined as the emergence of a spike ≥ 1 cm from the base of the leaf, and days to spiking and spike length were measured. Flowering was recorded when the first floret petal was fully unfolded, and days to flowering and number of flower buds (≥2 mm) were measured. Measurements of flowering characteristics were completed at 170 days after the start of the experiment. Comparisons of treatment means were performed using Duncan’s multiple range test at p < 0.05, using SPSS Statistics program (IBM SPSS Statistics ver.23, IBM, Armonk, NY, USA).

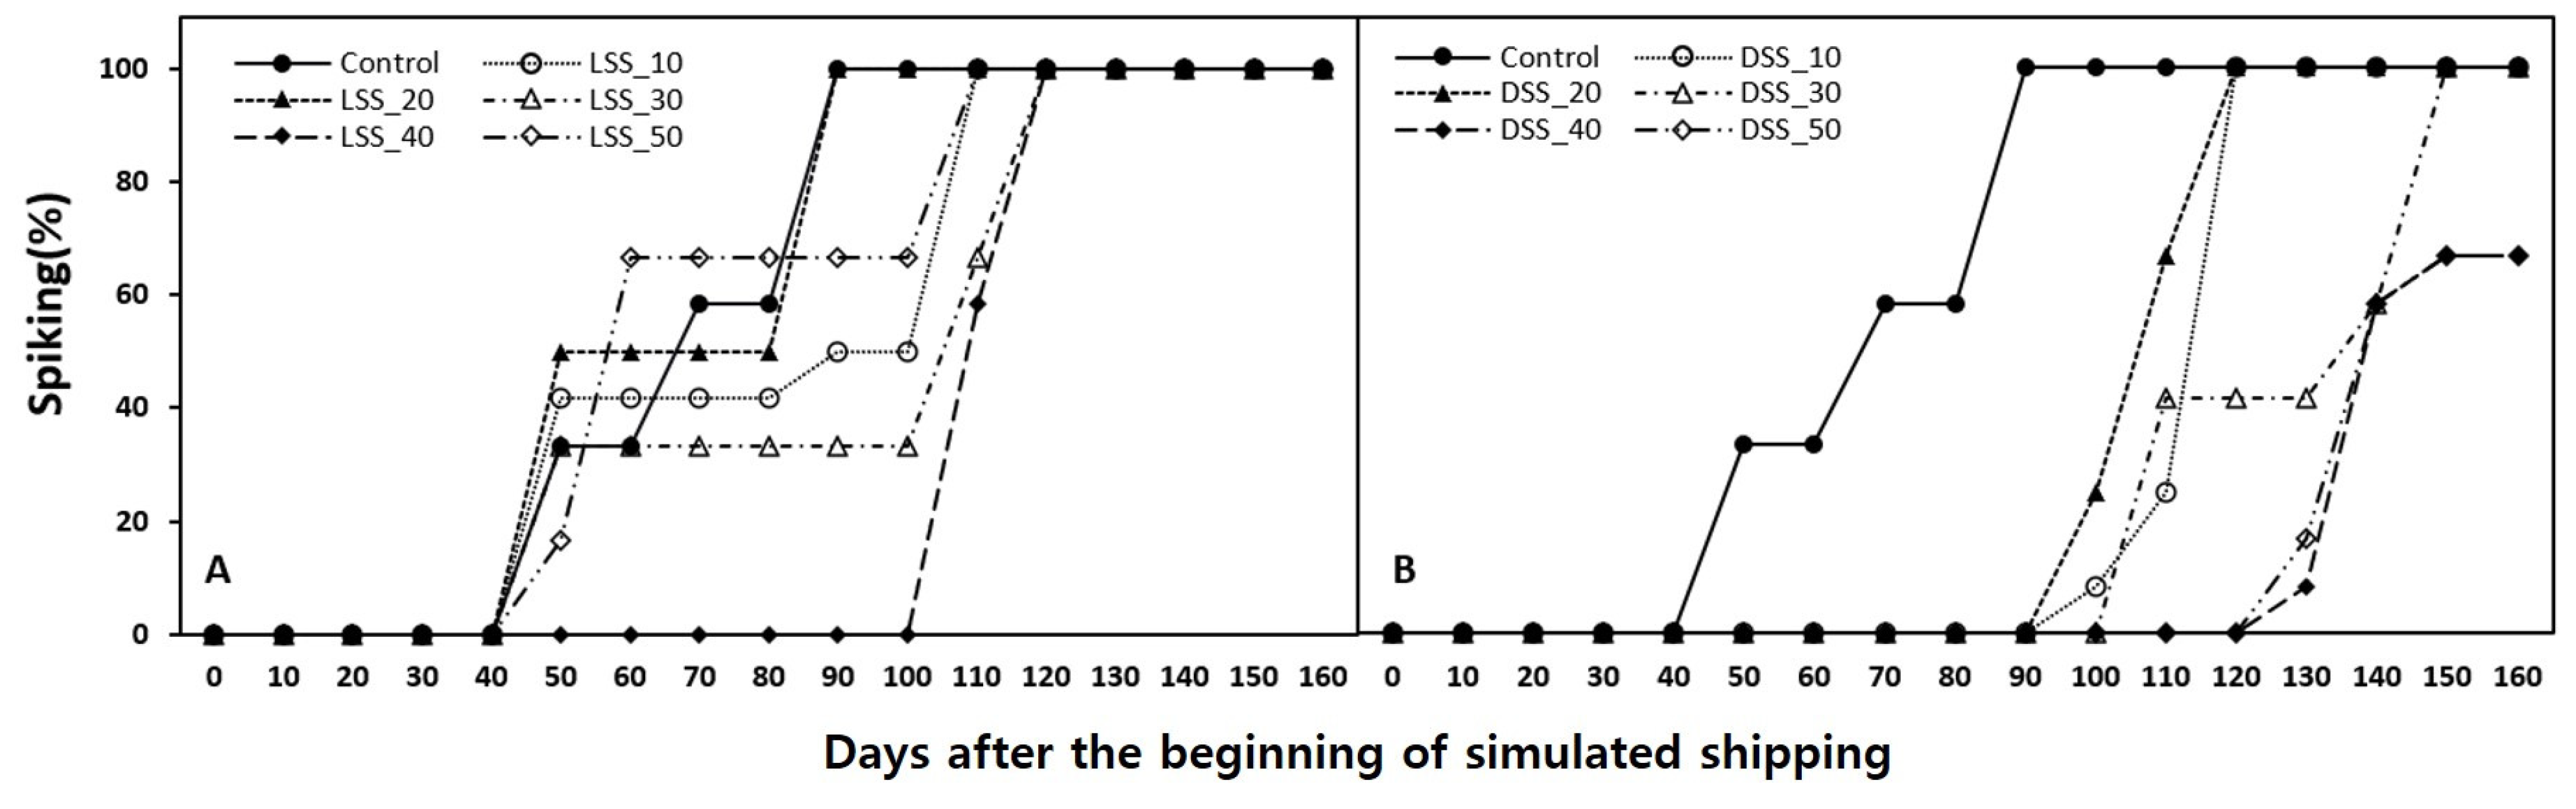
3. Results and Discussion

VWC decreased as the duration of the simulated shipping increased in both the LSS and DSS treatments (Figure 2). At the end of LSS_10 and DSS_10, there was a 56.1% and 32.7% reduction, respectively, compared to before the start of simulated shipping (22 ± 3%). Until DSS_30, the VWC of the DSS group was higher than or similar to that of LSS plants because the humidity around plants was kept relatively high in the boxes during DSS (data not shown). There was no difference in the VWC in either group in the simulated shipping treatment once the shipping duration exceeded 40 days.
There was no difference in the leaf-yellowing rate measured at the end of simulated shipping in LSS plants at different shipping durations. After DSS, the leaf-yellowing rate tended to increase as the duration of simulated shipping increased (Figure 3). Yellowed leaves occur due to increased abscisic acid (ABA) content after dark storage of Phalaenopsis under drought stress [16]. There was no difference in VWC values between LSS and DSS plants in simulated shipping for more than 40 days, but the leaf-yellowing rates of DSS 40 (16.9%) and DSS_50 (36.3%) were higher than those of LSS_40 (2.5%) and LSS_50 (1.2%). Similar to Phalaenopsis, species of Xerosicyos, another taxon of CAM plants, increased ABA content under drought stress and closed stomata, even at night, to reduce water loss [18]. In addition, stomatal closure during the night reduced gas exchange for photosynthesis. Drought stress decreased carbohydrate content in ‘Tinny Tender’ Doritaenopsis, which is genetically and physiologically close to Phalaenopsis [19]. However, chlorophyll and soluble protein contents were maintained under drought stress in light-exposed Xerosicyos [18]. Therefore, in this study, the chlorophyll content of Phalaenopsis leaves could be maintained under light conditions during long-term simulated shipping. Although drought stress under light can reduce the photosynthetic rate by stomatal closure, thereby lowering the carbohydrate content in Phalaenopsis, it is estimated that leaves with low yellowing rates under light and water stress can maintain photosynthesis at some level, using carbon dioxide from their own respiration.
The chlorophyll content (SPAD) of Phalaenopsis leaves after each of the durations of DSS decreased compared to values before simulated shipping and were lower than the corresponding values in LSS plants at all durations of treatment (Figure 4). Chlorophyll content of water dropwort leaves (Oenanthe javanica DC) decreased as the dark treatment period increased, apparently because chlorophyll decomposition was promoted in the dark without photosynthesis and chlorophyll synthesis [20]. However, in this study, the reduction rate of chlorophyll content was slightly lower during simulated shipping lasting more than 40 days. One of the responses to drought stress in purslane (Portulaca oleracea L.), a succulent plant, is to maintain or increase the chlorophyll content, which reduces oxidative damage in drought-stressed plants [21,22]. Similar responses were observed in Phalaenopsis, which, like purslane, is a CAM and succulent plant. The increase in chlorophyll content in LSS_40 and LSS_50 can be assumed to be a phenomenon caused by the addition of light to drought-stressed plants.
Measurements of the photochemical reflectance index (PRI) indicate the instantaneous photosynthesis efficiency; thus, decreasing PRI is considered a stress indicator in drought-stressed plants [23]. The PRI before the simulated shipping was −0.0091, and after 30 days, the PRI values of LSS tended to decrease as the simulated shipping duration increased (Figure 5). This is thought to be due to the combination of drought stress and light conditions in long-term LSS. In high-light environments, stressed Phalaenopsis plants had lower PRI values due to an increase in photosynthetic photon flux density (PPFD) [24]. The light intensity set in this study was not a high level for Phalaenopsis. However, the accumulated light amount for the growing period was considered to be additively stressful for Phalaenopsis plants under drought stress, as inferred by the reduced PRI values.
The Fv/Fm value of chlorophyll fluorescence refers to the maximum quantum yield of PSII, which decreases when plants are stressed, and is used as a stress indicator. The ratio of Fv/Fm is typically in the range of 0.75–0.85 when plants are not stressed by environmental factors [25]. In this study, the Fv/Fm of plants before the start of simulated shipping ranged from 0.73 to 0.78. Fv/Fm values were measured before and after simulated shipping every 10 days (Figure 6). Immediately after the end of the simulated shipping, the overall Fv/Fm in the LSS treatment group was lower than that of DSS plants. This indicates that the Fv/Fm value further decreased because of the addition of lighting to drought stress. In most LSS and DSS treatment groups, as well as the controls, the Fv/Fm value at 30 days after the simulation shipping returned to the normal range. Fifty days after the simulation, neither LSS_40 nor DSS_40 returned to the normal range. In particular, the Fv/Fm value of DSS_50 plants was the lowest compared to the other treatments.
The spiking rate reached 100% in the control group, and when compared with the same day after treatment, the spiking rate of LSS plants was higher than that of the DSS group (Figure 7). In the LSS plants, the LSS_20 group was the first to show a spiking rate of 50%, followed by LSS_10, 30, and 40. The spiking rate of LSS_50 was 66.7% on day 70, the highest among the LSS treatment groups in the same period. In DSS plants, the spiking rate of DSS_20 first reached 66.7% at 110 days after treatment and reached 100% with DSS_10 after 120 days. DSS_40 and DSS_50 showed the lowest rates after 140 days of treatment.
Days to spiking tended to increase as the shipping duration increased, and the number of days to spiking in DSS was greater than that of LSS plants in the same shipping period (Figure 8). In a previous study, it was shown that after Phalaenopsis ‘V3’ plants were stored at 20 °C in the dark condition for 0–40 days, the photosynthate content in the shoots and roots significantly decreased in the first 10 days of storage [26]. In particular, after 40 days of dark storage, the photosynthate in shoots decreased by 51% compared to that before the experiment. In the present study, the spiking rate decreased with increasing DSS duration due to the continuous reduction in carbohydrates during respiration. The spiking rate under LSS treatment is estimated to be relatively high due to the accumulation of carbohydrates in photosynthesis.
In the LSS group, there was no significant difference in the number of days to spiking among LSS_10, LSS_20, and control plants (Figure 8). The spiking rate began to slow in LSS_30 and was slowest in LSS_40. However, spiking suddenly accelerated in LSS_50, and spikes occurred at the same time as in the control group. In CAM plants, the stomata open and absorb CO2 during the night, and light is involved in stomatal opening and closing [27]. Under drought stress, the stomata of CAM plants remain closed throughout the day and night and are unable to absorb the CO2 normally required for photosynthesis. Consequently, CO2 in drought-stressed CAM plants is recycled for photosynthesis, which reduces organic acid accumulation [28]. For this reason, if Phalaenopsis plants are placed under continuous drought conditions for more than 30 days (to simulate shipping), the reduction in organic acids related to the opening and closing of the stomata is also expected to affect subsequent spiking.
In LSS_50 plants, the spiking rate was 16.7% on day 50, the end day of simulated shipping, and this group was the first to reach 66.7% on day 60. The spiking rate in LSS_50 plants was the greatest among the LSS treatments, and spiking occurred at the same time as in the control group (Figure 7).
There was no significant difference in the length and width of the uppermost mature leaves among the plants under different simulated shipping durations (Table 1). Neither was there a significant difference in the number of new leaves that occurred during the 100 days after the start of the simulated shipping.
Spike length was greater, as was the size of the first floret or bud, in the control and LSS_50 groups compared to the plants in other treatments (Table 1). In the control and LSS_50 groups, the number of flower buds in the spike was also greater, and the number of days to visible flower bud was less than in other treatments. The length of the first floret or bud and the number of buds tended to decrease under dark conditions and with increasing shipping duration (Figure 9). Therefore, growth of the uppermost mature leaf and new leaf at 100 days after the start of simulated shipping and subsequent flowering quality of Phalaenopsis Sogo Yukidian ‘V3’ were affected by light condition and shipping duration. There was no difference in the characteristics of vegetative growth, but the characteristics of flowering in the more rapidly flowering plants were superior to those in the other plants. This is because the plants were mature enough to flower in low-temperature and light conditions during simulated shipping induced spiking more quickly than under dark conditions. This can be explained by the accumulation of photosynthates. Aechmea ‘Maya’ plants under supplemental lighting (30 µmol·m−2·s−1 PPFD) accumulated more malic acid than shaded plants, severe light limitation (0.46 µmol·m−2·s−1 PPFD), over the course of 6 days [29].
Since the plants of LSS_50 and the control spiked fastest (Figure 8), the flowering characteristics of LSS_50 and the control at 100 and 130 days after the start of the simulated shipping were compared (Figure 10 and Figure 11). There were no significant differences in the spike length between LSS_50 and the control. However, the number of buds and flowers and the size of flower buds and florets in LSS_50 was less than that in the control plants; that is, the flowering of LSS_50 plants was rapid, similar to that of the control, but the quality-related characteristics of the flowering potted plant, such as flower number and size, were not sufficient in LSS-50 (Figure 11). The early flowering of drought-stressed plants in LSS_50 can be explained as a kind of drought escape mechanism in the way that plants escape under drought conditions [30]. Averrhoa carambola promotes flowering as the accumulation of carbohydrates increases under drought stress [31]. It has been reported that when flowering was accelerated by drought stress, it shortened vegetative growth and the time to produce photosynthates, thereby resulting in low quality of flowers [30]. No irrigation for 50 days of the simulated shipping induced drought stress in Phalaenopsis ‘V3’ and accelerated spiking and flowering compared with other treatment groups; however, the drought stress also lowered the flower quality, such as the number and size of florets, compared to the control plants measured at the same time (Figure 11).

4. Conclusions

For more than 40 days of simulated shipping, Phalaenopsis plants were subjected to drought stress. Drought-stressed plants increase the concentration of ABA [32], which can be evaluated by their leaf-yellowing rate [33], photochemical reflectance index (PRI), and chlorophyll fluorescence (Fv/Fm). When the simulated shipping was carried out for more than 40 days under dark conditions, the leaf-yellowing rate significantly increased—and increased sharply after more than 50 days. The PRI value, which is a measure of instantaneous photosynthesis efficiency and thus an indicator of stress, tended to decrease with increasing simulated shipping duration in LSS plants. The PRI increased for 20 days in DSS plants, presumably because the humidity inside the boxes for simulated shipping was maintained to some extent, and thus, the drought stress was relatively low. Subsequent drought stress in Phalaenopsis tended to decrease PRI values. The value of Fv/Fm decreased in most treatments immediately after the end of the simulated shipping and tended to recover afterwards. In the case of the LSS_40 treatment group, the reduction rate was the highest compared to the other treatments, which indicates that light increases stress during drought stress. Both LSS and DSS groups under simulated shipping conditions for more than 40 days did not recover to the normal range of Fv/Fm measured at 50 days after simulated shipping; in particular, DSS_50 plants showed a continuous decline in Fv/Fm values.
Spiking was delayed in all Phalaenopsis plants in the LSS and DSS treatments due to drought stress. Under dark conditions, Phalaenopsis under drought stress does not photosynthesize and only responds with closed stomata. Consequently, in DSS, only chlorophyll degradation continued without further production, leading to a decrease in chlorophyll content; furthermore, only respiration without photosynthesis continued, leading to a decrease in carbohydrate concentration, which delayed flowering more than LSS. It is estimated that Phalaenopsis under drought stress and light conditions (LSS) will exhibit relatively little flowering delay compared to DSS plants due to the increase in the C/N ratio that occurs with accumulation of photosynthate under light. As an exception, LSS_50 induced early flowering in Phalaenopsis Sogo Yukidian ‘V3’, an expected mechanism for escape from drought stress, but reduced flower quality and decreased the number and size of flowers (Figure 12).
The flowering delay that occurs when plants are shipped over 40 days in dark conditions is affected by both drought and dark conditions. Therefore, the duration of dark shipping for Phalaenopsis trade must be completed within 40 days. Further studies are needed to determine how to relieve drought stress and reduce carbohydrate loss by respiration during long-term shipping.

Author Contributions

Conceptualization, W.O.; Methodology, J.H.J. and W.O.; Formal Analysis, J.H.J. and W.O.; Investigation, J.H.J.; Data Curation, J.H.J.; Writing—Original Draft Preparation, J.H.J.; Writing—Review & Editing, W.O.; Supervision, W.O.; Project Administration, W.O.; Funding Acquisition, W.O. All authors have read and agreed to the published version of the manuscript.

Funding

This study was supported by the Export Promotion Technology Development Program (317020-05-3-WT061), Korea Institute of Planning and Evaluation for Technology in Food, Agriculture, and Forestry.

Institutional Review Board Statement

Not applicable.

Informed Consent Statement

Not applicable.

Data Availability Statement

No additional data supporting the results of the study are discussed. All data used in this study are reported in the manuscript.

Conflicts of Interest

The authors declare no conflict of interest.

References

  1. Lopez, R.; Runkle, E.; Wang, Y.T.; Blanchard, M.; Hsu, T. Growing the best Phalaenopsis. Part 3: Temperature and light requirements, height, insect and disease control. Orchids 2007, 76, 182–187. [Google Scholar]
  2. Min, S.Y.; Oh, W. Effects of nutrient solution application methods and rhizospheric ventilation on vegetative growth of young moth orchids without a potting medium in a closed-type plant factory. J. People Plants Environ. 2020, 23, 545–554. [Google Scholar] [CrossRef]
  3. Hew, C.S.; Yong, J.W.H. Physiology of Tropical Orchids in Relation to the Industry, 2nd ed.; World Scientific Publishing Company: Singapore, 2004. [Google Scholar]
  4. Lee, J.S. Stomatal opening mechanism of CAM plants. J. Plant Biol. 2010, 53, 19–23. [Google Scholar] [CrossRef] [Green Version]
  5. Chen, C. Evaluation of the effect of temperature on a stem elongation model of Phalaenopsis. Horticulturae 2019, 5, 76. [Google Scholar] [CrossRef] [Green Version]
  6. Runkle, E.; Wang, Y.T.; Blanchard, M.; Lopez, R. Growing the best Phalaenopsis. Part 1: An introduction to potted Phalaenopsis orchids. Orchids 2007, 76, 24–28. [Google Scholar]
  7. Rural Development Administration (RDA). A Manual of Environmental Management for Smart Greenhouses; RDA: Jeonju, Korea, 2018; pp. 223–245.
  8. Blanchard, M.G.; Runkle, E.S. Temperature during the day, but not during the night, controls flowering of Phalaenopsis orchids. J. Exp. Bot. 2006, 57, 4043–4049. [Google Scholar] [CrossRef] [Green Version]
  9. Ministry for Agriculture, Food and Rural Affairs (MAFRA). Annual Report of Floriculture Cultivation Statistics 2019; MAFRA: Sejong, Korea, 2020.
  10. Rural Development Administration (RDA). Study for Seedling Production and Distribution of Domestic Orchid Variety for Cymbidium and Phalaenopsis; RDA: Jeonju, Korea, 2016.
  11. Rural Development Administration (RDA). Orchid (Phalaenopsis) Export Guideline; RDA: Jeonju, Korea, 2018.
  12. Animal and Plant Quarantine Agency (APQA). U.S. Export Quarantine Guidelines for Korean Cymbidium and Phalaenopsis Young Plants Planted in Growing Media; APQA: Gimcheon, Korea, 2017.
  13. Animal and Plant Health Inspection Service (APHIS). Importation of Moth Orchids (Phalaenopsis spp.) in Approved Growing Media from Taiwan; UDSA APHIS: Riverdale, MD, USA, 2003.
  14. Blanchard, M.; Lopez, R.; Runkle, E.; Wang, Y.T. Growing the best Phalaenopsis. Part 4: A complete production schedule. Orchids 2007, 76, 266–271. [Google Scholar]
  15. Chen, W.H.; Wang, Y.T. Phalaenopsis orchid culture. Taiwan Sugar 1996, 43, 11–16. [Google Scholar]
  16. Hou, J.Y.; Setter, T.L.; Chang, Y.C.A. Effects of simulated dark shipping on photosynthetic status and post-shipping performance in Phalaenopsis Sogo Yukidian ‘V3’. J. Am. Soc. Hortic. Sci. 2010, 135, 183–190. [Google Scholar] [CrossRef] [Green Version]
  17. National Institute of Horticultural and Herbal Science (NIHHS). The Optimal Condition of Medium Drying Treatment for Long-Distance Ship Export of Phalaenopsis Orchids. Available online: http://www.nongsaro.go.kr/portal/ps/psb/psbb/farmUseTechDtl.ps?sTchnlgyRealmCode=&sKidofcomdtySeCode=&sTchnlgyPrcuseTyCode=&sRsrchRealmCode=&sRealmName=&sPsitnCode=&sPsitnArea=&sDtlType=&pageIndex=1&noSpr=&menuId=PS00072&farmPrcuseSeqNo=100000157500&sType=sj&sReSearchType=sj&sValue=%ED%8C%94%EB%A0%88%EB%86%89%EC%8B%9C%EC%8A%A4&sReSearchValue=&_sReSearchYn=on (accessed on 14 July 2021).
  18. Bastide, B.; Sipes, D.; Hann, J.; Ting, I.P. Effect of severe water stress on aspects of Crassulacean acid metabolism in Xerosicyos. Plant Physiol. 1993, 103, 1089–1096. [Google Scholar] [CrossRef] [Green Version]
  19. Cui, Y.Y.; Pandey, D.M.; Hahn, E.J.; Paek, K.Y. Effect of drought on physiological aspects of Crassulacean acid metabolism in Doritaenopsis. Plant Sci. 2004, 167, 1219–1226. [Google Scholar] [CrossRef]
  20. Zhang, X.Y.; Li, T.; Tan, G.F.; Huang, Y.; Wang, F.; Xiong, A.S. Effects of dark treatment and regular light recovery on the growth characteristics and regulation of chlorophyll in water dropwort. Plant Growth Regul. 2018, 85, 293–303. [Google Scholar] [CrossRef]
  21. Rahdari, P.; Hosseini, S.M.; Tavakoli, S. The studying effect of drought stress on germination, proline, sugar, lipid, protein and chlorophyll content in purslane (Portulaca oleracea L.) leaves. J. Med. Plants Res. 2012, 6, 1539–1547. [Google Scholar]
  22. Yang, X.; Chen, X.; Ge, Q.; Li, B.; Tong, Y.; Zhang, A.; Li, Z.; Kuang, T.; Lu, C. Tolerance of photosynthesis to photoinhibition, high temperature and drought stress in flag leaves of wheat: A comparison between a hybridization line and its parents grown under field conditions. Plant Sci. 2006, 171, 389–397. [Google Scholar] [CrossRef]
  23. Thenot, F.; Méthy, M.; Winkel, T. The photochemical reflectance index (PRI) as a water-stress index. Int. J. Remote Sens. 2002, 23, 5135–5139. [Google Scholar] [CrossRef]
  24. Lee, M.C.; Chang, D.C.; Wu, C.W.; Wang, Y.T.; Chang, Y.S. Phalaenopsis efficiently acclimate to highlight environment through orchid mycorrhization. Sci. Hortic. 2014, 179, 184–190. [Google Scholar] [CrossRef]
  25. Bolhar-Nordenkampf, H.R.; Long, S.P.; Baker, N.R.; Oquist, G.; Schreiber, U.; Lechner, E.G. Chlorophyll fluorescence as a probe of the photosynthetic competence of leaves in the field: A review of current instrumentation. Funct. Ecol. 1989, 3, 497–514. [Google Scholar] [CrossRef]
  26. Hou, J.Y.; Miller, W.B.; Chang, Y.C.A. Effects of simulated dark shipping on the carbohydrate status and post-shipping performance of Phalaenopsis. J. Am. Soc. Hortic. Sci. 2011, 136, 364–371. [Google Scholar] [CrossRef]
  27. Zeiger, E. Light perception in guard cells. Plant Cell Environ. 1990, 13, 739–744. [Google Scholar] [CrossRef]
  28. Vitale, L.; Vitale, E.; Costanzo, G.; De Maio, A.; Arena, C. Photo-protective mechanisms and the role of poly (ADP-ribose) polymerase activity in a facultative CAM plant exposed to long-term water deprivation. Plants 2020, 9, 1192. [Google Scholar] [CrossRef]
  29. Ceusters, J.; Borland, A.M.; Godts, C.; Londers, E.; Croonenborghs, S.; Van Goethem, D.; De Proft, M.P. Crassulacean acid metabolism under severe light limitation: A matter of plasticity in the shadows? Exp. Bot. 2011, 62, 283–291. [Google Scholar] [CrossRef] [Green Version]
  30. Shavrukov, Y.; Kurishbayev, A.; Jatayev, S.; Shvidchenko, V.; Zotova, L.; Koekemoer, F.; Groot, S.D.; Soole, K.; Langridge, P. Early flowering as a drought escape mechanism in plants: How can it aid wheat production? Front. Plant Sci. 2017, 8, 1950. [Google Scholar] [CrossRef] [PubMed]
  31. Wu, P.; Wu, C.; Zhou, B. Drought stress induces flowering and enhances carbohydrate accumulation in Averrhoa carambola. Hortic. Plant J. 2017, 3, 60–66. [Google Scholar] [CrossRef]
  32. Mohr, P.G.; Cahill, D.M. Abscisic acid influences the susceptibility of Arabidopsis thaliana to Pseudomonas syringae pv. tomato and Peronospora parasitica. Funct. Plant Biol. 2003, 30, 461–469. [Google Scholar] [CrossRef] [PubMed]
  33. Pourtau, N.; Marès, M.; Purdy, S.; Quentin, N.; Ruël, A.; Wingler, A. Interactions of abscisic acid and sugar signalling in the regulation of leaf senescence. Planta 2004, 219, 765–772. [Google Scholar] [CrossRef]
Figure 1. (A) Phalaenopsis Sogo Yukidian ‘V3 used in the experiment. (B) Simulated shipping under light conditions. (C) Paper-box packaging for simulated shipping under dark conditions.
Horticulturae 07 00483 g001
Figure 2. Volumetric water content of Sphagnum moss (potting media) at the end of each light (LSS) or dark (DSS) simulated shipping treatment as influenced by simulated shipping duration in Phalaenopsis Sogo Yukidian ‘V3’. Within-graph means followed by the same letter are not significantly different according to Duncan’s multiple range test at p ≤ 0.05.
Horticulturae 07 00483 g002
Figure 3. Leaf-yellowing rate in Phalaenopsis Sogo Yukidian ‘V3’ for 10 days after the end of each simulated shipping treatment with different duration. Within-graph means followed by the same letter are not significantly different according to Duncan’s multiple range test at p ≤ 0.05. * p ≤ 0.05.
Horticulturae 07 00483 g003
Figure 4. Chlorophyll content (SPAD) at the end of each simulated shipping as influenced by simulated shipping duration in Phalaenopsis Sogo Yukidian ‘V3’. Within-graph means followed by the same letter are not significantly different according to Duncan’s multiple range test at p ≤ 0.05.
Horticulturae 07 00483 g004
Figure 5. Photochemical reflectance index (PRI) at the end of each simulated shipping as influenced by simulated shipping duration in Phalaenopsis Sogo Yukidian ‘V3’. Within-graph means followed by the same letter are not significantly different according to Duncan’s multiple range test at p ≤ 0.05.
Horticulturae 07 00483 g005
Figure 6. Changes in Fv/Fm according to time before and after the end of light (A) and dark (B) simulated shipping (day 0) as influenced by simulated shipping duration in Phalaenopsis Sogo Yukidian ‘V3’. Red line represents the optimal level (0.75–0.85) for non-stressed plants [25]. *, **, *** Significant at p ≤ 0.05, 0.01, or 0.001, respectively.
Horticulturae 07 00483 g006
Figure 7. Changes according to time in post-shipping spiking rate as influenced by light (A) and dark (B) simulated shipping duration in Phalaenopsis Sogo Yukidian ‘V3’.
Horticulturae 07 00483 g007
Figure 8. Days to spiking as influenced by simulated shipping duration in Phalaenopsis Sogo Yukidian ‘V3’. Within-graph means followed by the same letter are not significantly different according to Duncan’s multiple range test at p ≤ 0.05.
Horticulturae 07 00483 g008
Figure 9. Effect of simulated shipping duration with or without lighting on post-shipping performance of Phalaenopsis Sogo Yukidian ‘V3’. Photos were taken 170 days after the start of simulated shipping. L = light, D = dark.
Horticulturae 07 00483 g009
Figure 10. Characteristics of subsequent flowering quality of Phalaenopsis Sogo Yukidian ‘V3’ of the control and simulated light shipping for 50 days (LSS_50) at 100 (AC) and 130 (DF) days after simulated shipping. * p ≤ 0.05.
Horticulturae 07 00483 g010
Figure 11. Subsequent flowering quality of Phalaenopsis Sogo Yukidian ‘V3’ of the control and simulated light shipping for 50 days (LSS_50) at 130 days after simulated shipping.
Horticulturae 07 00483 g011
Figure 12. Simplified schemes representing the flowering in Phalaenopsis Sogo Yukidian ‘V3’ under drought stress in light and dark conditions.
Horticulturae 07 00483 g012
Table 1. Characteristics of the uppermost mature leaf and new leaf at 100 days after the start of simulated shipping and subsequent flowering quality of Phalaenopsis Sogo Yukidian ‘V3’.
Simulated Shipping
Duration (d)
Light ConditionUppermost Mature LeafNo. of New LeavesSpike Length (cm) z1st Floret or Bud yNo. of Flower BudsDays to Flower Visible Bud
Length (cm)Width (cm)Length (cm)Width (cm)
0 20.17.01.154.1ab x78.6a62.5a7.2a125c
10Light20.96.71.232.9cd33.2cd28.7bcd3.6bc150abc
Dark20.66.81.248.8ab11.8cd9.4cd2.0c168a
20Light20.47.21.058.2a42.7bc36.9abc5.7ab140bc
Dark19.76.90.853.4ab5.5d7.0d2.4c171a
30Light20.86.91.248.7abc38.0bcd32.0bcd3.3bc149abc
Dark20.56.70.838.0bcd15.1cd13.2cd3.5bc150abc
40Light20.67.00.944.8a–d5.4d12.6cd2.9c163ab
Dark21.47.00.629.0cd4.0d4.2d1.6c168a
50Light20.06.90.653.5ab69.6ab54.4ab6.9a127c
Dark21.66.70.635.6d2.2d2.9d1.4c173a
Significance
Duration (A)NSNSNS***NS*NS
Light condition (B)NSNSNS*************
A × BNSNSNS**NS*NS
z Spike length at 160 days after the start of simulated shipping. y Bud at 170 days after start of simulated shipping. x Means within columns followed by different letters are significantly different according to Duncan’s honestly significant difference test at p < 0.05. NS, *, **, *** Not significant or significant at p ≤ 0.05, 0.01, or 0.001, respectively.
Publisher’s Note: MDPI stays neutral with regard to jurisdictional claims in published maps and institutional affiliations.

