Article

Stable Reference Gene Selection for qRT-PCR Normalization in Strawberry (Fragaria × ananassa) Leaves under Different Stress and Light-Quality Conditions

1
College of Horticulture, Sichuan Agricultural University, Chengdu 611130, China
2
Key Laboratory of Horticulture Plant Biology, College of Horticulture and Forestry Science, Huazhong Agricultural University, Wuhan 430070, China
3
Research Institute of Pomology, Chinese Academy of Agricultural Sciences, Xingcheng 125100, China
*
Author to whom correspondence should be addressed.
These authors contributed equally to this work.
Horticulturae 2021, 7(11), 452; https://doi.org/10.3390/horticulturae7110452
Submission received: 19 August 2021 / Revised: 16 September 2021 / Accepted: 24 September 2021 / Published: 3 November 2021

Abstract

:
Selecting an appropriate reference gene is of crucial importance for improving the accuracy of qRT-PCR analyses. In this study, strawberry (Fragaria ananassa) seedlings were subjected to different environmental conditions including heat, cold, drought, salt, white-light, blue-light, and red-light treatments. The expression levels of seven candidate reference genes, including Fa18S, FaGAPDH, FaPIRUV, FaDBP, FaHISTH4, FaACTIN1, and FaACTIN2, in the strawberry leaves were measured by qRT-PCR. Then, four programs (geNorm, NormFinder, BestKeeper, and RefFinder) were employed as tools to evaluate the expression stability of the candidate reference genes. The results showed that the expression stability of the reference genes varied under different conditions. For the cold stress and white-light treatments, FaACTIN2 was evaluated to be the most stable reference gene. FaGAPDH should be used as the reference gene under salt-stress condition and red-light treatment. For the data normalization under drought-stress treatment, FaDBP is the recommended reference gene with the highest expression stability. FaHISTH4 was observed to be the best reference gene for data normalization under heat stress and blue-light treatment. This work provides information on selecting reference genes for accurate gene expression analyses of target genes in strawberry leaves under various abiotic stress and light-quality conditions.

1. Introduction

Abiotic environmental stresses can give rise to multiple morphological, biochemical, and molecular changes that negatively affect plant growth and productivity [1]. Various physiological mechanisms in plants participate in response to stress, including the regulation of biological membrane stability, the regulation of hormone synthesis and accumulation, and the activity of phenolic enzymes [2]. At the molecular biological level, various functional genes play important roles in these physiological processes [3]. The expression changes of stress tolerance genes have contributed to improve the adaptation of plants to environmental conditions [4,5]. Hence, the identification of abiotic stress-related genes in plants can provide useful information about the molecular mechanisms underlying responses to abiotic stress. Moreover, recent research has proposed the roles of light quality in modulating tolerance to abiotic and biotic stresses by inducing the accumulation of plant pigments and regulating the activities of major ROS scavengers [6,7]. Therefore, an integrated analysis of light quality and stress could provide more information about the cross-talk between the light environment and external stress conditions.
Gene expression analysis can provide fundamental evidence of gene functions in response to external environment stress. Moreover, quantitative reverse transcription PCR (qRT-PCR) has been widely used in gene expression analyses due to its rapidity, sensitivity, accuracy, and reproducibility [8]. The reproducible and accurate measurements of transcript abundance in plants using qRT-PCR are affected by various factors including RNA quality, the removal of contaminating genomic DNA, robust reverse transcriptase reactions, the design of gene-specific PCR primers, and the selection of the best reference genes for normalization [9]. Therefore, it is of great importance to select a stable reference gene for qRT-PCR normalization [10,11].
An ideal reference gene should maintain a constant expression level under various conditions and not be affected by experimental parameters [11]. Many studies directly selected the genes involved in cellular maintenance processes as reference genes for qRT-PCR data normalization without proper validation, such as components of the cytoskeleton (actins), the glycolytic pathway (glyceraldehyde-3-phosphate dehydrogenase, GAPDH), protein folding (cyclophilin), the synthesis of ribosome subunits (18S rRNA), the electron transporter (succinate dehydrogenase complex, SDH), and protein degradation (ubiquitin, UBI) [12]. However, these reference genes may not have constant expression levels in certain samples, especially under different environmental conditions. Therefore, a systematic study on selecting suitable reference genes in different samples is necessary to ensure accurate results in qRT-PCR data analyses. In previous studies, many reference genes from many species were evaluated under various external treatments and in different tissues [13,14]. For the different floral development stages of Lagerstroemia speciosa and Lagerstroemia indica, LiActin exhibited the highest expression stability in L. indica, while LsGAPDH was found to be a suitable reference gene for L. speciosa [15]. Conversely, CsGAPDH presented poor expression stability in tea plant (Camellia sinensis) during leaf development and under hormonal treatments [16]. In cultivated strawberry, FaACTIN and FaGAPDH2 were recommended as reference gene for difference tissues, pathogen interactions, biotic stress treatments, fruit ripening and senescent stages [17]. However, in another study, the candidate reference gene FaDBP (DNA binding protein) was considered to be the most suitable for normalizing the gene expression data in samples of two strawberry cultivars under drought stress conditions. The candidate reference gene FaHISTH4 (histone H4) showed the highest stability of expression levels under osmotic stress treatments, whereas the traditional reference genes FaGAPDH (glyceraldehyde-3-phosphate dehydrogenase) and Fa18S (18S ribosomal RNA) were ranked as the most unstable genes under all conditions [18]. For strawberry fruit under different light-quality treatment, FaGAPDH offered the most stable expression [10]. However, FaGAPDH is not suitable for data normalization under low temperature treatments. Hence, it is necessary to validate stable reference genes for specific cultivars under the given experimental conditions.
Strawberry (Fragaria × ananassa Duch.) is an economically important fruit that is popular among consumers due to its pleasant flavor and nutrient contents [19]. Strawberry is cultivated throughout the world showing different sensitivity levels to abiotic stress conditions depending on the genetic background [20,21,22]. In the present study, we analyzed the expression stability of seven reference genes in the leaves of cultivated strawberry seedlings subjected to heat stress, cold stress, salt stress, drought stress, and different light-quality treatments. Four programs based on different statistical algorithms were employed to systematically select the most suitable reference genes under the aforementioned treatments.

2. Materials and Methods

2.1. Plant Growth Conditions, Stress Treatments, and Material Collection

The strawberry cultivar Benihoppe, which is widely cultivated in China, was used as the plant material in the present study. The strawberry seedlings were grown in 10 cm × 10 cm plastic pots using a mixture of peat moss, vermiculite, and perlite in a volume ratio of 5:2:1. The potted seedlings were managed for 2–3 weeks in a greenhouse at the Sichuan Agricultural University in September 2018. The seedlings with uniform growth were selected for subsequent treatments.
To induce heat stress, seedlings were pretreated in a growth chamber with a temperature of 25 °C for 1 week. Then, the seedlings were transferred to a growth chamber with a temperature of 38 °C for the heat-stress treatment. The leaves were collected on the 1st, 2nd, 3rd, and 4th days after treatment (DAT). The sample collected on the 1st DAT was used as the control group. For cold stress, seedlings were pretreated in a growth chamber with a temperature of 25 °C for 1 week. Then, the seedlings were transferred to a growth chamber with a temperature of 4 °C for the cold-stress treatment. The leaves were collected on the 1st, 2nd, 3rd, and 4th day after treatment (DAT). The sample from the 1st DAT was used as the control group. For the salt-stress treatment, seedlings were irrigated using salt water with 100 mL of 250 mmol/L sodium chloride (NaCl) every two days. Then, the leaves were collected on the 1st, 3rd, 6th, and 9th DAT. The sample from the 1st DAT was used as the control group. The drought-stress treatment was performed by depleting the water after fully watering the seedlings. The leaves of the seedlings were sampled on the 1st, 3rd, 6th, and 9th DAT. The sample collected on the 1st DAT was considered as the control group. Sixty seedlings were used for each treatment above, including three bio-replications, and each bio-replication contained 5 seedlings.
The light-quality treatment was performed using white light (control), red light (730 nm), and blue light (450 nm) as the light source (DONGNAN INSTRUMENT CO., LTD., Ningbo, China), with light strength of 125 μmol·m−2·s−1 (measured by an AR823+ Illuminometer, SMART, China) to provide the necessary irradiation for growth. The 180 total seedlings were then divided into 3 groups, including three bio-replications, each containing 5 seedlings. Next, the leaf samples subjected to different light-quality treatments were harvested on the 1st, 2nd, 3rd, and 4th day after treatment (DAT). All the treatments were performed under controlled environmental conditions (12 h dark at 20 °C, with a 12 h photoperiod at 25 °C under 75% relative air humidity).
All the collected samples were immediately frozen by liquid nitrogen and maintained at 80 °C for further analysis.

2.2. RNA Extraction and cDNA Synthesis

The total RNA of samples from various treatments was extracted using a modified CTAB (hexadecyltrimethylammonium bromide) method [23]. The quality and quantity of RNA were evaluated by 1.0% gel electrophoresis and a Nanodrop spectrometer (Nanodrop Technologies, Wilmington, DE, USA), respectively. The first-strand cDNA was synthesized using 1 μg of total RNA with a PrimeScript™ RT reagent Kit with gDNA Eraser (Perfect Real Time) (Takara Bio Inc., Shiga, Japan) following the manufacturer’s instructions. The cDNA was diluted ten-fold for the qRT-PCR analysis.

2.3. Candidate Reference Selection and Primer Design

Seven candidate reference genes were selected according to previous research, including actin (FaACTIN1 and FaACTIN2), DNA binding protein (FaDBP), glyceralde-hyde-3-phosphate dehydrogenase (FaGAPDH), histone H4 (FaHISTH4), pyruvate decarboxylase (FaPIRUV), and 18S ribosomal RNA (Fa18S). The primers are listed in Supplementary Materials Table S1 [10]. The amplification specificity of the primer pairs was validated via melting-curve analysis.

2.4. qRT–PCR Analysis

qRT-PCR was performed on the CFX96 real-time PCR system (Bio-Rad, Hercules, CA, USA). The PCR reaction system was set using SYBR Green Premix Ex Taq TM (Takara Bio Inc., Shiga, Japan) in a 20 μL volume containing 1 μL of each primer (0.5 μM), 10 μL of SYBR Premix, 2 μL of a diluted cDNA template., and 7 μL of RNase-free water. Three technical replications were set for each reaction. The PCR protocol, based on the recommendations of the manufacturer, used three-step cycling, with 95 °C for 5 min for 1 cycle, followed by 40 cycles of 95 °C for 10 s, 55–60 °C for 30 s, and 72 °C for 15 s. A melting curve was inserted to confirm the specificity of amplification at the end of reaction. A no template control (NTC) was set in each plate to avoid potential contamination. To control the inter-plate difference, a reaction with the same sample was performed in each plate to adjust the variations between different plates.

2.5. Data Statistical Analysis

The qPCR data, with the quantification cycles (Cq), were detected and exported to a Microsoft Excel file using the BIO-RAD CFX Manager v2.0 software (Bio-Rad, Hercules, CA, USA). Three programs using different algorithms, Bestkeeper, geNorm, and NormFinder, were employed to rank the candidate reference genes based on the calculated expression stability scores in the samples under different treatments. The geNorm software calculated the average expression stability values (M) in the given Cq data of samples to measure the gene-expression stability. The genes with lower M values presented higher stability. NormFinder is a model-based approach used to provide the stability value as a direct measure for estimated expression variation. BestKeeper is a type of Excel-based spreadsheet software that ranks gene-expression stability based on the standard deviation (SD) and coefficient of variance (CV) of Cq values. Ideally, the genes with higher expression stability will obtain lower SD and CV values in the BestKeeper analysis results. Bestkeeper can, therefore, rank the reference genes according to the SD and CV values. Finally, RefFinder was used to perform an integrated analysis based on the three programs that we used [24,25,26,27]. The gene recommended most frequently by the different software was selected as the best reference gene for each experimental condition.
The expression pattern of FaBBX28 under the drought-stress treatment was determined using the selected reference gene. The relative expression level was calculated using the −ΔΔCq method [28]. The sequences of primers targeting FaBBX28 are listed in Table S1.

2.6. RNA-Seq Analysis

To validate the qRT-PCR results, an RNA-seq data analysis was performed. The raw data were download from the NCBI SRA database, including SRR7213137 (drought stress) and SRR7213138 (control) [29]. Clean data were obtained by filtering raw data using the Trimmomatic software (V0.32) to remove low-quality reads [30]. The HISAT2-StringTie pipeline was employed to perform genome-guided assembly based on the cultivated strawberry genome under the default parameter settings of the program [31,32]. The gene-expression level was normalized using the TPM (transcript per million) method.

3. Results

3.1. Specific Analysis of Candidate Reference Genes by qRT-PCR

In the present study, seven reference genes that were previously reported by our group were used as candidate reference genes [10]. The melting curves of amplicons were used to provide information on the PCR product of each gene and validate the specificity of PCR for each primer pair. In Figure S1, all the melting curves of reference genes with signal peaks represented high amplification specificity and good repeatability using the primers pairs. This result demonstrated that the reference genes could be used in subsequent analyses.

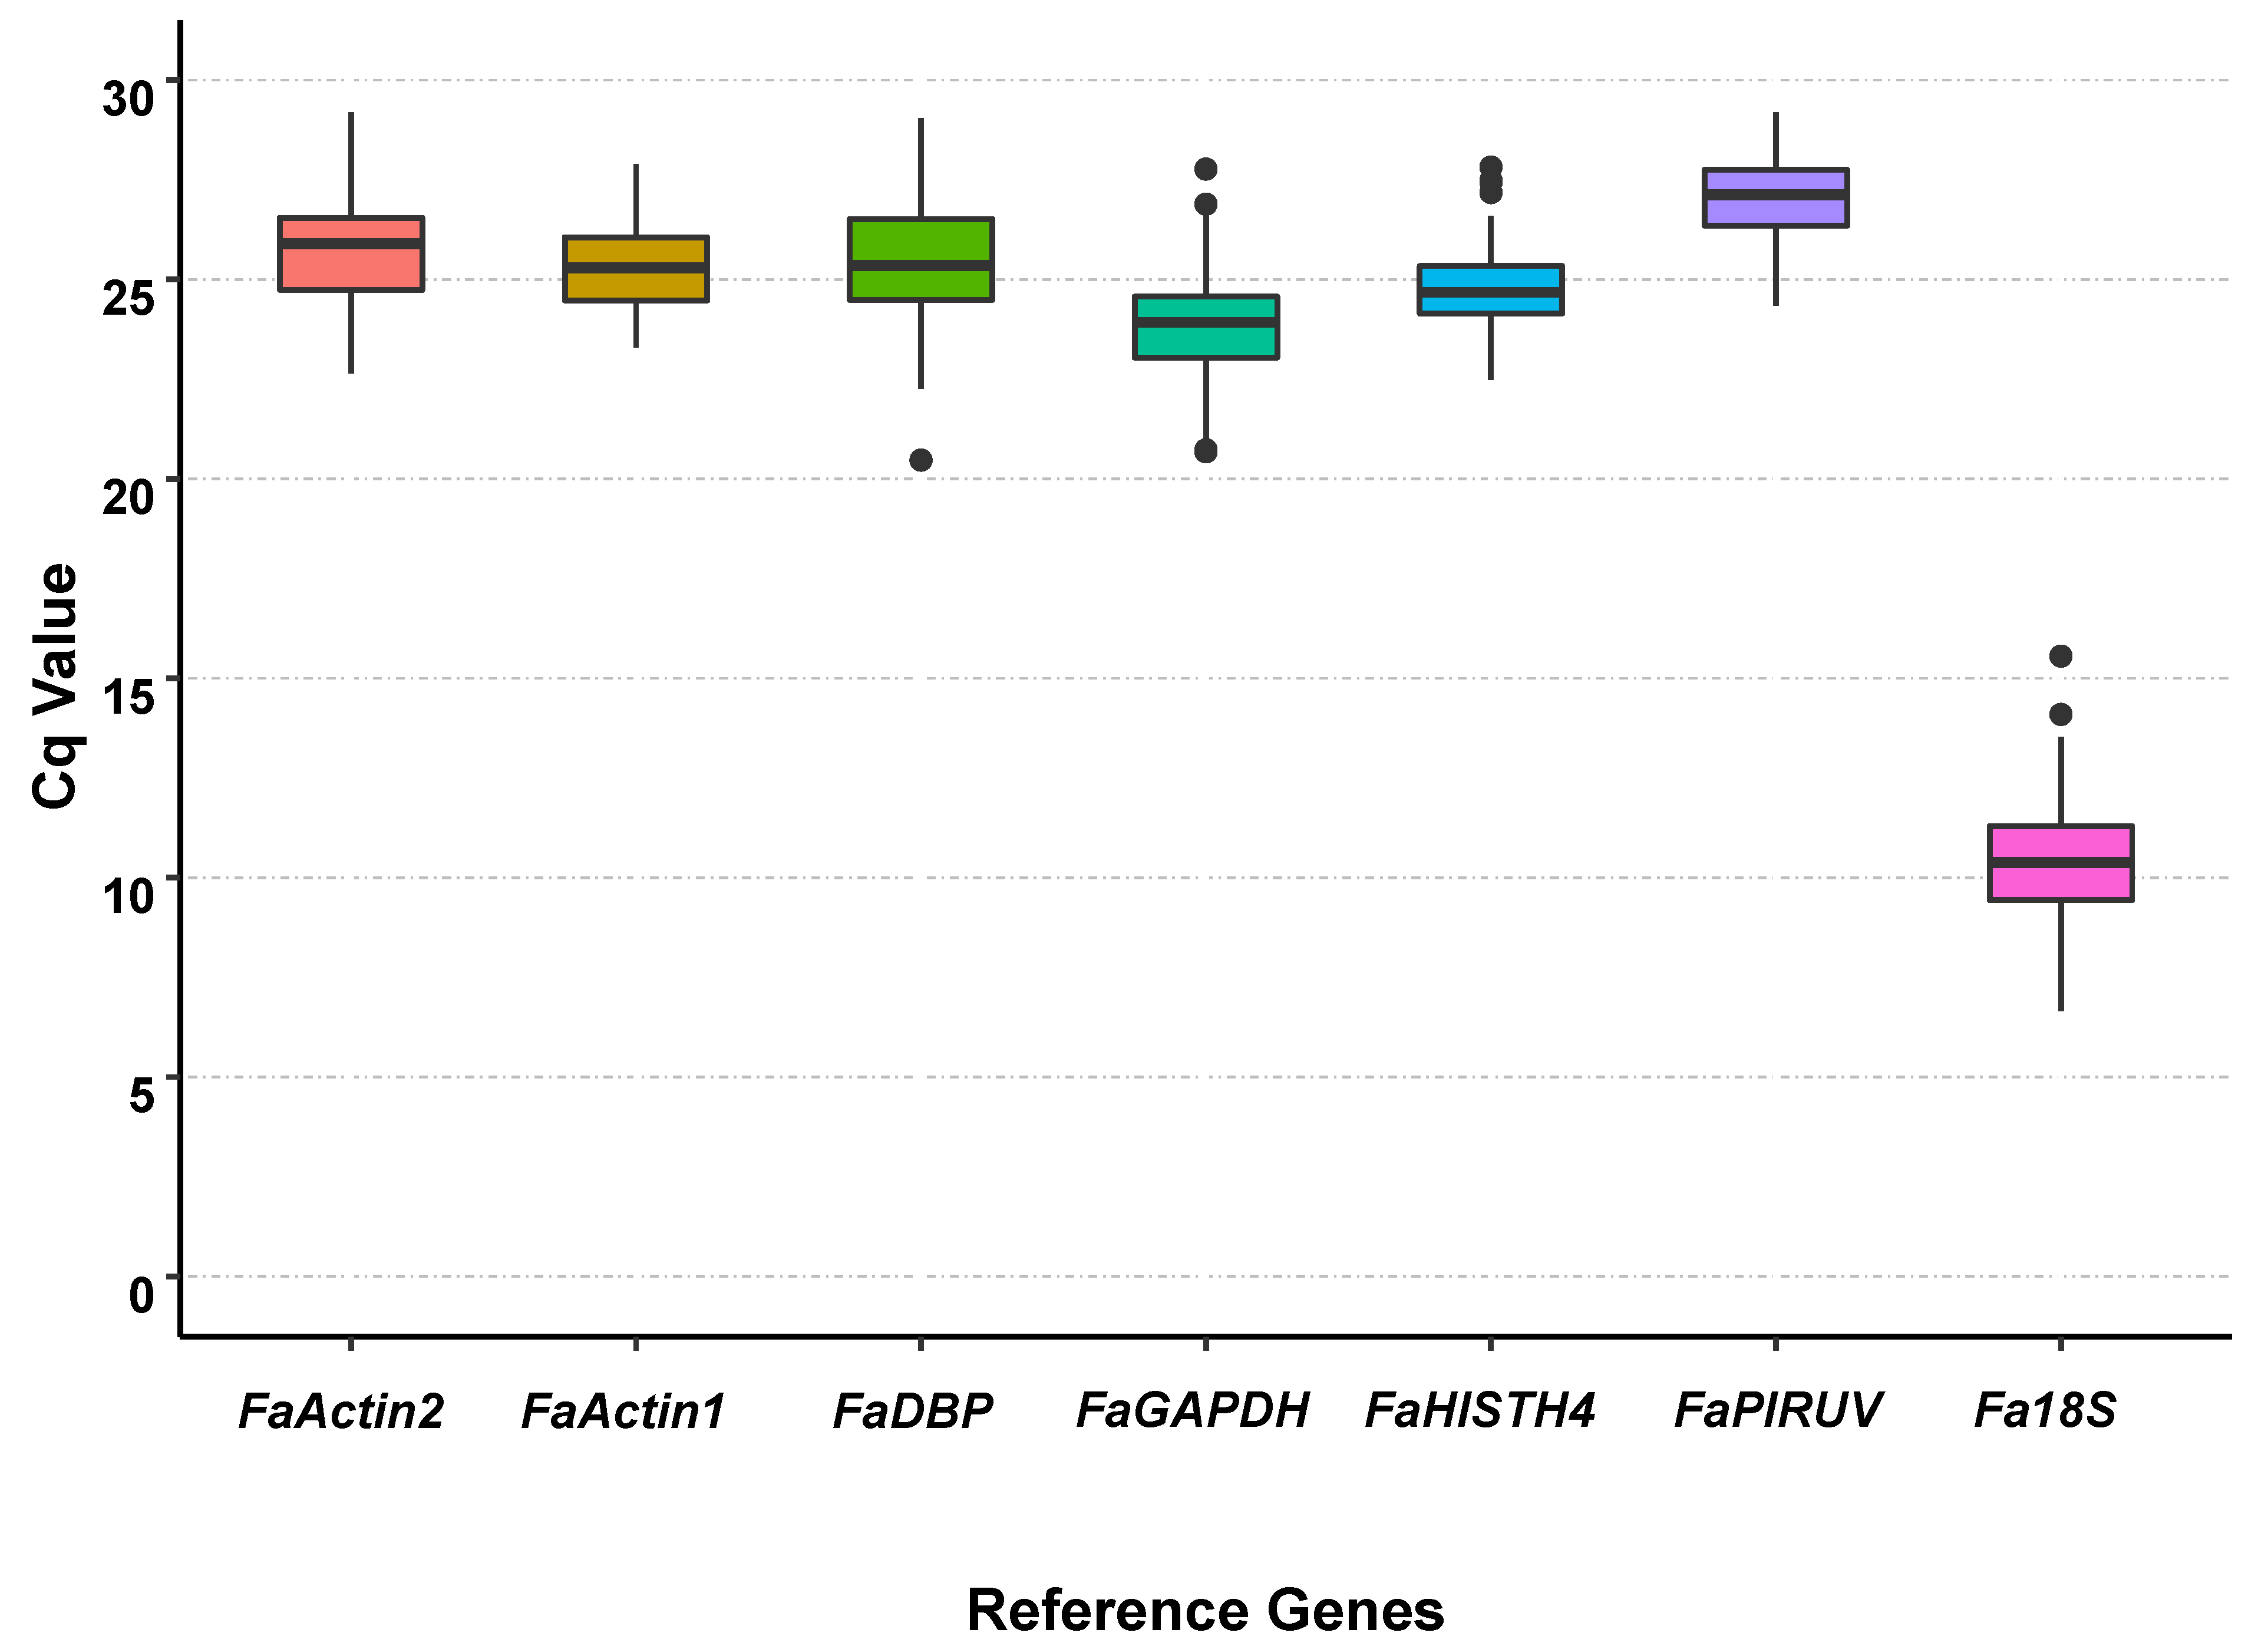
3.2. Cq Value Analysis of Candidate Reference Genes under All Treatments

The quantification cycle (Cq) refers to the fractional numbers of cycles needed for the fluorescent dye signal to reach a cut-off quantification threshold. The Cq value of a qRT-PCR reaction can be used to quantify the gene-expression level. A lower Cq value corresponds to a higher expression level with more copies of the target gene [33]. In this study, the Cq value was used to compare the expression levels of the reference genes in the samples under various treatments (Figure 1 and Table S2). The average Cq values of all reference genes ranged from 10.25 to 27.02, showing a divergence in the expression levels between the reference genes. Fa18S had the lowest average Cq value, also indicating that it had the highest expression level among the candidate reference genes. In contrast, FaPIRUV featured the highest average Cq value but presented the lowest expression level. The standard deviation of Cq (Cq_SD) was used as an index to measure the dispersion of the gene-expression level across the different samples. FaHISTH4 had the lowest Cq_SD (1.06), indicating that it also experienced the smallest expression fluctuations, while the Fa18S gene showed the largest expression fluctuations among the samples with the highest Cq_SD (1.81).

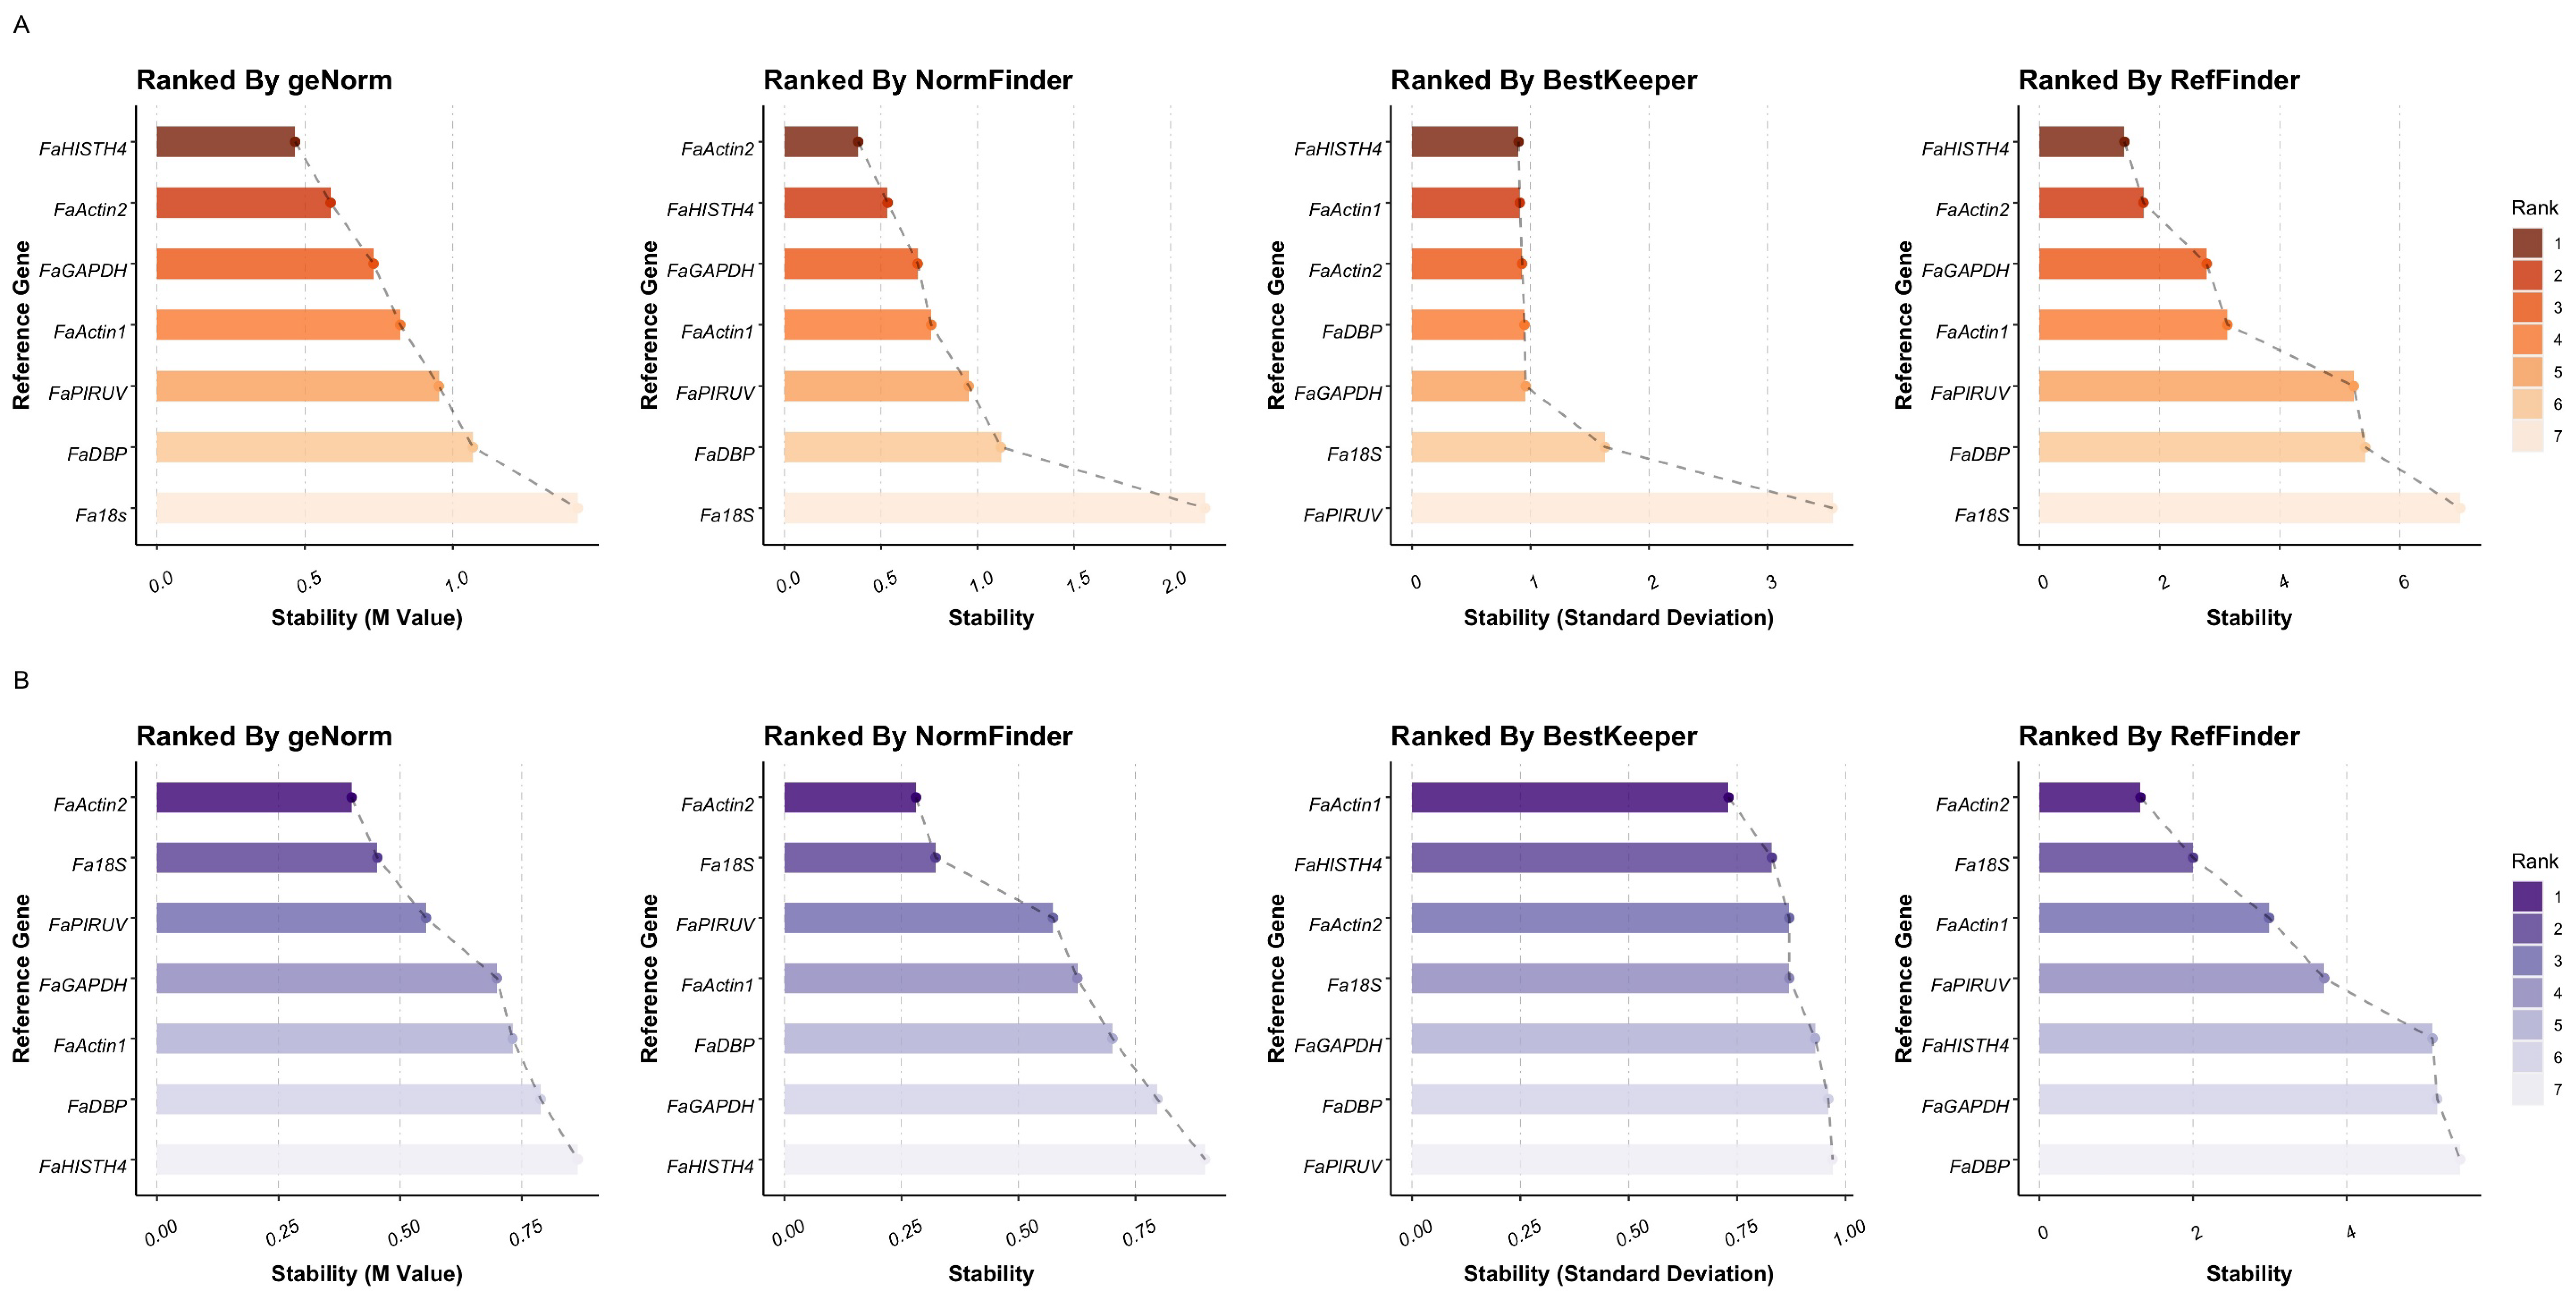
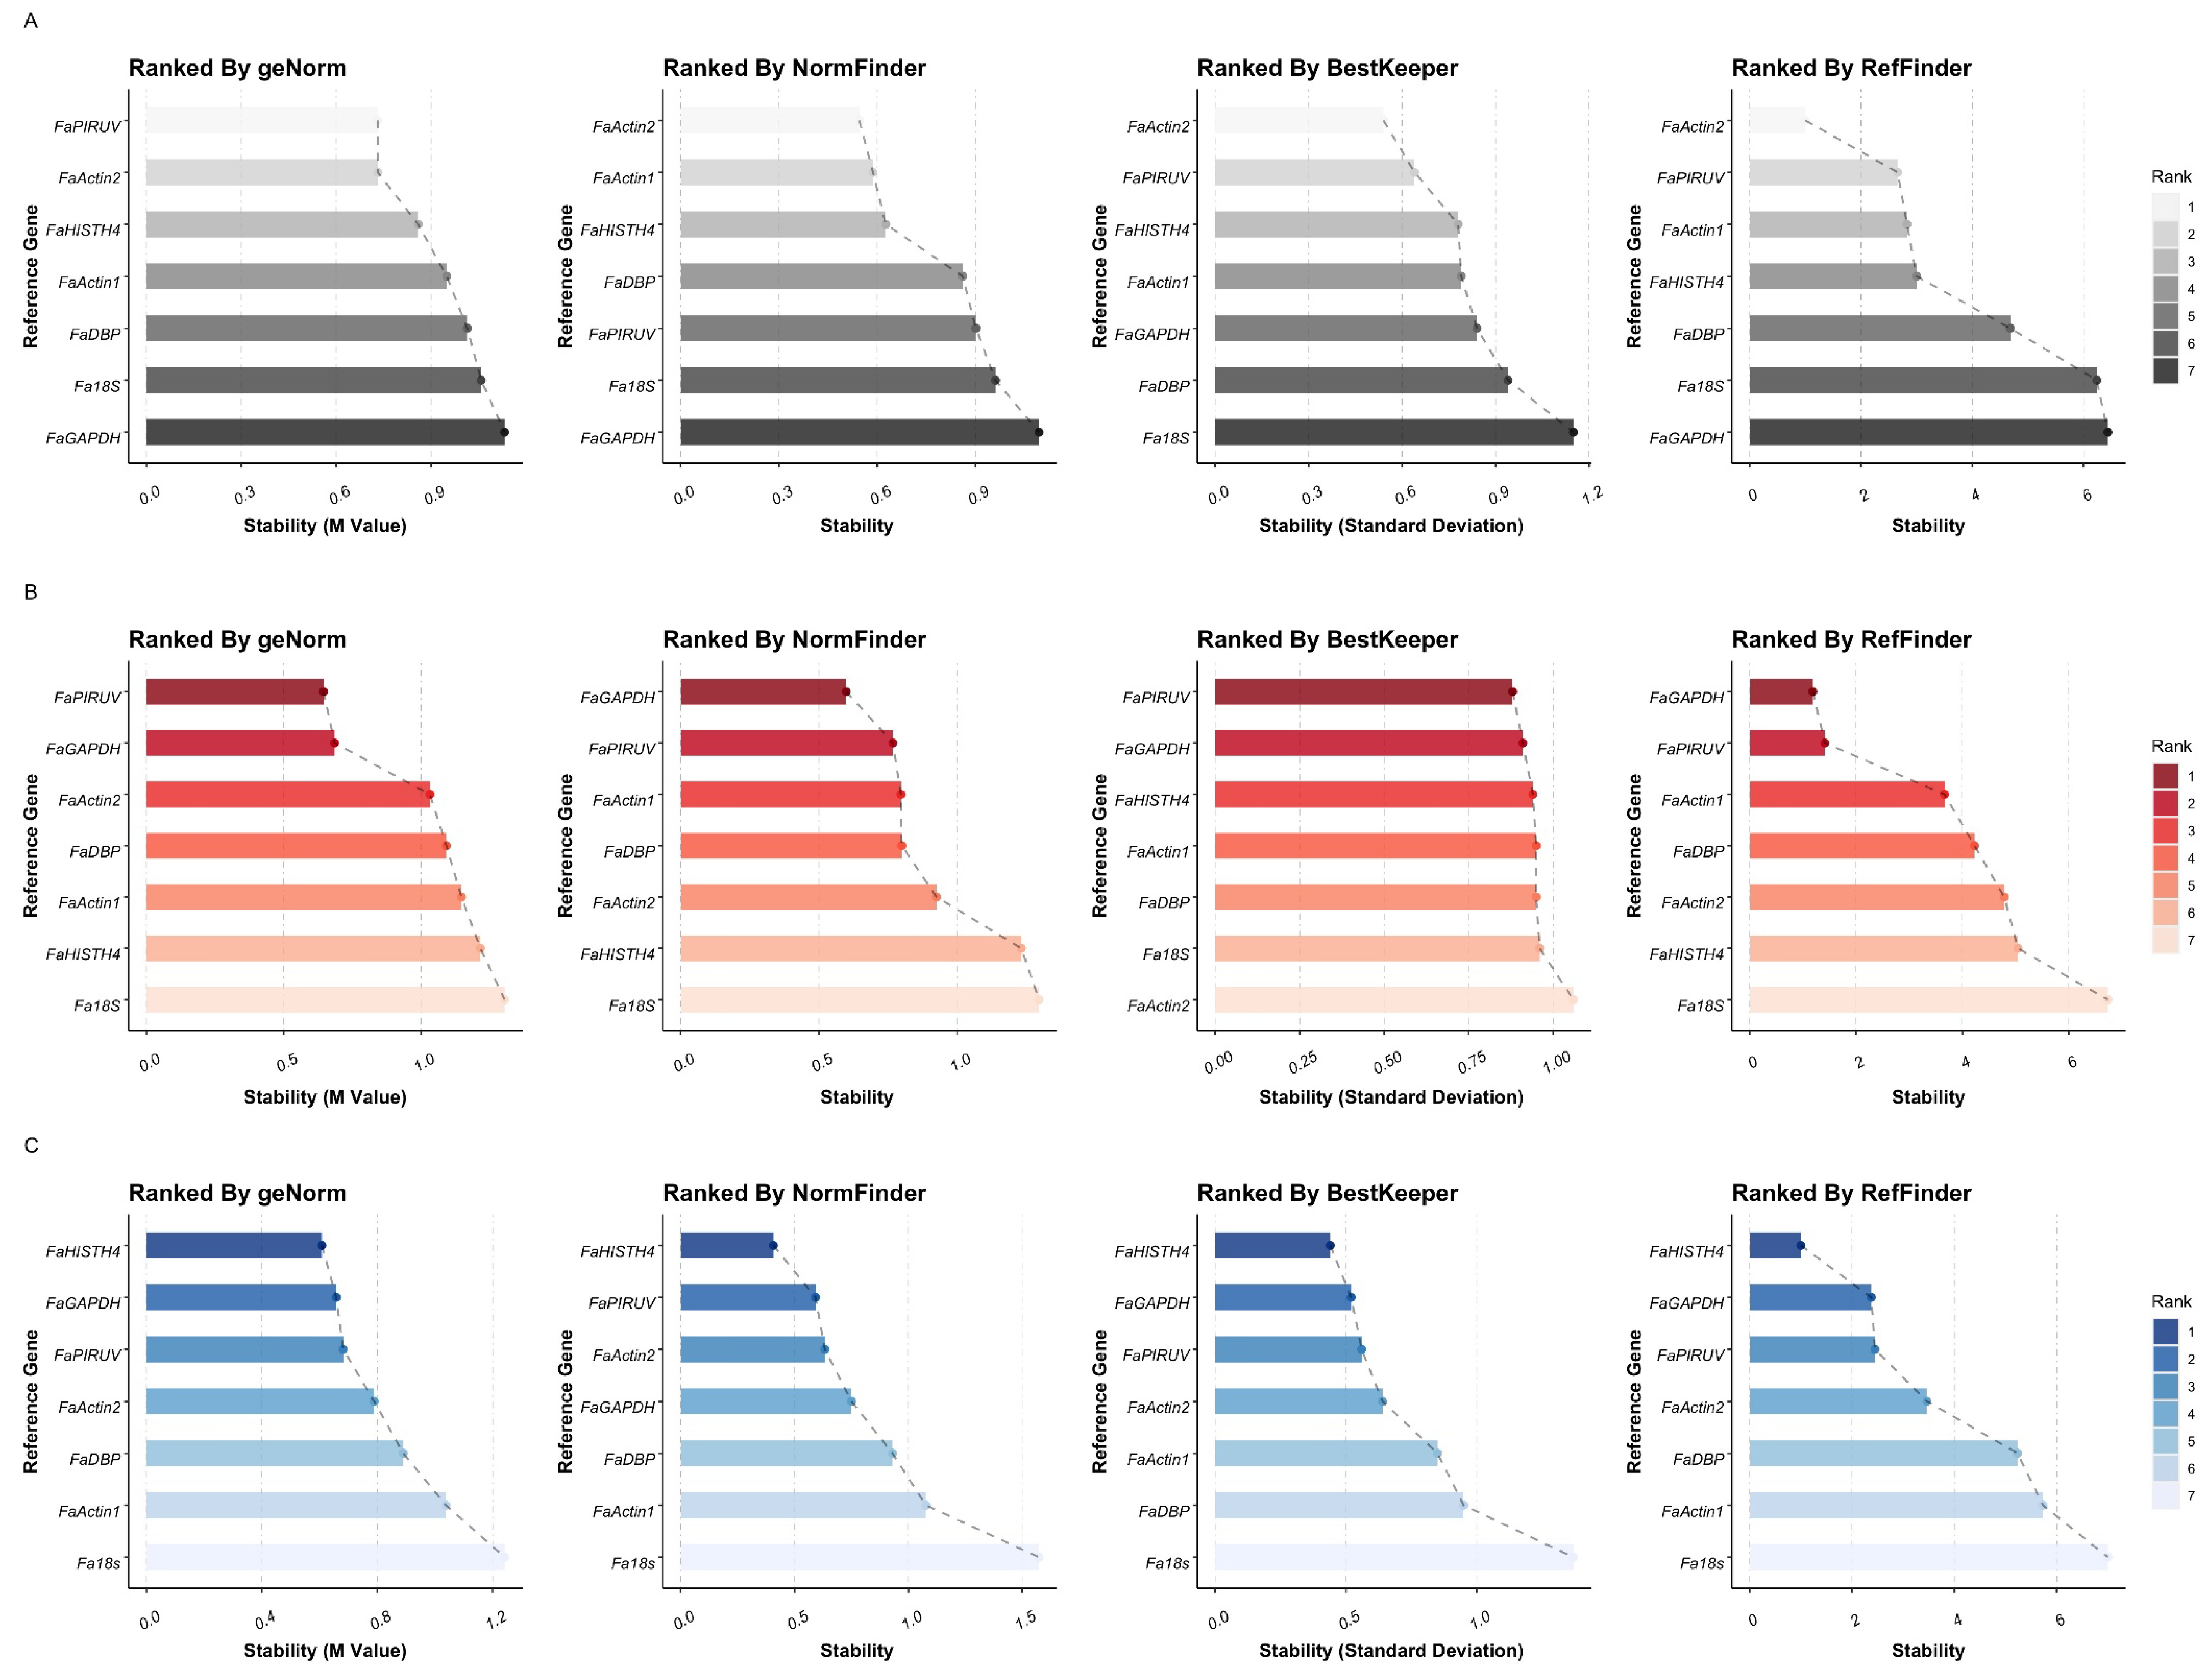
3.3. Reference Gene-Expression Stability Analysis under Treatments

A further analysis of the stability of reference genes under different treatments was conducted using four programs with different algorithms. BestKeeper, geNorm, and NormFinder independently ranked the most suitable reference genes according to the stability scores under different treatments. Next, RefFinder generated a comprehensive ranking list of expression stability by integrating the results of the three programs. We then selected the gene that was recommended most frequently by the different software as the best reference gene for each given treatment.
Under the heat-stress treatment, the candidate reference genes presented different levels of expression stability (Figure 2A and Table S3). FaHISTH4 was identified as the most stable reference gene according to the ranking lists scored by geNorm and BestKeeper. The results from the NormFinder software showed that FaActin2 was the best reference gene among the samples under heat stress. RefFinder generated an overall ranking of FaHISTH4 > FaActin2 > FaGAPDH > FaActin1 > FaPIRUV > FaDBP > Fa18S, highlighting FaHIST4 as the most stable reference gene under heat stress, while FaActin2 also had good stability and was ranked second. Therefore, FaHISTH4 was selected as the best reference gene for the samples under heat stress. On the other hand, Fa18S, which was ranked in the last two positions by all software, was shown to be unsuitable for the normalization of qRT-PCR data under heat treatment.
For the stability results of the reference genes under cold-stress treatment, similar results were obtained using the different software (Figure 2B and Table S3). FaActin2 was considered the most suitable reference, followed by Fa18S for data normalization by geNorm and NormFinder, while FaActin1 and FaHISTH4 were ranked as more suitable than the other candidate reference genes by BestKeeper. The stability ranked by RefFinder was as follows: FaActin2 > Fa18S > FaActin1 > FaPIRUV > FaHISTH4 > FaGAPDH > FaDBP. All the software results provided a relative lower stability score for FaDBP. FaActin2 was thus recommended as the most suitable reference gene for data normalization under cold-stress treatment, while FaDBP was determined to be an unsuitable reference gene.
For the samples subjected to salt stress, geNorm and NormFinder provided similar ranking results (Figure 3A and Table S4). FaGAPDH and FaPIRUV were identified as the most stable genes by geNorm and NormFinder, respectively, while FaDBP was identified as the most unstable reference gene by both programs. A different ranking order was generated by BestKeeper, which considered FaGAPDH to be the best reference gene, whereas FaActin1 and FaPIRUV were ranked in the last two positions as unstable reference genes. The stability order ranked by RefFinder was FaGAPDH > FaPIRUV > FaActin2 > FaActin1 > FaHISTH4 > Fa18S > FaDBP, indicating that FaGAPDH is the best reference gene for gene expression analysis under salt treatment, while FaDBP was not recommended due to offering the poorest expression stability. Combining the above results, FaGAPDH was determined to be the best reference gene for the data normalization of qRT-PCR data in the sample under salt stress, while FaDBP was found to be the most unsuitable reference gene.
The reference gene rankings obtained by geNorm and NormFinder for the samples under drought stress were similar (Figure 3B and Table S4). FaDBP was observed to be the best reference gene for data normalization. Moreover, FaDBP was considered the second most stable reference gene in the ranking list produced by BestKeeper. RefFinder also demonstrated that FaDBP was the best reference gene with the following ranking list: FaDBP > FaGAPDH > FaActin2 > FaPIRUV > FaActin1 > Fa18S > FaHISTH4. These results indicate that FaDBP is the best reference gene for expression analysis under drought stress, while FaHISTH4 is unsuitable because it has the most unstable expression patterns.
Under white-light treatment, FaActin2 and FaPIRUV were evaluated as the most stable reference genes by the three programs (Figure 4A and Table S5). RefFinder generated a stability ranking of the candidate reference genes as follows: FaActin2 > FaPIRUV > FaActin1 > FaHISTH4 > FaDBP > Fa18S > FaGAPDH. FaActin2 was thus selected as the most stable reference gene for the data analysis of gene expression in the samples under white light. Meanwhile, FaGAPDH was the least stable reference gene and was thus not suggested as the reference gene.
To standardize the qRT-PCR data from the red-light treatment, the four programs produced similar ranking results of gene-expression stability(Figure 4B and Table S5). FaPIRUV was ranked as the most stable reference gene by geNorm and Bestkeeper, while NormFinder ranked FaGAPDH as the best reference gene. The ranking order generated by RefFinder was FaGAPDH > FaPIRUV > FaActin1 > FaDBP > FaActin2 > FaHISTH4 > Fa18S. Hence, FaGAPDH was considered to be the best reference gene based on the results of the four programs. Fa18S was ranked as the most unstable reference gene for data normalization according to the results of geNorm, NormFinder, and RefFinder.
Similar rankings of reference genes were generated by the four programs (Figure 4C and Table S5), which all highlighted FaHISTH4 as the best reference gene for data normalization under blue-light treatment. The ranking order calculated by RefFinder was FaHISTH4 > FaGAPDH > FaPIRUV > FaActin2 > FaDBP > FaActin1 > Fa18S. Therefore, Fa18S was considered an unsuitable reference gene and had the poorest stability among the candidate reference genes.

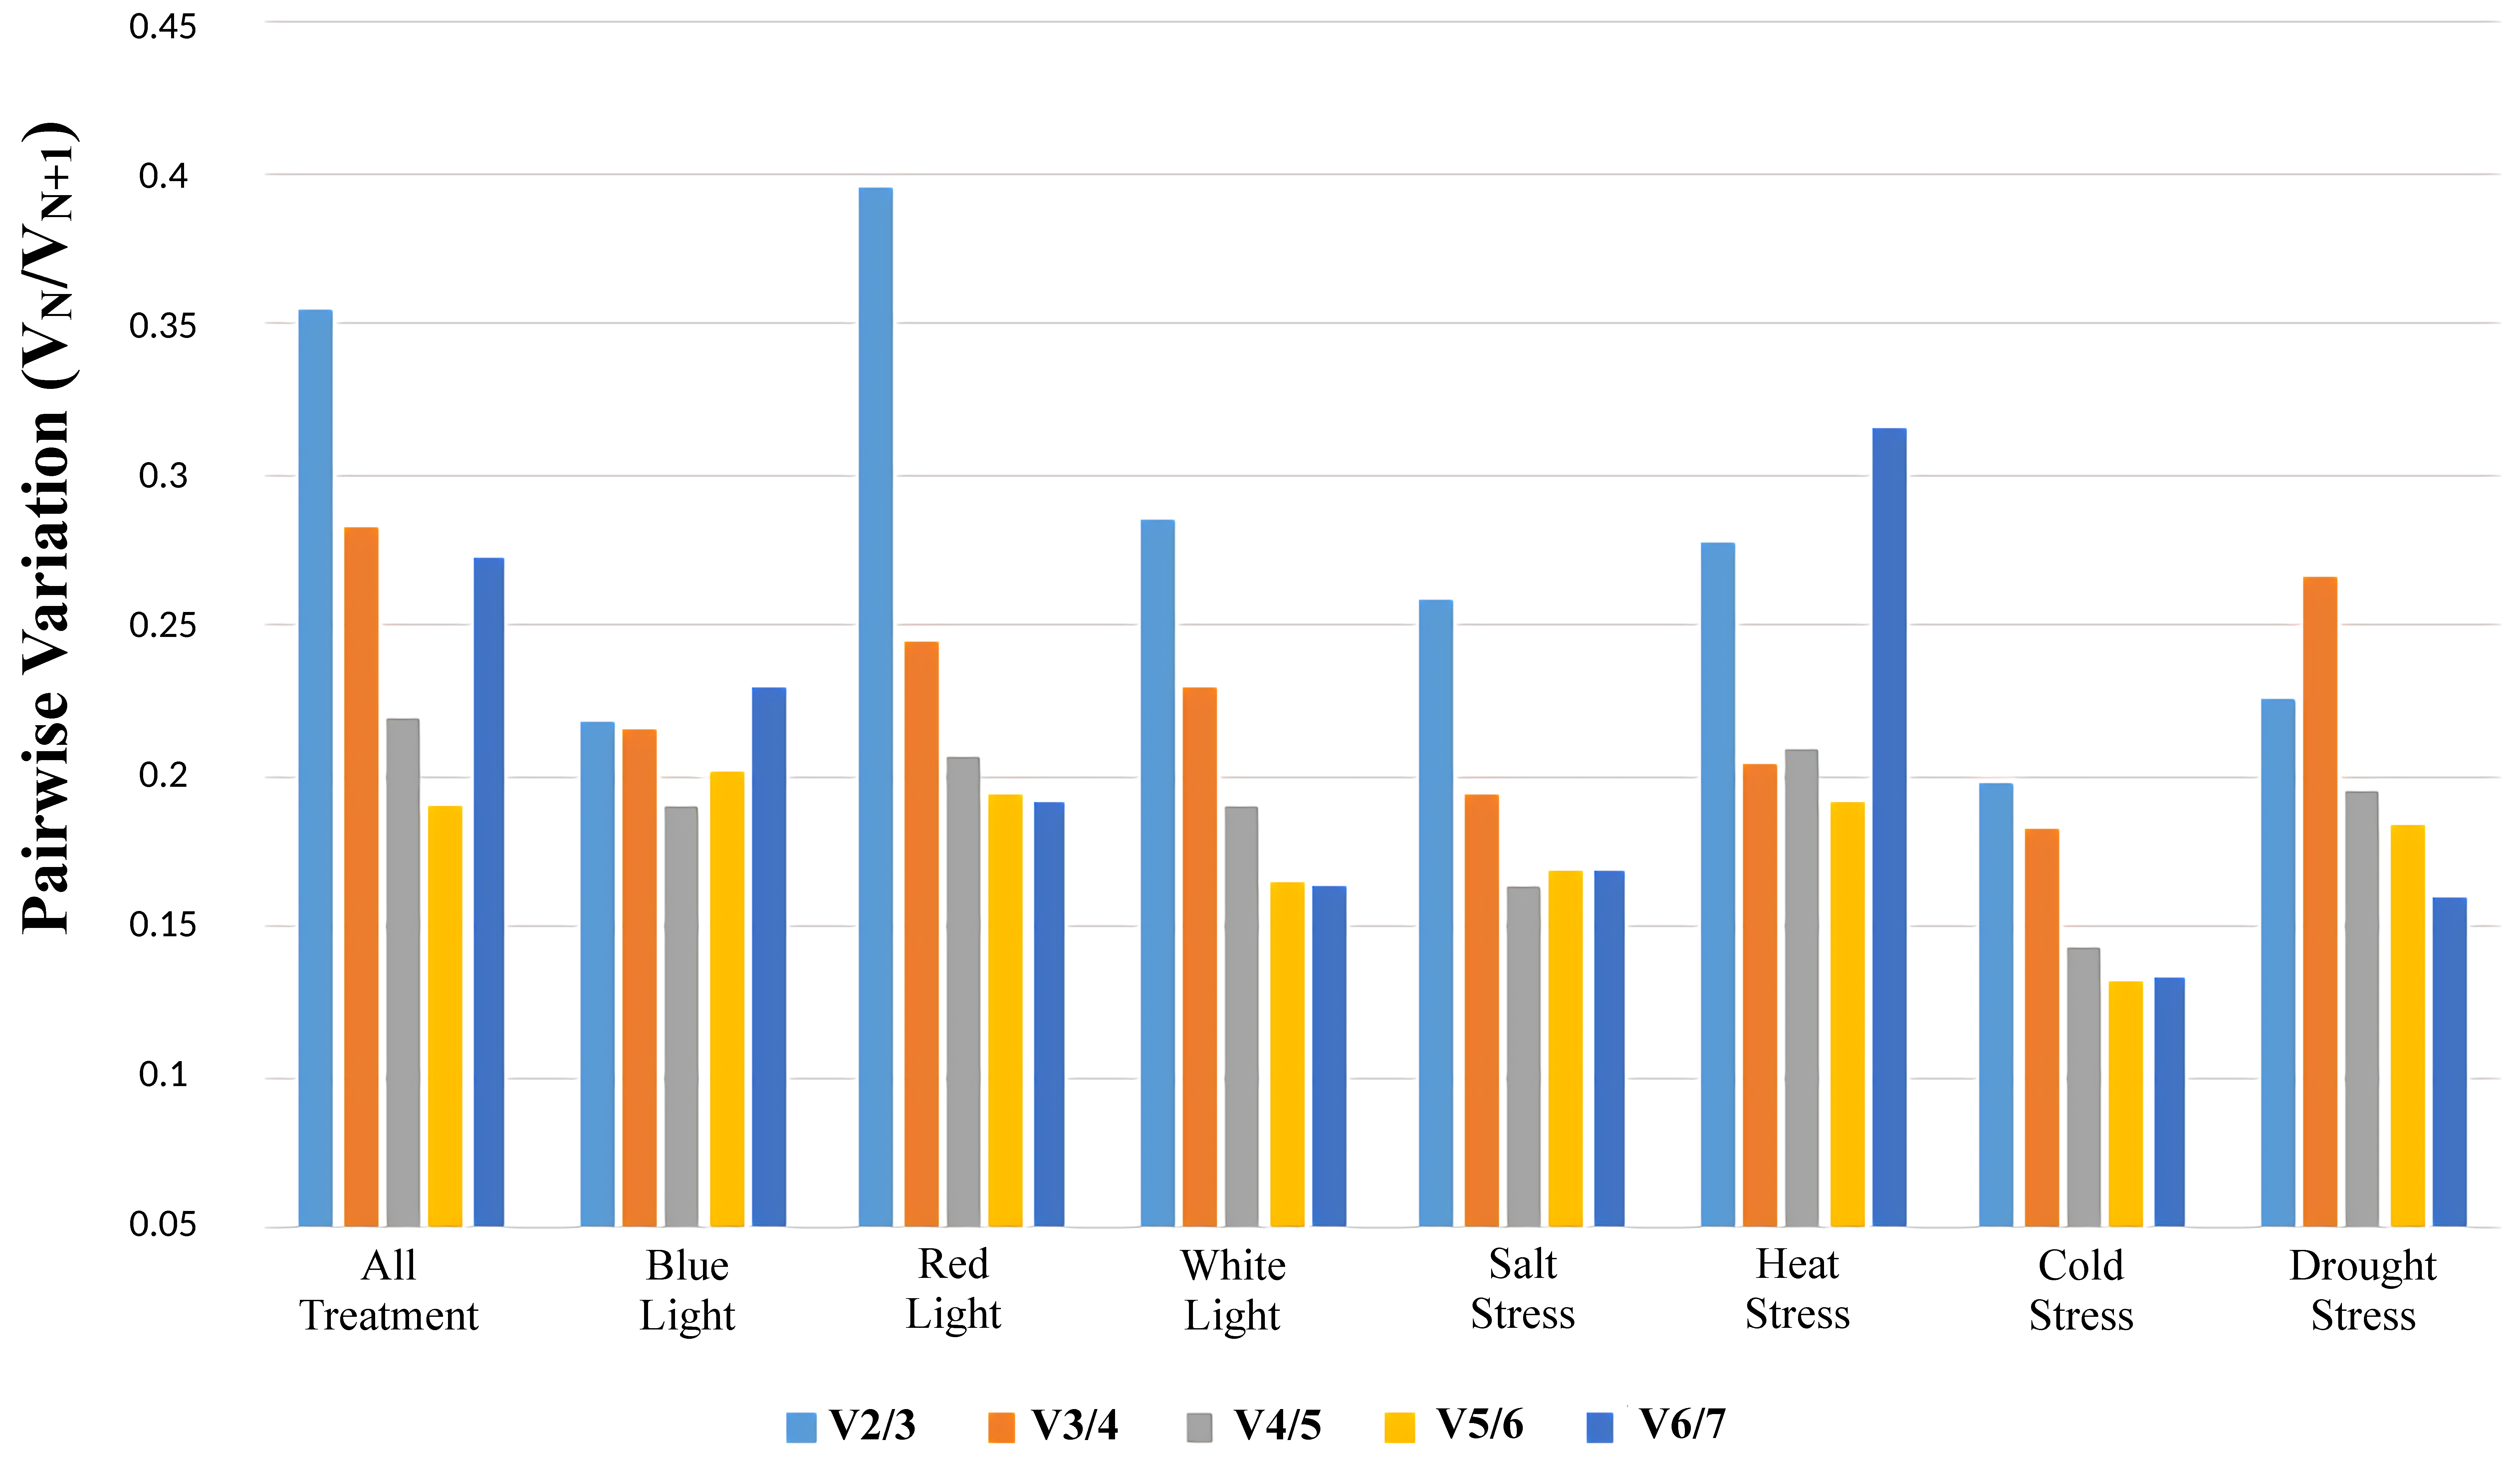
3.4. Identification of the Optimal Number of Reference Genes under Different Treatments

To determine the number of reference genes required for normalizing qRT-PCR data under the given treatments, the geNorm software was employed to calculate the pairwise variation (VN/VN+1) index under each treatment (Figure 5). Pairwise variation larger than the cut-off value (0.15) suggests that one extra reference gene could be introduced to provide accurate normalization. When the pairwise variation (VN/VN+1) is less than 0.15, the recommended number of reference genes is N [34]. In the present study, the pairwise variation of V4/V5 in the data set under cold-stress treatment was lower than 0.15, indicating that using four reference genes is preferable for the normalization of target genes. In the other six data subsets, all VN/VN+1 values were higher than 0.15. However, using more reference genes would likely not only improve the normalization accuracy but also increase experimental instability and complexity. Given that the VN/VN+1 values represent an approximation rather than a necessary criterion, one or two reference genes could be sufficient for accurate normalization [10,34,35].

3.5. Validation of the Selected Reference Genes

FaBBX28, which has a relatively higher expression level in the roots and leaves than in other tissues of strawberry, responded to drought treatment in our previous research (unpublished data). Here, we selected FaBBX28 as a target gene to validate the candidate reference genes under drought-stress treatment. As shown in Figure 6A, we normalized the expression level of FaBBX28 using seven candidate reference genes. Under drought stress, the expression level of FaBBX28 significantly increased at the second sample point (3rd DAT), followed by a downward trend after that expression peak. However, the expression level of FaBBX28 at the third and fourth sample points showed divergences when using different reference genes. In the expression level standard using FaDBP, the expression levels of FaBBX28 at the third and fourth sample points presented no differences with the expression level at the first sample point. This result indicates a similar expression pattern to that of most other reference genes.
To validate the results of qRT-PCR normalization, RNA-seq data were used to measure the expression level of FaBBX28 under drought stress. Given that cultivated strawberry is an allo-octoploid species originating from four diploid progenitor strawberries [32], in the present study, two genes from different subgenomes of cultivated strawberry were amplified by the primer pairs of FaBBX28, including maker-Fvb6-1-augustus-gene-58.64 (from F. vesca subgenome) and snap-masked-Fvb6-4-processed-gene-318.22 (from F. viridis subgenome) (Figure S2). The expression levels of these genes could be measured using the sum of TPM. Moreover, the expression of FaBBX28 under drought stress showed an increasing pattern that was positively correlated with the results of qRT-PCR, suggesting that the reference genes are reliable.
However, the expression levels of the last two sampling points normalized by FaHISTH4 were significantly higher than the level of the first sample point. This distinct divergence might be due to the selection of a most unstable reference gene (FaHISTH4) for the qRT-PCR data analysis. This result not only highlighted the importance of selecting a stable reference gene but also confirmed the reliability of the reference genes to normalize target gene expression.

4. Discussion

qRT-PCR is widely used for determining potential gene functions and is an important method offering high accuracy and sensitivity. In qRT-PCR data analysis, accurate quantification of the target gene-expression level relies on a reference gene with a stable expression level across samples as an internal control to normalize expression data [36]. An ideal reference gene is expected to be expressed stably under different external environments. However, previous research demonstrated that such an ideal reference gene likely does not exist due to the changes in the transcript levels of reference genes under various stresses and tissues [10,36,37]. Therefore, the selection of a suitable reference gene and further validation of expression stability under certain experimental conditions is necessary prior to a qPCR experiment to ensure the accuracy of the expression data normalization. Our group previously proposed seven candidate reference genes for qRT-PCR data normalization under different experimental treatments, including different tissues and fruit developmental stages, different light qualities, and low-temperature treatments. The amplification efficiency of the candidate reference genes was tested and shown to fulfill the requirements for qRT-PCR analysis [10]. In this study, we thus used the same set of candidate reference genes for further validation under different treatments to expand the usage of the reference genes.
The results from the Cq value analysis of candidate reference genes under all treatments showed a divergence in the expression levels between the reference genes. Fa18S showed the highest expression level, which is consistent with previous results [10,38]. In the present study, the mean Cq of Fa18S was 15 cycles less than that of the other reference genes, which suggests that the expression level of Fa18S was far higher than the target gene for analysis. Thus, Fa18S could have introduced significant bias to subsequent data normalization. Furthermore, only in the data subset from the cold treatment was Fa18S evaluated as a suitable reference gene, with second place in the stability ranking. Conversely, Fa18S was always ranked last in most samples, especially under the light-quality treatments and heat-stress treatment. Previously, 18S ribosomal RNA was widely used as a traditional reference gene in strawberry and other plant species under various experimental conditions [39,40,41]. However, increasingly more reports regard 18S as an unstable reference gene because of its high expression level and unstable expression in different samples [10,38,42]. In our study, similar findings regarding the poor stability of Fa18S demonstrated that Fa18S is not suitable for normalizing the expression data of the target genes.
Four programs (geNorm, NormFinder, BestKeeper, and RefFinder) based on different algorithms were used to select stable reference genes in the various species and under different experimental conditions [11,43,44]. Divergent results between the different programs were also observed due to the different statistical analysis algorithms underlying the software. In our study, significant differences in reference gene rankings were observed for the sample under cold treatment and drought treatment (Figure 2B and Figure 3B). In the subset data from the sample subjected to cold treatment, FaActin1 was ranked as most stable reference gene by BestKeeper, while FaActin1 was ranked in fifth and fourth position by geNorm and NormFinder, respectively, suggesting the unstable expression of FaActin1. Moreover, FaActin2 was ranked as the most stable reference gene based on the analysis result of BestKeeper using the subset data of drought treatment. However, the rankings generated by geNorm and NormFinder indicated a less stable score for FaActin2 based on the same data. In our study, RefFinder was used for an integrated analysis, which provided overall rankings of the reference genes.
In the previous research from our group, the stability of reference genes was evaluated using fruit samples under light-quality treatment and low temperature treatment [10]. In this study, FaGAPDH was ranked as the top reference gene for the sample treated by red light. Conversely, FaGAPDH presented the lowest expression stability in the subset data for white-light treatment. However, in our previous study, FaGAPDH was regarded as the best reference gene for the data normalization of samples subjected to light-quality treatment [10]. This divergence might have been caused by the different tissues we sampled in the present study compared to the tissues sampled in the previous study. FaACTIN1, FaHISTH4, and FaPIRUV were ranked in the top three positions for the fruit sample treated by a low temperature. However, in the present study, FaActin2, FaActin1, and FaPIRUV were recommended as the reference genes to normalize the data for the leaf samples subjected to cold stress. This result is partially similar to the results of previous research and indicates that the suitable reference genes for different tissues can vary under similar treatments. This result also demonstrated that a systematic evaluation of the reference gene is necessary for different samples and treatments.
FaBBX28 is a member of the BBX gene family containing the B-box conserved domain [45]. A recent study proposed a relationship between ROS homeostasis and RhBBX28, which is a homologue of FaBBX28 in rose (Rosa hybrida) [46]. Moreover, an expression peak of FaBBX28 in the root tissue of strawberry seedlings was found in our previous results, which led to speculation that the expression level could potentially change in response to drought stress. To validate the selected reference gene, the relative expression level of FaBBX28 under drought stress was profiled and normalized using different reference genes. A significant expression peak was observed when using different reference genes for normalization. However, there was an obvious difference in the expression results of FaBBX28, which were normalized by the recommended reference gene and unstable reference gene. This result indicated the great importance of selecting a suitable reference gene to ensure the accuracy of qRT-PCR data analysis.

5. Conclusions

Evaluating and selecting an appropriate references gene is a prerequisite to correctly analyzing qRT-PCR data. In this study, we systematically evaluated seven candidate reference genes based on their expression stability in leaf tissue subjected to different external conditions. Fa18S was not suitable as a reference gene due to its poor stability and excessively high expression level in all samples. For different treatments, a specific reference gene should be used based on its expression stability under a given condition. FaACTIN2 was found to be the most stable reference gene for low-temperature and white-light treatments. FaGAPDH can be used as a reference gene under salt treatment and red-light treatment but is not suitable for white-light treatment. FaHISTH4 can be used as a reference gene under heat treatment and blue-light treatment but is not recommended for drought-stress treatment. FaDBP is recommended for data normalization under drought-stress treatment but is not suggested for cold-stress or salt-stress treatments. Our results provide a fundamental basis for further analysis of the stress-related gene functions in strawberry.

Supplementary Materials

The following are available online at https://www.mdpi.com/article/10.3390/horticulturae7110452/s1, Figure S1: Melting curve analysis of seven candidate reference genes by quantitative real-time RT-PCR. A single peak indicates the specificity of primers; Figure S2, Matching of the FaBBX28 primer pairs to the genes from the cultivated strawberry genome; Table S1: The candidate reference genes, primer sequences, and amplicon characteristics; Table S2: A Summary of Cq values under all treatments; Table S3: Gene expression stability analysis of geNorm, NormFinder, and BestKeeper under heat and cold stress; Table S4: Gene expression stability analysis of geNorm, NormFinder, and BestKeeper under salt and drought stress; Table S5: Gene expression stability analysis of geNorm, NormFinder, and BestKeeper under different light-quality treatments.

Author Contributions

Conceptualization, Y.Y. and Y.L.; methodology, Y.L. (Yang Lu) and Y.L. (Yongqiang Liu); software, Y.Y. and Y.L. (Yang Lu); validation, G.W. and Y.L. (Yang Lu); formal analysis, Y.L. (Yang Lu); resources, G.W.; data curation, Y.Y.; writing—Original draft preparation, Y.Y.; writing—Review and editing, H.T. and Y.Z.; visualization, Y.Y.; supervision, H.T.; project administration, Y.Y.; funding acquisition, H.T. All authors have read and agreed to the published version of the manuscript.

Funding

This research was funded by National Natural Science Foundation of China (grant number 31872083) and Chinese Scholarship Council (grant number 202006910086).

Institutional Review Board Statement

Not applicable.

Informed Consent Statement

Not applicable.

Conflicts of Interest

The authors declare no conflict of interest.

References

  1. Ali, A.; Yun, D.-J. Salt stress tolerance; what do we learn from halophytes? J. Plant Biol. 2017, 60, 431–439. [Google Scholar] [CrossRef]
  2. Wilkinson, S.; Davies, W.J. Drought, ozone, ABA and ethylene: New insights from cell to plant to community. Plant. Cell Environ. 2010, 33, 510–525. [Google Scholar] [CrossRef]
  3. Chen, L.; Song, Y.; Li, S.; Zhang, L.; Zou, C.; Yu, D. The role of WRKY transcription factors in plant abiotic stresses. Biochim. Biophys. Acta (BBA)-Gene Regul. Mech. 2012, 1819, 120–128. [Google Scholar] [CrossRef]
  4. Zhang, Q.; Jia, M.; Xing, Y.; Qin, L.; Li, B.; Jia, W. Genome-wide identification and expression analysis of MRLK family genes associated with strawberry (Fragaria vesca) fruit ripening and abiotic stress responses. PLoS ONE 2016, 11, e0163647. [Google Scholar] [CrossRef] [PubMed] [Green Version]
  5. Cao, X.; Khaliq, A.; Lu, S.; Xie, M.; Ma, Z.; Mao, J.; Chen, B. Genome-wide identification and characterization of the BES1 gene family in apple (Malus domestica). Plant Biol. 2020, 22, 723–733. [Google Scholar] [CrossRef] [PubMed]
  6. Pocock, T. Light-emitting diodes and the modulation of specialty crops: Light sensing and signaling networks in plants. HortScience 2015, 50, 1281–1284. [Google Scholar] [CrossRef] [Green Version]
  7. Cao, K.; Yu, J.; Xu, D.; Ai, K.; Bao, E.; Zou, Z. Exposure to lower red to far-red light ratios improve tomato tolerance to salt stress. BMC Plant Biol. 2018, 18, 92. [Google Scholar] [CrossRef]
  8. Gachon, C.; Mingam, A.; Charrier, B. Real-time PCR: What relevance to plant studies? J. Exp. Bot. 2004, 55, 1445–1454. [Google Scholar] [CrossRef] [Green Version]
  9. Udvardi, M.K.; Czechowski, T.; Scheible, W.-R. Eleven golden rules of quantitative RT-PCR. Plant Cell 2008, 20, 1736–1737. [Google Scholar] [CrossRef] [Green Version]
  10. Zhang, Y.; Peng, X.; Liu, Y.; Li, Y.; Luo, Y.; Wang, X.; Tang, H. Evaluation of suitable reference genes for qRT-PCR normalization in strawberry (Fragaria× ananassa) under different experimental conditions. BMC Mol. Biol. 2018, 19, 8. [Google Scholar] [CrossRef]
  11. Liu, Q.; Qi, X.; Yan, H.; Huang, L.; Nie, G.; Zhang, X. Reference gene selection for quantitative real-time reverse-transcriptase PCR in annual ryegrass (Lolium multiflorum) subjected to various abiotic stresses. Molecules 2018, 23, 172. [Google Scholar] [CrossRef]
  12. Jian, B.; Liu, B.; Bi, Y.; Hou, W.; Wu, C.; Han, T. Validation of internal control for gene expression study in soybean by quantitative real-time PCR. BMC Mol. Biol. 2008, 9, 59. [Google Scholar] [CrossRef] [Green Version]
  13. Xiao, X.; Ma, J.; Wang, J.; Wu, X.; Li, P.; Yao, Y. Validation of suitable reference genes for gene expression analysis in the halophyte Salicornia europaea by real-time quantitative PCR. Front. Plant Sci. 2015, 5, 788. [Google Scholar] [CrossRef] [Green Version]
  14. Lee, J.M.; Roche, J.R.; Donaghy, D.J.; Thrush, A.; Sathish, P. Validation of reference genes for quantitative RT-PCR studies of gene expression in perennial ryegrass (Lolium perenne L.). BMC Mol. Biol. 2010, 11, 8. [Google Scholar] [CrossRef] [Green Version]
  15. Zheng, T.; Chen, Z.; Ju, Y.; Zhang, H.; Cai, M.; Pan, H.; Zhang, Q. Reference gene selection for qRT-PCR analysis of flower development in Lagerstroemia indica and L. speciose. PLoS ONE 2018, 13, e0195004. [Google Scholar]
  16. Wu, Z.-J.; Tian, C.; Jiang, Q.; Li, X.-H.; Zhuang, J. Selection of suitable reference genes for qRT-PCR normalization during leaf development and hormonal stimuli in tea plant (Camellia sinensis). Sci. Rep. 2016, 6, 19748. [Google Scholar] [CrossRef] [Green Version]
  17. Amil-Ruiz, F.; Garrido-Gala, J.; Blanco-Portales, R.; Folta, K.M.; Muñoz-Blanco, J.; Caballero, J.L. Identification and Validation of Reference Genes for Transcript Normalization in Strawberry (Fragaria × ananassa) Defense Responses. PLoS ONE 2013, 8, e70603. [Google Scholar] [CrossRef] [PubMed] [Green Version]
  18. Crystian, D.; Terto, J.; Silva, J.V.; Almeida, C. Validation of reference genes for accurate normalization by quantitative polymerase chain reaction in sugarcane drought stress studies using two cultivars. Ciência Rural. 2018, 48, 1–7. [Google Scholar] [CrossRef]
  19. Hancock, J.F. Strawberries; CABI: Oxon, UK, 2020. [Google Scholar]
  20. Zhang, J.; Wang, X.; Yu, O.; Tang, J.; Gu, X.; Wan, X.; Fang, C. Metabolic profiling of strawberry (Fragaria× ananassa Duch.) during fruit development and maturation. J. Exp. Bot. 2011, 62, 1103–1118. [Google Scholar] [CrossRef] [PubMed]
  21. Keutgen, A.J.; Pawelzik, E. Contribution of amino acids to strawberry fruit quality and their relevance as stress indicators under NaCl salinity. Food Chem. 2008, 111, 642–647. [Google Scholar] [CrossRef]
  22. Ferreira, J.F.S.; Liu, X.; Suarez, D.L. Fruit yield and survival of five commercial strawberry cultivars under field cultivation and salinity stress. Sci. Hortic. 2019, 243, 401–410. [Google Scholar] [CrossRef]
  23. Yu, D.; Tang, H.; Zhang, Y.; Du, Z.; Yu, H.; Chen, Q. Comparison and improvement of different methods of RNA isolation from strawberry (Fragria× ananassa). J. Agric. Sci. 2012, 4, 51. [Google Scholar] [CrossRef]
  24. Vandesompele, J.; de Preter, K.; Pattyn, F.; Poppe, B.; van Roy, N.; de Paepe, A.; Speleman, F. Accurate normalization of real-time quantitative RT-PCR data by geometric averaging of multiple internal control genes. Genome Biol. 2002, 3, 1–12. [Google Scholar] [CrossRef] [Green Version]
  25. Andersen, C.L.; Jensen, J.L.; Ørntoft, T.F. Normalization of real-time quantitative reverse transcription-PCR data: A model-based variance estimation approach to identify genes suited for normalization, applied to bladder and colon cancer data sets. Cancer Res. 2004, 64, 5245–5250. [Google Scholar] [CrossRef] [PubMed] [Green Version]
  26. Pfaffl, M.W.; Tichopad, A.; Prgomet, C.; Neuvians, T.P. Determination of stable housekeeping genes, differentially regulated target genes and sample integrity: BestKeeper—Excel-based tool using pair-wise correlations. Biotechnol. Lett. 2004, 26, 509–515. [Google Scholar] [CrossRef]
  27. Xie, F.; Xiao, P.; Chen, D.; Xu, L.; Zhang, B. miRDeepFinder: A miRNA analysis tool for deep sequencing of plant small RNAs. Plant Mol. Biol. 2012, 80, 75–84. [Google Scholar] [CrossRef] [PubMed]
  28. Livak, K.J.; Schmittgen, T.D. Analysis of relative gene expression data using real-time quantitative PCR and the 2−ΔΔCT method. Methods 2001, 25, 402–408. [Google Scholar] [CrossRef]
  29. Galli, V.; Messias, R.S.; Guzman, F.; Perin, E.C.; Margis, R.; Rombaldi, C.V. Transcriptome analysis of strawberry (Fragaria× ananassa) fruits under osmotic stresses and identification of genes related to ascorbic acid pathway. Physiol. Plant. 2019, 166, 979–995. [Google Scholar] [CrossRef]
  30. Bolger, A.M.; Lohse, M.; Usadel, B. Trimmomatic: A flexible trimmer for Illumina sequence data. Bioinformatics 2014, 30, 2114–2120. [Google Scholar] [CrossRef] [PubMed] [Green Version]
  31. Pertea, M.; Kim, D.; Pertea, G.M.; Leek, J.T.; Salzberg, S.L. Transcript-level expression analysis of RNA-seq experiments with HISAT, StringTie and Ballgown. Nat. Protoc. 2016, 11, 1650–1667. [Google Scholar] [CrossRef] [PubMed]
  32. Edger, P.P.; Poorten, T.J.; VanBuren, R.; Hardigan, M.A.; Colle, M.; McKain, M.R.; Smith, R.D.; Teresi, S.J.; Nelson, A.D.L.; Wai, C.M.; et al. Origin and evolution of the octoploid strawberry genome. Nat. Genet. 2019, 51, 541–547. [Google Scholar] [CrossRef] [Green Version]
  33. Ruiz-Villalba, A.; Ruijter, J.M.; van den Hoff, M.J.B. Use and misuse of Cq in qPCR data analysis and reporting. Life 2021, 11, 496. [Google Scholar] [CrossRef]
  34. de Spiegelaere, W.; Dern-Wieloch, J.; Weigel, R.; Schumacher, V.; Schorle, H.; Nettersheim, D.; Bergmann, M.; Brehm, R.; Kliesch, S.; Vandekerckhove, L.; et al. Reference Gene Validation for RT-qPCR, a Note on Different Available Software Packages. PLoS ONE 2015, 10, e0122515. [Google Scholar] [CrossRef] [PubMed] [Green Version]
  35. Li, M.; Xie, F.; He, Q.; Li, J.; Liu, J.; Sun, B.; Luo, Y.; Zhang, Y.; Chen, Q.; Zhang, F.; et al. Expression Analysis of XTH in Stem Swelling of Stem Mustard and Selection of Reference Genes, (n.d.). Genes 2020, 11, 113. [Google Scholar] [CrossRef] [Green Version]
  36. Hamalainen, H.K.; Tubman, J.C.; Vikman, S.; Kyrölä, T.; Ylikoski, E.; Warrington, J.A.; Lahesmaa, R. Identification and Vali-dation of Endogenous Reference Genes for Expression Profiling of T Helper Cell Differentiation by Quantitative Real-Time RT-PCR. Anal. Biochem. 2001, 299, 63–70. [Google Scholar] [CrossRef] [PubMed]
  37. Liu, D.; Huang, X.; Lin, Y.; Wang, X.; Yan, Z.; Wang, Q.; Ding, J.; Gu, T.; Li, Y. Identification of reference genes for transcript normalization in various tissue types and seedlings subjected to different abiotic stresses of woodland strawberry Fragaria vesca. Sci. Hortic. 2020, 261, 108840. [Google Scholar] [CrossRef]
  38. Galli, V.; Borowski, J.M.; Perin, E.C.; Messias, R.d.; Labonde, J.; Pereira, I.d.S.; Silva, S.D.d.A.; Rombaldi, C.V. Validation of reference genes for accurate normalization of gene expression for real time-quantitative PCR in strawberry fruits using different cultivars and osmotic stresses. Gene 2015, 554, 205–214. [Google Scholar] [CrossRef]
  39. Benítez-Burraco, A.; Blanco-Portales, R.; Redondo-Nevado, J.; Bellido, M.L.; Moyano, E.; Caballero, J.; Muñoz-Blanco, J. Clon-ing and characterization of two ripening-related strawberry (Fragaria × ananassa cv. Chandler) pectate lyase genes. J. Exp. Bot. 2003, 54, 633–645. [Google Scholar] [CrossRef] [PubMed] [Green Version]
  40. Li, C.; Hu, L.; Wang, X.; Liu, H.; Tian, H.; Wang, J. Selection of reliable reference genes for gene expression analysis in seeds at different developmental stages and across various tissues in Paeonia ostia. Mol. Biol. Rep. 2019, 46, 6003–6011. [Google Scholar] [CrossRef]
  41. Hu, Y.; Han, Y.; Wei, W.; Li, Y.; Zhang, K.; Gao, Y.; Zhao, F.; Feng, J. Identification, isolation, and expression analysis of heat shock transcription factors in the diploid woodland strawberry Fragaria vesca. Front. Plant Sci. 2015, 6, 736. [Google Scholar] [CrossRef] [PubMed] [Green Version]
  42. Wang, Z.; Gu, C.; Xuan, L.; Hua, J.; Shi, Q.; Fan, W.; Yin, Y.; Yu, F. Identification of suitable reference genes in Taxodium ‘Zhongshanshan’ under abiotic stresses. Trees 2017, 31, 1519–1530. [Google Scholar] [CrossRef]
  43. Shu, B.; Yu, H.; Dai, J.; Xie, Z.; Qian, W.; Lin, J. Stability evaluation of reference genes for real-time quantitative PCR normalization in Spodoptera frugiperda (Lepidoptera: Noctuidae). J. Integr. Agric. 2021, 20, 2471–2482. [Google Scholar] [CrossRef]
  44. Jia, Y.; Liu, S.-C.; Zhao, J.; Chen, X.-X.; Sun, L.-X.; Yu, X.-F.; Li, X. Reference gene selection and validation by qRT-PCR during flower development and in different organs of Primula forbesii. J. Hortic. Sci. Biotechnol. 2019, 95, 383–394. [Google Scholar] [CrossRef]
  45. Gangappa, S.N.; Botto, J.F. The BBX family of plant transcription factors. Trends Plant Sci. 2014, 19, 460–470. [Google Scholar] [CrossRef] [PubMed]
  46. Zhang, Y.; Wu, Z.; Feng, M.; Chen, J.; Qin, M.; Wang, W.; Bao, Y.; Xu, Q.; Ye, Y.; Ma, C. The circadian-controlled PIF8-BBX28 module regulates petal senescence in rose flowers by governing mitochondrial ROS homeostasis at night. Plant Cell. 2021, 33, 2716–2735. [Google Scholar] [CrossRef] [PubMed]
Figure 1. The Cq values of the candidate reference genes in all treated samples.
Horticulturae 07 00452 g001
Figure 2. Expression stability ranks of the candidate reference genes under heat stress (A) and cold stress (B).
Horticulturae 07 00452 g002
Figure 3. Expression stability ranks of the candidate reference genes under salt stress (A) and drought stress (B).
Horticulturae 07 00452 g003
Figure 4. Expression stability ranks of the candidate reference genes under different types of light: white-light treatment (A), red-light treatment (B), and blue-light treatment (C).
Horticulturae 07 00452 g004
Figure 5. Pairwise variation (VN/VN+1) for selecting an optimal number of reference genes for data normalization under different treatments.
Horticulturae 07 00452 g005
Figure 6. Gene-expression level of FaBBX28 under drought stress. (A) The expression level normalized by the seven candidate reference genes. The expression levels are represented as the mean ± standard error. The standard error was calculated from the expression levels of biological replicates under drought stress. (B) The expression level determined by RNA-seq under drought stress.
Horticulturae 07 00452 g006
Publisher’s Note: MDPI stays neutral with regard to jurisdictional claims in published maps and institutional affiliations.

