Article

Differential Assembly and Shifts of the Rhizosphere Bacterial Community by a Dual Transgenic Glyphosate-Tolerant Soybean Line with and without Glyphosate Application

1
State Key Laboratory of Pharmaceutical Biotechnology, Institute for Plant Molecular Biology, School of Life Sciences, Nanjing University, Nanjing 210023, China
2
Co-Innovation Center for Sustainable Forestry in Southern China, Nanjing Forestry University, Nanjing 210037, China
3
School of Life Sciences, Huaiyin Normal University, Huaian 223300, China
*
Authors to whom correspondence should be addressed.
Authors contributed equally.
Horticulturae 2021, 7(10), 374; https://doi.org/10.3390/horticulturae7100374
Submission received: 24 July 2021 / Revised: 15 September 2021 / Accepted: 26 September 2021 / Published: 8 October 2021
(This article belongs to the Special Issue Advancements in Soil Health)

Abstract

:
Modern agriculture has gained significant economic benefits worldwide with the use of genetically modified (GM) technologies. While GM crops provide convenience to humans, their biosafety has attracted increasing concern. In this study, the Illumina MiSeq was used to perform a high-throughput sequencing of the V3-V4 hypervariable regions of 16S rRNA gene (16S rDNA) amplicons to compare the rhizosphere bacterial communities of the EPSPS/GAT dual transgenic glyphosate-tolerant soybean line Z106, its recipient variety ZH10, and Z106 with glyphosate application (Z106G) during flowering, seed filling, and maturing stages under field settings. At each of the three stages, the alpha and beta diversity of rhizosphere bacterial communities revealed no significant differences between ZH10, Z106, and Z106G. However, some bacterial taxa demonstrated a greater proportional contribution, particularly the nitrogen-fixing rhizobium Ensifer fredii, in the rhizospheric soil of Z106 at the seed filling and maturing stages, when compared to ZH10 and Z106G. The present study therefore suggests that the EPSPS/GAT dual transgenic line Z106 and exogenous glyphosate application have a minimal effect on the composition of the soybean rhizosphere bacterial community but have no impact on the structure of the rhizosphere microbial community during a single planting season.

Graphical Abstract

1. Introduction

Following the turn of the 21st century, biotech/genetically modified (GM) crop technology was widely adopted in a number of developed and developing countries, primarily in the cultivation of canola, maize, cotton, and soybean [1,2]. China, a leading country in planting GM crops, planted 2.94 million hectares of GM crops in 2018, with 2.93 million hectares of insect-resistant cotton and 9600 hectares of virus-resistant papaya [3,4]. In China, the commercialization of GM soybean is still being considered, owing to the potential for biosafety concerns [5], such as the influence of glyphosate-tolerant transgenic soybean with herbicide application on the soil ecological environment and microorganisms [6]. Glyphosate-based herbicides are the most widely used herbicides in the world, and they are widely employed on glyphosate-tolerant GM crops [7,8]. Glyphosate has a chelating property that allows it to be rapidly absorbed and translocated in plant tissues via a variety of action sites, resulting in the lack of metabolism in plants and changes in functions or enzymes in carbon metabolism and nitrogen metabolism, and it is toxic to soil organisms other than plants. It is worth considering the ecological risk assessment of glyphosate-tolerant GM crops and glyphosate application in the field [7,9,10,11,12].
Previously, the glyphosate-tolerant dual transgenes, 5-enolpyruvylshikimate-3-phosphate synthase (EPSPS) and glyphosate N-acetyltransferase (GAT), were used in the transgenic soybean cultivar ZH10−6 (Z106) [13] to reduce glyphosate effects by converting glyphosate into N-acetyl glyphosate [14,15,16], and the results reveal that the dual transgenes and glyphosate application caused distinct alterations in rhizosphere functional bacterial species [13].
To improve the methodological approach in this study, we used high-throughput sequencing of 16S rDNA (V3-V4 hypervariable region) amplicons via the Illumina MiSeq, a technology that has been widely used for the analysis of the structure and function of the rhizosphere bacterial community [17,18,19], and analyzed the rhizosphere bacterial communities between Z106, its recipient Zhonghuang 10 (ZH10), and Z106 with glyphosate application (Z106G) at the flowering, seed filling, and maturing stages.

2. Materials and Methods

2.1. Plant Materials, Field Design, and Sampling Methods

In this study, the soybean (Glycine max L. Merr.) line Z106, which carries the EPSPS and GAT glyphosate-tolerant transgenes, its recipient soybean line ZH10, and Z106 treated with 900 g·hectare−1 glyphosate at the seedling stage on July 24 in 2017 (Z106G) were selected as three plant material treatments [20]. The soybeans were planted in the Shunyi Experimental Field Station of the Crop Research Institute (Chinese Academy of Agricultural Sciences) in Shunyi district, Beijing, China (N 40.23°, E 116.56°) in July 2017. The soil type used is aquic cinnamon soil according to the China Soil Database (http://vdb3.soil.csdb.cn/ (accessed on 15 December 2017)). The experimental field was divided into 9 plots (15 m × 10 m per plot) using a randomized block design, with three replications for each of the three treatments. Without any other fertilizers, [NH4]2HPO4 300 kg·hectare−1 and KCl 150 kg·hectare−1 were applied prior to planting [13].
We collected the experimental samples at the flowering (R1–R2) stage on August 16, seed filling (R5–R6) stage on September 11, and maturing (R8) stage on October 23 in 2017, and soil before planting was collected on June 30 in 2017. At three growth stages, the surrounding soil or rhizospheric soil of each soybean treatment was sampled from three different plots with five sampling points each, in which were distributed diagonal crossover, and composite samples from five sampling points per plot were made and treated as one replicate. F, S, and M represent the soil sampled at the flowering, seed filling, and maturing stages, respectively, while BS and RS represent surrounding soil that was loosely adhered to the soybean’s roots and rhizospheric soil that was collected by brushing off soil that was tightly adhered to the root surface, respectively. The BS without marked growth stages represents soil before planting (Supplementary Table S1). All 63 soil samples were selected for 21 different groups, with 3 replications in each group. For basic physicochemical analysis, parts of the soil samples were dried in the air, while the remainder were stored at −80 °C for DNA extraction [21,22]. The entire plant at the three stages, including pods, was sampled and dried in the air, after which the sample was ground into a powder by a disintegrator for plant analysis.

2.2. Basic Physicochemical Properties of Soils and Plants: Key Soil Enzyme Activities

The carbon and nitrogen contents of the dried rhizospheric soil and dried plant tissue samples at the three stages were analyzed using the Dumas Combustion Method by Vario MICRO cube elemental analyzer (Elementar Analysensysteme GmbH, Langenselbold, Germany) in the Modern Analysis Center of Nanjing University. The pH value and water content of fresh rhizospheric soil samples were tested under laboratory conditions by the potentiometric method and stoving method [13], respectively. Furthermore, the activities of key soil enzymes involved in the nitrogen cycle and carbon cycle, such as Solid-Urease (S-UE), Solid-Nitrate Reductase (S-NR), Solid-Nitrite Reductase (S-NiR), and Solid-Sucrase (S-SC), were tested for dried surrounding soil and dried rhizospheric soil using the corresponding kit developed in 2017 (Beijing Solarbio Science & Technology Co., Ltd., Beijing, China).

2.3. Culturable Nitrogen-Fixing Bacteria in Rhizospheric Soil and Nodulation Effect of Soil Nitrogen-Fixing Bacteria

To count the number of culturable nitrogen-fixing bacteria in soil, 1.0 g of fresh rhizospheric soil was diluted to the concentrations of 10−1, 10−2, 10−3, 10−4, 10−5, 10−6, 10−7, and 10−8 in sterile water. To determine the appropriate bacterial concentration for counting, 0.1 mL different concentrations of bacterial solution were plated evenly on nitrogen-fixing rhizobium medium (Qingdao Hope Biol-Technology Co., Ltd., Qingdao, China). After 48 h incubation at 28 °C, the optimal concentration of nitrogen-fixing bacteria colony distribution was observed, then the 10−5 diluent was selected as the most suitable concentration. Finally, colonies were enumerated and the number of culturable nitrogen-fixing bacteria per gram of soil was calculated as follows:
Number of culturable nitrogen-fixing bacteria per gram of soil = Colonies number × Dilution concentration/Weight of fresh soil
Soybean roots and nodules were collected and stored in sealed bags at the flowering, seed filling, and maturing stages to study the nodulation effect of soil nitrogen-fixing bacteria. The nodules were carefully detached from the roots, rinsed, and dried in the air, and the number and fresh weight of nodules were then recorded. Each sampling plot had 20 individual soybean plants. The number and fresh weight of root nodules per plant were calculated as follows:
Number of soybean nodules per plant = Total number of soybean nodules/number of soybean plants
Fresh weight of soybean nodules per plant = Total fresh weight of soybean nodules/number of soybean plants

2.4. DNA Extraction from Soil Samples and PCR Amplification of 16S rDNA Amplicon Sequencing

In this study, each biological replicate of the total metagenomic DNA was extracted from approximately 0.6 g soil by using the PowerSoil DNA Isolation Kit (MoBio Laboratories, Carlsbad, CA, USA), following the methods as Lu et al. described with slight modifications [23,24]. The extracted DNA solution was stored at −80 °C for subsequent experiments.
We used the forward primer 341F (5′-ACTCCTACGGGAGGCAGCAG-3′) and the reverse primer 806R (5′-GGACTACHVGGGTWTCTAAT-3′) to amplify the V3–V4 region of the 16S rDNA by Polymerase Chain Reaction (PCR) [25,26]. The qualified libraries were subjected to PCR amplification, product purification, library quality determinations, quantification, and high-throughput sequencing of the qualified libraries on the Illumina MiSeq platform (Illumina, San Diego, CA, USA) using the MiSeq Reagent Kit by BGI Tech Solutions (Wuhan, China) as described previously by Lu et al. (2017). The sequencing clean data of 63 samples were submitted to the Sequence Read Archive (SRA) with the accession number PRJNA734728.

2.5. OTU Analysis of 16S rDNA Amplicon Sequencing Data

A total of 4,937,496 qualified paired-end clean reads with an average count of 78,373 (range: 53,236–81,871) per sample were obtained from all 63 samples, including surrounding and rhizospheric soil samples at the flowering, seed filling, and maturing stages, and the soil before planting. Total qualified paired clean reads at the flowering, seed filling, and maturing stages were 1,435,554, 1,380,553, and 1,398,912, respectively. The average count per sample at the flowering, seed filling, and maturing stages was 79,753 (range: 78,423–81,054), 76,697 (range: 53,236–81,052), and 77,717 (range: 62,570–80,372), respectively (Supplementary Table S2). The sequencing data statistics were provided by BGI Tech Solutions.
The clean tags were clustered into operational taxonomic units (OTUs) by using UPARSE (v7.0.1090) [27], and minor modification was conducted as previously described by Lu et al. [21,22]. OTU counts were normalized after species annotation and phylogenetic tree construction, according to the minimum sample number sequence. Mitochondrion/chloroplast-related sequences (phylum Cyanobacteria, family Mitochondria) were eliminated [28,29], to avoid the interference of mitochondrial and chloroplast genes. The OTU rank abundance curve was drawn to reflect the richness and evenness of species (Supplementary Figure S1). The Pan and Core OTU analysis was used to observe the increase in total species and decrease in common shared species, respectively (Supplementary Figure S2). All of the operations described above were performed on the I-Sanger platform (http://www.i-sanger.com (accessed on 30 March 2021)) [26].

2.6. Alpha Diversity, Beta Diversity, Taxonomy, Functional Analysis, and Statistical Analysis

Alpha and beta diversity analyses were conducted based on OTUs and species annotation results between different treatments at each of the three stages [30].
Alpha diversity analysis calculated by Mothur (v1.30.2) was applied to express the complexity of species diversity for a sample by different indices, such as sobs, Chao1, ACE, Shannon, and Simpson, then Graphpad Prism 8.4.2 was used to make the boxplot of each index.
The beta diversity analysis was used to assess differences in species complexity between groups through Bray–Curtis, weighted UniFrac (WUF), and unweighted UniFrac (UUF) distance metrics. Principal coordinate analysis (PCoA) was performed with software R (v3.3.1) [31]. Partial least squares discriminant analysis (PLS-DA) was conducted with the mix Omics package of software R (v3.3.1) [32].
Taxa clustering was performed based on the relative abundance of each taxon. The bar plot drawn by R software (v3.3.1) showed the dominant species at different taxonomic levels in each sample and relative abundances of these species. A ternary plot was drawn by GGTERN (v3.3.0) to display the ratio relationship of the different attributes of three variables [28,33]. The Circos plot was drawn by Circos-0.67-7 to describe the correspondence between samples and species [34].
The Cluster of Orthologous Groups of proteins (COG) function classification was performed using the software Phylogenetic Investigation of Communities by Reconstruction of Unobserved States (PICRUSt2) (v2.2.0), which was based on the optimization and improvement of PICRUSt1 [35], according to the database EggNOG (evolutionary genealogy of genes: Non-supervised Orthologous Groups, http://eggnog.embl.de/ (accessed on 30 March 2021)) and KEGG (Kyoto Encyclopedia of Genes and Genomes).
For statistical analysis, the Student’s t-test for different indices of alpha diversity was conducted. Analysis of similarities (ANOSIM) and permutational MANOVA (PERMANOVA/Adonis) were performed using the vegan package of R software (v3.3.1) based on the Bray–Curtis, WUF, and UUF distance metrics with the database Silva132/16S_bacteria [26]. We processed the above data on the I-Sanger platform. One-way ANOVA performed by Graphpad Prism 8.4.2 was used to compare basic physicochemical properties, key soil enzyme activities, culturable nitrogen-fixing bacteria, the nodulation effect, and relative abundances of rhizosphere bacterial communities and COG functional classification of ZH10, Z106, and Z106G. The Tukey post hoc test was used after one-way ANOVA.

3. Results

3.1. Basic Physicochemical Properties of Rhizospheric Soil and Plants

At the flowering stage, a significant difference in rhizospheric soil pH was observed between ZH10 and Z106, but no significant difference in water content was identified between the three soybean treatments at any of the three stages, as displayed in Table 1. The rhizospheric soil carbon content differed significantly between the three treatments at the flowering stage, while the rhizospheric soil nitrogen content differed substantially at the flowering and maturing stages. The plant carbon and nitrogen content did not differ significantly across the three treatments at any of the three stages.

3.2. Key Enzyme Activities in Surrounding Soil and Rhizospheric Soil

As shown in Table 2, at the seed filling stage, S-UE in rhizospheric soil of Z106 was significantly lower than that of ZH10; however, S-NR in rhizospheric soil of Z106 was significantly higher than that of ZH10 and Z106G. At the maturing stage, the three treatments were significantly different from each other in terms of S-SC in rhizospheric soil. In the surrounding soil, ZH10, S-UE, and S-NiR were at their highest during the seed filling stage, and S-NR and S-SC were at their highest during the maturing stage. For Z106, S-UE was highest at the flowering stage, while S-NR, S-NiR, and S-SC were highest during the maturing stage. For Z106G, S-UE reached the maximum at the seed filling stage, while S-NR, S-NiR, and S-SC reached their maximum at the maturing stage. In rhizospheric soil, for ZH10, S-UE and S-NiR reached their maximum at the seed filling stage, while S-NR and S-SC reached their maximum at the maturing stage. For Z106, S-UE peaked during the flowering stage, while S-NR, S-NiR, and S-SC peaked during the maturing stage. For Z106G, S-UE and S-NiR peaked during the seed filling stage, while S-NR and S-SC peaked during the maturing stage.

3.3. Culturable Nitrogen-Fixing Bacteria and Nodulation Effect in Rhizospheric Soil

In Supplementary Figure S3A, the amount of culturable nitrogen-fixing bacteria in bulk soil of ZH10, Z106, and Z106G at pre-planting, or rhizospheric soil during flowering, seed filling, and maturing stages, did not differ significantly. During the soybean growth stages, the number of culturable nitrogen-fixing bacteria of the three soybean treatments peaked at the seed filling stage, and subsequently declined at the maturing stage.
As shown in Supplementary Figure S3B,C, the number and total weight of nodules per plant showed no significant differences between ZH10, Z106, and Z106G at the flowering, seed filling, and maturing stages. With the abscission and withering of nodules, the number and weight of nodules increased to their peak value during the seed filling stage, and then dropped to their lowest value during the maturation stage.

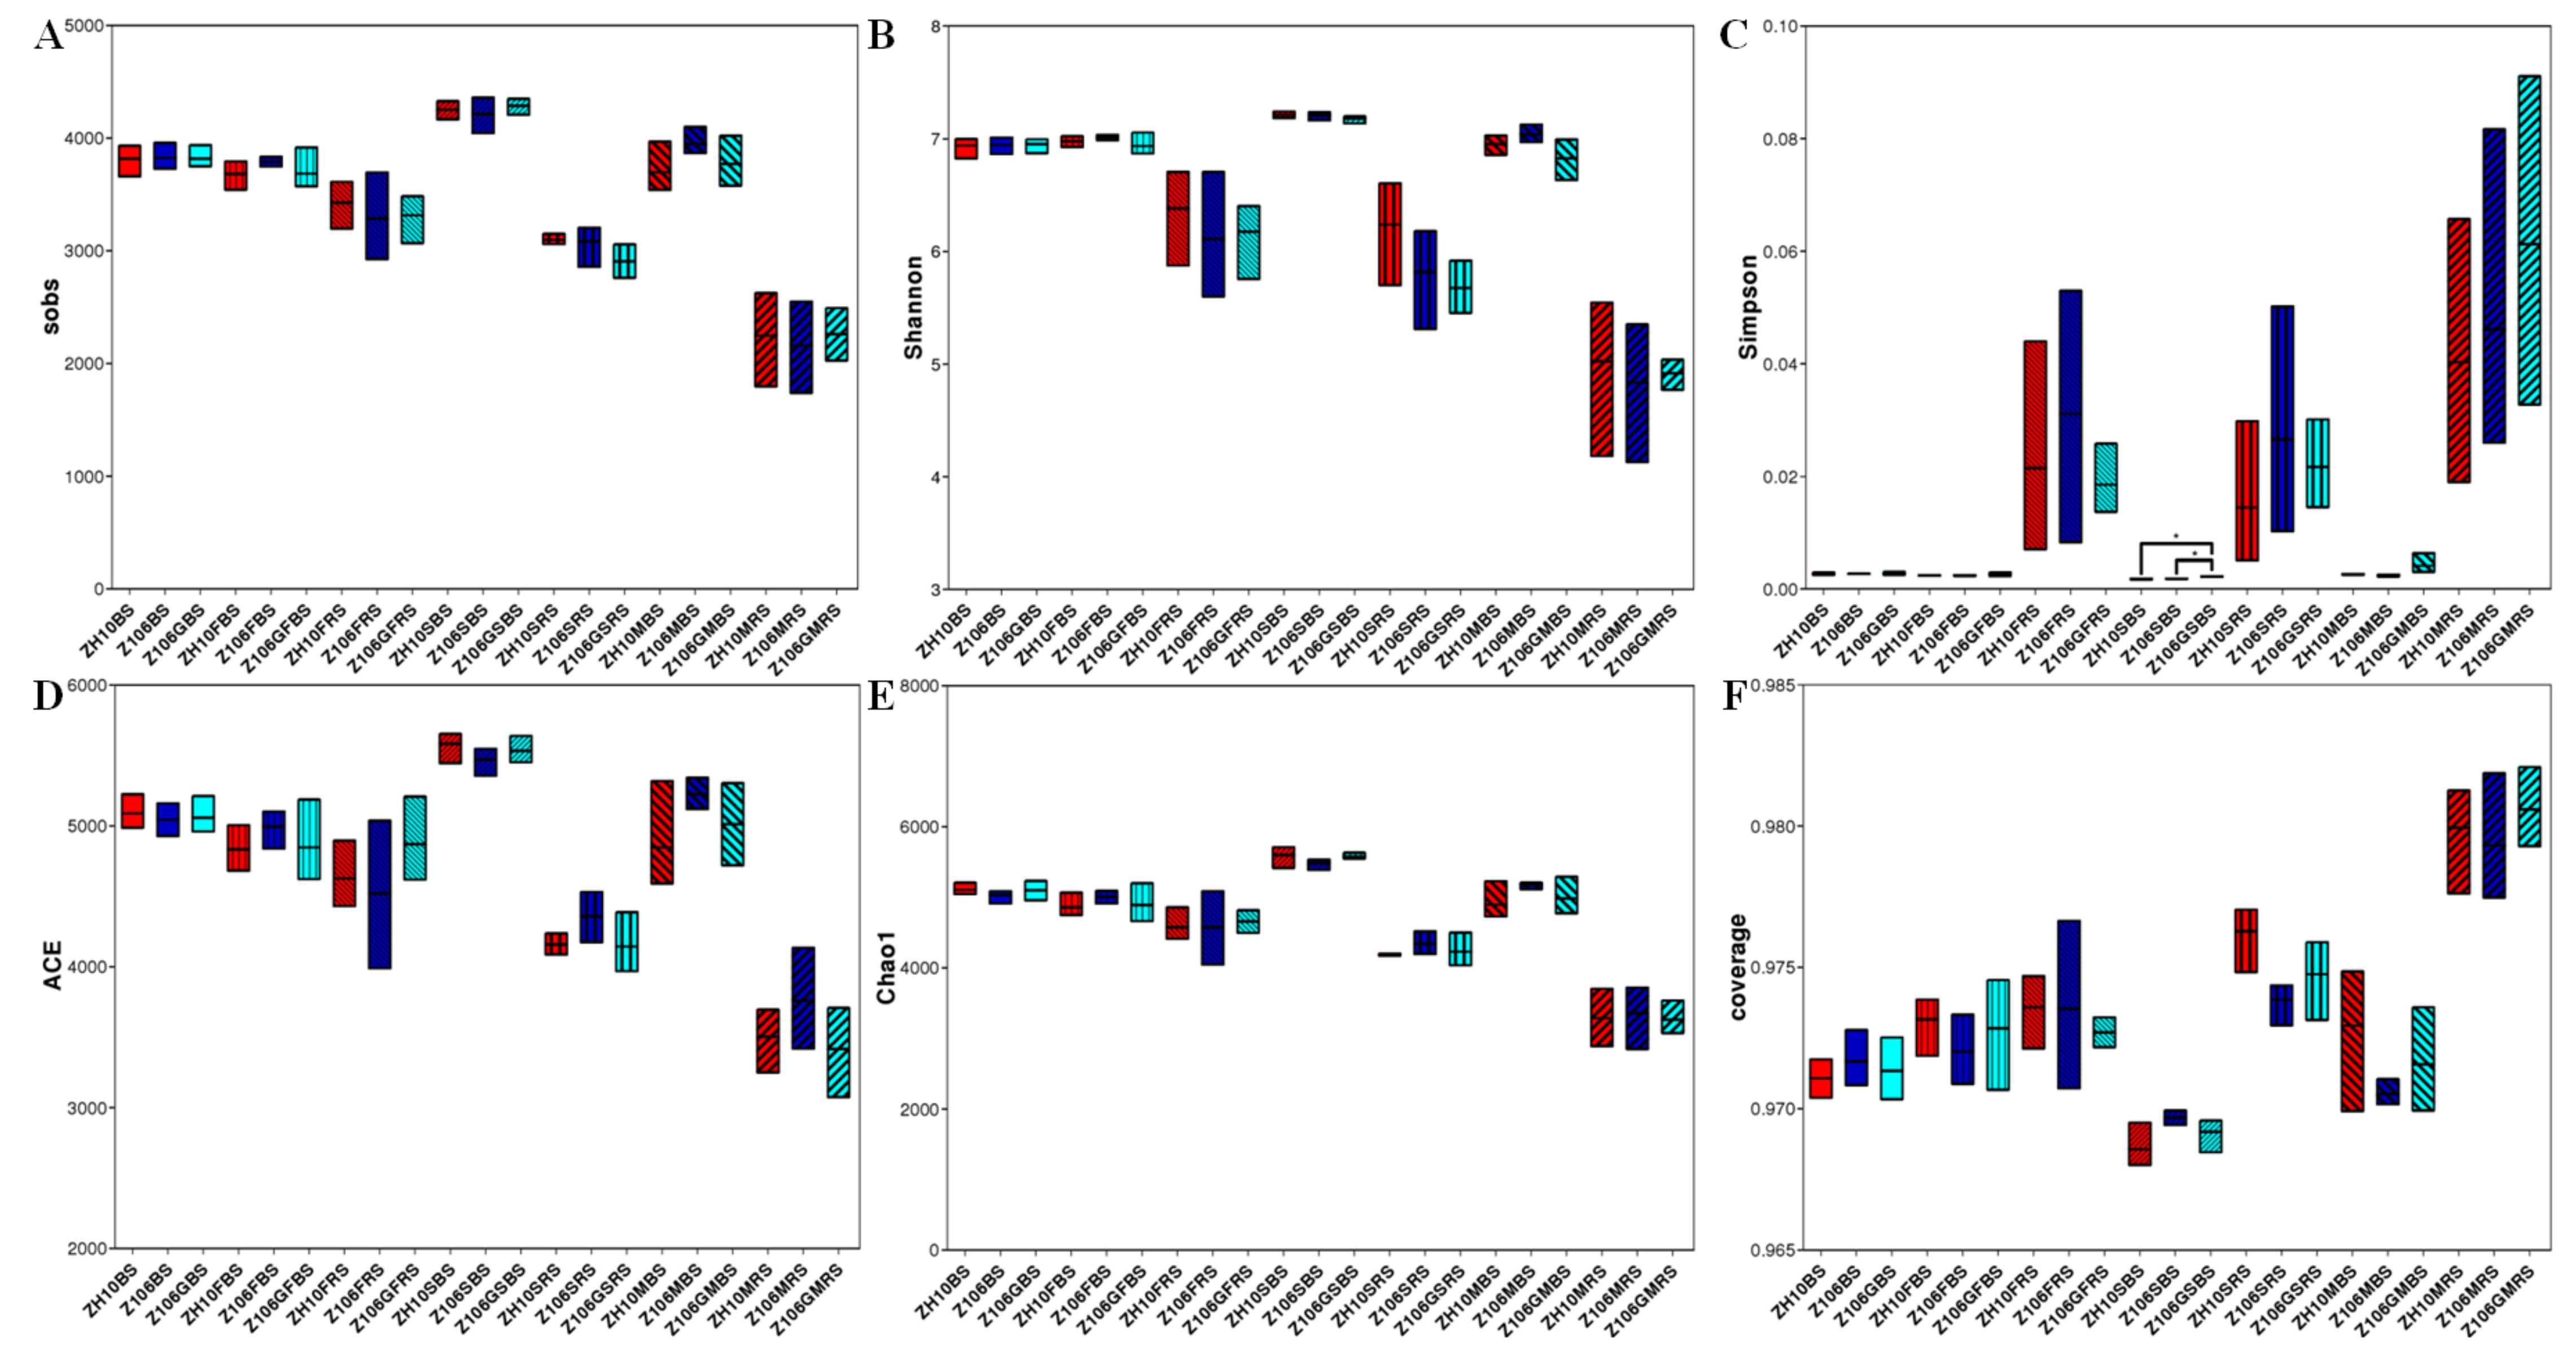
3.4. Alpha Diversity of Rhizosphere Bacterial Communities

For alpha diversity, sobs, Chao1, and ACE reflect community richness, Shannon and Simpson indices reflect community diversity, while coverage reflects community coverage (Figure 1). The Student’s t-test results reveal that, except for Simpson index in the BS samples of ZH10 and Z106G, Z106, and Z106G at the seed filling stage, no significant difference in alpha diversity was observed for different groups of the BS or RS samples between the three treatments at each of the three stages (Supplementary Table S3). Furthermore, there were some significant differences between the BS and RS samples of each treatment at each of the three stages, as well as the three stages for each sampling compartment of each treatment (Supplementary Table S3).

3.5. Beta Diversity of Rhizosphere Bacterial Communities

To investigate the similarity or differences in community structure between various samples, the beta diversity analysis was performed using PCoA based on the WUF distance matrix (Figure 2), PCA based on OTU (Supplementary Figure S4), and PLS-DA (Supplementary Figure S5). Bacterial communities in the BS or RS samples of ZH10, Z106, and Z106G were clustered into one group without obvious distinction at the flowering, seed filling, or maturing stage, indicating no marked differences between the three treatments at each of the three stages.
The statistical ANOSIM and Adonis based on the Bray–Curtis, WUF, and UUF distance metrics were then performed. The results show that the bacterial communities of ZH10, Z106, and Z106G in the same compartment at a single stage were not significantly different (Supplementary Table S4).

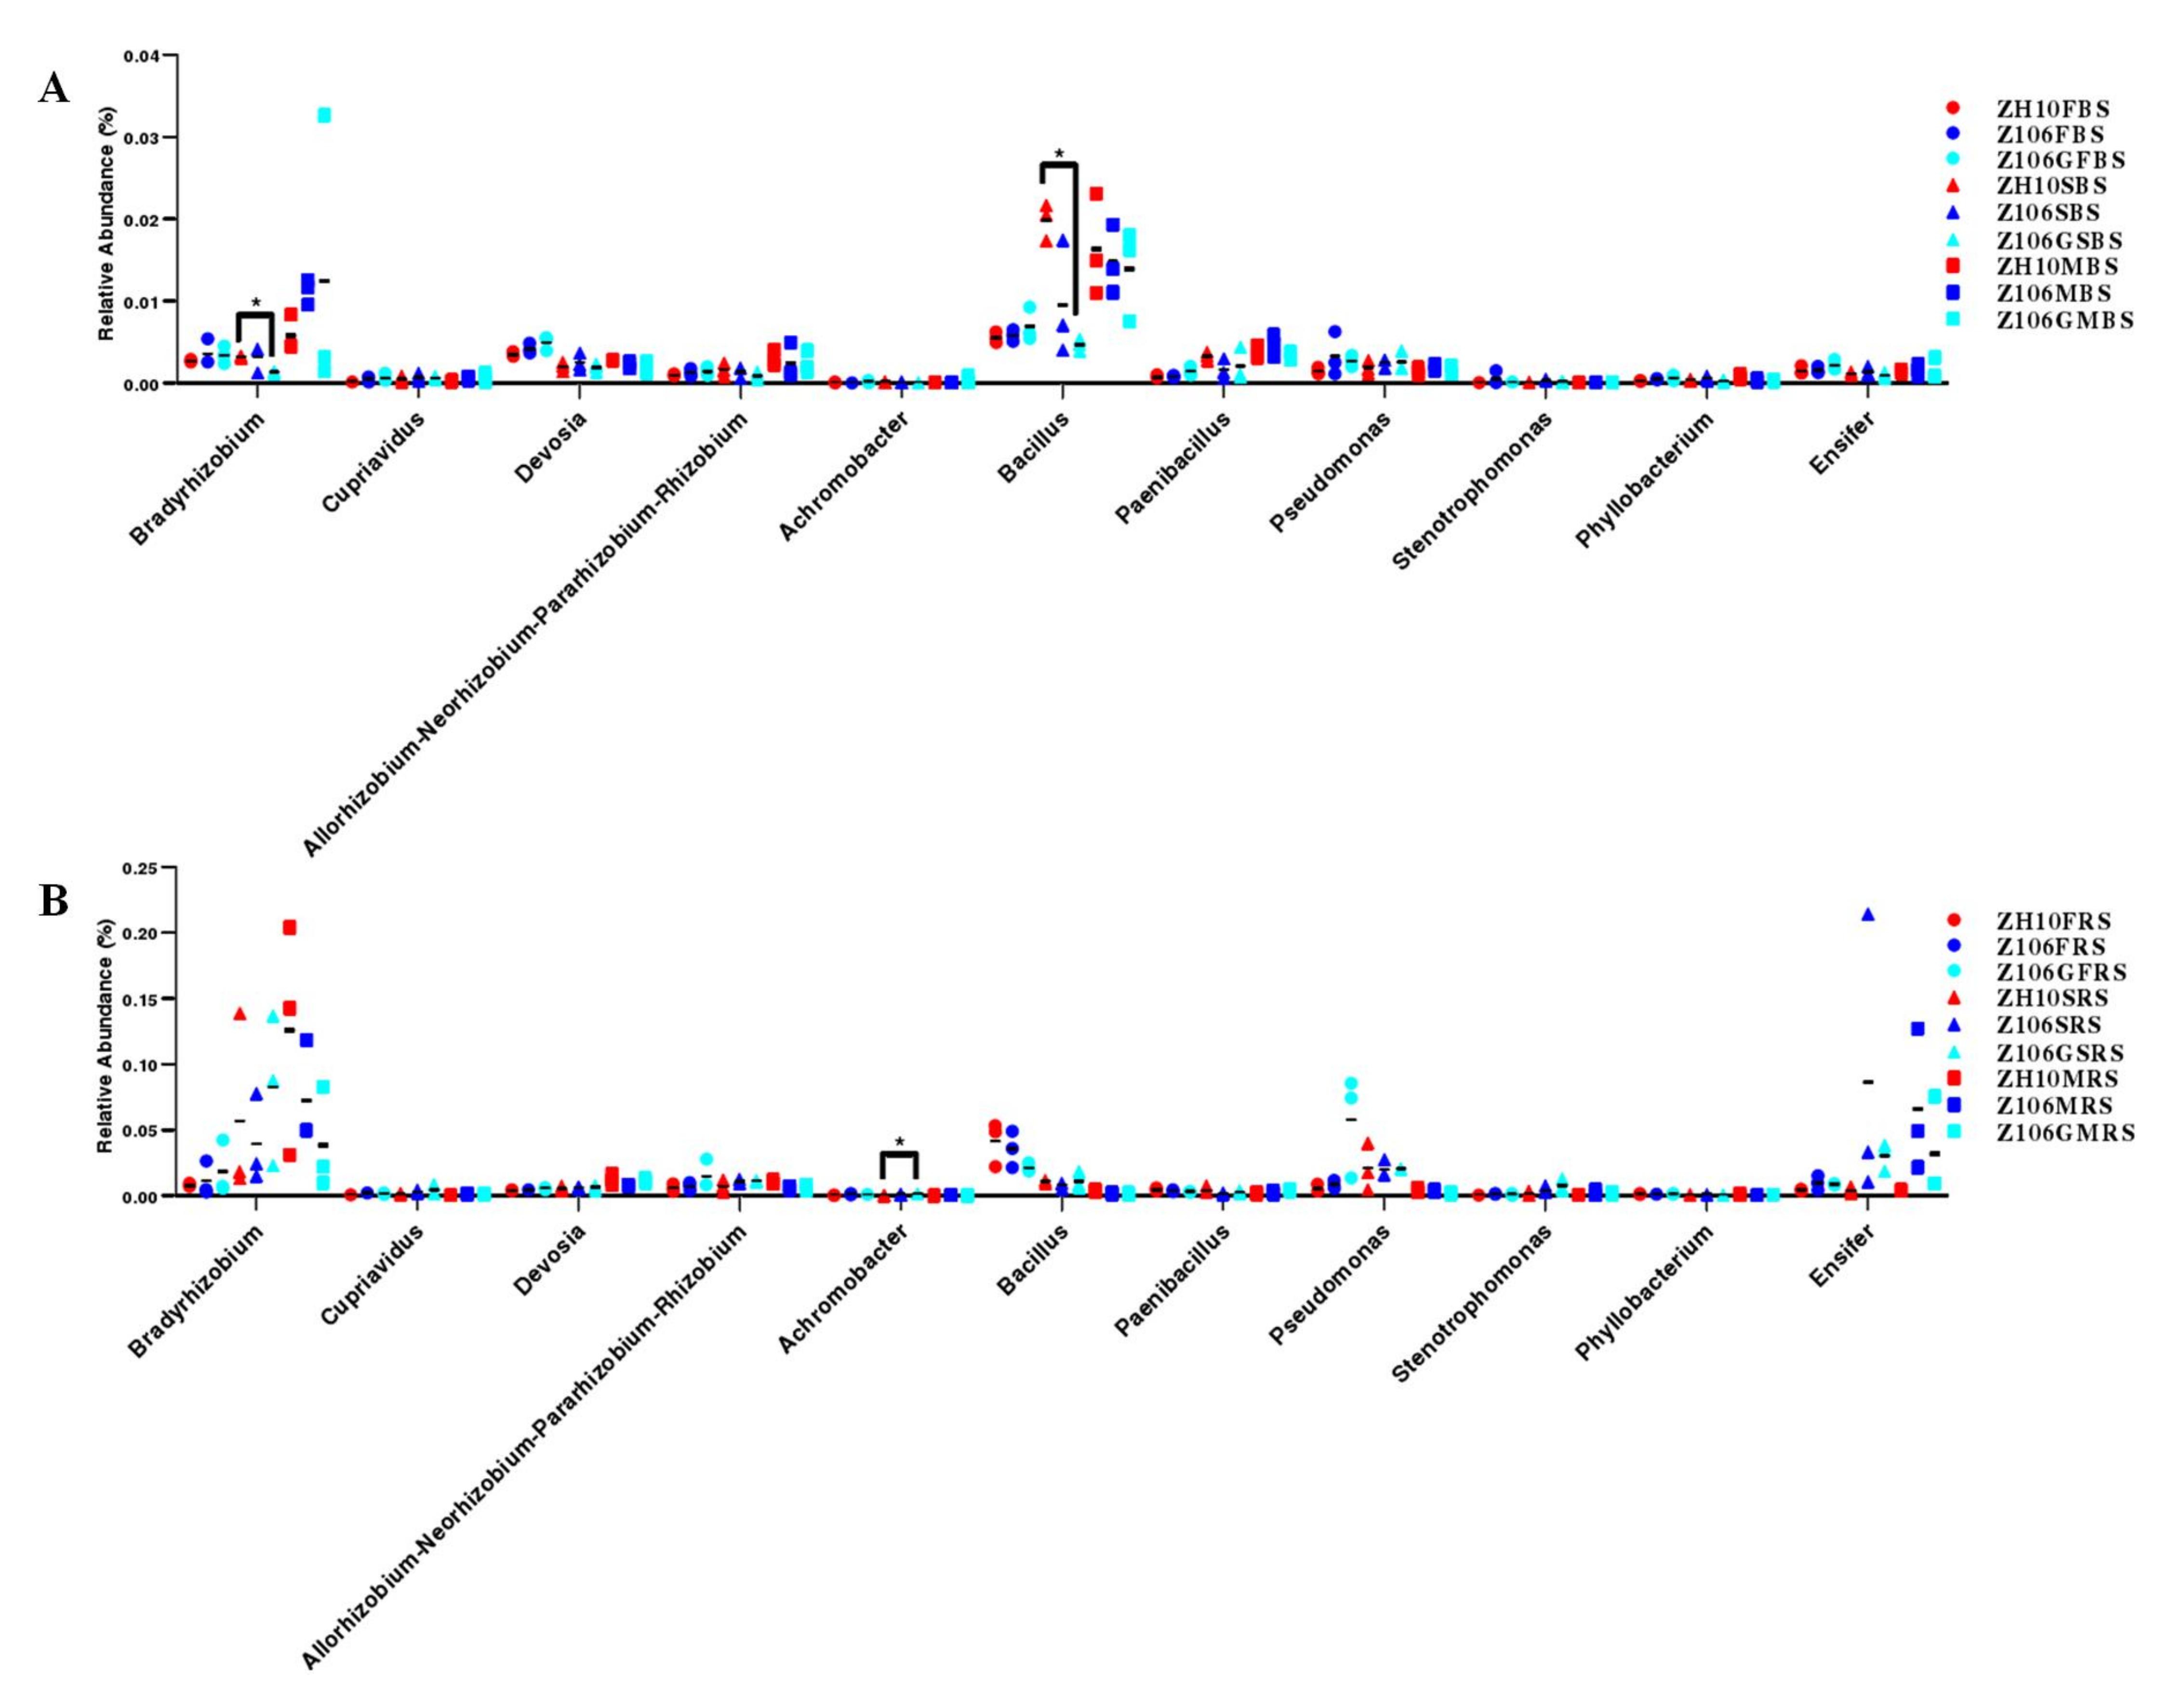
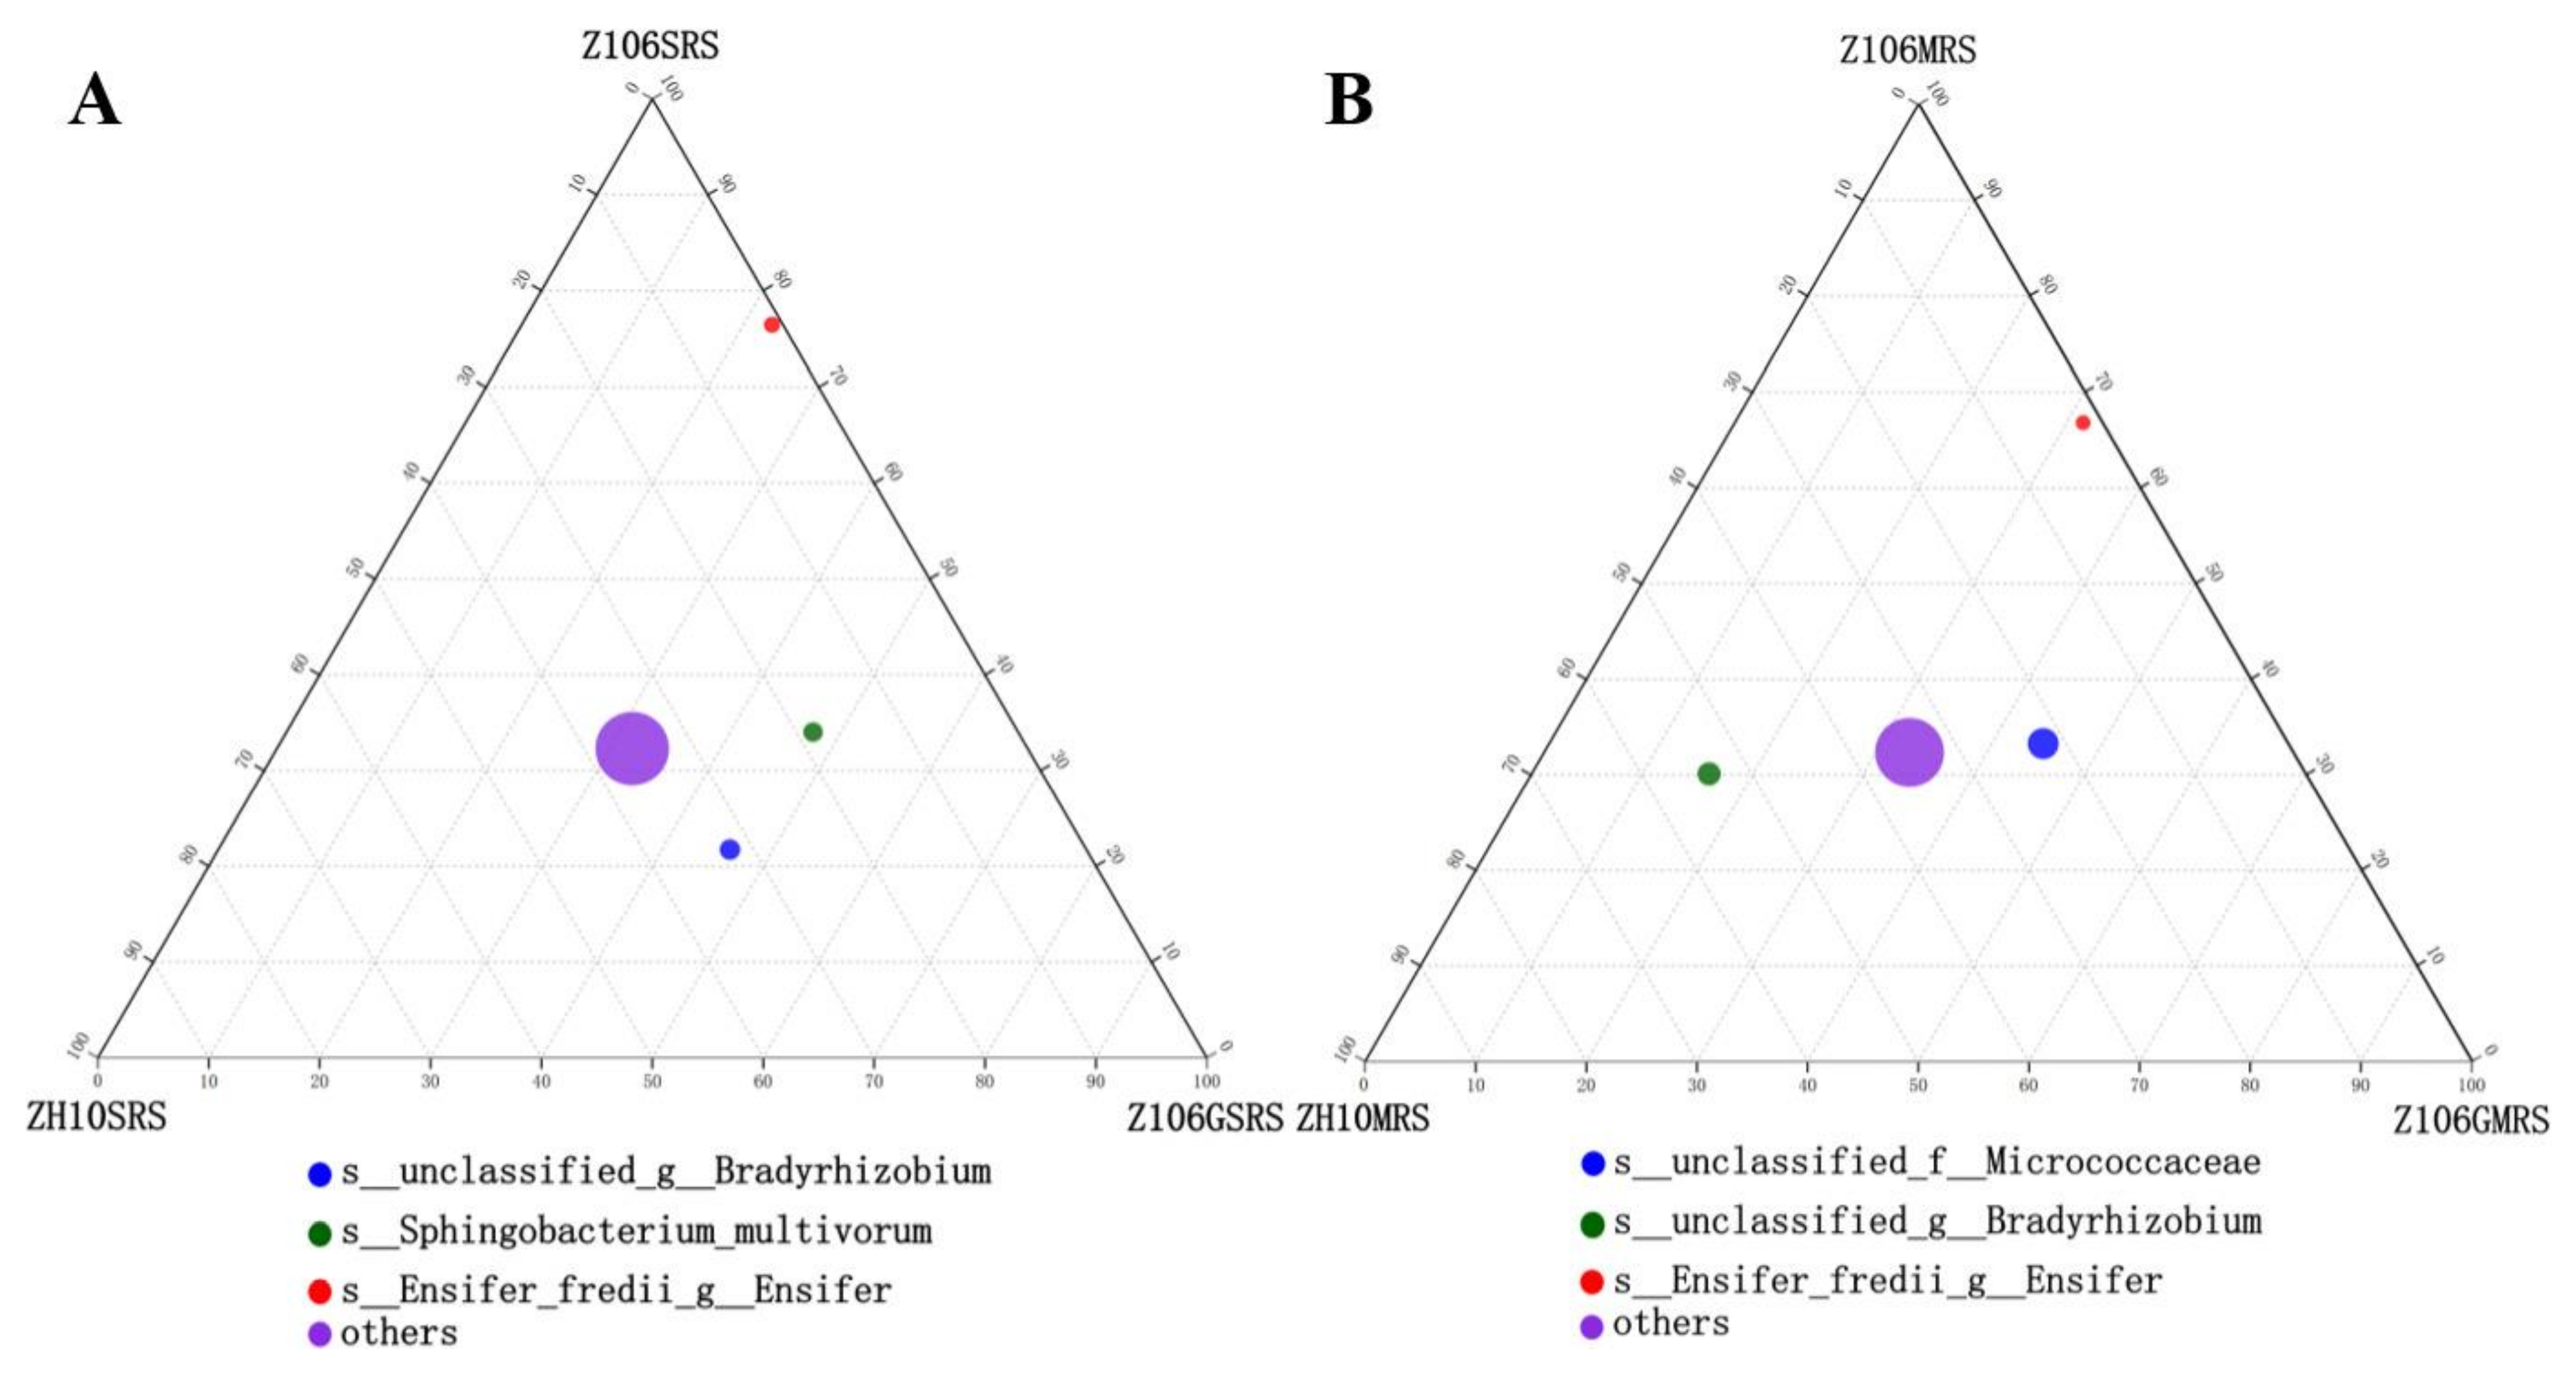
3.6. Taxonomic Analysis of Rhizosphere Bacterial Communities

During the taxonomic analysis, more than 290 classified soil bacteria species were discovered. At a taxonomic level, the barplot results show the dominant taxa in each sample as well as the relative abundance of each dominant species in all samples (Supplementary Figure S6). Then, using community heatmap analysis, we examined the relative abundances of major bacterial taxa (Supplementary Figure S7). Afterwards, the relative abundances of some major bacterial taxa were analyzed at the phylum, class, order, and family levels in the different compartments of the three treatments at each of the three stages by using one-way ANOVA (Supplementary Figure S8). The results show that the relative abundance of most taxa in BS or RS samples showed no significant differences between ZH10 and Z106, or Z106 and Z106G at the flowering, seed filling, or maturing stage. Furthermore, the comparison of the relative abundance of main nitrogen-fixing bacterial genera revealed that no genus was substantially different between ZH10 and Z106, or Z106 and Z106G at any of the three stages (Figure 3).
Since the major bacteria shown in the community heatmap at the species level were almost unclassified, the ternary plot analysis was then used to compare the species composition of three groups (Figure 4). The obtained results show that some bacterial taxa such as Ensifer (Sinorhizobium) fredii of the family Rhizobiaceae had a distinct proportional contribution in RS samples between ZH10, Z106, and Z106G. E. fredii was less abundant in ZH10 and Z106G than in Z106 at the seed filling and maturing stage, and its proportional contribution in ZH10 was clearly lower than other two treatments. At the seedling stage, the proportional contribution of Sphingobacterium multivorum, a member of the Sphingobacteriaceae family, was higher in Z106 than in ZH10, but lower in Z106G. In addition, the proportional contribution of unclassified Bradyrhizobium (genus level) at the seed filling stage, and unclassified Bradyrhizobium (genus level), and Micrococcacese (family level) at the maturing stage differed amongst the three treatments. The Circos plot was then produced to see the proportionate distribution of the nitrogen-fixing bacteria E. fredii in all 63 samples (Supplementary Figure S9), and the results are consistent with the ternary plot.

3.7. Functional Composition of Microbial Community in Soil Samples

To predict the functional composition of the microbial community in the samples, the software PICRUSt2 was utilized. As shown in Supplementary Figure S10, the functional OTUs related to amino acid transport and metabolism, translation, ribosomal structure and biogenesis, energy production and conversion, and cell wall/membrane/envelope biogenesis were expressed in higher abundances (>5,000,000) in soil samples. We focused on the relative abundance of COG functional classification related to nitrogen fixation (Supplementary Figure S11), which included COG1348, COG1433, COG2710, COG4656, COG5420, COG5456, and COG5554. The results reveal that there were no significant changes between ZH10 and Z106, or between Z106 and Z106G in the same compartment at a single stage for these COGs.

4. Discussion

The overall framework of the current study was derived from earlier research that investigated the impact of EPSPS/GAT dual transgenic glyphosate-tolerant soybean line with or without glyphosate application on root-associated microbial communities [13]. Unlike the previous study in 2015 [13], we sampled the surrounding soil and rhizospheric soil of a transgenic soybean line and its recipient cultivar during the flowering, seed filling, and maturing stages, and the V3–V4 hypervariable regions of 16S rDNA amplicons were sequenced, which may allow us to observe dominant species in soil samples more accurately. In this study, we looked at the differences between ZH10 and Z106, or between Z106 and Z106G, to assess the potential impact of planting the EPSPS/GAT transgenic soybean line and using a glyphosate-based herbicide on soil ecology and biosafety in modern sustainable agriculture. Furthermore, since the recipient line ZH10 was unable to tolerate glyphosate, we did not treat the recipient soybean with glyphosate.
For the analysis of the basic physicochemical properties of soils and plants, the pH value, carbon content, and nitrogen content in rhizospheric soil showed some significant differences between the three treatments, as well as some key enzymes of the nitrogen cycle and carbon cycle in rhizospheric soil at the three stages. The results reveal that the planting of a dual-gene transgenic soybean line and glyphosate application may have an impact on the rhizospheric soil. However, as shown in Supplementary Figure S3, neither the planting of dual-gene transgenic soybean lines nor the application of glyphosate had an effect on the number of culturable nitrogen-fixing bacteria or the nodulation effect in rhizospheric soil between the three soybean treatments at each stage. This indicates that the above-mentioned considerable variation was insufficient to influence soybean’s ability to fix nitrogen. Additionally, the nitrogen content of each treatment’s plant did not alter during the crop stages, which is generally variable during soybean growth [36]. This outcome could be due to a variety of external factors or the characteristics of particular soybean lines, which will be investigated further in our future study.
As proved by Yang et al. and Han et al., Bradyrhizobium and Ensifer are the two main genera of soybean microsymbionts in China [37,38]. In our study, the relative abundances of these two genera were not significantly different between the three treatments at each of the three stages, which was consistent with no differences in nodulation effect in the rhizospheric soil in this study. These results indicate that neither planting the EPSPS/GAT transgenic soybean line nor using glyphosate-based herbicide significantly changed the structure of rhizosphere microbial communities, which is in accordance with earlier research [13,39].
According to the ternary plot analysis, the proportional contribution of several soil bacterial taxa was variable. As shown in Figure 4, the proportional contribution of E. fredii was higher in RS samples of Z106 than that of ZH10 and Z106G at the seed filling and maturing stages. E. fredii is reported as a common fast-growing agricultural rhizobia, originally isolated from Chinese soil, with a diverse host range and biological nitrogen-fixing capacity [31,40]. In alkaline soils, E. fredii can form nitrogen-fixing root nodules in 79 different legume genera, including soybean [41,42]. At present, the nitrogen fixation capabilities of this rhizobium are gradually being studied and improved, and will bring great benefits to agriculture by reducing the reliance on fertilizer applications [43].
According to the Circos plot results (Supplementary Figure S9), the proportional contribution of E. fredii in the rhizospheric soil increased first and then decreased, peaking at the seed filling stage, which is consistent with the results of culturable nitrogen-fixing bacteria and the nodulation effect in the rhizospheric soil. The proportional contribution of E. fredii in rhizospheric soil in the three soybean treatments at the three growth stages was highest in Z106, followed by Z106G, and was lowest in ZH10. Such results were not observed in our prior study of the 16S V4 region sequencing with three sampling compartments: surrounding soil, rhizospheric soil, and root [13], most likely due to deeper amplicon sequencing and a reduction in sampling compartments. This phenomenon implies that the enrichment of this rhizobia was aided by planting the EPSPS/GAT dual transgenic line and hindered by glyphosate application in rhizospheric soil during the soybean growth stages, and that these changes were regulated by gene expression, root exudation, and the potential biological toxicity of glyphosate herbicide [44,45]. Interestingly, the proportional contribution of E. fredii in Z106G was lower than Z106, but still higher than that of ZH10; the reason for this needs to be investigated further and confirmed by more advanced sequencing technologies, such as full-length 16S rRNA amplicon or metagenome sequencing, which can avoid relic DNA interference [46].
Previous research has revealed that rhizosphere microbes can enrich specific functional genes [47]. We compared the COG function classification and its relative abundance using PICRUSt2. As shown in Supplementary Figure S11, the seven COGs were found to be directly related to nitrogen fixation, including COG1348, which is related to the key enzymatic reactions in nitrogen fixation catalyzed by the nitrogenase complex, which has two components, the iron protein and the molybdenum–iron protein (by similarity), COG1433 related to dinitrogenase iron–molybdenum cofactor biosynthesis protein, COG2710 related to nitrogenase, COG4656 related to the requirement for nitrogen fixation and that may be part of a membrane complex that functions as an intermediate in the electron transport to nitrogenase (by similarity), COG5420 related to nitrogen fixation, COG5456 related to nitrogen fixation protein FixH, and COG5554 related to nitrogen fixation protein. The relative abundances of these COGs showed that either planting the EPSPS/GAT transgenic soybean line or employing glyphosate had no impact on these functional genes.
In conclusion, our results demonstrate that a single planting season of an EPSPS/GAT dual transgenic glyphosate-tolerant soybean line with or without glyphosate application had no significant impact on bacterial communities and the nodulation effect in the rhizosphere. However, the physicochemical properties of rhizospheric soil and the proportional contribution of the nitrogen-fixing bacteria E. fredii responded differently to planting the EPSPS/GAT dual-gene transgenic line and glyphosate application. In general, the current study will aid future researchers to develop field studies to evaluate the biosafety of transgenic soybeans and herbicide application.

Supplementary Materials

The following are available online at https://www.mdpi.com/article/10.3390/horticulturae7100374/s1, Figure S1: Rank–abundance curves of all 63 samples, Figure S2: Pan-Core analysis of all samples, Figure S3: A, culturable nitrogen-fixing bacteria among the rhizospheric soil of ZH10, Z106 and Z106G at pre-planting, flowering, seed filling and maturing stages; B & C, number and weight of nodules at flowering, seed filling and maturing stages, Figure S4: PCA based on OTU abundance of bacterial communities, Figure S5: PLS-DA on OTU level at flowering (A), seed-filling (B) and maturing (C) stages, Figure S6: Community bar plot analysis of all samples, Figure S7: Community heatmap at Phylum (A), Class (B), Order (C), Family (D), Genus (E) and Species (F) levels, Figure S8: The relative abundance of the major bacterial taxa in surrounding soil and rhizospheric soil at Phylum (A,B), Class (C,D), Order (E,F), or Family (G,H) levels, Figure S9: Circos plot for Ensifer fredii at Species level, Figure S10: COG functional prediction, Figure S11: Statistics of COG function classification related to nitrogen fixation, Table S1: Names of all 63 soil samples, Table S2: Summary of sequencing data of all samples, Table S3: p-values of six indices for alpha diversity of the different compartment samples between ZH10, Z106, and Z106G according to Student’s t-test, Table S4: ANOSIM and Adonis of the different compartment samples between ZH10, Z106, and Z106G based on the Bray–Curtis, Weighted Unifrac and Unweighted Unifrac distance metrics.

Author Contributions

Conceptualization, Y.Y., G.L., Z.H. and M.Y.; methodology, M.Y. and Z.W.; software, M.Y. and Z.W.; validation, Z.W. and C.H.; formal analysis, M.Y. and F.L.; investigation, M.Y. and W.Y.; resources, T.Y., G.L. and R.Y.; data curation, M.Y., Z.W. and Y.L.; writing—original draft preparation, M.Y., Z.W. and C.H.; writing—review and editing, Y.Y., A.F. and J.Q.; visualization, M.Y. and Z.W.; supervision, Y.Y., Z.H. and G.L.; project administration, Y.Y. and Z.H. All authors have read and agreed to the published version of the manuscript.

Funding

This work was funded by the National Important Science & Technology Specific Project (2016ZX08011-003), the National Natural Science Foundation of China (31870495, 31372140), and the MOE Program for Changjiang Scholars and Innovative Research Team at the University of China (IRT_14R27).

Institutional Review Board Statement

Not applicable.

Informed Consent Statement

Not applicable.

Data Availability Statement

The sequencing clean data of 63 samples have been submitted to the Sequence Read Archive (SRA) with the accession number PRJNA734728.

Acknowledgments

We are particularly grateful to Longguo Jin and Lijuan Qiu at the Institute of Crop Sciences, the Chinese Academy of Agricultural Sciences (CAAS), for providing soybean seeds of the GM line Z106 and its control cultivar ZH10, who belonged to the participating units in the National Important Science & Technology Specific Project (2016ZX08011).

Conflicts of Interest

The authors declare no conflict of interest.

References

  1. Brookes, G.; Barfoot, P. GM crop technology use 1996–2018: Farm income and production impacts. GM Crop. Food 2020, 11, 242–261. [Google Scholar] [CrossRef] [PubMed]
  2. Brookes, G. Genetically modified (GM) crop use in Colombia: Farm level economic and environmental contributions. GM Crop. Food 2020, 11, 140–153. [Google Scholar] [CrossRef] [PubMed]
  3. ISAAA. Global Status of Commercialized Biotech/GM Crops in 2018: Biotech Crops Continue to Help Meet the Challenges of Increased Population and Climate Change. 2019. Available online: https://www.isaaa.org/resources/publications/briefs/54/default.asp (accessed on 30 March 2021).
  4. Feng, J.; Yang, F. The Regulation of Genetically Modified Food in China. Biotechnol. Law Rep. 2019, 38, 289–293. [Google Scholar] [CrossRef]
  5. Arpaia, S.; Christiaens, O.; Giddings, K.; Jones, H.; Mezzetti, B.; Moronta-Barrios, F.; Perry, J.N.; Sweet, J.B.; Taning, C.N.T.; Smagghe, G.; et al. Biosafety of GM Crop Plants Expressing dsRNA: Data Requirements and EU Regulatory Considerations. Front. Plant Sci. 2020, 11, 940. [Google Scholar] [CrossRef]
  6. Brookes, G.; Barfoot, P. Environmental impacts of genetically modified (GM) crop use 1996–2018: Impacts on pesticide use and carbon emissions. GM Crop. Food 2020, 11, 215–241. [Google Scholar] [CrossRef] [PubMed]
  7. Mertens, M.; Hoss, S.; Neumann, G.; Afzal, J.; Reichenbecher, W. Glyphosate, a chelating agent-relevant for ecological risk assessment? Environ. Sci. Pollut. Res. Int. 2018, 25, 5298–5317. [Google Scholar] [CrossRef] [Green Version]
  8. Landrigan, P.J.; Belpoggi, F. The need for independent research on the health effects of glyphosate-based herbicides. Environ. Health 2018, 17, 51. [Google Scholar] [CrossRef]
  9. Herman, R.A.; Ekmay, R.D.; Schafer, B.W.; Song, P.; Fast, B.J.; Papineni, S.; Shan, G.; Juberg, D.R. Food and feed safety of DAS-444O6-6 herbicide-tolerant soybean. Regul. Toxicol. Pharmacol. 2018, 94, 70–74. [Google Scholar] [CrossRef]
  10. Stenoien, C.; Nail, K.R.; Zalucki, J.M.; Parry, H.; Oberhauser, K.S.; Zalucki, M.P. Monarchs in decline: A collateral landscape-level effect of modern agriculture. Insect Sci. 2018, 25, 528–541. [Google Scholar] [CrossRef]
  11. Hoagland, R.E.; Duke, S.O. Biochemical Effects Of Glyphosate [N-(Phosphonomethyl)Glycine]. ACS Symp. Ser. 1982, 181, 175–205. [Google Scholar]
  12. Gomes, M.P.; Smedbol, E.; Chalifour, A.; Henault-Ethier, L.; Labrecque, M.; Lepage, L.; Lucotte, M.; Juneau, P. Alteration of plant physiology by glyphosate and its by-product aminomethylphosphonic acid: An overview. J. Exp. Bot. 2014, 65, 4691–4703. [Google Scholar] [CrossRef] [Green Version]
  13. Yang, M.; Wen, Z.; Fazal, A.; Hua, X.; Xu, X.; Yin, T.; Qi, J.; Yang, R.; Lu, G.; Hong, Z.; et al. Impact of a G2-EPSPS & GAT Dual Transgenic Glyphosate-Resistant Soybean Line on the Soil Microbial Community under Field Conditions Affected by Glyphosate Application. Microbes Environ. 2020, 35, ME20056. [Google Scholar] [CrossRef]
  14. Duke, S.O.; Powles, S.B. Glyphosate: A once-in-a-century herbicide. Pest Manag. Sci. 2008, 64, 319–325. [Google Scholar] [CrossRef] [PubMed]
  15. Guo, B.; Guo, Y.; Hong, H.; Jin, L.; Zhang, L.; Chang, R.Z.; Lu, W.; Lin, M.; Qiu, L.J. Co-expression of G2-EPSPS and glyphosate acetyltransferase GAT genes conferring high tolerance to glyphosate in soybean. Front. Plant Sci. 2015, 6, 847. [Google Scholar] [CrossRef] [Green Version]
  16. Castle, L.A.; Siehl, D.L.; Gorton, R.; Patten, P.A.; Chen, Y.H.; Bertain, S.; Cho, H.J.; Duck, N.; Wong, J.; Liu, D.; et al. Discovery and directed evolution of a glyphosate tolerance gene. Science 2004, 304, 1151–1154. [Google Scholar] [CrossRef] [PubMed] [Green Version]
  17. Schmalenberger, A.; Schwieger, F.; Tebbe, C.C. Effect of primers hybridizing to different evolutionarily conserved regions of the small-subunit rRNA gene in PCR-based microbial community analyses and genetic profiling. Appl. Environ. Microbiol. 2001, 67, 3557–3563. [Google Scholar] [CrossRef] [PubMed] [Green Version]
  18. Beckers, B.; Op De Beeck, M.; Thijs, S.; Truyens, S.; Weyens, N.; Boerjan, W.; Vangronsveld, J. Performance of 16s rDNA Primer Pairs in the Study of Rhizosphere and Endosphere Bacterial Microbiomes in Metabarcoding Studies. Front. Microbiol. 2016, 7, 650. [Google Scholar] [CrossRef] [PubMed] [Green Version]
  19. Joshi, S.; Jaggi, V.; Gangola, S.; Singh, A.; Sah, V.K.; Sahgal, M. Contrasting rhizosphere bacterial communities of healthy and wilted Dalbergia sissoo Roxb. forests. Rhizosphere 2021, 17, 100295. [Google Scholar] [CrossRef]
  20. Guo, B.; Guo, Y.; Hong, H.; Qiu, L.J. Identification of Genomic Insertion and Flanking Sequence of G2-EPSPS and GAT Transgenes in Soybean Using Whole Genome Sequencing Method. Front Plant Sci. 2016, 7, 1009. [Google Scholar] [CrossRef] [Green Version]
  21. Lu, G.H.; Hua, X.M.; Cheng, J.; Zhu, Y.L.; Wang, G.H.; Pang, Y.J.; Yang, R.W.; Zhang, L.; Shou, H.X.; Wang, X.M.; et al. Impact of Glyphosate on the Rhizosphere Microbial Communities of An EPSPS-Transgenic Soybean Line ZUTS31 by Metagenome Sequencing. Curr. Genom. 2018, 19, 36–49. [Google Scholar] [CrossRef]
  22. Lu, G.H.; Tang, C.Y.; Hua, X.M.; Cheng, J.; Wang, G.H.; Zhu, Y.L.; Zhang, L.Y.; Shou, H.X.; Qi, J.L.; Yang, Y.H. Effects of an EPSPS-transgenic soybean line ZUTS31 on root-associated bacterial communities during field growth. PLoS ONE 2018, 13, e0192008. [Google Scholar] [CrossRef] [PubMed] [Green Version]
  23. Lu, G.H.; Zhu, Y.L.; Kong, L.R.; Cheng, J.; Tang, C.Y.; Hua, X.M.; Meng, F.F.; Pang, Y.J.; Yang, R.W.; Qi, J.L.; et al. Impact of a Glyphosate-Tolerant Soybean Line on the Rhizobacteria, Revealed by Illumina MiSeq. J. Microbiol. Biotechnol. 2017, 27, 561–572. [Google Scholar] [CrossRef] [PubMed] [Green Version]
  24. Inceoglu, O.; Salles, J.F.; van Overbeek, L.; van Elsas, J.D. Effects of plant genotype and growth stage on the betaproteobacterial communities associated with different potato cultivars in two fields. Appl. Environ. Microbiol. 2010, 76, 3675–3684. [Google Scholar] [CrossRef] [PubMed] [Green Version]
  25. Caporaso, J.G.; Kuczynski, J.; Stombaugh, J.; Bittinger, K.; Bushman, F.D.; Costello, E.K.; Fierer, N.; Pena, A.G.; Goodrich, J.K.; Gordon, J.I.; et al. QIIME allows analysis of high-throughput community sequencing data. Nat. Methods 2010, 7, 335–336. [Google Scholar] [CrossRef] [PubMed] [Green Version]
  26. Wen, Z.L.; Yang, M.K.; Du, M.H.; Zhong, Z.Z.; Lu, Y.T.; Wang, G.H.; Hua, X.M.; Fazal, A.; Mu, C.H.; Yan, S.F.; et al. Enrichments/Derichments of Root-Associated Bacteria Related to Plant Growth and Nutrition Caused by the Growth of an EPSPS-Transgenic Maize Line in the Field. Front. Microbiol. 2019, 10, 1335. [Google Scholar] [CrossRef] [PubMed]
  27. Edgar, R.C. UPARSE: Highly accurate OTU sequences from microbial amplicon reads. Nat. Methods 2013, 10, 996–998. [Google Scholar] [CrossRef]
  28. Bulgarelli, D.; Rott, M.; Schlaeppi, K.; Ver Loren van Themaat, E.; Ahmadinejad, N.; Assenza, F.; Rauf, P.; Huettel, B.; Reinhardt, R.; Schmelzer, E.; et al. Revealing structure and assembly cues for Arabidopsis root-inhabiting bacterial microbiota. Nature 2012, 488, 91–95. [Google Scholar] [CrossRef]
  29. Lundberg, D.S.; Lebeis, S.L.; Paredes, S.H.; Yourstone, S.; Gehring, J.; Malfatti, S.; Tremblay, J.; Engelbrektson, A.; Kunin, V.; Del Rio, T.G.; et al. Defining the core Arabidopsis thaliana root microbiome. Nature 2012, 488, 86–90. [Google Scholar] [CrossRef] [Green Version]
  30. Schloss, P.D.; Westcott, S.L.; Ryabin, T.; Hall, J.R.; Hartmann, M.; Hollister, E.B.; Lesniewski, R.A.; Oakley, B.B.; Parks, D.H.; Robinson, C.J.; et al. Introducing mothur: Open-source, platform-independent, community-supported software for describing and comparing microbial communities. Appl. Environ. Microbiol. 2009, 75, 7537–7541. [Google Scholar] [CrossRef] [Green Version]
  31. Faraway, J.J. Backscoring in Principal Coordinates Analysis. J. Comput. Graph. Stat. 2012, 21, 394–412. [Google Scholar] [CrossRef] [Green Version]
  32. Rohart, F.; Gautier, B.; Singh, A.; Le Cao, K.A. mixOmics: An R package for ‘omics feature selection and multiple data integration. PLoS Comput. Biol. 2017, 13, e1005752. [Google Scholar] [CrossRef] [Green Version]
  33. Hamilton, N.E.; Ferry, M. ggtern: Ternary Diagrams Using ggplot2. J. Stat. Softw. 2018, 87, 1–17. [Google Scholar] [CrossRef] [Green Version]
  34. Sui, Q.; Liu, C.; Zhang, J.; Dong, H.; Zhu, Z.; Wang, Y. Response of nitrite accumulation and microbial community to free ammonia and dissolved oxygen treatment of high ammonium wastewater. Appl. Microbiol. Biotechnol. 2016, 100, 4177–4187. [Google Scholar] [CrossRef] [PubMed]
  35. Langille, M.G.; Zaneveld, J.; Caporaso, J.G.; McDonald, D.; Knights, D.; Reyes, J.A.; Clemente, J.C.; Burkepile, D.E.; Vega Thurber, R.L.; Knight, R.; et al. Predictive functional profiling of microbial communities using 16S rRNA marker gene sequences. Nat. Biotechnol. 2013, 31, 814–821. [Google Scholar] [CrossRef]
  36. de Luca, M.J.; Hungria, M. Plant densities and modulation of symbiotic nitrogen fixation in soybean. Sci. Agric. 2014, 71, 181–187. [Google Scholar] [CrossRef] [Green Version]
  37. Yang, S.H.; Chen, W.H.; Wang, E.T.; Chen, W.F.; Yan, J.; Han, X.Z.; Tian, C.F.; Sui, X.H.; Singh, R.P.; Jiang, G.M.; et al. Rhizobial biogeography and inoculation application to soybean in four regions across China. J. Appl. Microbiol. 2018, 125, 853–866. [Google Scholar] [CrossRef]
  38. Han, Q.; Ma, Q.; Chen, Y.; Tian, B.; Xu, L.; Bai, Y.; Chen, W.; Li, X. Variation in rhizosphere microbial communities and its association with the symbiotic efficiency of rhizobia in soybean. ISME J. 2020, 14, 1915–1928. [Google Scholar] [CrossRef] [Green Version]
  39. Lane, M.; Lorenz, N.; Saxena, J.; Ramsier, C.; Dick, R.P. Microbial activity, community structure and potassium dynamics in rhizosphere soil of soybean plants treated with glyphosate. Pedobiologia 2012, 55, 153–159. [Google Scholar] [CrossRef]
  40. Albareda, M.; Rodriguez-Navarro, D.N.; Temprano, F.J. Use of Sinorhizobium (Ensifer) fredii for soybean inoculants in South Spain. Eur. J. Agron. 2009, 30, 205–211. [Google Scholar] [CrossRef]
  41. Krishnan, H.B. NolX of Sinorhizobium fredii USDA257, a type III-secreted protein involved in host range determination, Iis localized in the infection threads of cowpea (Vigna unguiculata [L.] Walp) and soybean (Glycine max [L.] Merr.) nodules. J. Bacteriol. 2002, 184, 831–839. [Google Scholar] [CrossRef] [Green Version]
  42. Temprano-Vera, F.; Rodriguez-Navarro, D.N.; Acosta-Jurado, S.; Perret, X.; Fossou, R.K.; Navarro-Gomez, P.; Zhen, T.; Yu, D.; An, Q.; Buendia-Claveria, A.M.; et al. Sinorhizobium fredii Strains HH103 and NGR234 Form Nitrogen Fixing Nodules With Diverse Wild Soybeans (Glycine soja) From Central China but Are Ineffective on Northern China Accessions. Front. Microbiol. 2018, 9, 2843. [Google Scholar] [CrossRef] [PubMed]
  43. Contador, C.A.; Lo, S.K.; Chan, S.H.J.; Lam, H.M. Metabolic Analyses of Nitrogen Fixation in the Soybean Microsymbiont Sinorhizobium fredii Using Constraint-Based Modeling. mSystems 2020, 5, e00516-19. [Google Scholar] [CrossRef] [Green Version]
  44. Canarini, A.; Kaiser, C.; Merchant, A.; Richter, A.; Wanek, W. Root Exudation of Primary Metabolites: Mechanisms and Their Roles in Plant Responses to Environmental Stimuli. Front. Plant Sci. 2019, 10, 157. [Google Scholar] [CrossRef] [Green Version]
  45. Meena, R.S.; Kumar, S.; Datta, R.; Lal, R.; Vijayakumar, V.; Brtnicky, M.; Sharma, M.P.; Yadav, G.S.; Jhariya, M.K.; Jangir, C.K.; et al. Impact of Agrochemicals on Soil Microbiota and Management: A Review. Land 2020, 9, 34. [Google Scholar] [CrossRef] [Green Version]
  46. Carini, P.; Marsden, P.J.; Leff, J.; Morgan, E.E.; Strickland, M.S.; Fierer, N. Relic DNA is abundant in soil and obscures estimates of soil microbial diversity. Nat. Microbiol. 2017, 2, 16242. [Google Scholar] [CrossRef] [PubMed]
  47. Yan, Y.; Kuramae, E.E.; de Hollander, M.; Klinkhamer, P.G.; van Veen, J.A. Functional traits dominate the diversity-related selection of bacterial communities in the rhizosphere. ISME J. 2017, 11, 56–66. [Google Scholar] [CrossRef] [Green Version]
Figure 1. Boxplot of alpha diversity between three treatments. (A) Sobs index; (B) Shannon index; (C) Simpson index; (D) ACE index; (E) Chao1 index; (F) coverage index. Z106 (deep blue) and ZH10 (red) represent transgenic soybean ZH10−6 and its recipient cultivar Zhonghuang 10. Z106G (light blue) represents Z106 treated with glyphosate. F, S, and M represent the flowering, seed filling, and maturing stages, respectively. BS and RS represent surrounding soil and rhizospheric soil; BS without marked growth stages represents soil before planting. The asterisk (*) indicates a significant difference as determined by Student’s t-test (p = 0.05) between the ZH10, Z106, and Z106G groups.
Horticulturae 07 00374 g001
Figure 2. PCoA based on the weighted UniFrac distance matrix at three stages between three treatments. (A) Flowering; (B) seed filling; (C) maturing. Z106 (deep blue) and ZH10 (red) represent transgenic soybean ZH10−6 and its recipient cultivar Zhonghuang 10. Z106G (light blue) represents Z106 treated with glyphosate. F, S, and M represent the flowering, seed filling, and maturing stages, respectively. BS and RS represent surrounding soil (triangle) and rhizospheric soil (square); BS without marked growth stages represents soil before planting (circle).
Horticulturae 07 00374 g002
Figure 3. Relative abundances of the main nitrogen-fixing bacterial genera at three stages between three treatments. (A) Surrounding soil; (B) rhizospheric soil. Z106 (deep blue) and ZH10 (red) represent transgenic soybean ZH10−6 and its recipient cultivar Zhonghuang 10. Z106G (light blue) represents Z106 treated with glyphosate. F, S, and M represent the flowering (circle), seed filling (triangle), and maturing (square) stages, respectively. BS and RS represent surrounding soil and rhizospheric soil. The asterisk (*) indicates a significant difference as determined by one-way ANOVA (p = 0.05) between the ZH10, Z106, and Z106G groups. The meaning of “-“ in figure is the average of three replications.
Horticulturae 07 00374 g003
Figure 4. Ternary plot of species based on different treatments in rhizospheric soil at (A) seed filling and (B) maturing stages. Z106 and ZH10 represent transgenic soybean ZH10−6 and its recipient cultivar Zhonghuang 10. Z106G represents Z106 treated with glyphosate. S and M represent the seed filling and maturing stages. RS represent rhizospheric soil. The rhizobia E. fredii is red.
Horticulturae 07 00374 g004
Table 1. Rhizospheric soil and plant analyses of ZH10, Z106, and Z106G.
AnalysisTraitFlowering Stage
(Mean ± SD)
Seed Filling Stage
(Mean ± SD)
Maturing Stage
(Mean ± SD)
ZH10Z106Z106GZH10Z106Z106GZH10Z106Z106G
Soil
analysis
pH value7.4 ± 0.01 a7.29 ± 0.04 b7.42 ± 0.13 ab7.23 ± 0.237.3 ± 0.157.54 ± 0.097.34 ± 0.047.35 ± 0.067.36 ± 0.06
Water content (%)17.46 ± 0.5518.32 ± 1.1617.1 ± 0.1914.96 ± 0.9314.05 ± 1.0415.28 ± 1.816.79 ± 0.2916.5 ± 1.1116.98 ± 0.64
C content (%)0.95 ± 0.05 b1.07 ± 0.1 ab1.27 ± 0.1 a0.96 ± 0.071.06 ± 0.061.07 ± 0.121.19 ± 0.091.19 ± 0.041.19 ± 0.1
N content (%)0.12 b0.14 ± 0.01 a0.15 ± 0.02 a0.13 ± 0.010.1 ± 0.060.12 ± 0.020.16 ± 0.01 a0.14 b0.13 ± 0.01 b
Plant
analysis
C content (%)40.8 ± 0.0640.83 ± 0.4539.98 ± 0.8641.81 ± 0.8141.49 ± 0.941.73 ± 0.2445.37 ± 0.4243.45 ± 1.8644.83 ± 1.31
N content (%)4.26 ± 0.434.08 ± 0.424.07 ± 0.183.94 ± 0.094.0 ± 0.433.96 ± 0.053.86 ± 0.163.27 ± 1.594.11 ± 0.37
Z106 and ZH10 represent transgenic soybean ZH10−6 and its recipient cultivar Zhonghuang 10. Z106G represents Z106 treated with glyphosate. C and N contents represent carbon and nitrogen contents, respectively. ±SD represents the standard deviation (n = 3). Statistical analyses were performed using a one-way ANOVA. The values in bold with different alphabetical superscripts show a statistically significant difference as determined by one-way ANOVA (p = 0.05) between the ZH10, Z106, and Z106G groups where a > b, while the values which share the common alphabetical superscripts are non-significantly different.
Table 2. Key enzyme activities in surrounding soil and rhizospheric soil of ZH10, Z106, and Z106G.
Sampling
Compartment
TraitFlowering Stage
(Mean ± SD)
Seed Filling Stage
(Mean ± SD)
Maturing Stage
(Mean ± SD)
ZH10Z106Z106GZH10Z106Z106GZH10Z106Z106G
Surrounding
Soil
S-UE (U/g)300.82 ± 97.93372.35 ± 27.1380.89 ± 65.81363.27 ± 78.73320.04 ± 86.32417.71 ± 134.68194.61 ± 72.24166.85 ± 58.46180.19 ± 69.84
S-NR (U/g)112.48 ± 6.86105.81 ± 4.41109.95 ± 1.7774.33 ± 10.9896.76 ± 12.3789.67 ± 2.33118.43 ± 4.03119.43 ± 3.44124.29 ± 7.95
S-NiR (U/g)24.54 ± 3.0122.7 ± 4.2620.65 ± 4.3939.25 ± 4.3640.62 ± 3.5640.27 ± 3.6937.52 ± 5.1242.15 ± 5.2442.68 ± 4.84
S-SC (U/g)26.38 ± 2.3825.35 ± 2.8725.27 ± 3.4527.16 ± 10.4225.07 ± 2.7125.74 ± 0.8927.83 ± 2.2927.23 ± 1.8926.23 ± 3.01
Rhizospheric
Soil
S-UE (U/g)317.9 ± 94.48411.31 ± 77.3370.74 ± 28.84501.51 ± 52.7 a274.67 ± 72.19 b468.42 ± 138.5 ab267.73 ± 30.93302.96 ± 85.23326.44 ± 108.87
S-NR (U/g)112.67 ± 10.24129.71 ± 2.87139.0 ± 14.29123.24 ± 13.89 b155.33 ± 12.37 a120.29 ± 10.49 b157.33 ± 16.07167.14 ± 15.95184.76 ± 19.37
S-NiR (U/g)27.52 ± 11.1723.56 ± 15.4417.37 ± 13.9438.21 ± 4.5736.5 ± 2.4132.28 ± 14.3130.77 ± 2.6640.98 ± 6.7827.31 ± 11.14
S-SC (U/g)45.53 ± 4.144.71 ± 3.8247.32 ± 3.5842.57 ± 2.5247.59 ± 8.2255.49 ± 17.873.82 ± 3.4 c109.73 ± 10.1 a89.47 ± 1.98 b
Z106 and ZH10 represent transgenic soybean ZH10−6 and its recipient cultivar Zhonghuang 10. Z106G represents Z106 treated with glyphosate. S-UE, S-NR, S-NiR, and S-SC represent Solid-Urease, Solid-Nitrate Reductase, Solid-Nitrite Reductase, and Solid-Sucrase, respectively. ±SD represents the standard deviation (n = 3). Statistical analyses were performed using a one-way ANOVA. The values in bold with different alphabetical superscripts show a statistically significant difference as determined by one-way ANOVA (p = 0.05) between the ZH10, Z106, and Z106G groups where a > b > c, while the values which share the common alphabetical superscripts are non-significantly different.
Publisher’s Note: MDPI stays neutral with regard to jurisdictional claims in published maps and institutional affiliations.

