
Impacts of COVID-19 on the Green Industry


Abstract
:1. Introduction
2. Materials and Methods
2.1. Producer Survey
2.2. Econometric Model
3. Results
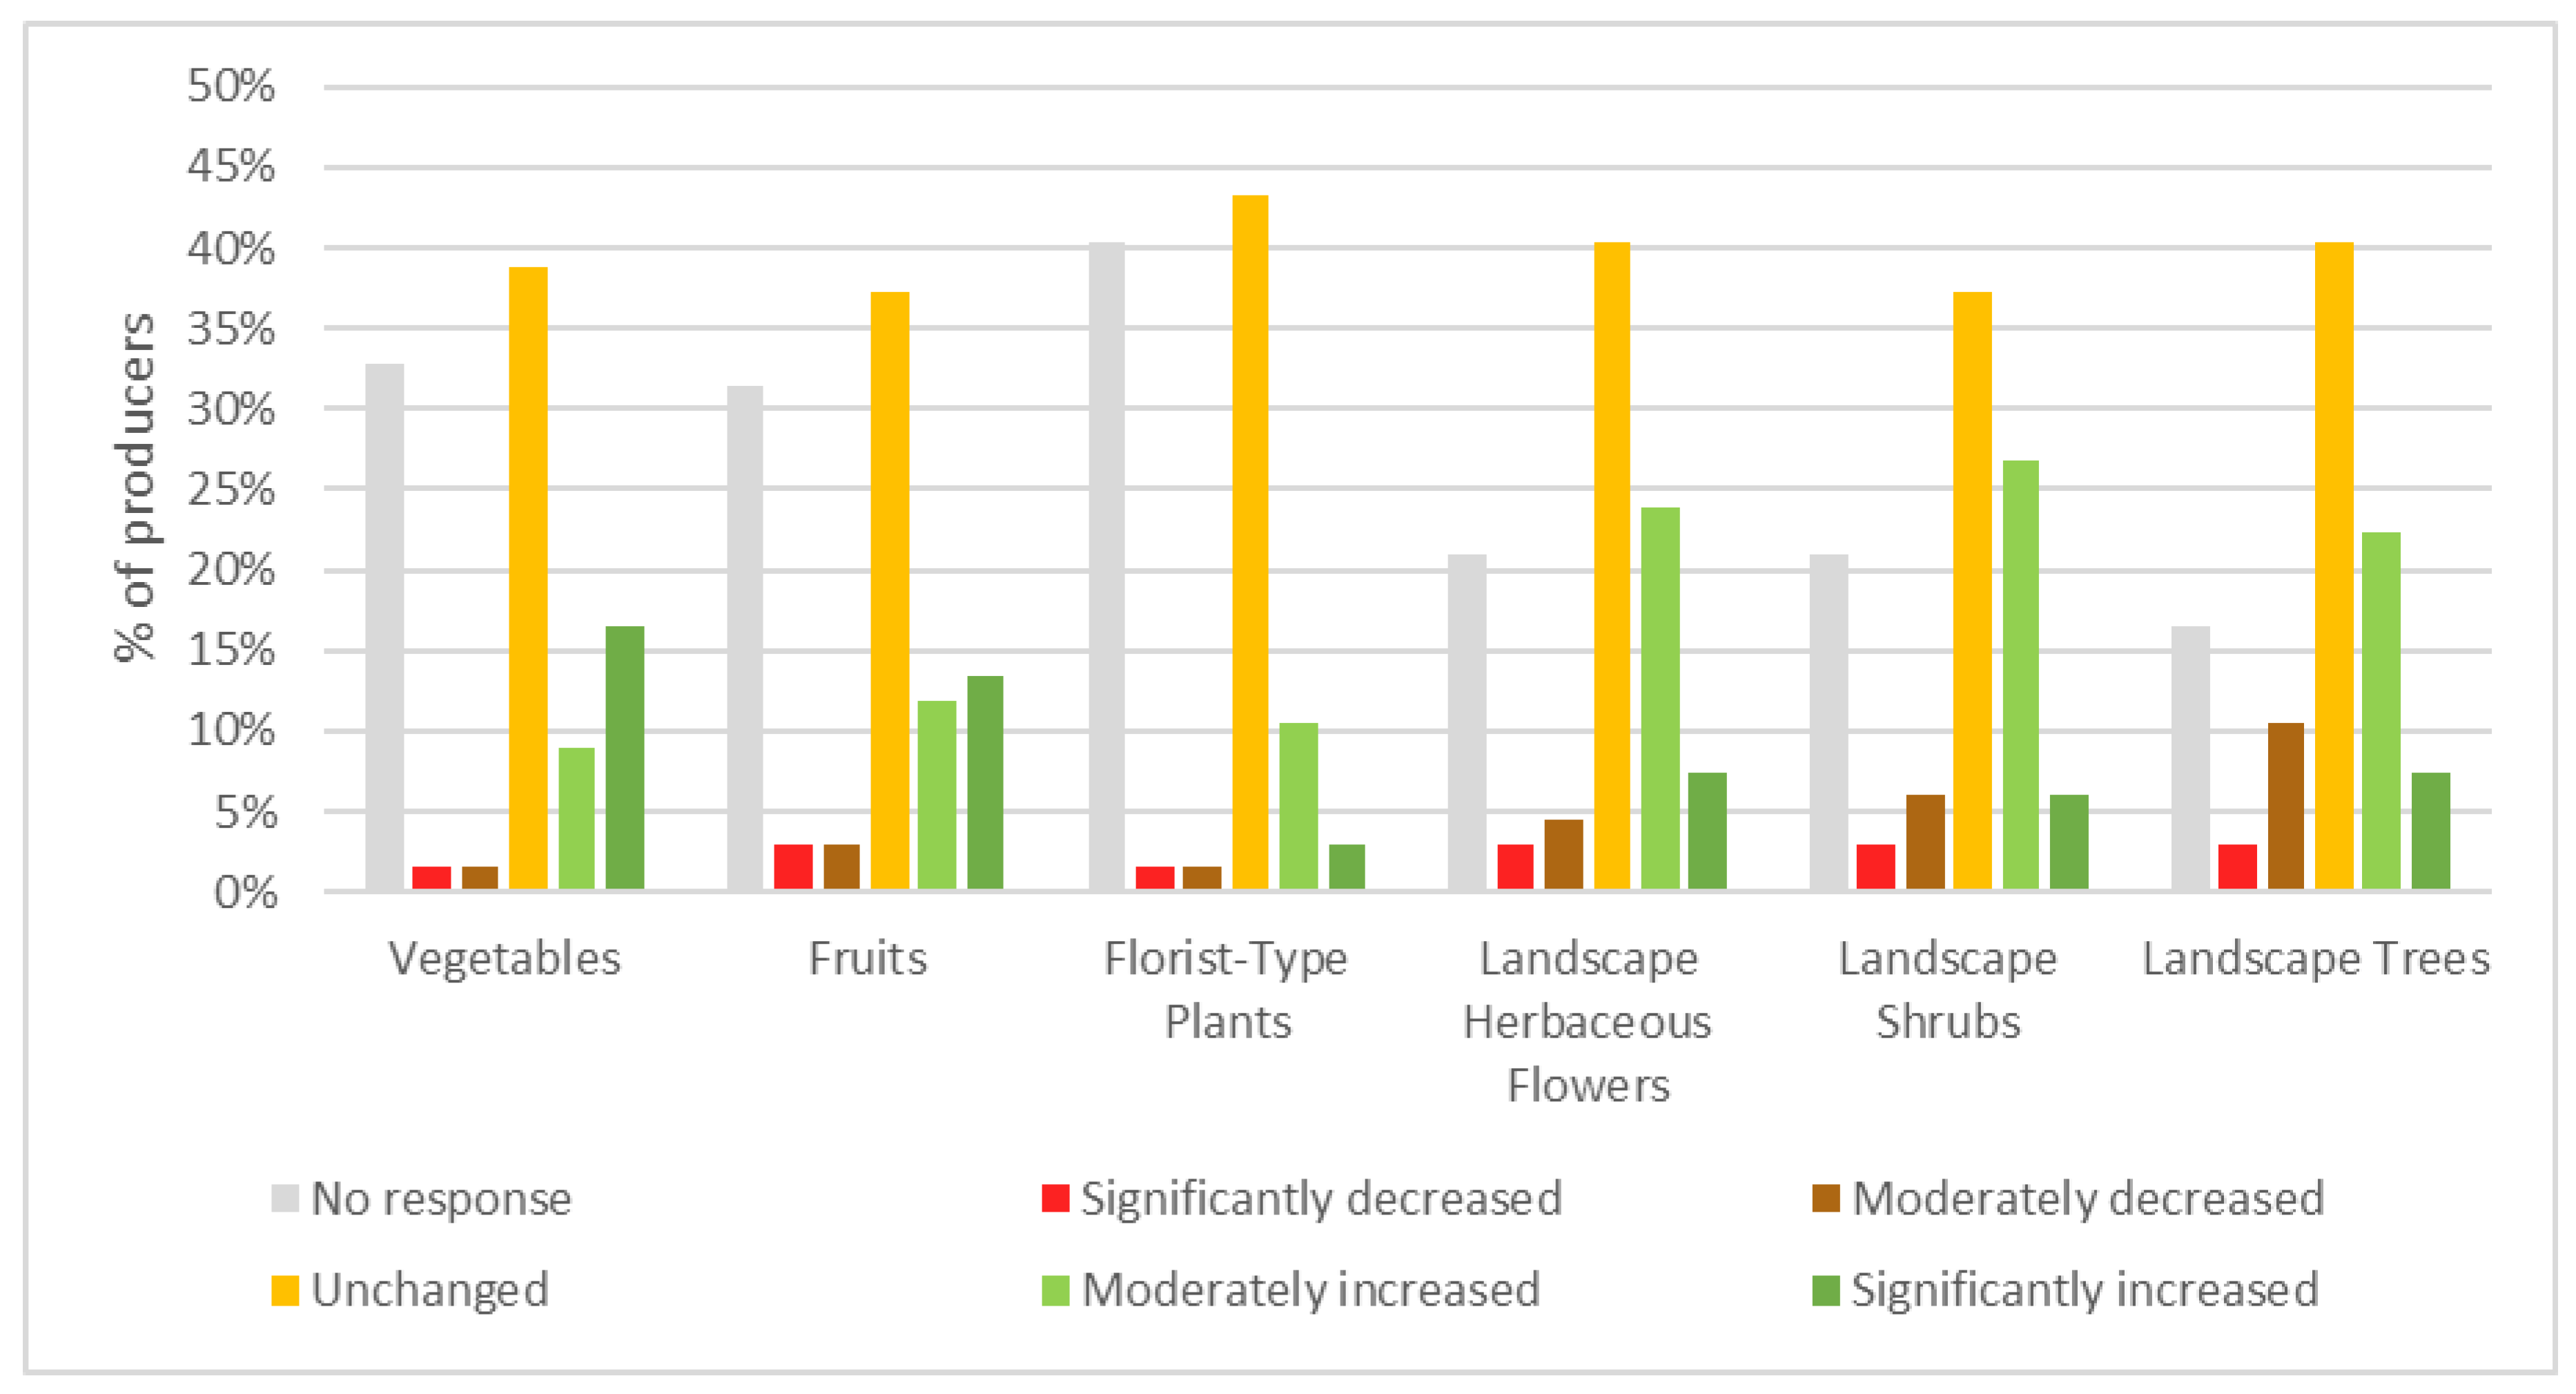
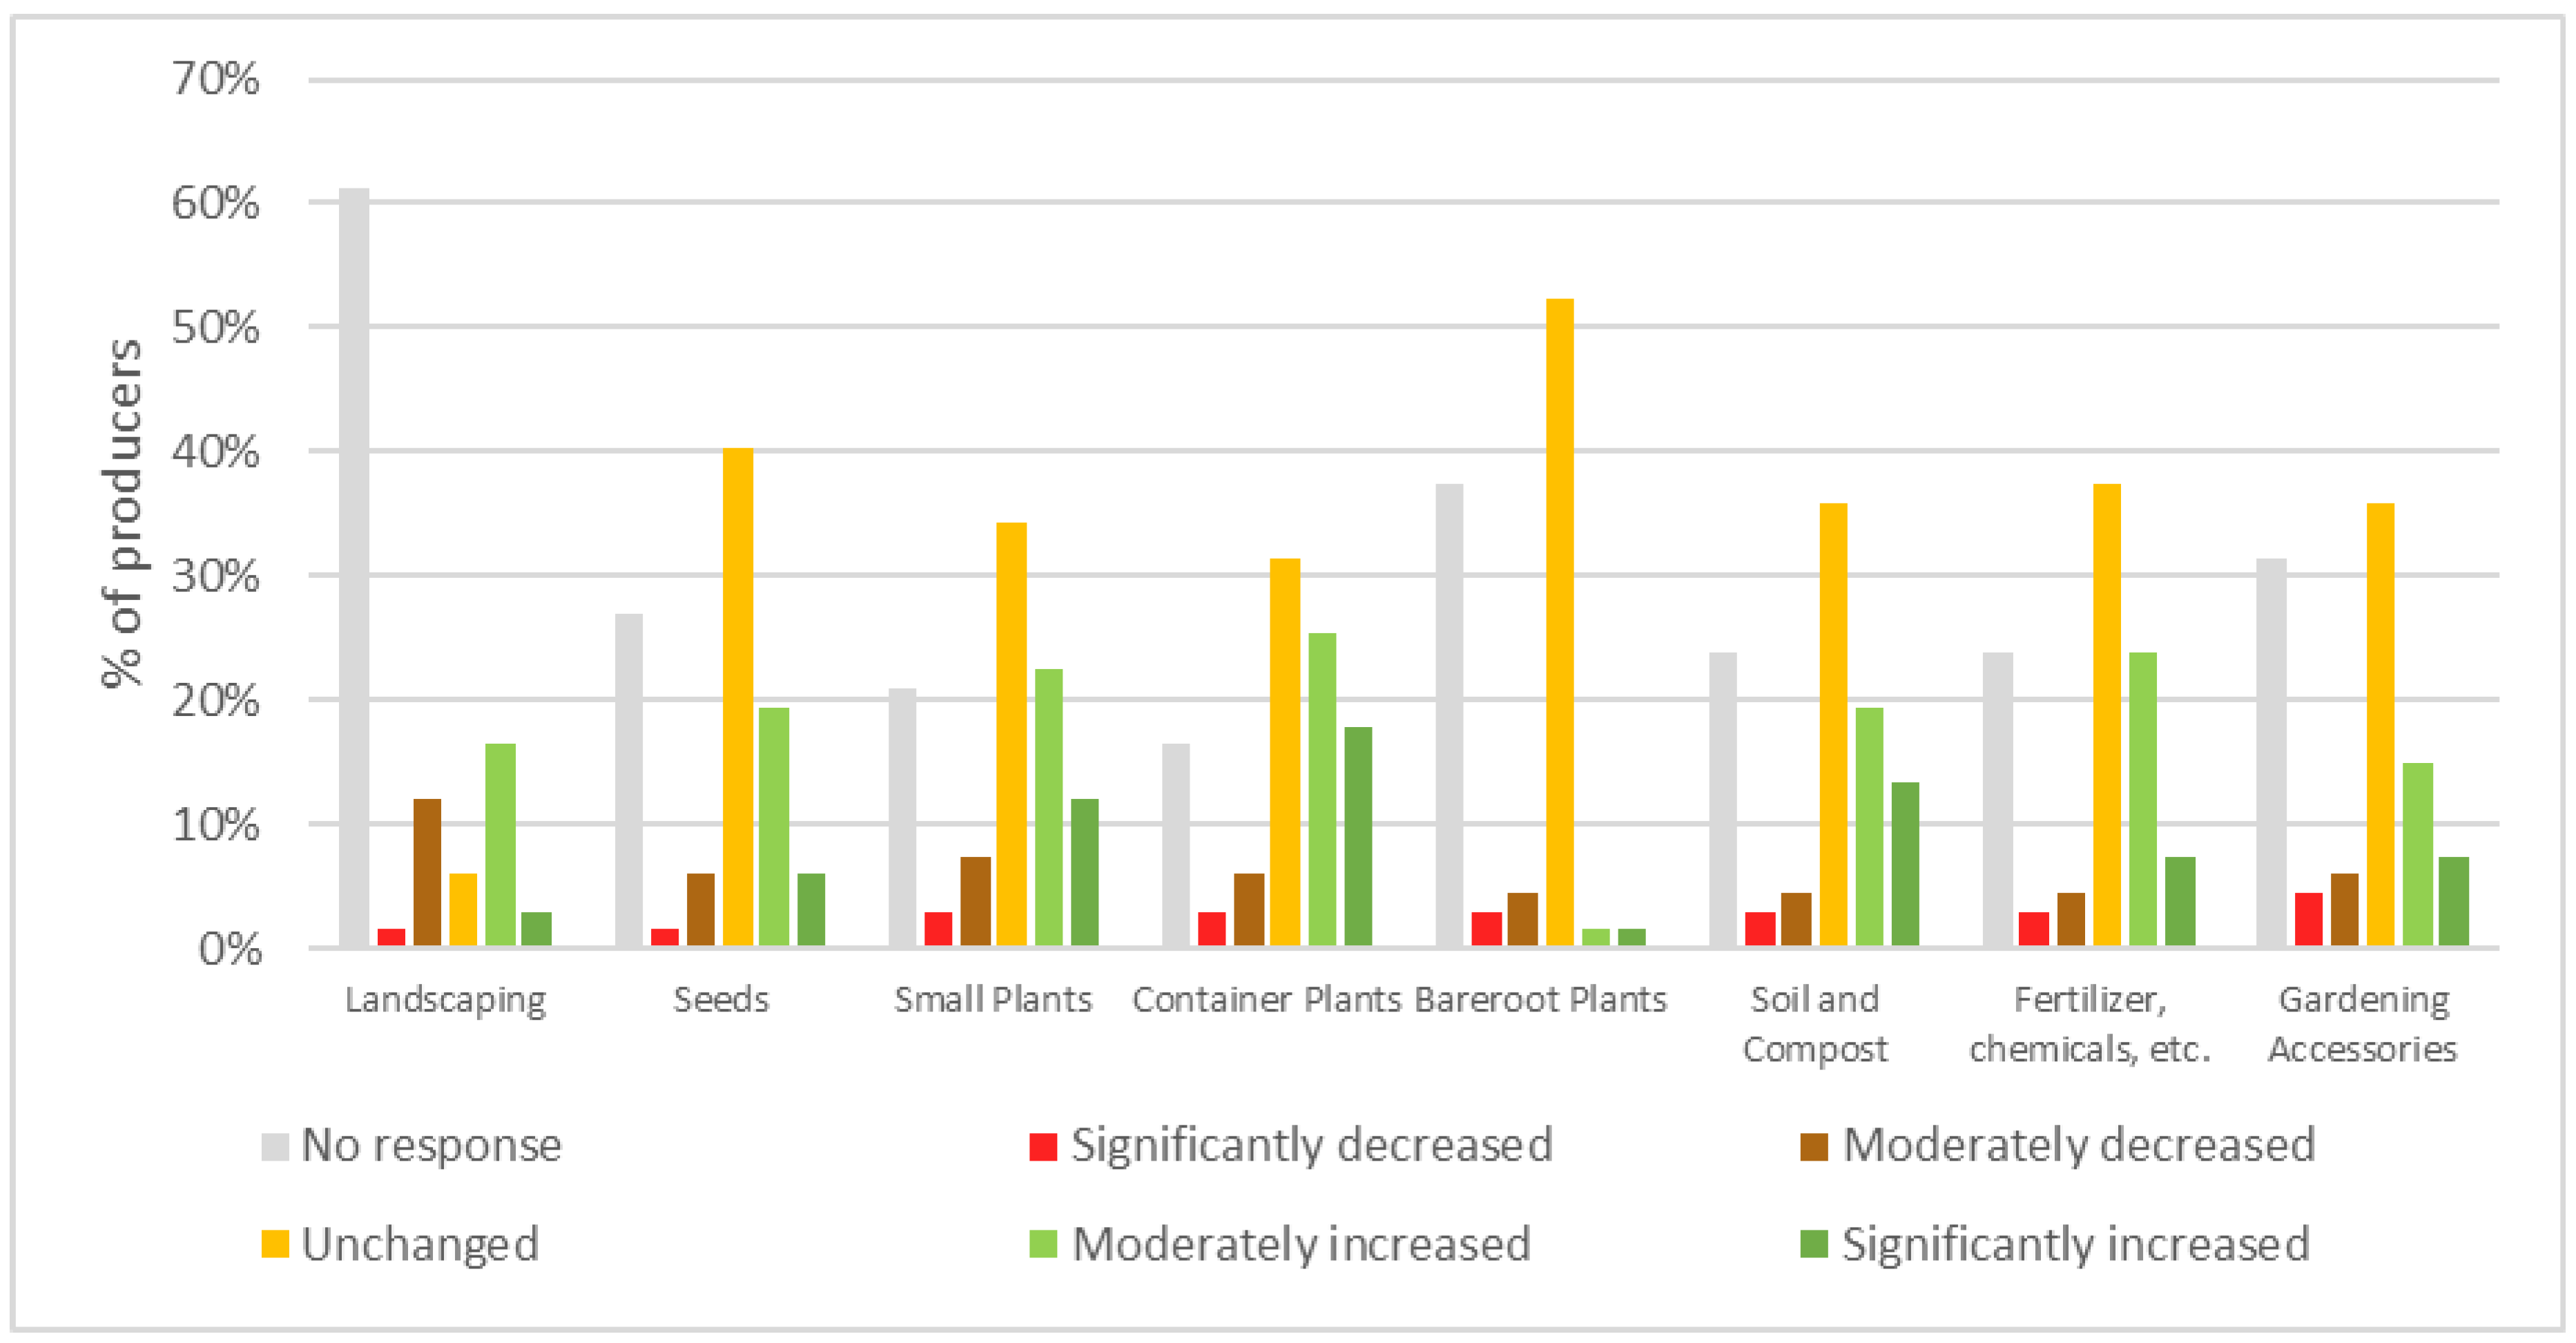
3.1. Producer Sales
3.2. Effects of Business Size and Total Revenue
3.3. Challenges Faced by Businesses Due to COVID-19
4. Discussion
5. Conclusions
Author Contributions
Funding
Institutional Review Board Statement
Informed Consent Statement
Data Availability Statement
Acknowledgments
Conflicts of Interest
References
- Keshky, E.; El Sayed, M.; Basyouni, S.S.; Al Sabban, A.M. Getting through COVID-19: The Pandemic’s Impact on the Psychology of Sustainability, Quality of Life, and the Global Economy–A Systematic Review. Front. Psychol. 2020, 11, 3188. [Google Scholar] [CrossRef] [PubMed]
- Baker, S.; Bloom, N.; Davis, S.; Terry, S. COVID-Induced Economic Uncertainty; National Bureau of Economic Research: Cambridge, MA, USA, 2020. [Google Scholar] [CrossRef]
- U.S. Department of Agriculture. NASS Census of Horticultural Specialties; USDA: Washington, DC, USA, 2019.
- Bulgari, R.; Petrini, A.; Cocetta, G.; Nicoletto, C.; Ertani, A.; Sambo, P.; Ferrante, A.; Nicola, S. The Impact of COVID-19 on Horticulture: Critical Issues and Opportunities Derived from an Unexpected Occurrence. Horticulturae 2021, 7, 124. [Google Scholar] [CrossRef]
- Sofo, A.; Sofo, A. Converting home spaces into food gardens at the time of COVID-19 quarantine: All the benefits of plants in this difficult and unprecedented period. Hum. Ecol. 2020, 48, 131–139. [Google Scholar] [CrossRef] [PubMed]
- Lades, L.K.; Laffan, K.; Daly, M.; Delaney, L. Daily emotional well-being during the COVID-19 pandemic. Br. J. Health Psychol. 2020, 25, 902–911. [Google Scholar] [CrossRef] [PubMed]
- Lin, B.X.; Zhang, Y.Y. Impact of the COVID-19 pandemic on agricultural exports. J. Integr. Agric. 2020, 19, 2937–2945. [Google Scholar] [CrossRef]
- Tonidandel, S.; LeBreton, J.M. Relative importance analysis: A useful supplement to regression analysis. J. Bus. Psychol. 2011, 26, 1–9. [Google Scholar] [CrossRef]
- Odeh, A.M.; Battaineh, H.T. Causes of construction delay: Traditional contracts. Int. J. Proj. Manag. 2002, 20, 67–73. [Google Scholar] [CrossRef]
- Gündüz, M.; Nielsen, Y.; Özdemir, M. Quantification of delay factors using the relative importance index method for construction projects in Turkey. J. Manag. Eng. 2013, 29, 133–139. [Google Scholar] [CrossRef]
- Torghabeh, Z.J.; Hosseinian, S.S.; Ressang, A. Relative Importance of Hazards at Construction Sites. Appl. Mech. Mater. 2013, 330, 867–871. [Google Scholar] [CrossRef]
- Chan, D.W.; Kumaraswamy, M.M. A comparative study of causes of time overruns in Hong Kong construction projects. Int. J. Proj. Manag. 1997, 15, 55–63. [Google Scholar] [CrossRef]
- Kometa, S.T.; Olomolaiye, P.O.; Harris, F.C. Attributes of UK construction clients influencing project consultants’ performance. Constr. Manag. Econ. 1994, 12, 433–443. [Google Scholar] [CrossRef]
- Marwah, P.; Zhang, Y.Y.; Gu, M. Investigating Producers’ Preferences for Crapemyrtle and Their Perceptions Regarding Crapemyrtle Bark Scale. Horticulturae 2021, 7, 146. [Google Scholar] [CrossRef]
- Rooshdi, R.R.R.M.; Majid, M.Z.A.; Sahamir, S.R.; Ismail, N.A.A. Relative importance index of sustainable design and construction activities criteria for green highway. Chem. Eng. Trans. 2018, 63, 151–156. [Google Scholar] [CrossRef]
- Nawrotzki, R.J.; Bakhtsiyarava, M. International Climate Migration: Evidence for the Climate Inhibitor Mechanism and the Agricultural Pathway. Popul. Space Place 2017, 23, e2033. [Google Scholar] [CrossRef] [PubMed] [Green Version]
- Williams, R. Understanding and Interpreting Generalized Ordered Logit Models. J. Math. Sociol. 2016, 40, 7–20. [Google Scholar] [CrossRef]

| Category | Percentage |
|---|---|
| Operation Type | |
| Landscaper | 31.34% |
| Grower | 29.85% |
| Retail | 17.91% |
| Supplier | 14.93% |
| Arborist | 4.48% |
| Re-wholesaler | 1.49% |
| Change in Operation due to COVID-19 | |
| Open, as before COVID-19 | 58.21% |
| Open—with modified procedures (remote staff, limited staff, limited hours) | 34.33% |
| Open—no customer access (phone or online ordering, pick-up or delivery only) | 5.97% |
| Closed—management decision | 1.49% |
| Change in Sales during COVID-19 | |
| Significantly decreased | 14.93% |
| Moderately decreased | 8.96% |
| No change | 11.94% |
| Moderately increased | 40.30% |
| Significantly increased | 23.88% |
| Business Type | |
| Incorporated under state law | 70.15% |
| Partnership—include family partnerships | 17.91% |
| Family or individual operation—exclude partnerships and corporations | 10.45% |
| Other, such as estate or trust, prison farm, grazing association, American Indian Reservation, etc. Please specify | 1.49% |
| Number of Employees | |
| Less than 10 | 23.88% |
| 10 to 49 | 46.27% |
| 50 to 99 | 10.45% |
| 100 to 499 | 14.93% |
| More than 500 | 4.48% |
| Total Revenue | |
| USD0 to USD9999 | 1.49% |
| USD100,000 to USD249,999 | 5.97% |
| USD250,000 to USD349,999 | 5.97% |
| USD350,000 to USD500,000 | 5.97% |
| USD500,000 to USD749,999 | 2.99% |
| USD750,000 to USD999,999 | 8.96% |
| USD1,000,000 to USD1,099,999 | 4.48% |
| USD1,100,000 to USD4,999,999 | 34.33% |
| USD5,000,000 to USD7,999,999 | 1.49% |
| Over USD8,000,000 | 28.36% |
| Change in Sales | Odds Ratio | SE | p > |z| |
|---|---|---|---|
| Change in operation (Base = Open—as before COVID-19) | |||
| Open—with modifications | 0.795 | 0.487 | 0.708 |
| Open—no customer access | 0.680 | 0.669 | 0.695 |
| Operation Type (Base = Grower) | |||
| Arborist | 0.292 | 0.366 | 0.326 |
| Landscaper | 0.393 | 0.287 | 0.201 |
| Retail | 16.515 *** | 14.564 | 0.001 |
| Supplier | 1.685 | 1.361 | 0.518 |
| Business Type (Base = Family or Individual operation) | |||
| Incorporated under state law | 0.479 | 0.439 | 0.422 |
| Partnership—include family partnerships | 0.539 | 0.561 | 0.553 |
| Size (per 10 employees) | 1.032 | 0.029 | 0.255 |
| Revenue (in USD100,000) | 1.005 | 0.012 | 0.667 |
| Change in Sales | Odds Ratio | p > |z| | Odds Ratio | p > |z| | Odds Ratio | p > |z| |
|---|---|---|---|---|---|---|
| Landscaping | Seeds | Small Plants | ||||
| Change in operation (Base = Open—as before COVID-19) | ||||||
| Open—with modifications | 1.35 | 0.8 | 2.75 | 0.21 | 1.63 | 0.52 |
| Open—no customer access | - | - | 0.00 ** | 0.01 | 0.2 | 0.25 |
| Operation Type (Base = Grower) | ||||||
| Arborist | - | - | 0.22 | 0.35 | 0.18 | 0.19 |
| Landscaper | 0.53 | 0.66 | 0.5 | 0.5 | 0.12 ** | 0.02 |
| Retail | 3.63 | 0.42 | 46.02 *** | 0 | 16.92 *** | 0.01 |
| Supplier | 3.97 | 0.43 | 0.99 | 1 | 0.14 ** | 0.04 |
| Business Type (Base = Family or individual operation) | ||||||
| Incorporated under state law | 1.37 | 0.82 | 0.44 | 0.56 | 0.6 | 0.64 |
| Partnership—include family partnerships | 2.99 | 0.55 | 0.5 | 0.68 | 0.48 | 0.57 |
| Size (per 10 employees) | 0.99 | 0.77 | 0.99 | 0.86 | 1.02 | 0.55 |
| Revenue (in USD100,000) | 1 | 0.97 | 0.98 | 0.31 | 1 | 0.99 |
| Container Plants | Soil and Compost | Fertilizer and Chemicals | ||||
| Change in operation (Base = Open—as before COVID-19) | ||||||
| Open—with modifications | 1.64 | 0.51 | 2.38 | 0.24 | 1.7 | 0.47 |
| Open—no customer access | 3.12 | 0.4 | 0.06 * | 0.06 | 0.12 | 0.15 |
| Operation Type (Base = Grower) | ||||||
| Arborist | 0.12 | 0.11 | 0.21 | 0.28 | 0.41 | 0.54 |
| Landscaper | 0.09 ** | 0.01 | 0.51 | 0.47 | 0.48 | 0.43 |
| Retail | 28.31 *** | 0 | 11.44 ** | 0.01 | 8.68 ** | 0.02 |
| Supplier | 0.07 *** | 0.01 | 0.8 | 0.83 | 0.99 | 0.99 |
| Business Type (Base = Family or individual operation) | ||||||
| Incorporated under state law | 0.6 | 0.65 | 1.63 | 0.65 | 1.63 | 0.7 |
| Partnership—include family partnerships | 0.5 | 0.6 | 1.16 | 0.91 | 1.16 | 0.92 |
| Size (per 10 employees) | 1.03 | 0.35 | 0.98 | 0.6 | 1.03 | 0.42 |
| Revenue (in USD100,000) | 1 | 0.92 | 0.99 | 0.42 | 0.99 | 0.59 |
| Gardening Accessories | Vegetables | Fruits | ||||
| Change in operation | ||||||
| (Base = Open—as before COVID-19) | ||||||
| Open—with modifications | 2.07 | 0.34 | 6.59 | 0.1 | 1.3 | 0.75 |
| Open—no customer access | 1.50 × 10⁷ | 0.99 | 0 | 0.2 | 0.99 | 1 |
| Operation Type | ||||||
| (Base = Grower) | ||||||
| Arborist | 0.7 | 0.83 | 0.02 | 0.14 | 0.04 * | 0.08 |
| Landscaper | 0.13 * | 0.08 | 0.03 ** | 0.02 | 0.01 *** | 0 |
| Retail | 21.18 ** | 0.01 | 7.67 * | 0.06 | 3.78 | 0.14 |
| Supplier | 2.63 | 0.42 | 0.04 ** | 0.03 | 0.03 ** | 0.02 |
| Business Type | ||||||
| (Base = Family or individual operation) | ||||||
| Incorporated under state law | 0.18 | 0.22 | 0.39 | 0.51 | 0.24 | 0.25 |
| Partnership—include family partnerships | 0.14 | 0.24 | 0.03 * | 0.06 | 0.33 | 0.47 |
| Size (per 10 employees) | 1 | 0.97 | 0.94 | 0.16 | 1.03 | 0.49 |
| Revenue (in USD100,000) | 1.02 | 0.47 | 1.02 | 0.29 | 1 | 0.85 |
| Florist-Type Plants | Landscape Herbaceous Plants | Landscape Shrubs | ||||
| Change in operation (Base = Open—as before COVID-19) | ||||||
| Open—with modifications | 12.08 * | 0.07 | 2.43 | 0.24 | 1.13 | 0.86 |
| Open—no customer access | 0 | 1 | 0.2 | 0.22 | 1.25 | 0.87 |
| Operation Type | ||||||
| Arborist | 0.41 | 0.76 | 0.12 | 0.16 | 0.24 | 0.32 |
| Landscaper | 0.08 | 0.2 | 0.06 *** | 0 | 0.25 | 0.14 |
| Retail | 28.84 ** | 0.04 | 2.79 | 0.23 | 4.15 | 0.14 |
| Supplier | 0.09 | 0.33 | 0.11 ** | 0.03 | 0.13 ** | 0.05 |
| Business Type | ||||||
| Incorporated under state law | 6.00 × 10¹¹ | 1 | 2.28 | 0.51 | 0.74 | 0.81 |
| Partnership—include family partnerships | 2.00 × 10¹⁰ | 1 | 4.46 | 0.31 | 0.68 | 0.78 |
| Size (per 10 employees) | 0.83 | 0.14 | 1 | 0.91 | 1.05 | 0.14 |
| Revenue (in USD100,000) | 1.05 | 0.21 | 1 | 0.84 | 1 | 0.92 |
| Landscape Trees | ||||||
| Change in operation (Base = Open—as before COVID-19) | ||||||
| Open—with modifications | 1.2 | 0.79 | ||||
| Open—no customer access | 1.86 | 0.58 | ||||
| Operation Type (Base= Grower) | ||||||
| Arborist | 0.34 | 0.39 | ||||
| Landscaper | 0.56 | 0.47 | ||||
| Retail | 1.46 | 0.65 | ||||
| Supplier | 0.31 | 0.18 | ||||
| Business Type (Base = Family or individual operation) | ||||||
| Incorporated under state law | 0.43 | 0.43 | ||||
| Partnership—include family partnerships | 0.6 | 0.68 | ||||
| Size (per 10 employees) | 1.05 * | 0.08 | ||||
| Revenue (in USD100,000) | 0.99 | 0.34 | ||||
| Challenge | Rating | Relative Importance Index |
|---|---|---|
| Not enough employees to keep up with demand | 2.86 | 0.571 |
| Not enough inventory to meet customer demand | 2.81 | 0.563 |
| Social distancing for employees | 2.54 | 0.507 |
| Social distancing for customers | 2.48 | 0.495 |
| Compliance with government COVID-19 mandates | 2.47 | 0.494 |
| Covering work hours with available employee | 2.45 | 0.490 |
| Increase in operation costs due to COVID-19 | 2.38 | 0.477 |
| Access to government relief programs | 2.29 | 0.458 |
| Market access | 2.26 | 0.452 |
| Training workers | 2.23 | 0.445 |
| Delivering to other state | 1.93 | 0.386 |
| Keeping staff employed | 1.90 | 0.379 |
| Taxes | 1.87 | 0.375 |
| Cash flow obligations | 1.84 | 0.369 |
| Billing and collections | 1.81 | 0.363 |
Publisher’s Note: MDPI stays neutral with regard to jurisdictional claims in published maps and institutional affiliations. |
© 2021 by the authors. Licensee MDPI, Basel, Switzerland. This article is an open access article distributed under the terms and conditions of the Creative Commons Attribution (CC BY) license (https://creativecommons.org/licenses/by/4.0/).
Share and Cite
Marwah, P.; Zhang, Y.Y.; Gu, M. Impacts of COVID-19 on the Green Industry. Horticulturae 2021, 7, 329. https://doi.org/10.3390/horticulturae7100329
Marwah P, Zhang YY, Gu M. Impacts of COVID-19 on the Green Industry. Horticulturae. 2021; 7(10):329. https://doi.org/10.3390/horticulturae7100329
Chicago/Turabian StyleMarwah, Pulkit, Yu Yvette Zhang, and Mengmeng Gu. 2021. "Impacts of COVID-19 on the Green Industry" Horticulturae 7, no. 10: 329. https://doi.org/10.3390/horticulturae7100329
APA StyleMarwah, P., Zhang, Y. Y., & Gu, M. (2021). Impacts of COVID-19 on the Green Industry. Horticulturae, 7(10), 329. https://doi.org/10.3390/horticulturae7100329