Article

The Effect of Leaching Fraction-Based Irrigation on Fertilizer Longevity and Leachate Nutrient Content in a Greenhouse Environment

Department of Horticulture, Auburn University, 101 Funchess Hall, Auburn, AL 36849, USA
*
Authors to whom correspondence should be addressed.
Horticulturae 2020, 6(3), 43; https://doi.org/10.3390/horticulturae6030043
Submission received: 26 June 2020 / Revised: 28 July 2020 / Accepted: 30 July 2020 / Published: 3 August 2020
(This article belongs to the Section Floriculture, Nursery and Landscape, and Turf)

Abstract

:
An experiment was conducted to evaluate the effects of leaching fraction (LF) on the longevity of controlled-release fertilizer (CRF) and leachate nutrient content in a pine bark substrate. The effect of LF-based irrigation was evaluated under six target LFs of 0.05, 0.15, 0.25, 0.35, 0.45, and 0.55. The 2.72 L nursery pots were filled with 100% pine bark substrate amended with dolomitic lime at a rate of 2.97 kg/m3 and Harrell’s 16-6-13 POLYON® applied at a rate of 6 g per container. Fertilizer was encased in vinyl-coated fiberglass mesh bags and subdressed 2.5 cm under the substrate surface for recovery at the end of 10 weeks. The total amount of nutrients leached from the container was greater at higher LFs, with twice as much inorganic nitrogen leached at a LF of 0.55 than a 0.15 LF. The amount of dissolved nutrients left in the substrate decreased as the LF treatments increased. There were 29.6% more inorganic nitrogen and 37.7% more phosphorus left in the substrate irrigated with a 0.15 LF as compared to a 0.55 LF. This suggests that at lower LFs, more dissolved nutrients may be available for plant uptake. No differences were seen in the amount of nutrients lost from the CRF or remaining in the prills. Results indicate that reducing the LF did not influence the longevity of POLYON® CRF in a pine bark substrate, but that a lower LF may be useful in reducing nutrient runoff into the environment. Targeting a lower LF also resulted in a larger pool of plant-available nutrients, allowing nursery producers to potentially reduce fertilizer rates.

1. Introduction

Water issues are an increasing concern for the ornamental container nursery industry. Growers rely on frequent irrigation and applications of controlled-release fertilizer (CRF) to produce saleable plants [1]. These practices contribute to increase runoff of nitrogen and phosphorus, causing detrimental environmental effects such as contamination of local water resources, eutrophication, and death of aquatic species [2,3]. Overirrigation may also lead to a faster release of CRF [4,5,6] requiring additional fertilizer applications during the production cycle, at a significant cost for growers [7]. Leaching fraction (LF) is one method of monitoring irrigation efficiency [8], and is calculated by dividing the amount of water that leaches from a container by the total amount of irrigation applied:
Leaching   fraction = ( leachate   recovered ) / ( total   applied   irrigation )
In previous studies and nursery applications, irrigating based on a 0.15 to 0.2 target LF or monitoring substrate moisture has shown the potential to reduce the loss of nutrients through leaching and preserve CRF longevity [5,9,10]. Owen et al. [11] found that a target LF 0.1 to 0.2 reduced leachate volume by 64% and reduced dissolved reactive P concentration in leachate by 64% without influencing plant dry weight. Tyler et al. [12] reported that a low LF of 0 to 0.2 decreased nitrate and phosphorus contents in effluent compared to a LF of 0.4 to 0.6. Prehn et al. [13] reported that plants irrigated with a target LF of 0.2 had equivalent growth compared to those that were irrigated with an on-demand irrigation system, suggesting that plants of similar size could be produced with a significantly reduced LF. When determining the effects of substrate moisture on CRF release rates, there are conflicting reports in the literature. Kochba et al. [5] reported that coated KNO3 release was essentially equal if the moisture content of the soil was greater than 50% of field capacity. This contrasts with results from Du et al. [14], which demonstrated that rates of release for CRF were approximately 5 to 20% slower in a column of sand at field capacity compared to saturated sand or free water. Finally, Adams et al. [4] reported that although there were no differences between CRF release in a moist solid substrate and pure water, the mass flow of water across the prill surface in fluctuating water potential environments may lead to faster exhaustion of the CRF.
The objective of this study differed from previous work in that it evaluated LF influence on the longevity of a CRF and how different LFs affect leachate nutrient content in a pine bark substrate.

2. Materials and Methods

This study was conducted in a greenhouse at Paterson Greenhouse Complex, Auburn University in Auburn, Alabama, USA (USDA Cold Hardiness Zone 8a). “Trade gallon” 2.72 L black plastic nursery containers were filled with 1200 g of 100% pine bark with a gravimetric water content of 37.3% amended with 336 g (rate of 2.97 kg/m3) of dolomitic lime to simulate a common nursery mix. The pots were fallow and contained no plants. SOAX® liquid wetting agent (Smithers Oasis, Kent, OH, USA) at 1200 ppm was applied to the substrate to help with surface wetting and minimize the effects of channeling.
Harrell’s 16-6-13 POLYON® CRF (Harrell’s LLC, Lakeland, FL, USA) was applied at a rate of 6 g to every container. Fertilizer was weighed and encased in 11 cm square bags made from vinyl-coated charcoal fiberglass mesh that were heat sealed around the edges (Phiefer Inc., Tuscaloosa, AL, USA). Mesh bags were applied 2.5 cm below the substrate surface. Containers were irrigated to obtain six different target LFs: 0.5, 0.15, 0.25, 0.35, 0.45, and 0.55. Each container represented an experimental unit; there were four replications of each irrigation treatment for a total of 24 containers arranged in a completely randomized design. To determine initial irrigation application, containers were thoroughly watered in and drained for one hour. Containers were then weighed, left for two days, and weighed again to determine water loss due to evaporation, noted as “water loss”. Initial irrigation volumes were calculated by determining the amount of water needed to replace the evaporated water (water loss) and adding the amount needed to reach the target LF for each container (water loss × LF):
Irrigation   volume   ( mL ) = water   loss   ( mL ) + ( water   loss   ( mL )   ×   LF )
After the initial irrigation calculation, adjustments to irrigation volume were determined using the actual LF obtained from each irrigation. The equation used was adapted from Owen et al. [15]:
± Irrigation   volume   ( mL ) = applied   irrigation   ( mL )   ×   ( target   LF     actual   LF )
Data collection began on 12 August 2019 and took place over 10 weeks. Containers were irrigated by hand three times a week with a syringe. Water was distributed slowly and evenly over the surface of the substrate. During irrigation events, each fallow container was fitted into a 2.5 L leachate collection bucket. The containers fit snugly into the collection buckets, leaving adequate space between the container and bucket for leachate to collect. After irrigating, containers drained for 30 min. Leachate volume per container was then measured with a graduated cylinder and recorded. Leachate pH and electrical conductivity (EC) were measured using a HACH Pocket Pro + Multi 2 Tester (Hach Co., Loveland, CO, USA). A 15 mL aliquot of each leachate sample was placed in a sealed collection tube and refrigerated. Throughout each week, the three individual samples collected from each replication were combined, a total of one pooled 45 mL sample per container per week. Samples were kept in refrigeration at 3 °C during the collection week, after which the samples were frozen.
After 5 and 10 weeks, samples were thawed and sent to Quality Analytical Laboratories in Panama City, FL for a complete soilless media analysis. Leachate samples were analyzed for NO3-N and NH4-N (fertilizer did not contain urea) with a Lachat Quikchem® 8500 series flow injection analysis system (Hach Co., Loveland, CO, USA). Total phosphorus, potassium, SO4-S, calcium, magnesium and micronutrients (Fe, Mn, B, Cu, Zn, Mo, Na, Al, and Cl) were analyzed using a Thermo Scientific™ iCAP™ 7400 ICP-OES analyzer (Thermo Fisher Scientific™, Waltham, MA, USA).
At the end of the study, mesh bags were retrieved to determine nutrients remaining in the fertilizer prills. Bags were separated from the substrate and allowed to air-dry for 14 days. The prills from each recovered bag were weighed after which 100 prills were separated and weighed again. These 100 prills were ground using a mortar and pestle and mixed with 1 L of deionized water. The prill solution was stirred with a stir rod for 5 min before a 45 mL aliquot of the extractant was taken and sampled for pH and EC. The samples were frozen until analyzed using the same methods described above.
Initial fertilizer application was determined from an average of four analyses of 6 g of unused CRF. Fertilizer recovered from the mesh bags after the completion of the study were recorded as remaining fertilizer. Fertilizer loss was calculated as:
Fertilizer   loss = initial   fertilizer     remaining   fertilizer
Total fertilizer leached (mg) was determined by multiplying the concentration of nutrients in the weekly leachate samples by weekly leachate volume and totaled over the 10 weeks. Fertilizer remaining in the substrate or lost to volatilization was calculated by subtracting fertilizer loss from the total fertilizer leached:
Fertilizer   in   substrate   or   volatilized = fertilizer   loss     fertilizer   leached
Data was analyzed in JMP® and SAS University Edition by SAS® (SAS Institute Inc., Cary, NC, USA) using a Tukey’s honestly significant difference (HSD) test for means comparison and general linear mixed models (GLIMMIX) for regression.

3. Results and Discussion

3.1. LF and Leachate Nutrient Content

The total amount of CRF leached from the containers over 10 weeks was significantly greater at higher leaching fractions, with twice as much NO3-N and NH4-N leached and over twice as much P leached at a LF of 0.55 than 0.15 LF (Table 1). Irrigating to a 0.15 LF instead of a 0.25 LF was found to reduce leachate volume by 18.9% and NO3-N and P in leachate by 11.8% and 11.1% respectively. While not as dramatic as findings by Owens et al. (2008) in a microirrigated system, where decreasing the target LF from 0.2 to 0.1 reduced leachate volume by 64% and dissolved P in leachate by 64%, both agree with previous research by Tyler et al. (1996) that the amount of N and P in effluent can be reduced by decreasing the target LF. Results from this study indicate that irrigating to a lower LF can reduce the amount of NO3-N and P, the major nutrients responsible for eutrophication, in runoff from container nurseries. The amount of dissolved nutrients left in the substrate decreased as the LF treatments increased (Table 1). There was 29.6% more inorganic nitrogen and 37.7% more phosphorus left in the substrate irrigated with a 0.15 LF as compared to a 0.55 LF, likely due to flushing of dissolved nutrients out of containers at the higher leaching fractions (Table 1).
Although there were some discrepancies in the micronutrients, possibly due to the addition of mineral nutrients from substrate breakdown, irrigation water, and the addition of dolomitic lime to the substrate, there were trends observed with SO4-S, Ca, Mg, Fe, Mn, B, Cu, Zn, Mo, Na, Al, and Cl (Table 2). In general, more of these nutrients were lost from the containers in leachate when containers were irrigated to a higher LF, and at a lower LF more nutrients were retained in the substrate (Table 2). This suggests that at lower leaching fractions, a larger pool of plant-available nutrients may be available for uptake, potentially allowing growers to reduce the application rate of CRF.
In weeks 5 through 10, leachate EC correlated inversely with target LF treatment (Table 3). Although irrigating to a lower target LF may reduce the amount of nutrients leached, a grower that is monitoring the leachate for EC may see higher numbers associated with lower LF due to the high concentration of salts in a small volume of leachate (Figure 1). Leachate EC increased as the weeks progressed due to the control-release mechanism releasing nutrients over time (Table 3). Leachate pH decreased linearly over 10 weeks, but there were no consistent trends of target LF treatment on the pH of the leachate. (Table 4).

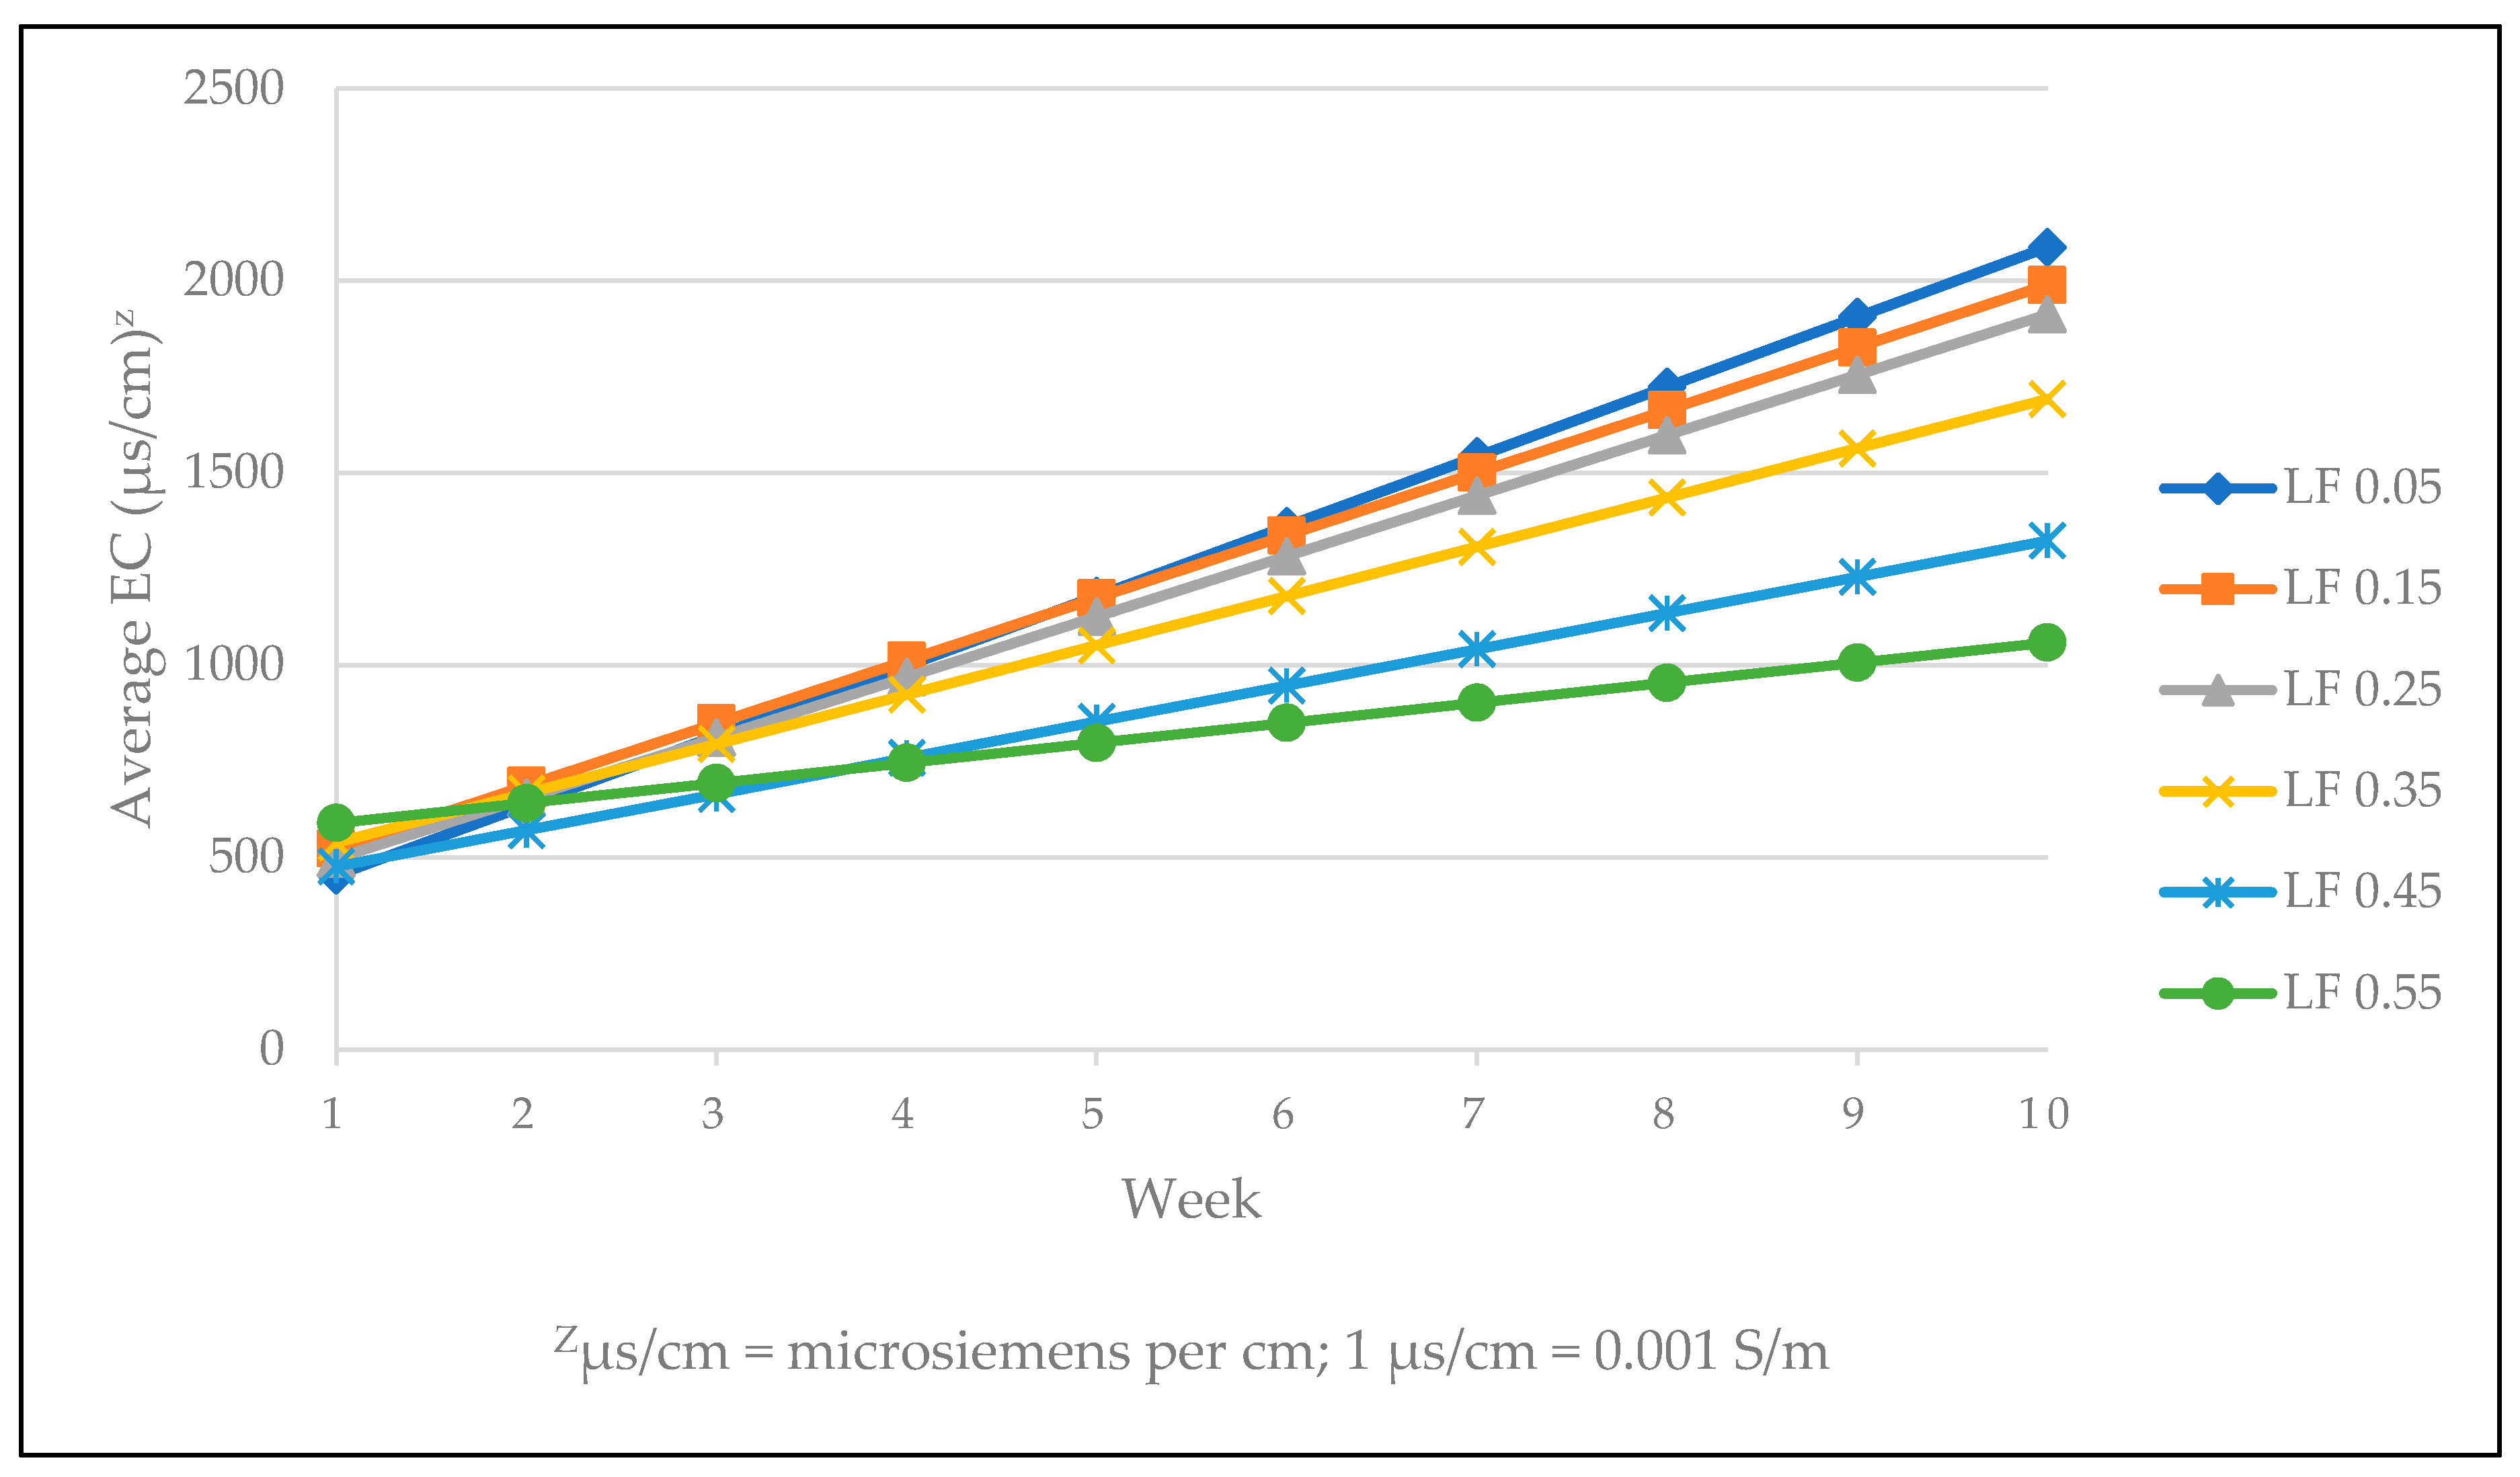
3.2. LF and Fertilizer Longevity

There was a quadratic trend in the pH of the fertilizer remaining in the mesh bags between treatments; pH increased as target LF increased from 0.05 to 0.35 and then decreased as target LF increased to 0.55 (Table 5). There was a similar quadratic trend between EC of the fertilizer remaining in the mesh bags and target LF treatments, with fertilizer EC decreasing as target LF increased from 0.05 to 0.25 and then increasing as target LF increased toward 0.55. (Table 5). The fertilizer used in the study was a scheduled three-month longevity at 80 °F. This study occurred over 10 weeks. It is possible that the fertilizer was completely exhausted within the first five or six weeks of the study. However, a linear relationship was observed in most treatments over ten weeks, indicating that fertilizer was still being released from the prills. In future studies, reducing the length of the experiment or including a time factor associated with fertilizer sampling may reveal more obvious differences in fertilizer EC between target LF treatments.
Despite a slightly higher EC in treatments with lower LF, there were no differences in the amount of nutrients lost from the CRF or remaining in the prills (Table 6), again potentially due to the extended period of the study. A shorter duration of six weeks may have shown differences in the amount of nutrients lost and nutrients remaining in the CRF prills.
The results of this study indicate that reducing the LF did not influence the longevity of POLYON® CRF in a pine bark substrate over 10 weeks but that a lower LF may be useful in reducing nutrient runoff into the environment. Growers could potentially reduce total loading of nutrients in runoff by reducing target LF, a benefit in areas with strict water-quality requirements or where environmental quality is a concern. Targeting a lower LF may also result in a larger pool of plant-available nutrients, allowing nursery producers to save on input costs by reducing CRF rate.

4. Conclusions

Irrigating to different target leaching fractions had no significant effect on the longevity of Harrell’s 16-6-13 POLYON® in pine bark substrate over 10 weeks. The results of this study suggest that there are benefits to targeting a lower LF, including a reduction in the amount of nutrients leached and a greater concentration of dissolved nutrients in the substrate. Lower LF were shown to reduce the total amount of N and P leached, which has implications to reduce the environmental impact of container nursery production. Limiting nutrient leaching may also help growers stay compliant with any current or future federal and state standards regarding water quality and daily nutrient loads. Lower LF treatments were also associated with larger amounts of dissolved nutrients in the substrate. Although this study did not contain any plants, higher concentrations of nutrients available for plant uptake may influence growth rate or plant size. By targeting a lower LF, growers may be able to reduce their application rates of CRFs while still producing salable plants. It is important to note that the use of CRF with a different prill coating and release mechanism may alter results. Further research is necessary to explore the effects of LF on CRF with different release mechanisms as well as the impact of LF on plant growth and salability.

Author Contributions

Conceptualization, A.F.N., J.M.P. and C.E.K.; methodology, A.F.N. and J.M.P.; resources, A.F.N.; formal analysis, C.E.K. and J.M.P.; investigation, C.E.K. and J.M.P.; data curation, C.E.K.; writing—original draft preparation, C.E.K.; writing—review and editing, A.F.N., J.M.P., J.L.S. and G.B.F.; funding acquisition, J.M.P. All authors have read and agreed to the published version of the manuscript.

Funding

Alabama Department of Agriculture and Industries Specialty Crop Block Grant.

Acknowledgments

The authors wish to thank Raymond Kessler for advice concerning data analysis.

Conflicts of Interest

The authors declare no conflict of interest.

References

  1. Biernbaum, J.A. Root-zone management of greenhouse container-grown crops to control water and fertilizer. Hortic. Tech. 1992, 2, 127–132. [Google Scholar] [CrossRef]
  2. Howarth, R.W. Nutrient limitation of net primary production in marine ecosystems. Ann. Rev. Ecol. 1988, 19, 89–110. [Google Scholar] [CrossRef]
  3. Kabashima, J.N. Innovative irrigation techniques in nursery production to reduce water usage. Hortic. Sci. 1993, 28, 291–293. [Google Scholar] [CrossRef] [Green Version]
  4. Adams, C.; Frantz, J.; Bugbee, B. Macro-and micronutrient-release characteristics of three polymer-coated fertilizers: Theory and measurements. J. Plant Nutr. Soil Sci. 2013, 176, 76–88. [Google Scholar] [CrossRef]
  5. Kochba, M.; Gambash, S.; Avnimelech, Y. Studies on slow release fertilizers: 1. Effects of temperature, soil moisture, and water vapor pressure. Soil Sci. 1990, 149, 339–343. [Google Scholar] [CrossRef]
  6. Rathier, T.M.; Frink, C.R. Nitrate in runoff water from container grown juniper and Alberta spruce under different irrigation and N fertilization. J. Environ. Hortic. 1989, 7, 32–35. [Google Scholar]
  7. Bayer, A.; Ruter, J.; van Iersel, M.W. Optimizing irrigation and fertilization of Gardenia jasminoides for good growth and minimal leaching. Hortic. Sci. 2015, 50, 994–1001. [Google Scholar] [CrossRef] [Green Version]
  8. Million, J.B.; Yeager, T.H. Periodic versus real-time adjustment of a leaching fraction-based container-grown plants. Hortic. Sci. 2020, 55, 83–88. [Google Scholar] [CrossRef] [Green Version]
  9. Chappell, M.; Dove, S.K.; van Iersel, M.W.; Thomas, P.A.; Ruter, J. Implementation of wireless sensor networks for irrigation control in three container nurseries. Hortic. Tech. 2013, 23, 747–753. [Google Scholar] [CrossRef] [Green Version]
  10. Stanley, J. Using leaching fractions to maximize irrigation efficiency©. Proc. Int. Plant Propag. Soc. 2012, 62, 331–334. [Google Scholar] [CrossRef]
  11. Owen, J.S., Jr.; Warren, S.L.; Bilderback, T.E.; Albano, J.P. Phosphorus rate, leaching fraction, and substrate influence on influent quantity, effluent nutrient content, and response of a containerized woody ornamental crop. Hortic. Sci. 2008, 43, 906–912. [Google Scholar] [CrossRef] [Green Version]
  12. Tyler, H.H.; Warren, S.L.; Bilderback, T.E. Reduced leaching fractions improve irrigation use efficiency and nutrient efficacy. J. Environ. Hortic. 1996, 14, 199–204. [Google Scholar]
  13. Prehn, A.E.; Owen, J.S., Jr.; Warren, S.L.; Bilderback, T.E.; Albano, J.P. Comparison of water management in container-grown nursery crops using leaching fraction or weight-based on demand irrigation control. J. Environ. Hortic. 2010, 28, 117–123. [Google Scholar]
  14. Du, C.W.; Zhou, J.M.; Shaviv, A. Release characteristics of nutrients from polymer-coated compound controlled release fertilizers. J. Polym. Environ. 2006, 14, 223–230. [Google Scholar] [CrossRef]
  15. Owens, J.S., Jr.; LeBude, A.V.; Chappell, M.; Hoskins, T. Advanced Irrigation Management for Container-Grown Ornamental Crop Production. Available online: http://digitalpubs.ext.vt.edu/vcedigitalpubs/3312473486515986/MobilePagedReplica.action?pm=2&folio=1#pg1 (accessed on 10 August 2018).
Figure 1. Regression of average electrical conductivity of leaching fraction (LF) over ten weeks.
Horticulturae 06 00043 g001
Table 1. N, P, and K in leaching fractions (LF) and retained in pine bark substrate over ten weeks.
Nitrogen LFLeached from Pot (mg)Left in Pot (mg)
0.05102c z583a
0.15135bc547ab
0.25153bc534ab
0.35213ab472bc
0.45205ab476bc
0.55270a422c
Significance y L ***Q ***
Phosphorus
0.0512b89a
0.1516b84ab
0.2518b82ab
0.3527ab73bc
0.4523b76ab
0.5539a61c
Significance L ***Q ***
Potassium
0.05193d386a
0.15215d375a
0.25241cd353ab
0.35305bc284bc
0.45347b240c
0.55460a136d
Significance Q ***Q ***
z Tukey’s HSD test for means comparison (lowercase letters in columns by nutrient) using JMP® by SAS (SAS Institute Inc., Cary, NC, USA). y Significant quadratic (Q) or linear (L) trends using regression models at p < 0.001 (***).
Table 2. Ca, Mg, SO4-S, and micronutrients in leaching fractions (LF) y over ten weeks and retained in pine bark substrate.
Leached from Pot (mg)
LF0.050.150.250.350.450.55
Calcium92.3d z120.7d135.3cd179.0cd189.8b260.5a
Magnesium43.8d55.1d61.8cd79.8bc85.6b117.4a
SO4-Sulfur66.0c79.2c88.9cd119.5b127.4b188.1a
Iron0.5bc0.4c0.7bc1.0b0.9b1.5a
Manganese0.1b0.1b0.2b0.2b0.2b0.4a
Boron0.0ab0.0b0.0b0.0a0.0ab0.0a
Copper0.1bc0.1c0.2bc0.3ab0.2bc0.4a
Zinc1.1bc0.9c1.2bc1.8ab1.8ab2.3ab
Molybdenum0.0ab0.0a0.0a0.0a0.0a0.0a
Sodium18.2e22.3de25.8d35.6c44.8b66.7a
Aluminum0.1d0.1d0.2cd0.2cd0.2ab0.2ab
Silicon5.7c6.7c7.6bc9.7b12.9a14.7a
Left in Pot (mg)
LF0.050.150.250.350.450.55
Calcium−92.3 ya−120.7a−136.3ab−179.9bc−190.4c−260.1d
Magnesium−58.9a−70.5a−80.0ab−98.1bc−104.6b−134.6a
SO4-Sulfur109.8a95.7a78.7ab47.9bc37.2c−16.2d
Iron6.9a6.9a6.6ab6.3b6.4b5.8c
Manganese3.5a3.4ab3.2bc3.2cd3.2c2.9d
Boron0.0ab0.0a0.0ab0.0b0.0ab0.0b
Copper3.5a3.5a3.4a3.3ab3.4ab3.2b
Zinc2.4ab2.7a2.3ab1.8bc1.7bc1.3c
Molybdenum0.1a0.1a0.1a0.0ab0.1a0.1a
Sodium−6.1a−10.0ab−13.6bc−22.9cd−31.8d−53.5e
Aluminum0.0ab−0.1ab−0.1bc−0.2cd−0.2d−0.3e
Silicon−5.7a−6.7a−7.6ab−9.7b−12.9c−14.7c
z,x Means comparison between LF (lowercase letters in rows by nutrient) using the proc glimmix procedure and Tukey’s HSD test of means comparison, SAS® University Edition (SAS Institute Inc., Cary, NC, USA). y Discrepancies (negative values) in leached Ca, Mg, Na, and Si likely due to the addition of dolomitic lime, the breakdown of substrate, or the addition of nutrients through irrigation water.
Table 3. Comparison z of leaching fraction (LF) electrical conductivity (µS/cm) y over ten weeks.
Target LF
Weeks0.050.150.250.350.450.55Significancex
1582.6370.1437.1507.9337.1480.3ns
2619.0667.0634.1583.0608.5516.0ns
3669.3780.8668.3736.0618.1669.8ns
4757.2991.9936.71000.8906.01053.6ns
51505.61438.31331.41269.0926.7939.6L **
61481.01519.01562.31048.0905.0792.3L ***
71333.31602.31415.51334.8938.5739.3Q *
81648.51562.01541.01544.81195.51093.8L ***
92023.01806.81698.31460.01247.31037.0L ***
102084.01823.31822.81642.51277.5917.5Q *
SignificanceL ***Q *L ***L ***L ***Q *
z Analyzed using the proc glimmix procedure in SAS® University Edition (SAS Institute Inc., Cary, NC, USA). y µS/cm = Microsiemens per cm; 1 µS/cm = 0.001 S/m. x Significant or nonsignificant (ns) quadratic (Q) or linear (L) trends using regression models at p < 0.001 (***), p < 0.01 (**), and p < 0.05 (*).
Table 4. Comparison of leaching fraction (LF) pH over ten weeks.
Target LF
Weeks0.050.150.250.350.450.55Significance z
16.556.826.666.626.706.47Q *
26.876.976.946.906.906.94ns
36.706.826.806.696.806.77ns
46.726.776.766.666.716.55ns
56.396.416.426.366.556.47ns
66.215.855.805.976.086.17Q ***
75.715.675.685.735.886.06Q *
86.315.905.835.815.986.06Q ***
95.685.405.395.355.675.82Q ***
105.705.415.305.335.515.73Q ***
SignificanceL ***L ***L ***L ***L ***L ***
z Analyzed using the proc glimmix procedure in SAS® University Edition (SAS Institute Inc., Cary, NC, USA). Significant or nonsignificant (ns) quadratic (Q) or linear (L) trends using regression models at p < 0.001 (***) and p < 0.05 (*).
Table 5. pH and electrical conductivity (µS/cm) of fertilizer remaining in mesh bags after ten weeks.
LFpHEC (µS/cm) z
0.056.0b z805.0a
0.156.3ab715.0ab
0.256.4a620.0b
0.356.4a645.0b
0.456.4a652.5b
0.556.4ab622.5b
Sign. xQ **Q **
z µS/cm = Microsiemens per cm; 1 µS/cm = 0.001 S/m. y Tukey’s HSD test for means comparison (lowercase letters in columns) using SAS® University Edition (SAS Institute Inc., Cary, NC, USA). x Significance (Sign.) quadratic (Q) trends using regression models at p < 0.01 (**).
Table 6. N, P, and K loss from fertilizer and remaining in fertilizer after ten weeks in leaching fraction (LF).
Nitrogen LFFertilizer Loss (mg) zRemaining in Fertilizer (mg)
0.05685.2ns y119.2ns
0.15682.1 122.3
0.25687.5 116.9
0.35684.5 119.9
0.45681.7 122.7
0.55691.6 112.8
Phosphorus
0.05101.8ns31.2ns
0.1599.9 33.1
0.25100.5 32.5
0.3599.9 33.1
0.4599.7 33.3
0.55100.8 32.2
Potassium
0.05578.6ns170.4ns
0.15590.8 158.2
0.25593.8 155.2
0.35589.1 159.9
0.45586.3 162.7
0.55595.3 153.7
z Loss from fertilizer = initial fertilizer in satchel - remaining fertilizer in satchel. y Means comparison between LFs (lowercase letters in columns by nutrient) using Tukey’s HSD test using JMP® by SAS (SAS Institute Inc., Cary, NC, USA).

